1 . INTRODUCTION
From ancient times, rural people have occasionally migrated in search of food, clothing and shelter. These movements have been shaped by various geographical, socio-economic and cultural factors. A large number of people from West Bengal live in rural areas, and most of them are directly or indirectly depended on agriculture. However, as it has been widely reported, agriculture is becoming highly unsustainable in many parts of the country leading to a situation of agrarian crisis. Therefore, rural farmers bereft any other alternative options are increasingly adopting migration as their livelihood strategy. Out-migration from poorly developed agricultural areas among the landless farmers has a long history (Parganiha et al., 2009). Panda (2016) found that the proportion of out-migration is higher among the landless and marginal farmer compared to the large farmer. Out-migration is a cabalistic livelihood strategy which received landless agricultural labors and poor rural people (Keshri and Bhagat, 2012; Breman, 1996; Haberfeld et al., 1991). Deshingkar et al. (2006) argued that more than 50 per cent of landless households have at least one migrant in Bihar. Parganiha et al. (2009) pointed out that out-migration is greater in the poorly developed agricultural areas and particularly high among the landless farmers. Dodda et al. (2016) found that landless and marginal households are more likely to migrate compared to large households. Roy (1991) argued that landless households want to increase a better standard of living by out-migration.
Haan and Rogaly (1994), Rogaly (1998), Rogaly et al. (2001, 2002), Rogaly and Coppard (2003), Rogaly and Rafique (2003) did extensive work on seasonal out-migration of Rarh region of West Bengal. They found that during the 1990s, a large volume of migrants came to Barddhaman and its surrounding areas during paddy and potato seasons. Rogaly et al. (2002) noticed that rural people migrated towards Pube Jawa (going east) with men, women, young children, with different social groups by foot or bus. It was found that the Rarh region in general and the Bankura district, in particular, have experienced an exceedingly high rate of out-migration (Debnath, 2017). Although it may not very high from an Indian perspective but 7-8 % out-migration from this particular district is of great concern compared to the other districts of the region. Haan (1995) mentioned that the western part of the Bankura district is comparatively poor and a region of the surplus of labor. Rogaly et al. (2001) noticed that the Western part of Bankura is drought-prone and they are migrated to East. Given the reality and the fact that this is the region which suffers from recurrent drought may be a fertile area for investigation of the nature, extent and process of rural out-migration particularly among the small, marginal and landless households. In this context, the present study tries to identify the destination areas of rural male out-migration. The study also examines the factors controlling migrants in visiting their native village.
2 . MATERIALS AND METHODS
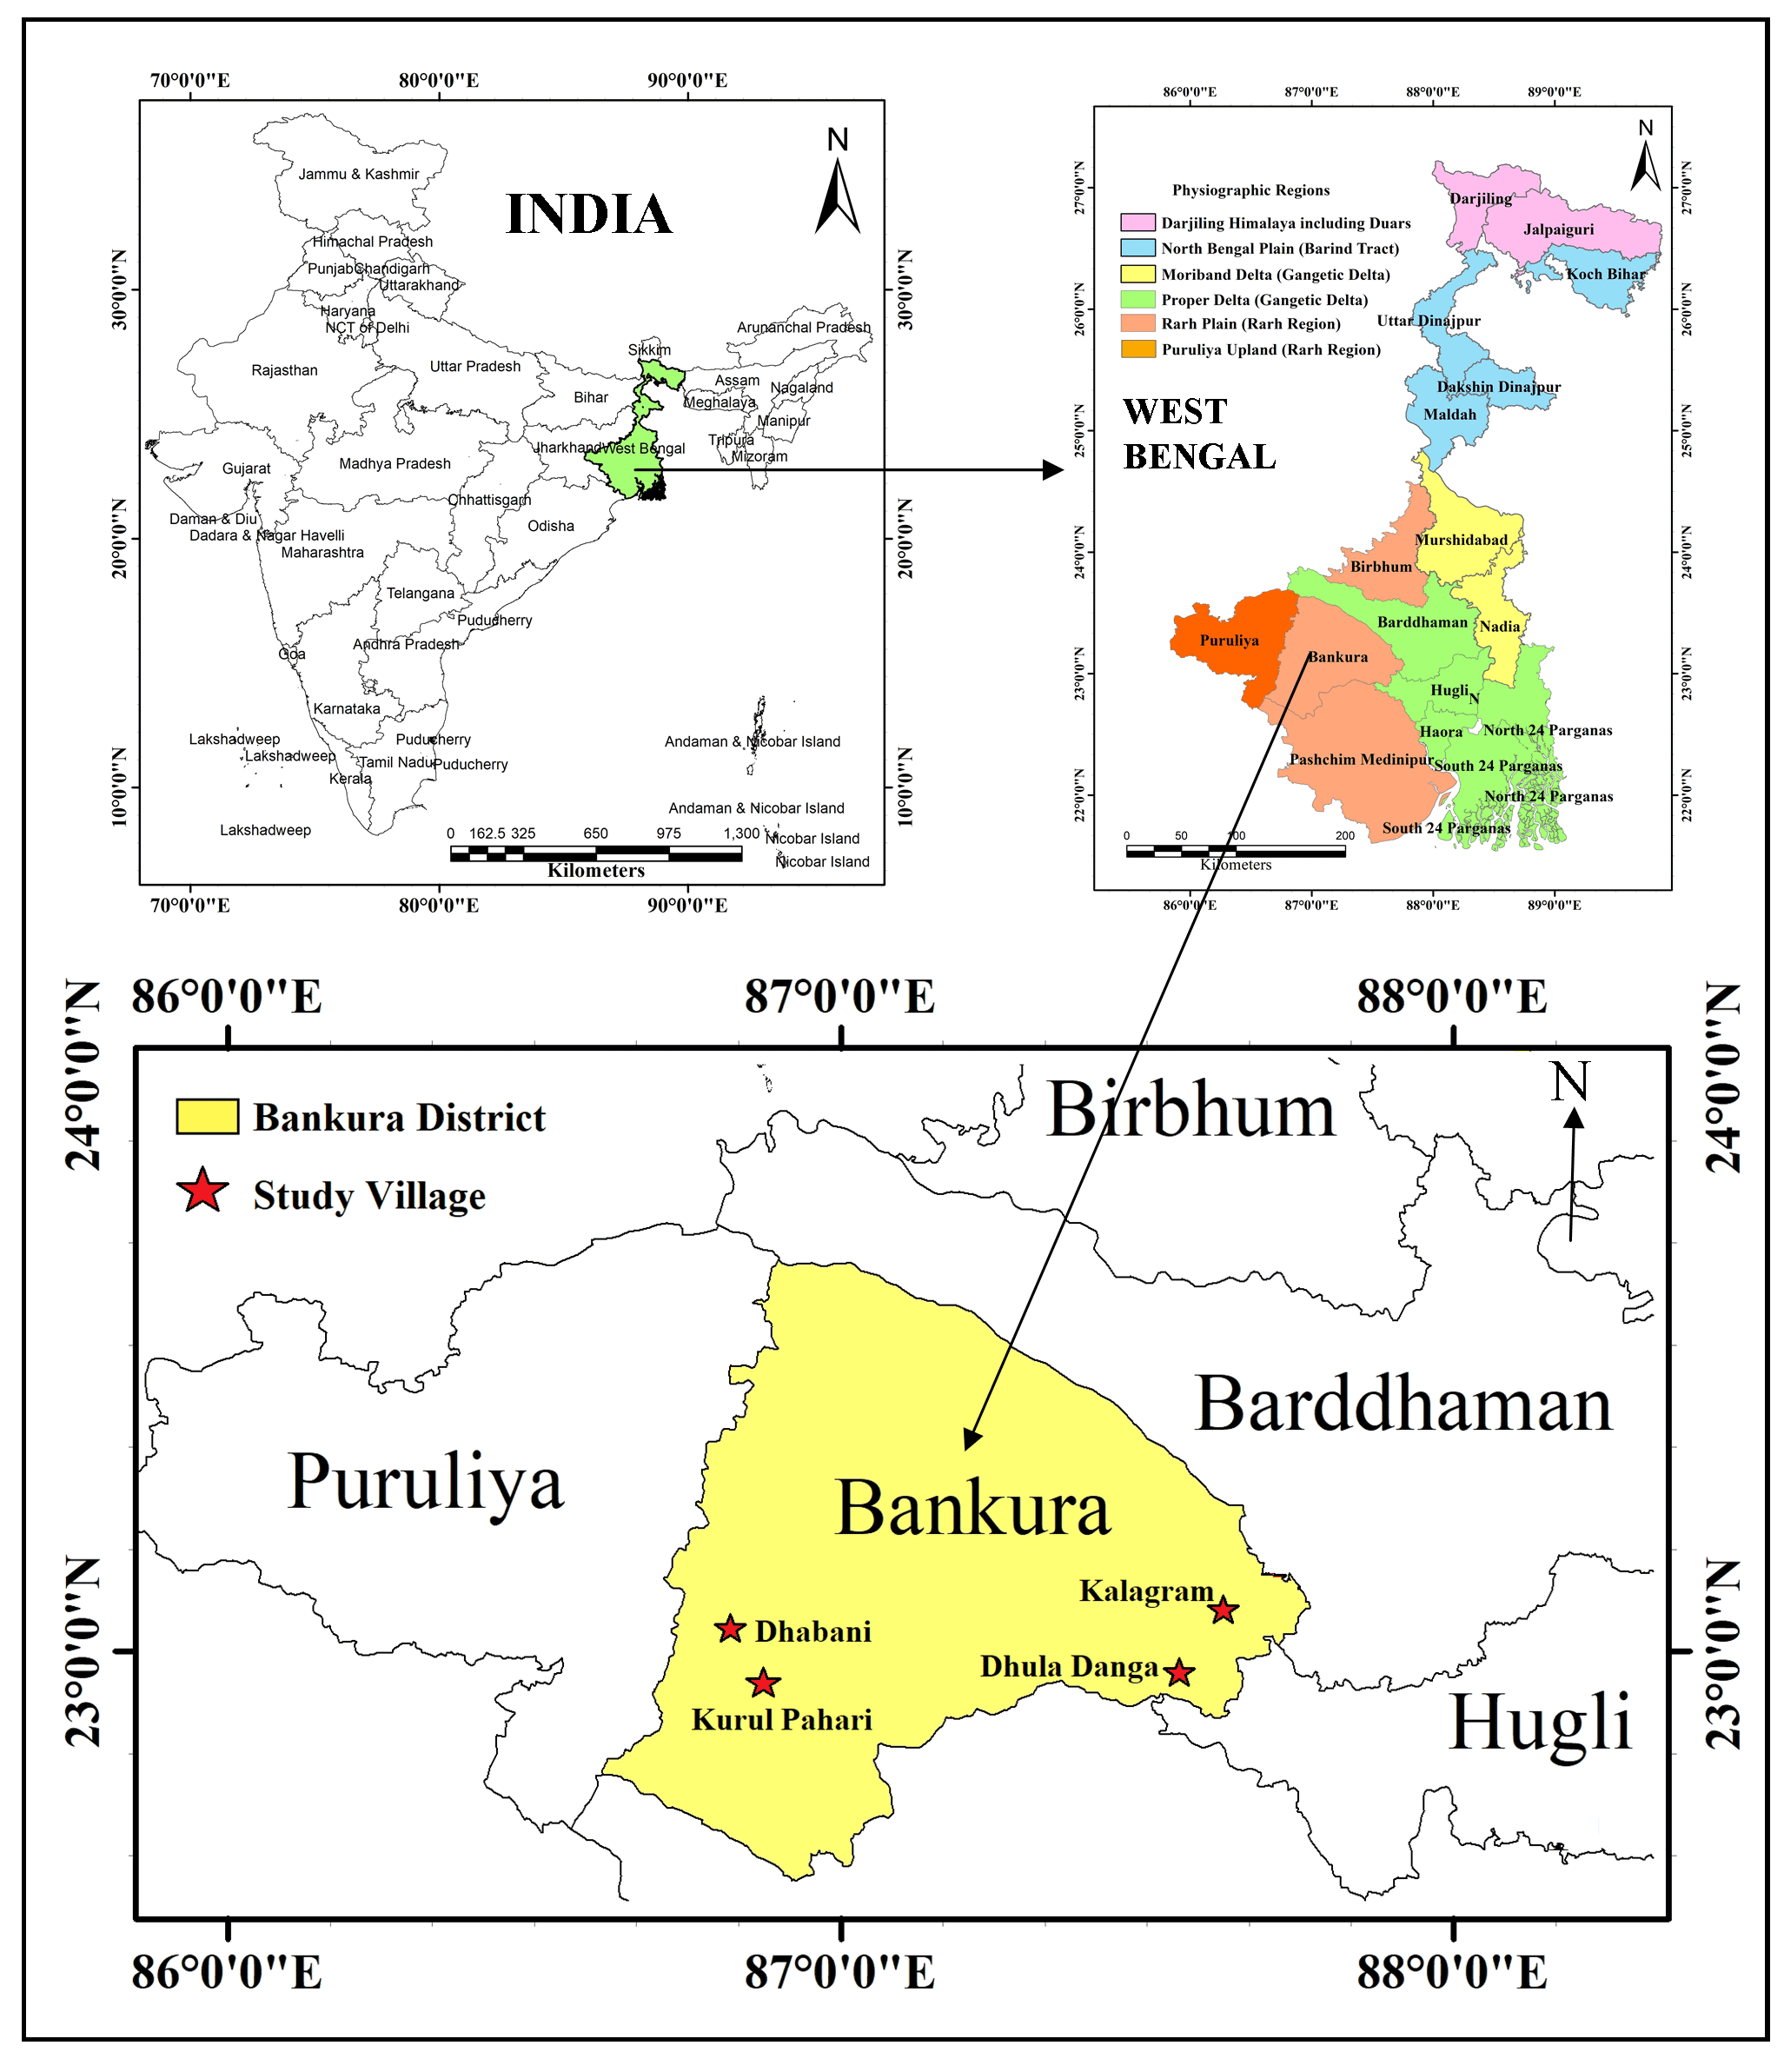
The present research is based on a primary household survey where the information about nature, extent and process of rural out-migration has been collected with the help of a structured questionnaire. General information about the villages has been collected with the help of village schedules. To assess the rural out-migration at the household level, the landholding size of households have been divided into three categories i.e. landless households, marginal landholding (less than 1 hectare) and small landholding (1.0 to 2.0 hectares). Types of rural out-migration have been classified into two categories i.e. internal migration and international migration. Internal migration again sub-divided into three categories i.e. intra-district, inter-district and inter-state. Migration streams have been classified into two categories i.e. rural to rural and rural to urban. Rural male out-migration at the city level has been classified into different cities. Source of information before migration have been categorized into following i.e. employers, private employment agency, newspapers, information by relatives, information by friends, middleman and others. Nature of work at the destination has been classified into five categories i.e. regular basis, seasonal basis, casual basis, daily basis and others. Working hours of migrants at the destination have been classified into seven categories i.e. below 8 hours, 8 hours, 9 hours, 10 hours, 11 hours, 12 hours and above 12 hours. Linkages with native places of rural out-migrants have been studied as the frequency of visit to the native place, the purpose of visit and time spent at the native place. Frequency of visiting native village has been classified into six groups i.e. regular, once in a month, once in a three months, once in a six months, once in a year and rarely visiting. Time spent at the native village has been classified into three categories i.e. few days, few weeks and over a month. Purpose of visiting native village has been classified into five purposes i.e. meet with family, during the short agricultural season, an inspection of properties, social ceremony and other purposes. Purposive sampling used to select Bankura district for the present study because it is the highest out-migration district in West Bengal. Stratified sampling technique has been used to divide Bankura district into two regions i.e. the western drought-affected region and eastern non-drought-affected region. Before going to the selection of sample villages, a pilot survey carried out to know nature, extension and intensity of out-migration at the study areas in Bankura. Two villages have been randomly selected from each region of the district. The selected villages are Kurul Pahari and Dhabani from western drought-affected region whereas Patan and Kalagram are from the eastern non-drought-affected region (Figure 1). The field survey was carried out during March-April, 2019. Out of 426 total households at four study villages 116 migrant households selected randomly. For the purpose of the whole enquiry, households from each village have been selected randomly on the basis of the size of landholdings and persons stayed outside of the village for at least a period of 3-6 months.
Migration is the result of several economic, social and demographic factors which has great impact on rural male out-migration. The independent variables are selected on the basis of present investigation, similar past studies and from the existing literature (Yang, 1992; Haberfeld, et al., 1999; Yang and Guo, 1999; Mendola, 2006; Keshri and Bhagat, 2010; Sridhar et al., 2012; Piotrowski et al., 2013; Coffey et al., 2014; Shonchoy, 2015). Here, binary logistic regression model has been fitted to analysis the effect of determinant factors on rural male-out-migration in the study area. To study the effects of socio-economic characteristics on the rural male out migration in the study area, the working age group of male population (15 to 65 years) taken as consideration. The probabilities of male out migration was coded in a binary form, the dependent variable considered as value “1” if rural male out-migrated and “0” if not migrated. The total sample has taken 441 adult male (15 to 65years), among of this 245 person who are migrated and 196 not migrated. The independent variables which are taken as consideration, all are categorical form. Age group is the important parameter to determine the intensity of male outmigration (Connel et al., 1976; Russel and Strachan, 1980; Singh, 1997). Rural male-out-migration still effects by the rural caste system in India (Panda, 1986; Haberfeld et al., 1999; Singh, 1997; Mosse et al., 2005; Shonchoy and Junankar, 2014). Level of education is an important parameter of socio-economic development that closely associated with of rural male out-migration (Yang, 1992; Agarwal, 1998; Gupta and Prajapati, 1998; Kumar et al., 1998; Sidhu and Rangi, 1998). There is a close correlation between landholding sizes and out-migration. Landlessness is the primary economic of male out-migration in rural areas (Connell et al., 1976; Roy, 1991; Sidhu et al., 1997; Kumar et al., 1998; Parganiha et al., 2009). Temporary or seasonal male-out-migration is mainly working base (Yang and Guo, 1999; Keshri and Bhagat, 2010). Lastly, but not the least, poverty level has been classified in to above poverty level and below poverty level according to the access of public distribution system (PDS).factor
3 . RESULTS AND DISCUSSIONS
3.1 Regional Pattern
From 19th century onwards, Eastern India, especially, West Bengal had attracted huge in-migration from different states of India. Likewise, out-migration from the state to different parts of the country also has a long record. Bankura district, typically represented as the most backward, has been selected as the study area because of its highest out-migration record in the state. The Western high land i.e. Western part of the district is under the drought-affected area (DDMP, 2016). Kurul Pahari and Dhabani villages are located in this part. Patan and Kalagram villages are located in the Eastern Alluvial plain region which is normally devoid of drought condition. Role of geographical variations and the effect of drought on rural male out-migration is analyzed here. The level of out-migration is highest at Kurul Pahari village from where at least one out-migrant has been found in 46.55 % household. Dhabani village has experienced 37.98% male-out-migration. On the other hand, Patan and Kalagram villages from Eastern Alluvial Plain have experienced a lower rate of out-migration i.e. 26.23% and 18.90%, respectively. Size of landholdings and the rate of male-out-migration have been found to be inversely related. Smaller is the landholding, higher is the male-out-migration and vice versa. Patan and Kalagram villages experienced a higher rate of out-migration at the marginal household level. This trend is common for both the drought-affected Kurul Pahari and Dhabani villages as well as and non-drought affected Kalagram and Patan villages of the district (Table 1). Patan and Kalagram villages experienced a higher rate of outmigration at the marginal household level. These villages are fertile and agricultural prosperous. The head of the household mentioned that young male is not attentive to agricultural work. People are forced to move out of the village for work because the opportunities for non-agricultural work in the village are low. Among the total male-out-migrants at Patan village, 50 % experienced at the marginal household level, 43.75 % at the landless household level and 6.25 % at small household level, respectively. Similarly, Kalagram village showed 47.92% male-outmigration at the marginal household level, 39.58 % at landless household and 12.50 % at small household level, respectively. Villages situated in drought-affected areas experienced a higher proportion of out-migration. Landless households depict a high rate of male-out-migration. In the drought-affected region of Kurul Pahari village, 59.26 % out-migration has seen from landless households and 29.58 % from marginal households. Similarly, landless households of Dhabani village experienced the highest rate of male out-migration (60 %) compared to marginal households (30 %).
Table 1. Rural out-migration
|
Out-migrants
|
Villages
|
Total
|
|
Patan
|
Kalagram
|
Kurul Pahari
|
Dhabani
|
|
HHs level rural male out-migration (%)
|
|
|
|
|
|
|
|
Total number of rural male
|
153
|
497
|
142
|
181
|
973
|
|
|
Total number of rural male migrants
|
26
|
56
|
33
|
44
|
159
|
|
|
Rural male migration rate (%)
|
16.99
|
11.27
|
23.24
|
24.31
|
16.34
|
|
HHs level number of male out-migrants (%)
|
|
|
|
|
|
|
|
HHs having at least 1 migrant
|
30.77
|
71.43
|
66.67
|
38.64
|
51.89
|
|
|
HHs having 2 migrants
|
46.15
|
28.57
|
24.24
|
54.55
|
38.36
|
|
|
HHs having 3 migrants
|
23.08
|
00.00
|
9.09
|
6.82
|
9.75
|
|
|
HHs having more than 3 migrants
|
00.00
|
00.00
|
00.00
|
00.00
|
00.00
|
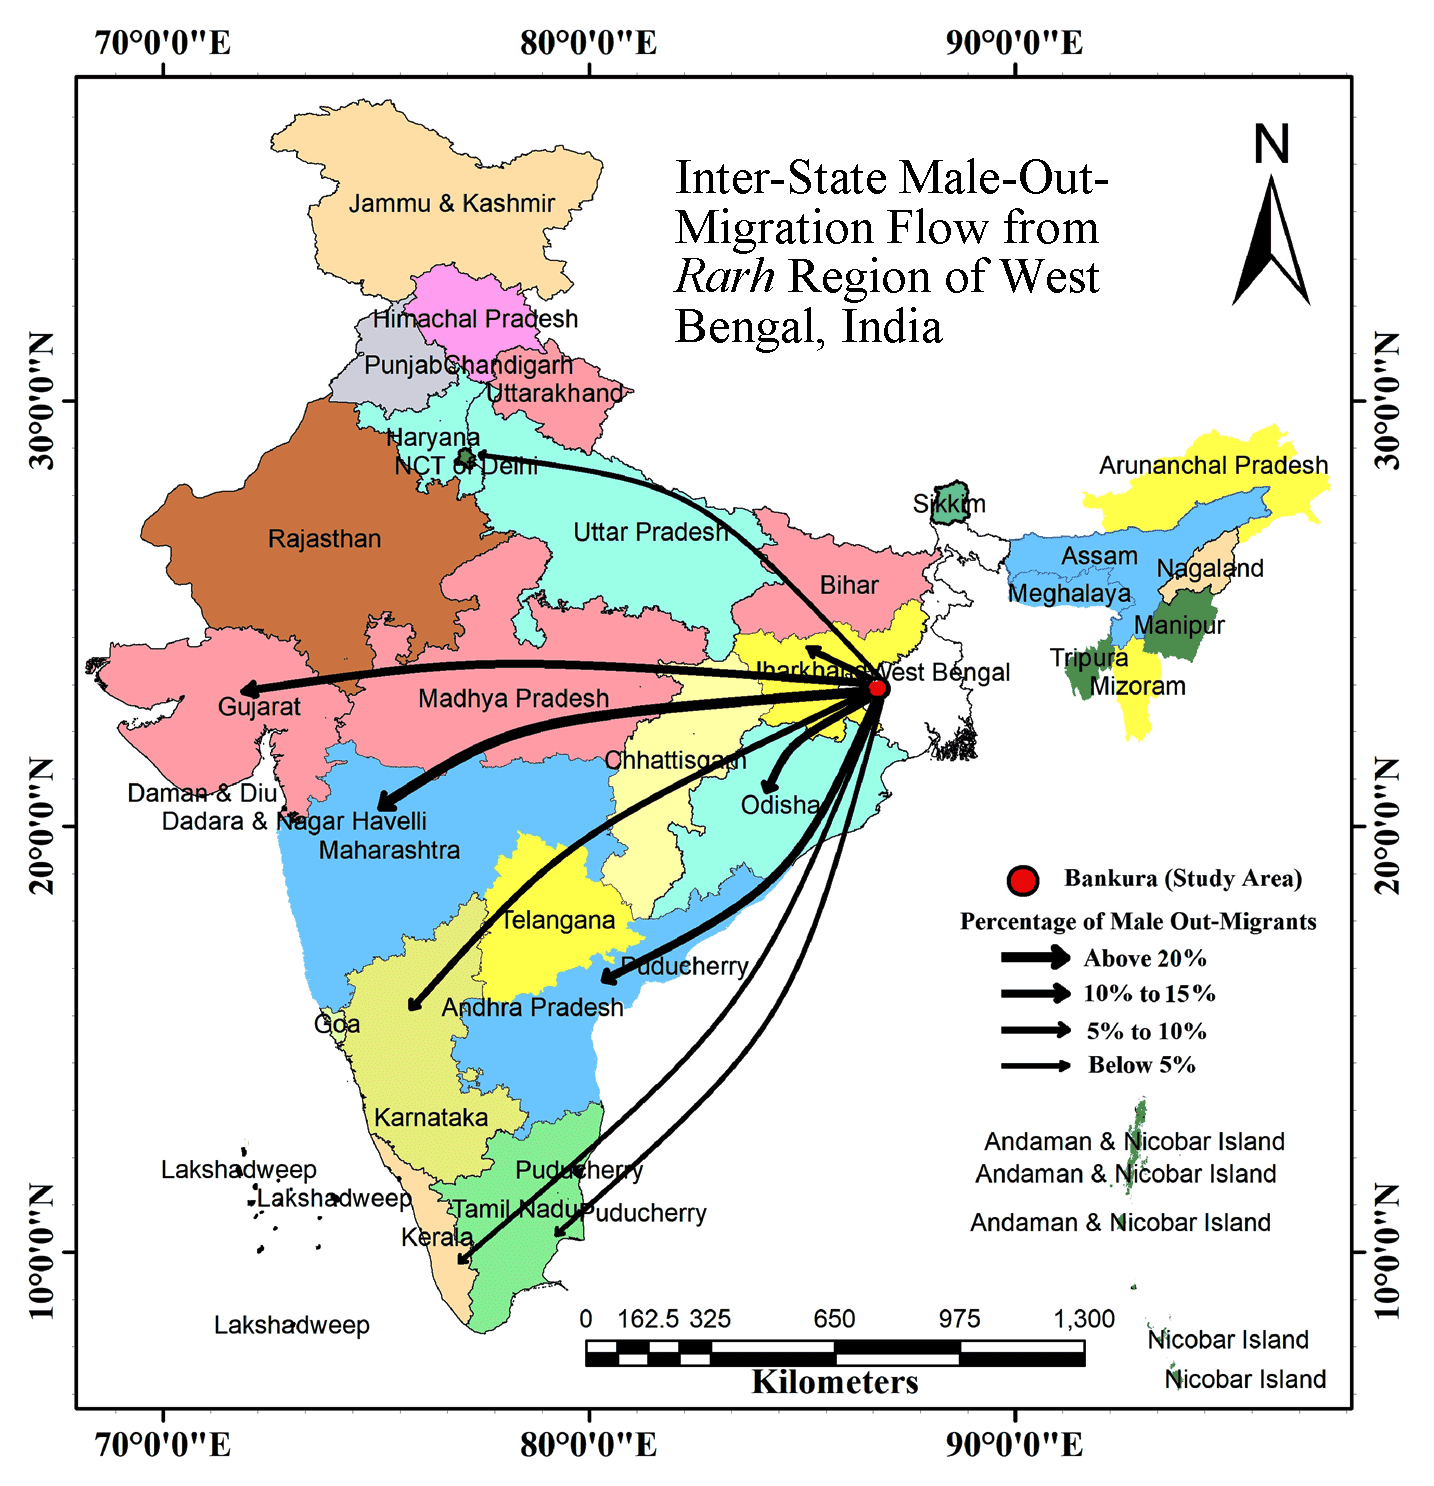
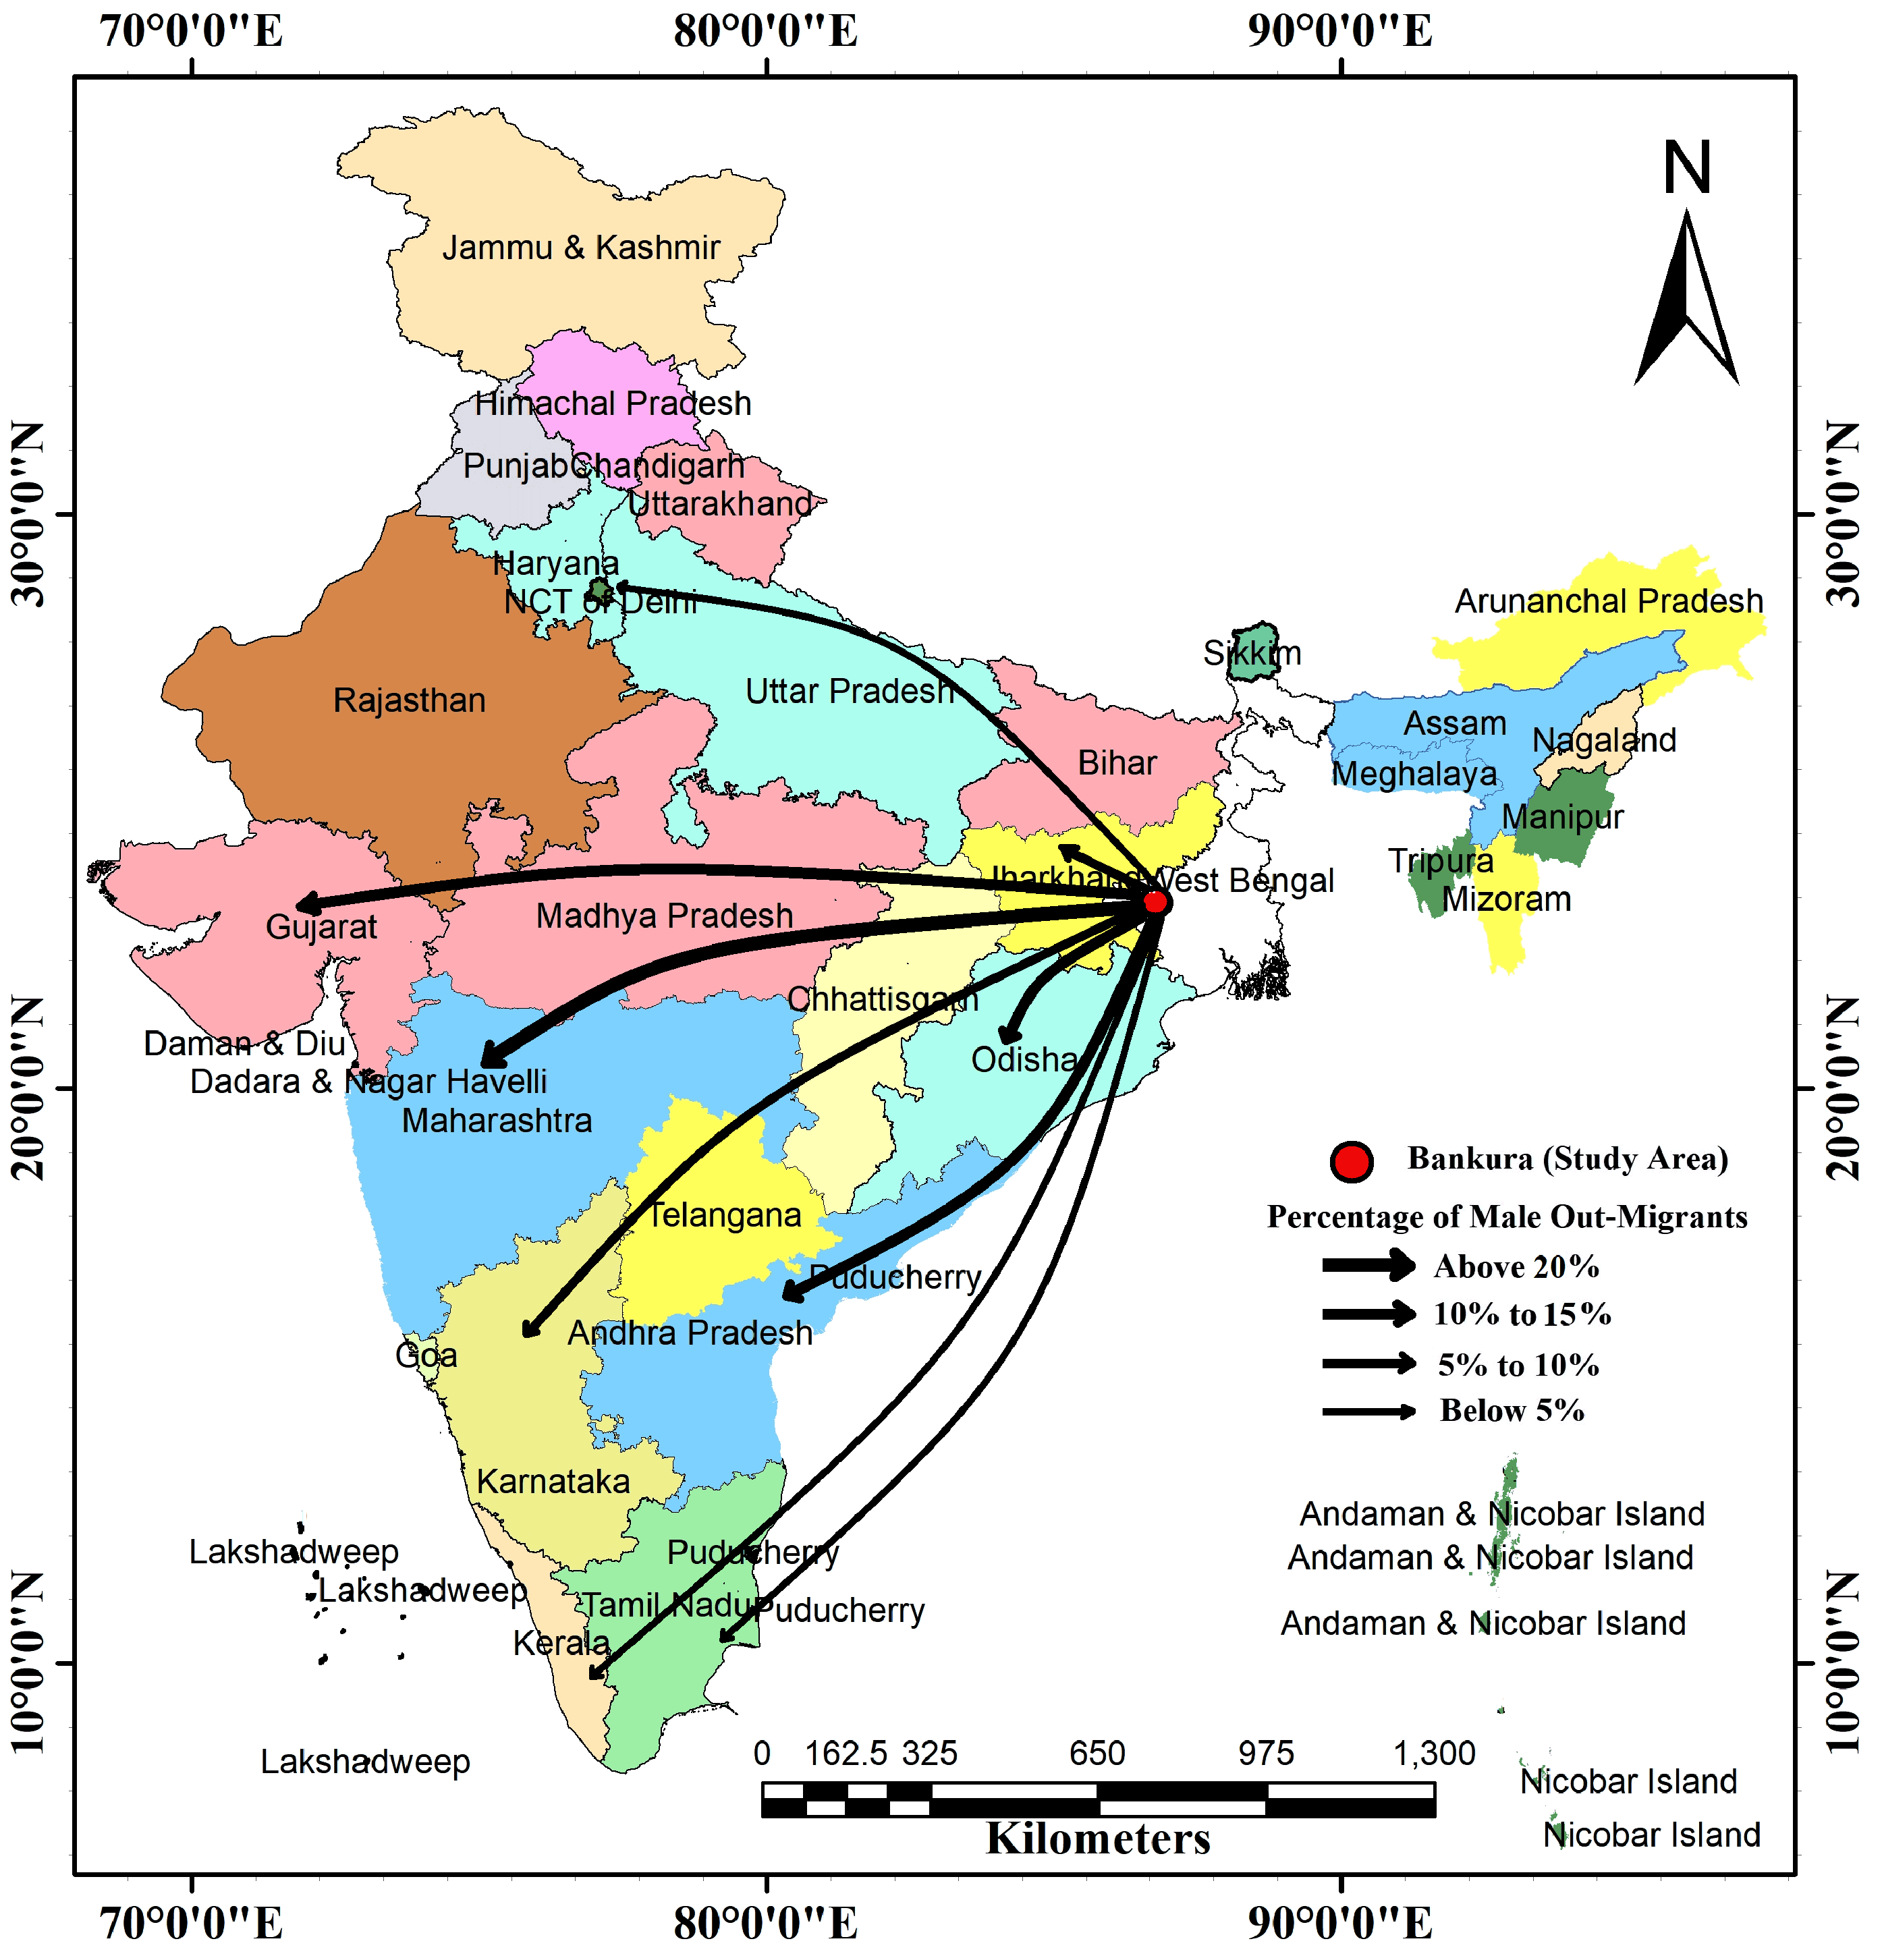
The higher proportion of male-out-migration of Kurul Pahari and Dhabani villages is related to the agricultural backwardness. Here, agriculture is primarily depended on rainfall due to lack of irrigation facility. There is no farming activity in the village for the rest of the year except monsoon paddy cultivation. Moreover undulating plateau surface, relatively drier climate, limited crop production, crop failure, lack of industrial development and unemployment are the major factors which forced male people to move to other regions for searching of work/job facility and better life. Males generally migrate for work and they move to economically and industrially developed region (Sengupta and Ghosal, 2011; Rogaly, 1998). Oberai and Singh (1980) have stated that in rural-urban migration, males generally outnumber females as they enjoy greater freedom to move away from the village. Inter-district and inter-state rural out-migration from Bankura district also depicts this picture (Figure 2). Among the three types of movement, inter-state out-migration is the highest (54.09%) whereas intra-district out-migration is the lowest (3.77%) from general all household perspective. On a specific level, intra-district level migration is the highest among marginal households (5.97%). On the contrary, inter-district level migration is recorded the highest among the small households (58.82%). Movement of landless people is highest at the inter-state level migration (60%). Only a few numbers of males are migrated at the international level and they are mainly migrated to Dubai. It is also interesting to see that male-out-migration from the selected villages is predominantly urban centers oriented. Out of total out-migrants, about 80 % move towards the urban areas and the source of these people are basically marginal and small landholding households. In the case of inter-state rural out-migration, female domination is found over a short distance, likely to be marriage related while male occasionally moves for long distance for work (Piotrowski et al., 2013). Table 2 reveals that Maharashtra receives the highest proportion of male-out-migrants from Patan village (58.82%). Kalagram village is the source of out-migrants to Gujarat (51.51%). Odisha received the highest proportion (44.44%) of male migrants from Dhabani village. These movements indicate that economically and industrially developed states are regarded as destination centers for migration over distance though they are located far away from West Bengal (Debnath, 2017). Stouffer (1940) suggested that the number of persons who want to go a given distance is directly proportional to the number of opportunities at that distance and inversely proportional to the number of intervening opportunities. Actually, the place of destination depends on distance and migration, distance and cost, distance and choice, distance and information, distance and communication, urbanization and time (Connell et al., 1976). At the inter-district level the highest proportion of male migrants is received by Barddhaman and Kolkata districts. Barddhaman district received the highest male migrants from Kalagram (47.37 %) and Patan (42.86 %) village. Kurul Pahari and Dhabani village send above 90 % male migrants to Kolkata. Barddhaman district is relatively more developed in agriculture and industry which provide employment opportunities for the migrants. Kolkata is more urbanized and industrialized with the location of Kolkata metropolitan area attracts a large proportion of rural male migrants from the other regions of the state. Out of total rural male-out-migrants, Kolkata metropolitan city has received the highest (51.65%) followed by Hyderabad (10.99%), Mumbai (13.19%), Bengaluru (5.49%) etc. Huge job opportunities in different tertiary sectors, industries and urban informal sectors in Kolkata have traditionally attracted people from Bankura district.
Table 2. Major migration destination regions
|
Destination regions
|
Origin (villages)
|
|
Patan
|
Kalagram
|
Kurul Pahari
|
Dhabani
|
Total
|
|
Inter-state level migration (%)
|
|
|
|
|
|
|
|
Gujarat
|
11.76
|
51.51
|
00.00
|
00.00
|
15.82
|
|
Maharashtra
|
58.82
|
06.06
|
27.78
|
00.00
|
23.17
|
|
Odisha
|
00.00
|
15.15
|
00.00
|
44.44
|
15.00
|
|
Andhra Pradesh
|
00.00
|
03.03
|
44.44
|
16.67
|
15.78
|
|
Jharkhand
|
00.00
|
00.00
|
16.67
|
11.11
|
06.95
|
|
Karnataka
|
00.00
|
06.06
|
00.00
|
16.67
|
05.68
|
|
Kerala
|
11.76
|
00.00
|
00.00
|
00.00
|
02.94
|
|
Tamil Nadu
|
05.88
|
00.00
|
00.00
|
11.11
|
04.25
|
|
Delhi
|
00.00
|
09.09
|
00.00
|
00.00
|
02.27
|
|
Others
|
11.76
|
09.09
|
11.11
|
00.00
|
07.99
|
|
Intra-state level migration (%)
|
|
|
|
|
|
|
|
Kolkata
|
28.57
|
42.11
|
90.91
|
100.00
|
65.39
|
|
Barddhaman
|
42.86
|
47.37
|
00.00
|
000.00
|
22.56
|
|
Others
|
28.57
|
10.72
|
09.09
|
000.00
|
12.05
|
3.2 Mechanism of Rural Out-Migration
The processes of migration are generally initiated with some prior information of destination place. Connell et al. (1976) found that the place of destination depends on distance and information, distance and communication. Premi (1976) mentioned that the source of information about the job opportunities at the destination help migrants for beginning their settlement. Information about these job opportunities is provided by their friends, relatives, employment agency and middlemen. Table 3 shows that 86.79 per cent male-out-migrants of the selected villages had prior information about job opportunities. Social networks and informal connections help them to get that information. Among these sources, information by friends is the most important one. They have provided information to more than 30-40% out-migrants. Middleman and information by relatives are the second and third important sources of information. About one-fourth of rural male-out-migrants (25.79%) got their job through a middleman whereas 16.98 % got their job by relatives at the destination. Private employment agency also has given job-related information to the marginal households (19.40%). The regularity of a job is an important factor which constantly drives people to move to a certain place. Among all the migrants, a huge number of male (71.71%) work on a regular basis followed by daily (18.24%), casual (8.81%), seasonal (0.63%) and other (0.63%) workers. Beside the regularity of available jobs, working hour is also an important dimension of the migrants. Though eight hours per day is considered as a standard working hour in India, but half of the total rural male migrants (55.98%) are found to be worked for more than that while 42.77 % work eight hours daily. This voluntary overtime is for earning higher remittance.
Table 3. Source of information received before migration
|
Source of information
|
All HHs
|
Landless
|
Marginal
|
Small
|
|
Migrant received information before migration (%)
|
86.79
|
85.33
|
88.06
|
88.24
|
|
Migrant didn’t received information before migration (%)
|
13.21
|
14.67
|
11.94
|
11.76
|
|
Different source of migration (%)
|
|
|
|
|
|
|
Employers
|
03.14
|
04.00
|
02.99
|
00.00
|
|
Private employment agency
|
10.69
|
05.33
|
19.40
|
00.00
|
|
Newspapers
|
1.26
|
0.00
|
02.99
|
00.00
|
|
Information by relatives
|
16.98
|
14.67
|
16.42
|
29.41
|
|
Information by friends
|
38.36
|
36.00
|
38.81
|
47.06
|
|
Middleman
|
25.79
|
37.33
|
14.93
|
17.65
|
|
Others
|
03.77
|
02.67
|
04.48
|
05.88
|
3.3 Linkage with Native Villages
Our country has experienced a lot of changes in the communication network over time. With these changes, the mode of connection of the migrants to the native villages has also been changed. Mobile phones and social media have become the main communication network at present. Faster transport and communication network have moved people quickly from village to destination places. Here the linkages of out-migrants with their native places have been studied through the frequency of visits, time spent and purpose of visit at the native place (Table 4). It is clear from the study that the frequency of visiting the native places has the opposite relation with distance. Greater the distance lesser is the frequency and vice versa. Therefore, the migrants who visit their native place on a regular basis are from a short distance. Their workplace is located normally within the state boundary. Only 7.55 % of migrants are included in this category. On the other hand, migrants visit their native place once in a year are large in number (25-30%). They are normally migrated to other state or associated with a long distance inter-state level migration. A moderate picture is recorded for people visiting their native places after every 3-6 months. Migrants moved for medium distance and also took part in short agricultural seasons in native villages are included in this category. Those who visit their native village at least once in a month (15.09 %) are from a short distance. A small proportion of rural male-out-migrants (4.40 %) visit rarely their homes. Most of them are permanently settled at their destination. Time spent at the native village is another important parameter. Table 4 shows that 33.33 % of migrants stayed at their village for a few days and are generally migrated to short distances. Majority of these migrants work on a daily basis and can manage two or three days in a month from their workplace. Migrants migrated to medium and long-distance stayed at their native village for a few weeks (30.19 %) and visit generally during the short agricultural season. The large proportion of male migrants (36.48 %) stayed at their homes over a month, are migrated to long distance. At the household level, the highest proportion of male from small landholding households (47.06 %) stayed over a month at their native village followed by marginal (31.34 %) and landless (38.67 %) households. Majority of male folk from marginal and small landholding households visit their native village once in three or six months and stayed over a month at their village during the short agricultural season. Landless people also visit their home during the short agricultural season and work as agricultural labor.
Table 4. Linkages of rural out-migrant with native place
|
Linkages with native villages
|
All HHs
|
Landless migrants
|
Marginal landholders
|
Small landholders
|
|
Frequency of visiting the native place (%)
|
|
|
|
|
|
|
Regular
|
07.55
|
5.33
|
10.45
|
05.88
|
|
Once in a month
|
15.09
|
10.67
|
20.90
|
11.76
|
|
Once in a three month
|
19.50
|
21.33
|
17.91
|
17.65
|
|
Once in a six month
|
25.79
|
32.00
|
20.90
|
17.65
|
|
Once in a year
|
27.67
|
29.33
|
23.88
|
35.29
|
|
Rarely
|
04.40
|
01.33
|
05.97
|
11.76
|
|
Time spent at the native place (%)
|
|
|
|
|
|
|
Few days
|
33.33
|
28.00
|
40.30
|
29.41
|
|
Few weeks
|
30.19
|
33.33
|
28.36
|
23.53
|
|
Over a month
|
36.48
|
38.67
|
31.34
|
47.06
|
|
Purpose of visit native place (%)
|
|
|
|
|
|
|
Meet with family
|
91.19
|
93.33
|
89.55
|
88.24
|
|
During short agricultural season
|
23.90
|
01.33
|
43.28
|
47.05
|
|
Inspection of properties
|
31.70
|
40.00
|
25.37
|
29.41
|
|
Social ceremony
|
08.18
|
09.33
|
08.96
|
01.20
|
|
Others
|
03.33
|
02.00
|
03.50
|
04.50
|
Regular visit of the native village is a common migration character. The rural male has visited their native village according to their need and purpose. This study shows four main purposes of visiting the native village by rural male migrants. These are meeting with family, during the short agricultural season, an inspection of properties and social ceremony. It is very common among all the male migrants to visit their village often to meet with family members. Marginal and small farmers are visited generally during short agricultural season i.e. rainy season. The agriculture of these villages is very backward due to lack of irrigation facility. Agriculture is depending on rainfall. Paddy is the main food crop and it is cultivated only in the rainy season at this village. Table 4 shows in Bankura district majority of rural male (91.19 %) are visiting their native village to meet with the family. The study reveals that a large proportion of rural male is visited their native village for multiple purposes. The highest proportion of landless rural male visited their native village to meet with a family member (93.33 %) followed by inspection of properties (40 %), social ceremony (9.33 %) and during the short agricultural season (1.33 %), respectively. The large proportion of marginal rural male visited their native village to meet with a family members (89.55 %) followed by during short agricultural season (43.28 %), an inspection of properties (25.37 %) and social ceremony (8.96 %), respectively. Majority of small household’s rural male visited their native village to meet with a family member (88.24 %) followed by during short agricultural season (47.05 %), an inspection of properties (29.41 %) and social ceremony (1.20 %), respectively. This study explores the most important reason for coming to the out-migrants in the villages is to supervise the agricultural activities during the rainy season. The large proportion of male-out-migrants from marginal households (43.28%) and small households (47.05%) are visited their native village during short agricultural season whereas out-migrants from landless households shows a negligible proportion (1.33%). The agricultural purpose is one of the major factors which bring migrants to their villages except for landless households. Inspection of properties is a prime cause for landless people to visit their native place.
4 . DETERMINANTS OF RURAL MALE-OUT-MIGRATION
Different socio-economic variables are important determinants of male-out-migration in Rarh region of West Bengal. To study the effects of socio-economic determinants of the rural male-out-migration in the study area, the working-age group of the male population (15 to 65 years) taken into consideration. Here, the binary logistic regression model has been fitted to analysis the effects of determinant factors on rural male out-migration in the study area. The possibilities of male out-migration coded in a binary form, the dependent variable considered as value ‘1’ if rural male out-migrated and ‘0’ if not migrated. The total sample has taken 441 adult male (15 to 65 years), among of this 245 person who migrated and 196 not migrated. The independent variables which taken as consideration, all are categorical form. The Chi-square value (246.520) indicates that the model is significant at 1 % level of confidence. The selected variables explained 81.4 % variation of male-out-migration in Rarh region of West Bengal. Table 5 explained the effect of socio-economic determinants on rural male out-migration in the study area. The model revealed that age, social group, education level, landholding and occupation status have statistically significant relationship with the rural male- out-migration in the study area. Rural male age group of above 60 years has considered a reference category. The odd ratio implied that the rural male in the age group of 35-60 years is about five times more likely to out-migrate than the age group above 60 years. The probability of male-out-migration increases to 10 times more likely in the age group of 25-35 years. Moreover, the male age group of 15-24 years have about seven times more likely to migrate compared to the age group of above 60 years. The forward caste category is considered as the reference category. The relation between male-out-migration and forward caste reveals statistically significant at 1 % level of confidence. The rural male belonged to scheduled castes and tribes are two times more likely to migrate than forward castes. Moreover, rural male belongs to other backward castes have a negative influence on the probability of male-out-migration. It represents that rural male belongs to other backward castes about 77 % less likely to migrate than forward caste. Level of education up to 12 years or more and propensity of male-out-migration has found statistically significant at 1 % level of confidence. The odd ratio implied that the rural illiterate males are 81 % less likely to migrate than those have 12 years or more school. Moreover, the rural male has 5-8 years of school, are 2.1 times less likely to migrate than those who have 12 years or more school. This result stated that those rural male have higher education tended to more propensity of out-migration due to the absence of work available in rural areas. The odd ratio explained that the landless rural male has 3.2 times more likely to migrate than small landholding households. The rural male of marginal households observed 1.56 times more likely to migrate than small landholding, but it is statistically not significant. Thus the hypothesis that the higher the landless households and small and marginal farmers, the higher is the volume of rural out-migration in West Bengal holds utterly right in the context of rural male-out-migration in Rarh region of West Bengal. The occupation structure is also important parameter to determinate of rural male out-migration. Temporary or seasonal male out-migration mainly worked base (Yang and Guo, 1999; Keshri and Bhagat, 2010). The odd ratio explained that marginal male workers are about 7.6 times more likely to out-migrate than the main workers male. Simultaneously, non-worker rural male observed 30 times more likely to out-migrate than the main male workers. The result suggested that due to lack of work at the village level, the rural male is forced to out-migrate from the rural areas. On the other hand, marital status, size of household and poverty level of rural male have found that these variables are either less likely related or these do not have any direct relation or association with the rural male outmigration at this present study area.
Table 5. Logistic regression estimates of rural male-out-migration
|
Variable
|
Coefficient
|
SE
|
Significance
|
Odd ratio
|
|
Age (years):
|
|
|
|
|
|
60+ §
|
|
|
0.018**
|
|
| |
15-24
|
1.882
|
0.788
|
0.017**
|
06.564
|
| |
25-34
|
2.326
|
0.748
|
0.002***
|
10.237
|
| |
35-60
|
1.629
|
0.683
|
0.017**
|
05.097
|
|
Social groups:
|
|
|
|
|
| |
Forward castes§
|
|
|
0.000***
|
|
| |
Scheduled castes and tribes
|
0.717
|
0.339
|
0.035**
|
02.048
|
| |
Other backward castes
|
-1.328
|
0.523
|
0.011**
|
00.265
|
|
Education:
|
|
|
|
|
| |
Up to 12 years or more§
|
|
|
0.000***
|
|
| |
Illiterate
|
-1.667
|
0.523
|
0.001***
|
00.189
|
| |
Up to 5 years of school
|
-0.236
|
0.542
|
0.663
|
00.790
|
| |
5 to 8 years of school
|
0.749
|
0.439
|
0.088*
|
02.114
|
| |
8 to10 years of school
|
0.277
|
0.394
|
0.483
|
01.319
|
|
Marital status:
|
|
|
|
|
| |
Unmarried§
|
-0.279
|
0.404
|
0.49
|
00.757
|
|
Size of households:
|
|
|
|
|
| |
Large§
|
|
|
0.846
|
|
| |
Small
|
-0.213
|
0.55
|
0.699
|
00.808
|
| |
Medium
|
-0.315
|
0.571
|
0.581
|
00.729
|
|
Landholdings:
|
|
|
|
|
| |
Small (1-2 hectares)§
|
|
0.044**
|
|
| |
Landless
|
1.149
|
0.508
|
0.024**
|
03.155
|
| |
Marginal (below 1 hectare)
|
0.452
|
0.444
|
0.309
|
01.571
|
|
Occupation
|
|
|
|
|
| |
Main worker§
|
|
|
0.000***
|
|
| |
Non worker
|
3.408
|
0.529
|
0.000***
|
30.208
|
| |
Marginal worker
|
2.031
|
0.467
|
0.000***
|
07.622
|
|
Poverty level
|
|
|
|
|
|
Below poverty level§
|
0.41
|
0.321
|
0.202
|
01.507
|
|
Statistics
|
|
|
|
|
|
|
N
|
441
|
|
|
|
|
|
Constant
|
-4.289
|
|
|
|
|
|
-2 Log Likelihood ratio
|
359.380a
|
|
|
|
|
|
Chi-square
|
246.520
|
|
|
|
|
|
Nagelkerke R square
|
0.573
|
|
|
|
***, ** and * represent statistical significance at the 1%, 5% and 10% level of confidence, respectively.
§ represents the reference category.
a shows estimation terminated at iteration number 6 because parameter estimates changed by less than 0.001.


 ,
Sheuli Ray 1
,
Sheuli Ray 1