1 . INTRODUCTION
On 26 January 2020, WHO confirmed and announced high risk of Novel Coronavirus (nCoV-19) as epidemic (WHO, 2020) in China and aware rest of the world to be prepare for minimize the nature shoot of this virus infected pneumonic type of asymptotic fever. On 25 January 2020, China (Bejing Time) has confirmed 2032 confirmed cases along with 42 deaths by Novel Coronavirus (nCoV-19) infections mostly reported from Wuhan City, Hubei Province of PR China (Changyu et al., 2020; Huaiyu et al., 2020; Imai et al., 2020). The Chinese Government has already suspended of any travel movement by lockdown the city on 23 January 2020 and suspended all sort of traffic movement by air, train, bus and ferry taking ‘city closure strategies’. But the decision has been taken by the government was too late as the Novel Coronavirus (nCoV-19) infections has already transmitted in different parts of PR China and also in the different countries of the world like, South Korea (19 January 2020), Japan (20 January 2020), United States (20 January 2020), Singapore (22 January 2020), Hong Kong (22 January 2020), Thailand (23 January 2020), Australia (24 January 2020), Germany (26 January 2020). Very interestingly when most the developed countries have been reported their first case within 20 January 2020 to 10 February 2020, except Egypt, Nigeria and Algeria; other countries of African continent remain calm in this pandemic phase. This episode is highly correlated with the Chinese Great Migration during the January-February when near about 415 million people (Maogui, 2019) are moving towards PR China (within the Country and from outside the country) to celebrate their Lunar New Year.
As already confirmed by WHO that the Novel Coronavirus (nCoV-19) has a RO (basic reproduction number) factor of 1.4-3.9 and transmitted in H2H (Human to human) by airborne droplet at the time of coughing and sneezing which is risky for a person who came into contact with the infected person without knowing his situation (as this pneumonic type of fever has an incubation period of 5-7 days). And in this manner the huge floating population of Wuhan city transmitted the infection primarily within the PR China and later in the rest of the world (Bogoch, 2020; Carl, 2015; Isaac et al., 2020; Jianquan and Ian, 2003). This pandemic situation does not make much effect on African continent except two to three countries where developed countries from other continents are seriously struggling. ‘Hug-a-Chinese’ and Serie-A (in Italy), La Liga (in Spain), Bundeshliga (in Germany), League 1 (in France) and other social accumulation programme, gathering in markets, cinema house and entertainment centers with minimum flight cancellation towards the origin area played a pivotal role to transmit the diseases severely (Pullano et al., 2020; Shengjie, 2020). At the time of reporting this study, cases of Novel Coronavirus (nCoV-19) confirmed at almost 6,00,000 (5,97,458) on 28 March 2020 at 12:30 and death toll rises to 27,370 (data procured from www.worldmeters.info.coronavirus). A detailed country wise dataset of confirmed cases, death toll and 1st case found has been given in Table 1 where developed countries (from different continent) and African Countries are positioned according to Air Flight movement data.
Table 1. Country wise cases, deaths due to Novel Coronavirus (nCoV-19) pandemic
|
Country
|
Population
|
Total Cases of nCoV-19
|
Total Deaths of nCoV-19
|
Case Fatality Rate (in %)
|
Mortality Rate / million Pop.
|
1st Case
|
|
Developed countries
|
|
United States
|
326776748
|
215344
|
5112
|
2.37
|
659
|
20 Jan
|
|
Italy
|
6,04,61,826
|
110574
|
13155
|
11.90
|
1829
|
29 Jan
|
|
China
|
1439323776
|
81554
|
3312
|
4.06
|
57
|
10 Jan
|
|
Germany
|
8,37,83,942
|
77981
|
931
|
1.19
|
931
|
26 Jan
|
|
Spain
|
4,67,54,778
|
104118
|
9387
|
9.02
|
2227
|
30 Jan
|
|
France
|
65,2,73,511
|
56989
|
4032
|
7.08
|
873
|
23 Jan
|
|
United Kingdom
|
6,78,86,011
|
29474
|
2352
|
7.98
|
434
|
30 Jan
|
|
South Korea
|
51269185
|
9976
|
169
|
1.69
|
195
|
19 Jan
|
|
Japan
|
126476461
|
2384
|
57
|
2.39
|
19
|
14 Jan
|
|
Singapore
|
5850342
|
1000
|
4
|
0.40
|
171
|
22 Jan
|
|
Iran
|
83992946
|
47593
|
3036
|
6.38
|
567
|
N.A.
|
|
African countries
|
|
Algeria
|
4,38,51,044
|
847
|
58
|
6.85
|
19
|
26-Feb
|
|
Angola
|
3,28,66,272
|
8
|
2
|
25.00
|
0
|
19-Mar
|
|
Congo
|
55,18,087
|
22
|
2
|
9.09
|
4
|
14-Mar
|
|
Cote-D-Ivoire
|
2,63,78,274
|
169
|
1
|
0.59
|
6
|
03-Mar
|
|
Egypt
|
10,23,34,404
|
779
|
52
|
6.68
|
8
|
13-Feb
|
|
Ethiopia
|
11,49,63,588
|
29
|
0
|
0.00
|
0
|
12-Mar
|
|
Gabon
|
22,25,734
|
18
|
1
|
5.56
|
8
|
12-Mar
|
|
Ghana
|
3,10,72,940
|
195
|
5
|
2.56
|
6
|
11-Mar
|
|
Guinea
|
1,31,32,795
|
30
|
0
|
0.00
|
2
|
01-Mar
|
|
Kenya
|
5,37,71,296
|
81
|
1
|
1.23
|
2
|
12-Mar
|
|
Mauritius
|
12,71,768
|
161
|
7
|
4.35
|
127
|
17-Mar
|
|
Morocco
|
3,69,10,560
|
654
|
39
|
5.96
|
18
|
01-Mar
|
|
Mozambique
|
3,12,55,435
|
10
|
0
|
0.00
|
0
|
21-Mar
|
|
Nigeria
|
20,61,39,589
|
174
|
2
|
1.15
|
1
|
27-Feb
|
|
South Africa
|
5,93,08,690
|
1380
|
5
|
0.36
|
23
|
04-Mar
|
|
Sudan
|
1,11,93,725
|
7
|
2
|
28.57
|
1
|
12-Mar
|
|
Tanzania
|
4,38,49,260
|
20
|
1
|
5.00
|
0
|
15-Mar
|
|
Tunisia
|
5,97,34,218
|
423
|
12
|
2.84
|
7
|
01-Mar
|
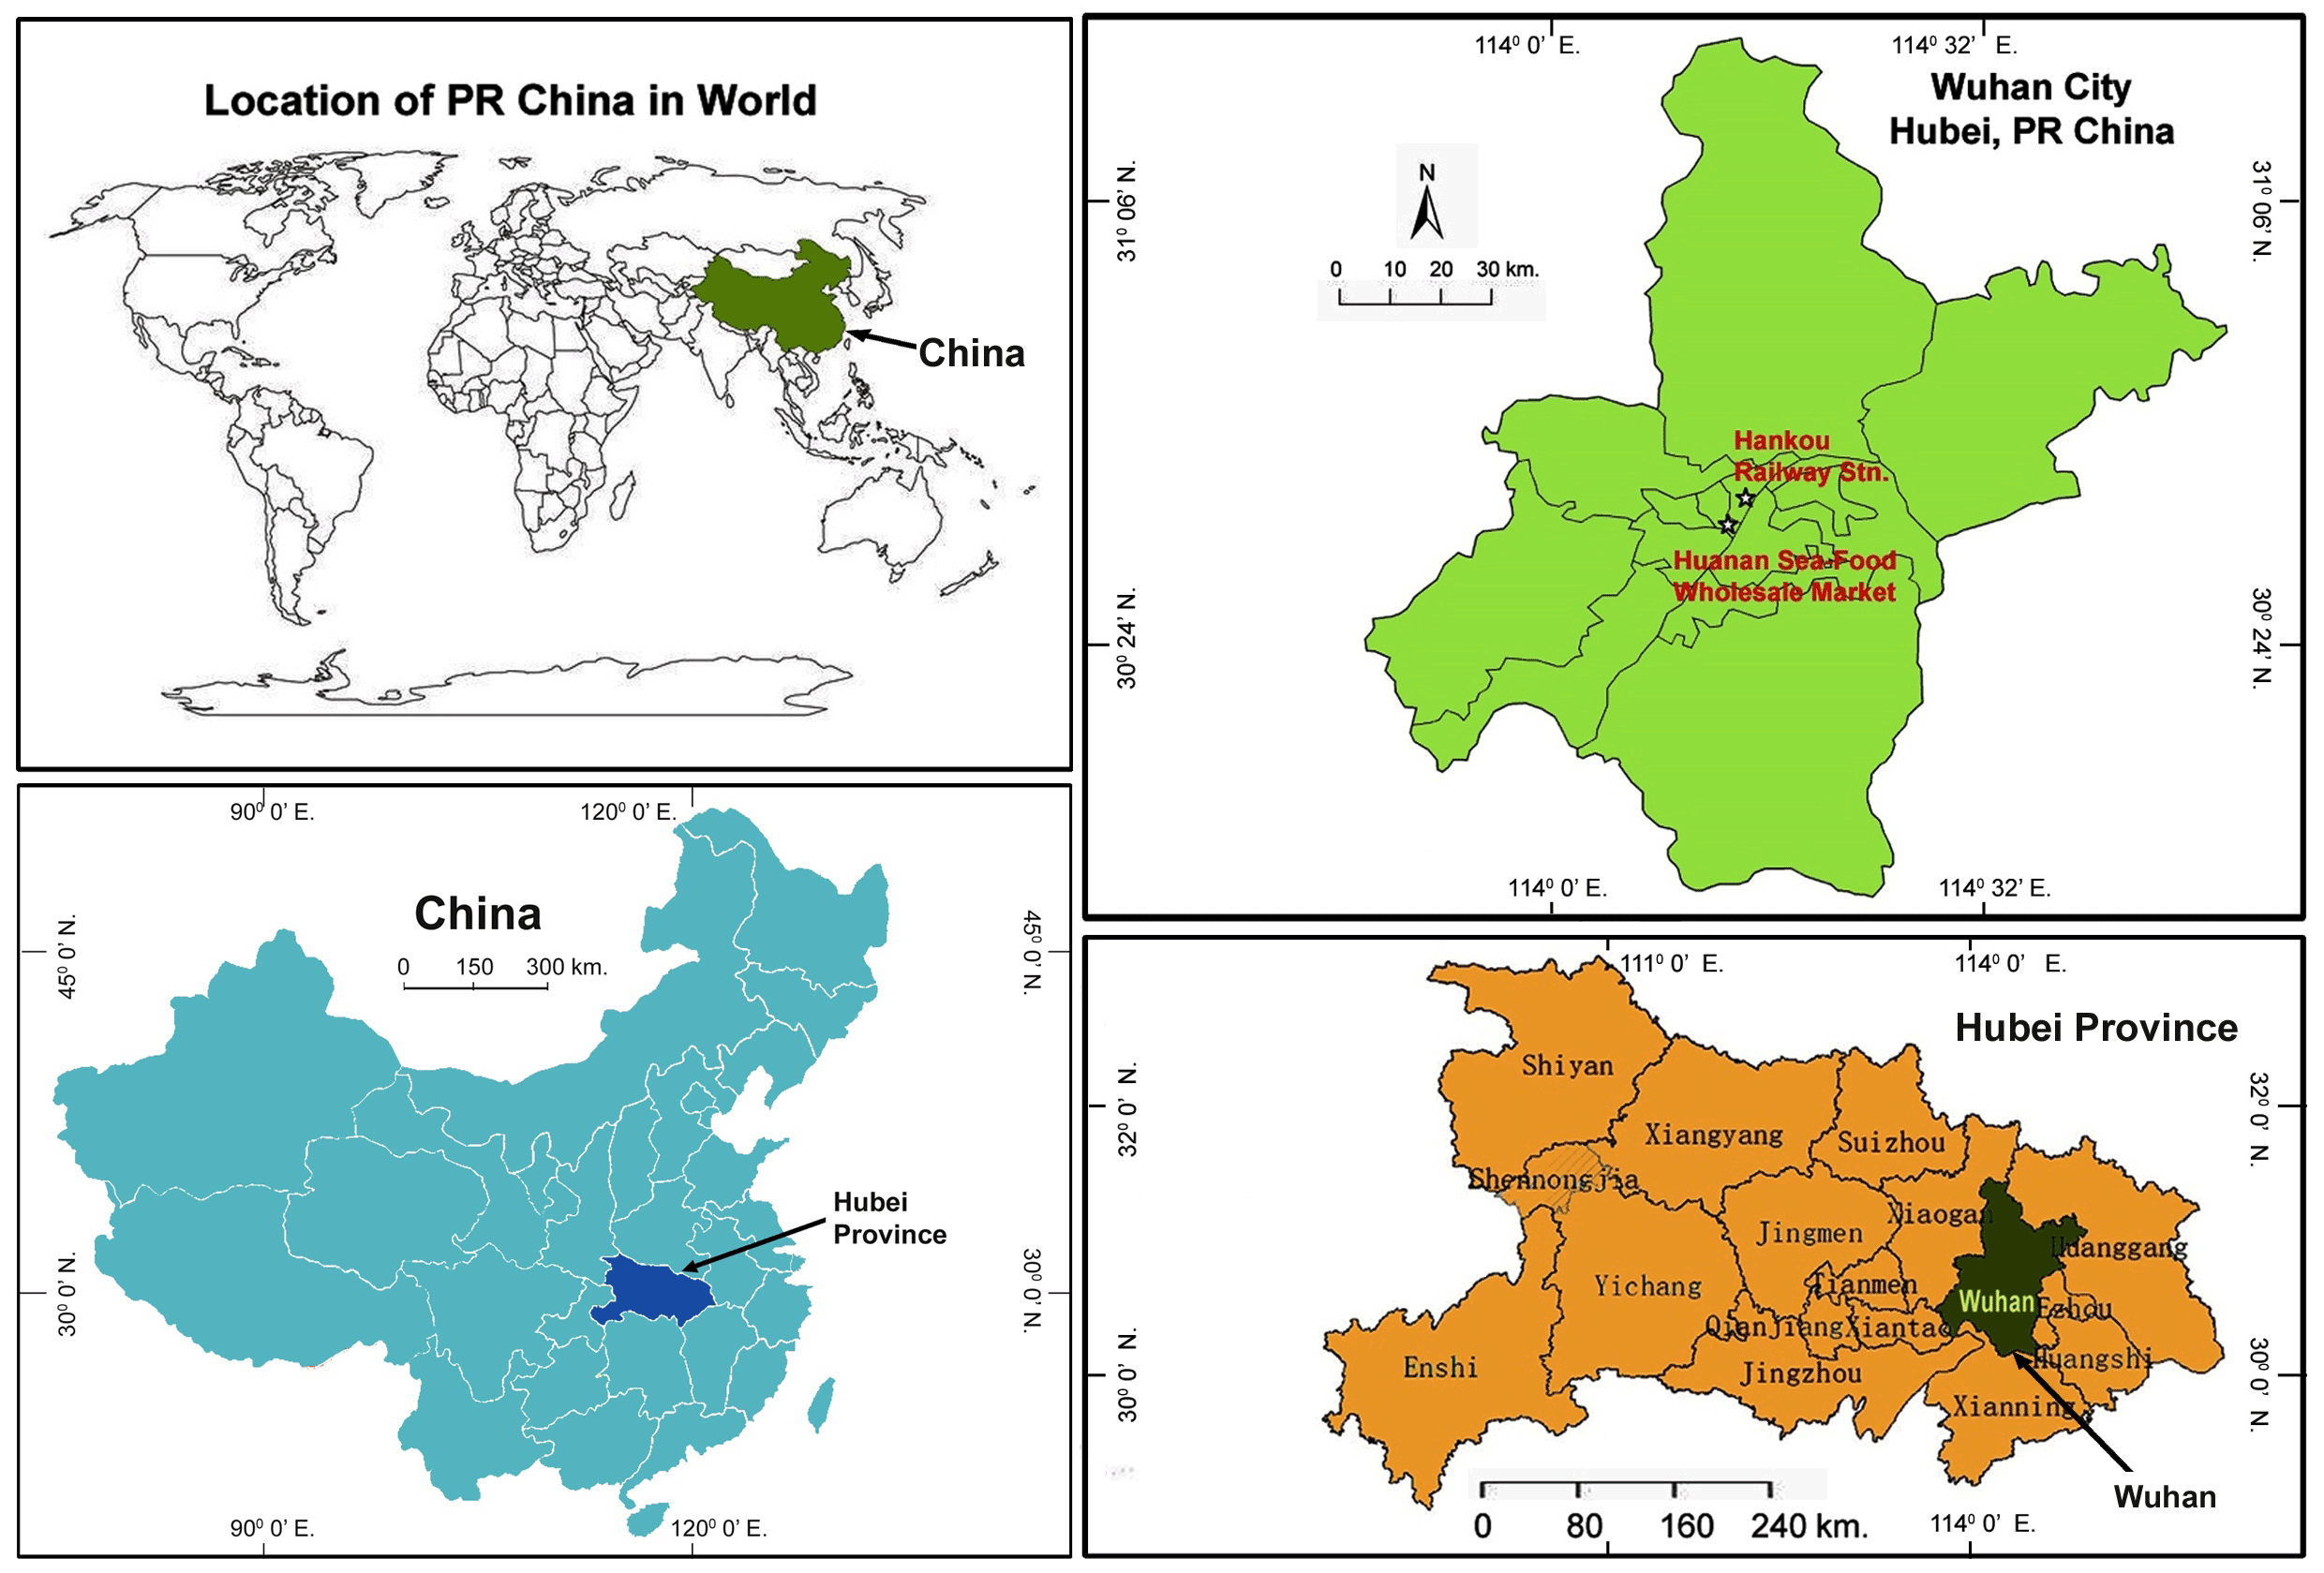
Wuhan the epicentre of the Novel Coronavirus (nCoV-19) outbreak during January 2020 is a major travel hub with a huge number of floating populations who are the potential transporter of this virus transmission (Li et al., 2020; Read et al., 2020; Shengjie et al., 2020; Wenfei and Cindy, 2012). Wuhan is level 1 city with a population over 11 million in 2018 with 2.5 million of floating population stay for six months or more (Zhao et al., 2015). As regarded, Wuhan’s Huanan seafood wholesale market (Figure 1), the potential source point of Novel Coronavirus (nCoV-19) outbreak is within 650 meters of Hankou railway station which is the main lifeline for migrant workers coming from surrounding rural area. A large scale migration took place during the Lunar New Year event year and hence Government has seized the travel movement on 23 January 2020, which is the potential source of transmission.
Historical dataset has been mapped by Baidu, the largest tech agency which also confirms the scenario of this great migration event (Wei et al., 2017). This analysis tries to study the nature of movement happens during the spring festival which was planned from 26 January to 4 February 2020 from historical data which are the probable main source of transmission primarily within the PR China and assessing the risk factor with ground reality and the probable contribution of flight passengers for such transmission in the worldwide.
2 . MATERIALS AND METHODS
2.1 Study Area
Novel coronavirus (2019-nCoV) outbreak has been found in Wuhan primarily but the transmission of this infection has been found in the other provinces of PR China. Primarily to study the risk assessment of transmission of Novel coronavirus, all the provinces has been taken into consideration. On the other hand, when the highly developed countries of the world face huge infections among the citizen, African countries faced a less transmission. To study the nature and driving factors of the transmission of novel coronavirus to the different parts of the world, the highest cases found in the countries in world, i.e. USA, Italy, China, Germany, Spain, France, UK, South Korea, Japan, Singapore and Iran has been considered. On the other hand African countries having highest amount flight passenger from China are taken into consideration.
2.2 Data Processing
Publicly accessible data, including newly increased cases, cumulative numbers of confirmed cases, cured cases, died cases, are updated daily by the WHO in their dashboard and the health commission of 31 provinces in China has been taken to study the nature of spread of Novel Coronavirus (nCoV-19). Daily updated data of Novel Coronavirus (nCoV-19) in countries outside China were collected from the coronavirus disease (COVID-2019) situation reports released by WHO. Risk factor for Novel Coronavirus (nCoV-19) has been estimated with the number of floating population from Wuhan city and air flight data from Wuhan to other provinces in combined. International air travel data has obtained from the International Air Transport Association (IATA) to explore patterns of mobility pattern. Travellers from Wuhan to other provinces in PR China and to other countries have taken from publish source (Shengjie, 2020a). The real ground situation also verified with Baidu’s dataset.
2.3 Methodological Issues
2.3.1 Risk Assessment of Transmission of Novel Coronavirus
Precisely, we first assessed the risk of transmission of Novel Coronavirus (nCoV-19) from Wuhan to different provinces of PR China. To measure the risk, we have used the flight passenger data from Wuhan to other provinces and percentage share of floating population to Wuhan from other provinces has been taken into consideration. Using the following equation we have estimate the risk of transmission of Novel Coronavirus (nCoV-19):
Risk Index = [Floating Population (in %) + Flight Passenger from Wuhan (in %)] / 2
2.3.2 Model Setting for Estimate the Driving Factors of Transmission
Finally, we have tried to find out the driving factors for high transmission of Novel Coronavirus (nCoV-19) in developed countries on the contrary of African countries. To estimate the driving factors, multi-linear regression model (MLRM) has been done. Reported Cumulative Cases of Novel Coronavirus (nCoV-19) has been considered as ‘Y’ factor. Net migration (X1), GDP per capita of 2018 (X2), air flight passenger before Two weeks of spring festival in’000 of 2018 (X3), Share of Urban Population (X4), old age population share who area above 70 years of old (X5) and international tourism (no. of arrivals) (X6) are the independent factors has been taken into consideration to understand the prime driving factors for transmission.
3 . RESULTS AND DISCUSSIONS
3.1 Mobility of Floating Population in and Around Wuhan and Hubei Province
Wuhan megacity of Hubei province initially determined as the source point of Novel Coronavirus (nCoV-19) as 44 suspected cases has been reported within 3rd January 2020 and out of which 11 are very critical. Within one week from 3 January 2020, there were 41 confirmed cases have been admitted in Wuhan city hospital (7 were critical). When the 20th day of January 2020 came, the incidence has spread out in a speedy way as Spring Festival and largest human migration has already been took place within PR China. From the data sources (Changyu et al., 2020; Li et al., 2020; Shen et.al., 2020) it has been found that 465470 number of population has already been travelled during 30 December 2019 (1st nCoV-19 Case Reported) and 22 January 2020 (the day before lockdown of Wuhan City) which make a great threat to Government level. Previous year air traffic movement data (AITT Data, 2019) also confirms of huge migration took place during this spring festival time (Findlater and Bogoch, 2018; Qi et al., 2012). Risk analysis also confirms that higher the movement during this period engulf the number of affected cases (Tian et al., 2020; Wei et al., 2017). Lockdown process somehow makes the stopgap arrangement for quarantine the Wuhan city though the massacre has already been took place in the country as well as in the world (Siqi et al., 2020; Wu et al., 2017). Wuhan and several cities of Hubei province have shut down all types of inbound and outbound transportation on 23rd January 2020. According to China Global Television Network (CGTN), due to spring festival holiday about 5 million populations out of nearly 11 million have left out just before the lockdown announced on 23rd January 2020 which has been further confirmed by City Mayor, Zhou Xianwang on 26th January 2020 in press conference.
Wuhan city is one of the important cities in central China having the industry, commercial and educational hub with provincial airport (Hubei province) and deep water port experiencing massive internal migration. In 2018, nearly 2.4 million population left Wuhan city during Spring Festival time (Bureau of Culture and Tourism, Wuhan Municipality). This is further proved from Baidu’s Big data Lab (Huaiyu et al., 2020), a huge amount of population flow has been evident to Nanyang, Zhumadian, Guangzhou, Zhoukou, Beijing, Shangqiu, Shenzhen and Changsha, five of which are in Henan province which is accounting nearly 7% of floating population.
As a result, many of the people who left Wuhan returned to their hometown, especially the above cities. Baidu’s migration map (http://qianxi.baidu.com/) also depicts that during Spring festival a large number of floating population movement is taking its course which is starting two weeks before the Lunar New Year event. This event account nearly 95 per cent of migration towards different surrounding provinces. From Wuhan, population floated to other cities in Hubei Province (74.99%) followed by Henan Province (6.75%), Anhui Province (2.73%), Hunan Province (2.52%), Jiangxi Province (2.43%), Chongqing Province (1.65%), Sichuan Province (1.39%), Zhejiang Province (1.39%) and Fujian Province (1.00%) (Changyu et al., 2020). During 10 to 22 January 2020, Xiaogan and Huanggang are the two main cities inside Hubei Province accounted highest proportion of return passenger flow of 13.03 and 12.64 percentage in a daily basis from Wuhan city (Source: CGTN). Wuhan is popular tourist destination as for its architecture, sea food market, spicy food, proximity to Yangtze River. According to flight master (Data on Domestic Departure), during 10 to 22 January 2020, people left Wuhan city for Beijing (65853), Shanghai (57814), Guangzhou (55922), Chengdu (54539), Haikou(48567), Kunming (44751), Xiamen (39641), Shenzhen (38065), Sanya (31810) and Quindao (25508) accounted of nearly 4.5 lakhs which was just before the lockdown started in Wuhan (Shen et al., 2020; Munster et al., 2020).
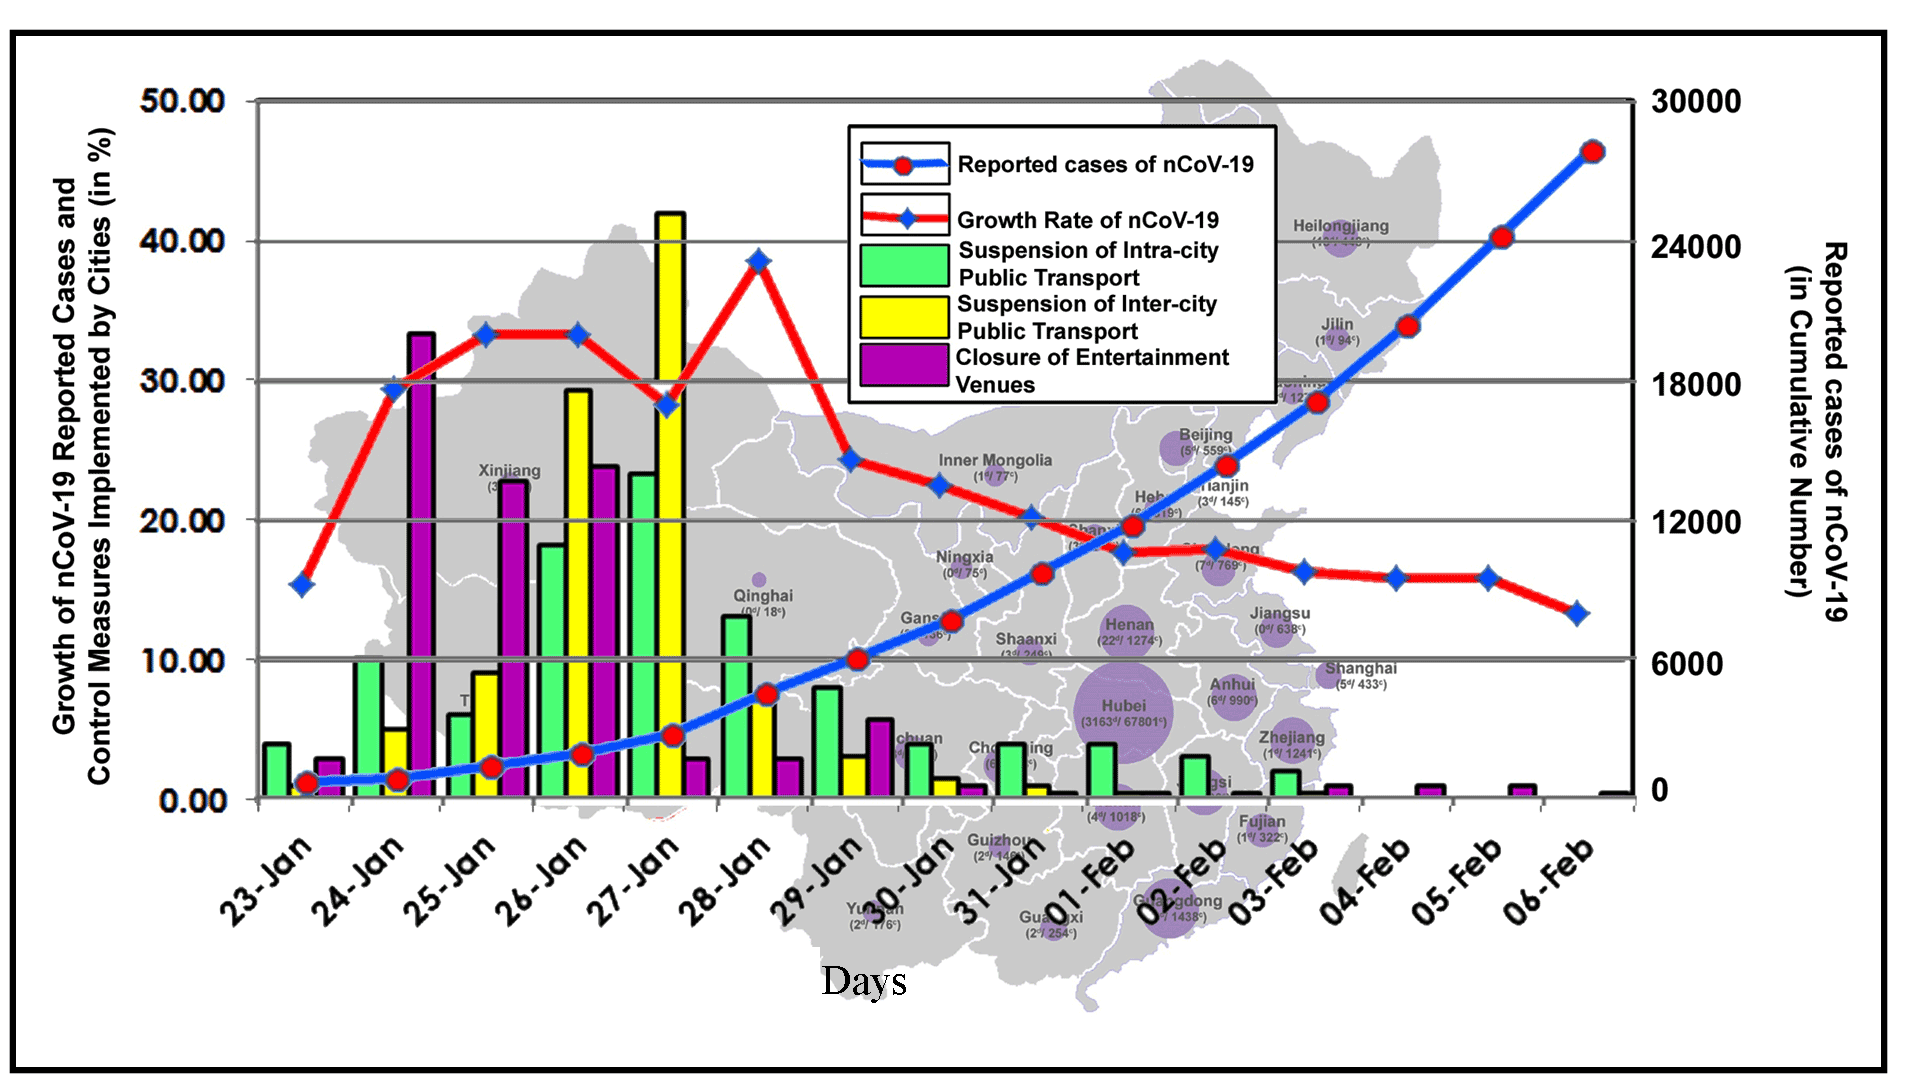
3.2 Control Measures Taken to Minimize the Transmission
Immediate control measures implementation nature taken by the cities of PR China very after the lockdown process started in Wuhan city on 23 January 2020. Different types of measure like- suspension on the travel movement of inter-city and intra-city, closure of entertainment venues have been taken to minimise the spreading effect of nCoV-19 (Siqi et al., 2020; Balcan et al., 2010). Among the three measures, each city among 342 cities in PR China has adopted at least one measure and 136 cities have applied all three measure. School closure has been noticed for all 342 cities and Spring semester for the higher education students have been delayed. Public gathering has been banned in different entertainment venues for 200 cities (64.3%), inter-city transport service has been terminated within 219 (64.3%) and intra-city public transport movement suspended in 136 cities (39.7%) (Huaiyu et al., 2020).
Wuhan city has full lockdown and became a ghost city which is experiencing full of life during Spring Festival. Due to lockdown and control measures taken by the Chinese Government, the effect has found immediately. Though the cumulative and day wise count has been found a huge increasing in number but the growth rate became slow down from 38.45% (on 28 January 2020) to 13.29% (on 6 February 2020). As the researchers rely on the secondary data, this might be the main cause of drop down in growth rate of infections. From the dataset it is nearly evident that, control measures slowdown the pace of infection as all sort of social gathering, travel movement has been suspended implementing 3 measures (Huaiyu et al., 2020; Cummings et al., 2004).
Table 2. 342-cities in PR China implementing three interventions for controlling transmission of nCoV-19
|
Dates from lockdown initiated
|
Reported cases of nCoV-19
(Cumulative numbers)
|
Growth rate of nCoV-19
(%)
|
Suspension of intra-city public transport (%)
|
Suspension of inter-city public transport (%)
|
Closure of entertainment venues (%)
|
|
23-Jan, 2020
|
623
|
15.57
|
4.04
|
1.01
|
2.86
|
|
24-Jan, 2020
|
883
|
29.45
|
10.10
|
5.05
|
33.33
|
|
25-Jan, 2020
|
1323
|
33.26
|
6.06
|
9.09
|
22.86
|
|
26-Jan, 2020
|
1988
|
33.45
|
18.18
|
29.29
|
23.81
|
|
27-Jan, 2020
|
2775
|
28.36
|
23.23
|
41.92
|
2.86
|
|
28-Jan, 2020
|
4528
|
38.71
|
13.13
|
7.07
|
2.86
|
|
29-Jan, 2020
|
5994
|
24.46
|
8.08
|
3.03
|
5.71
|
|
30-Jan, 2020
|
7734
|
22.50
|
4.04
|
1.52
|
0.95
|
|
31-Jan, 2020
|
9714
|
20.38
|
4.04
|
1.01
|
0.48
|
|
01-Feb, 2020
|
11809
|
17.74
|
4.04
|
0.51
|
0.48
|
|
02-Feb, 2020
|
14399
|
17.99
|
3.03
|
0.00
|
0.48
|
|
03-Feb, 2020
|
17211
|
16.34
|
2.02
|
0.51
|
0.95
|
|
04-Feb, 2020
|
20448
|
15.83
|
0.00
|
0.00
|
0.95
|
|
05-Feb, 2020
|
24320
|
15.92
|
0.00
|
0.00
|
0.95
|
|
06-Feb, 2020
|
28047
|
13.29
|
0.00
|
0.00
|
0.48
|
3.3 Analysis of Reported Cases of nCoV-19 and Risk Factor
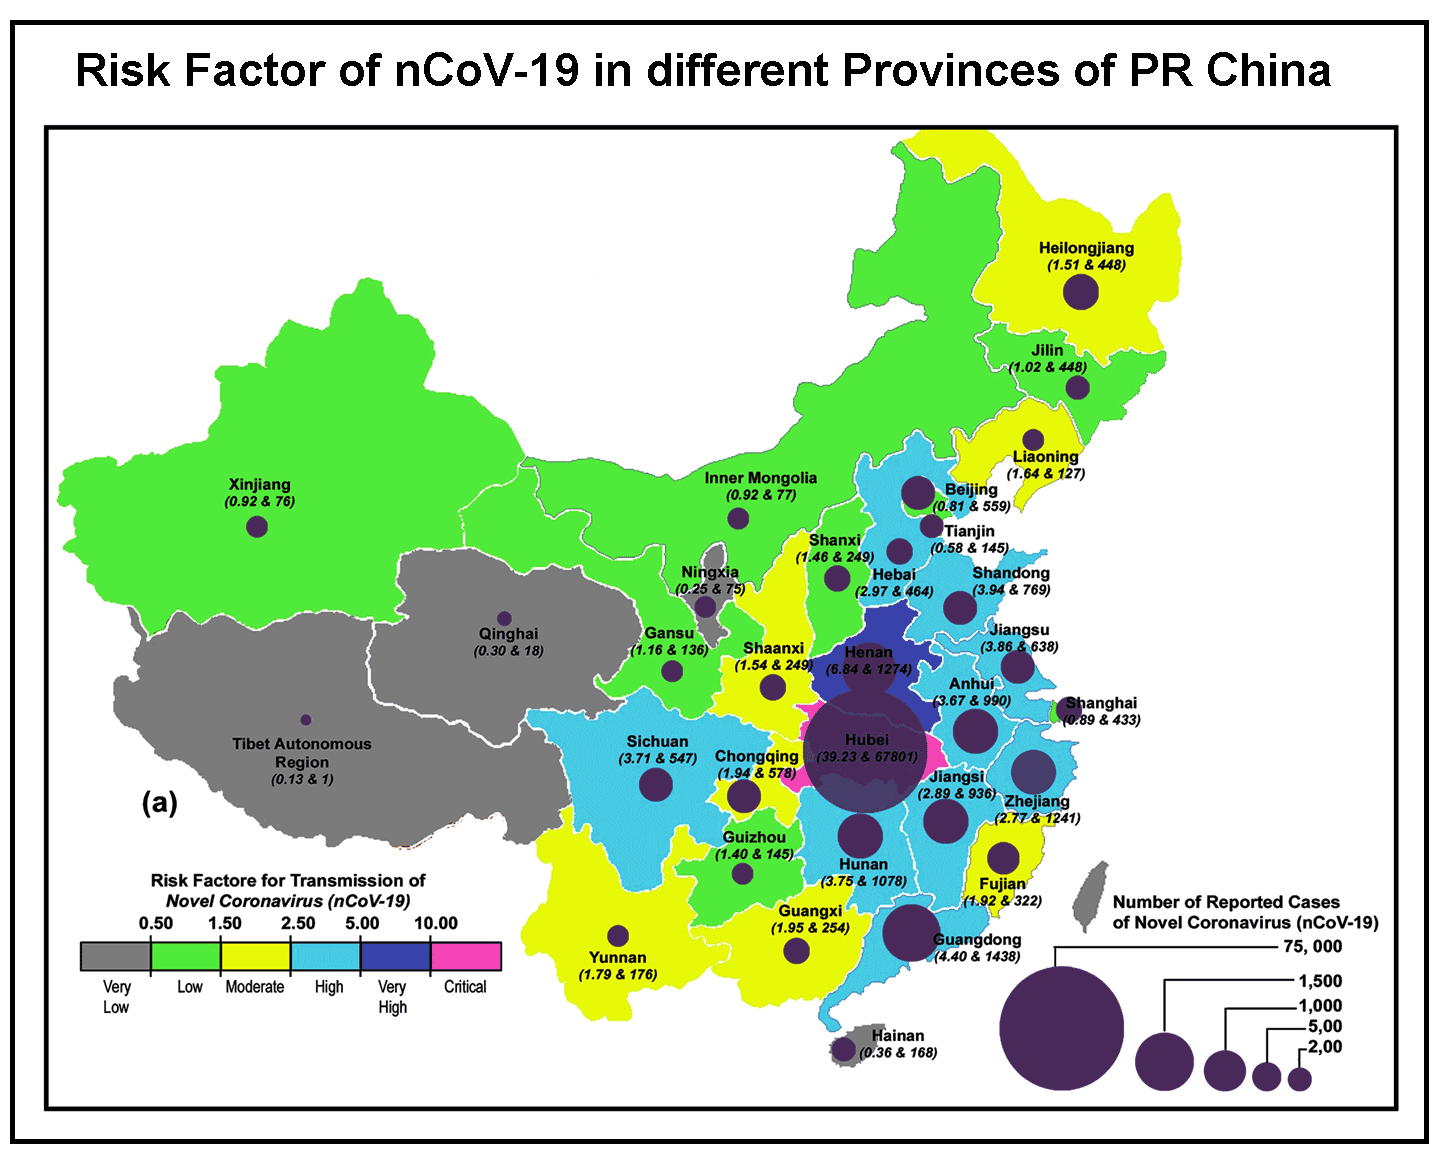
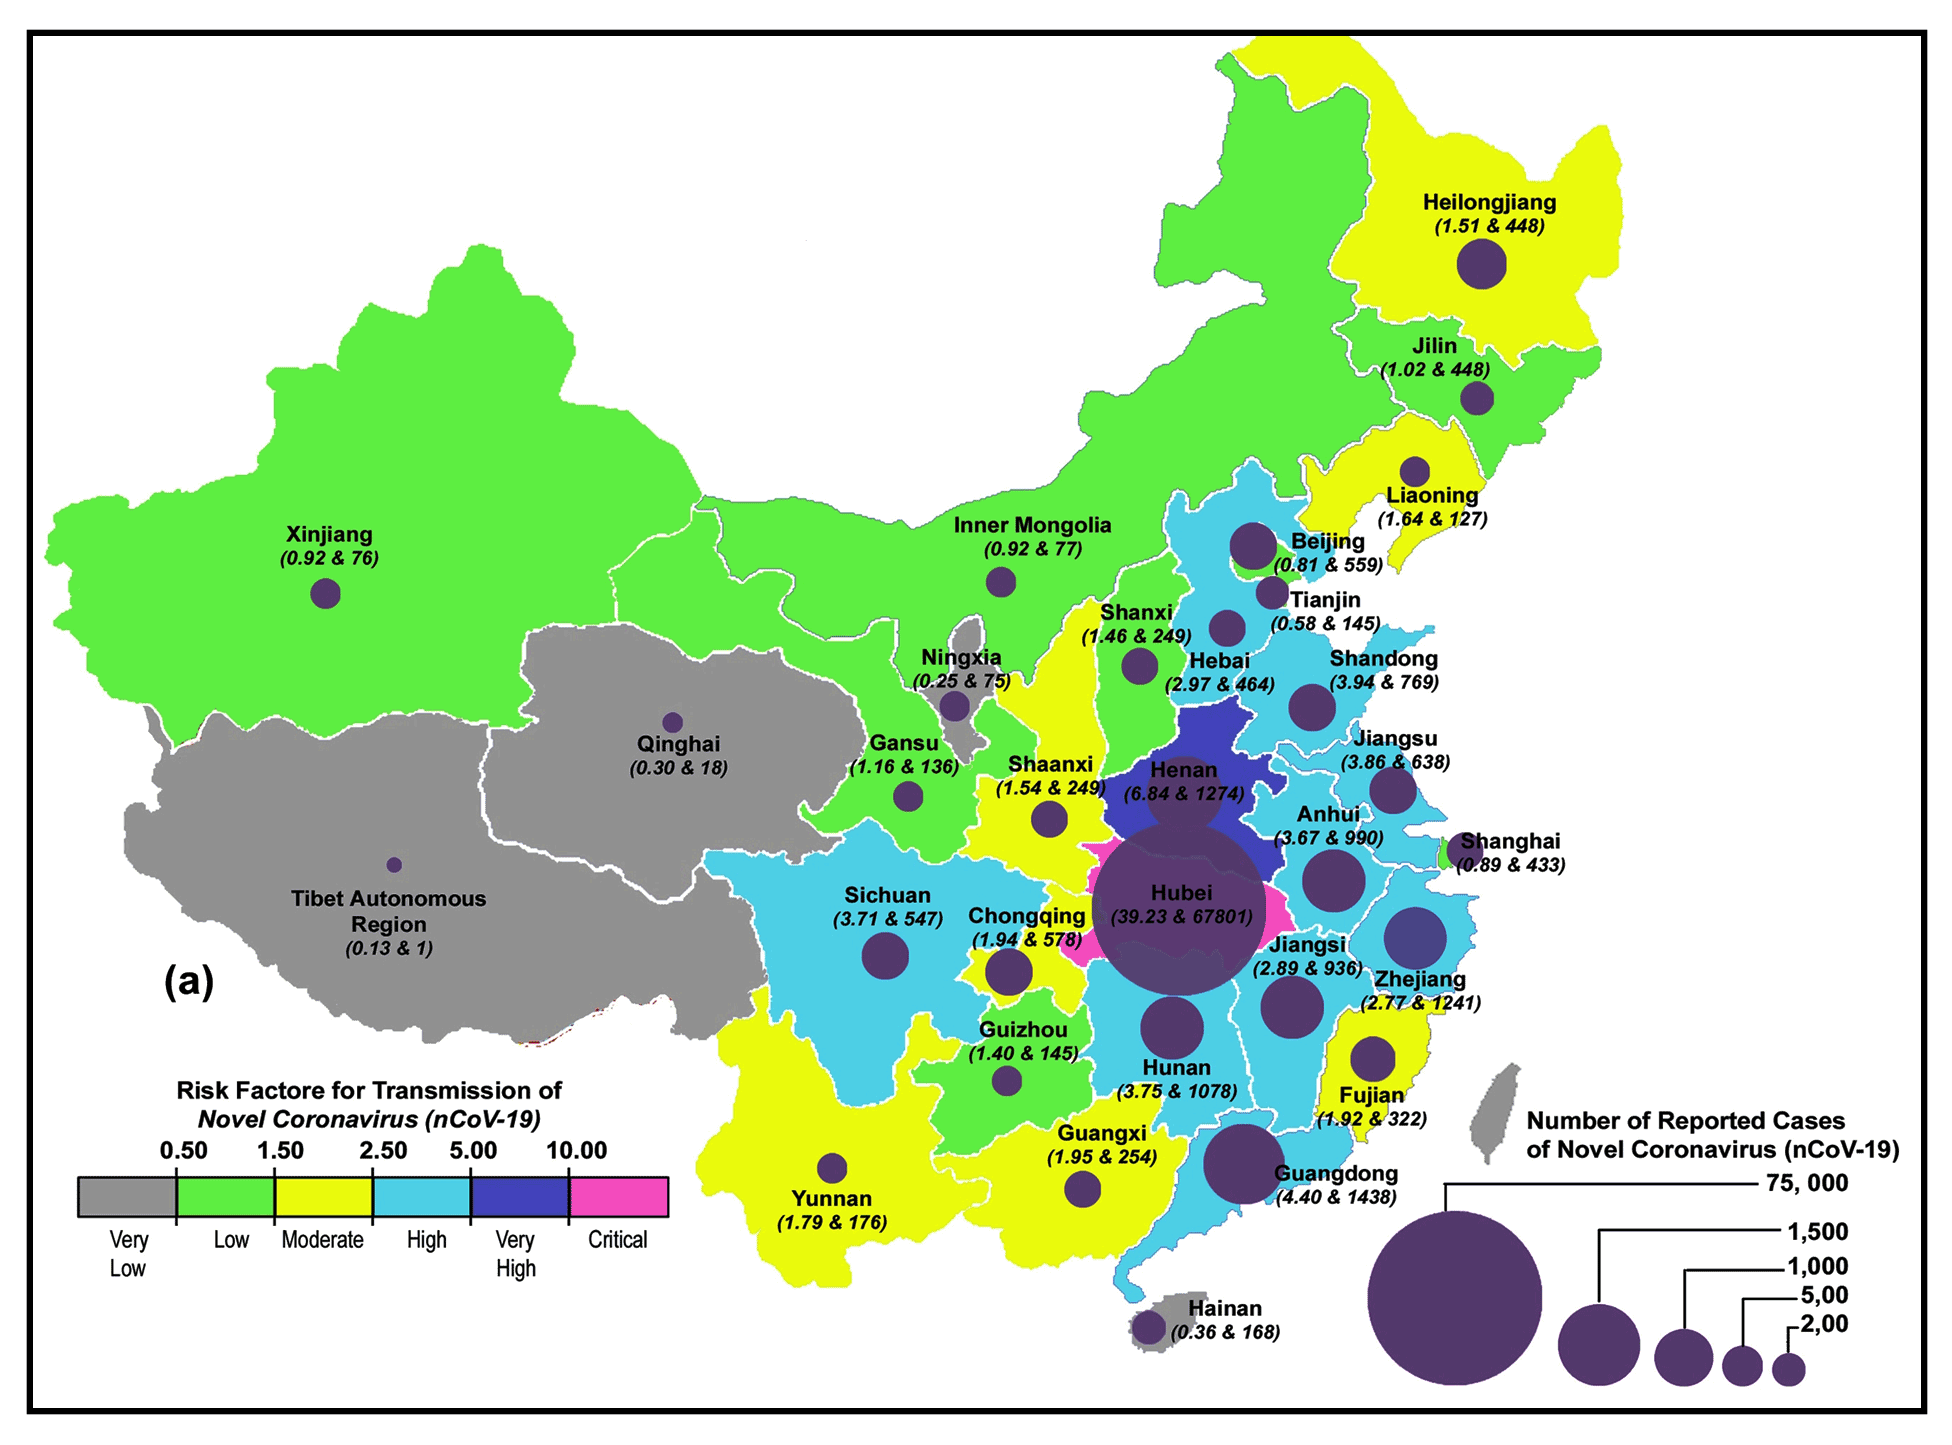
Further, the study has been performed to establish the relation between risk factor with associated cases of Novel Coronavirus (nCoV-19) in the different provinces of PR China. Risk factor has been calculated with the data associated with amount of floating population from Wuhan to several provinces and provinces in mainland China receiving travellers from Wuhan city around 2weeks earlier from Lunar New Year’s Day. The combined effect of both two parameters, make an impact on the risk factor of transmitting of H2H Novel Coronavirus (nCoV-19) very rapidly.
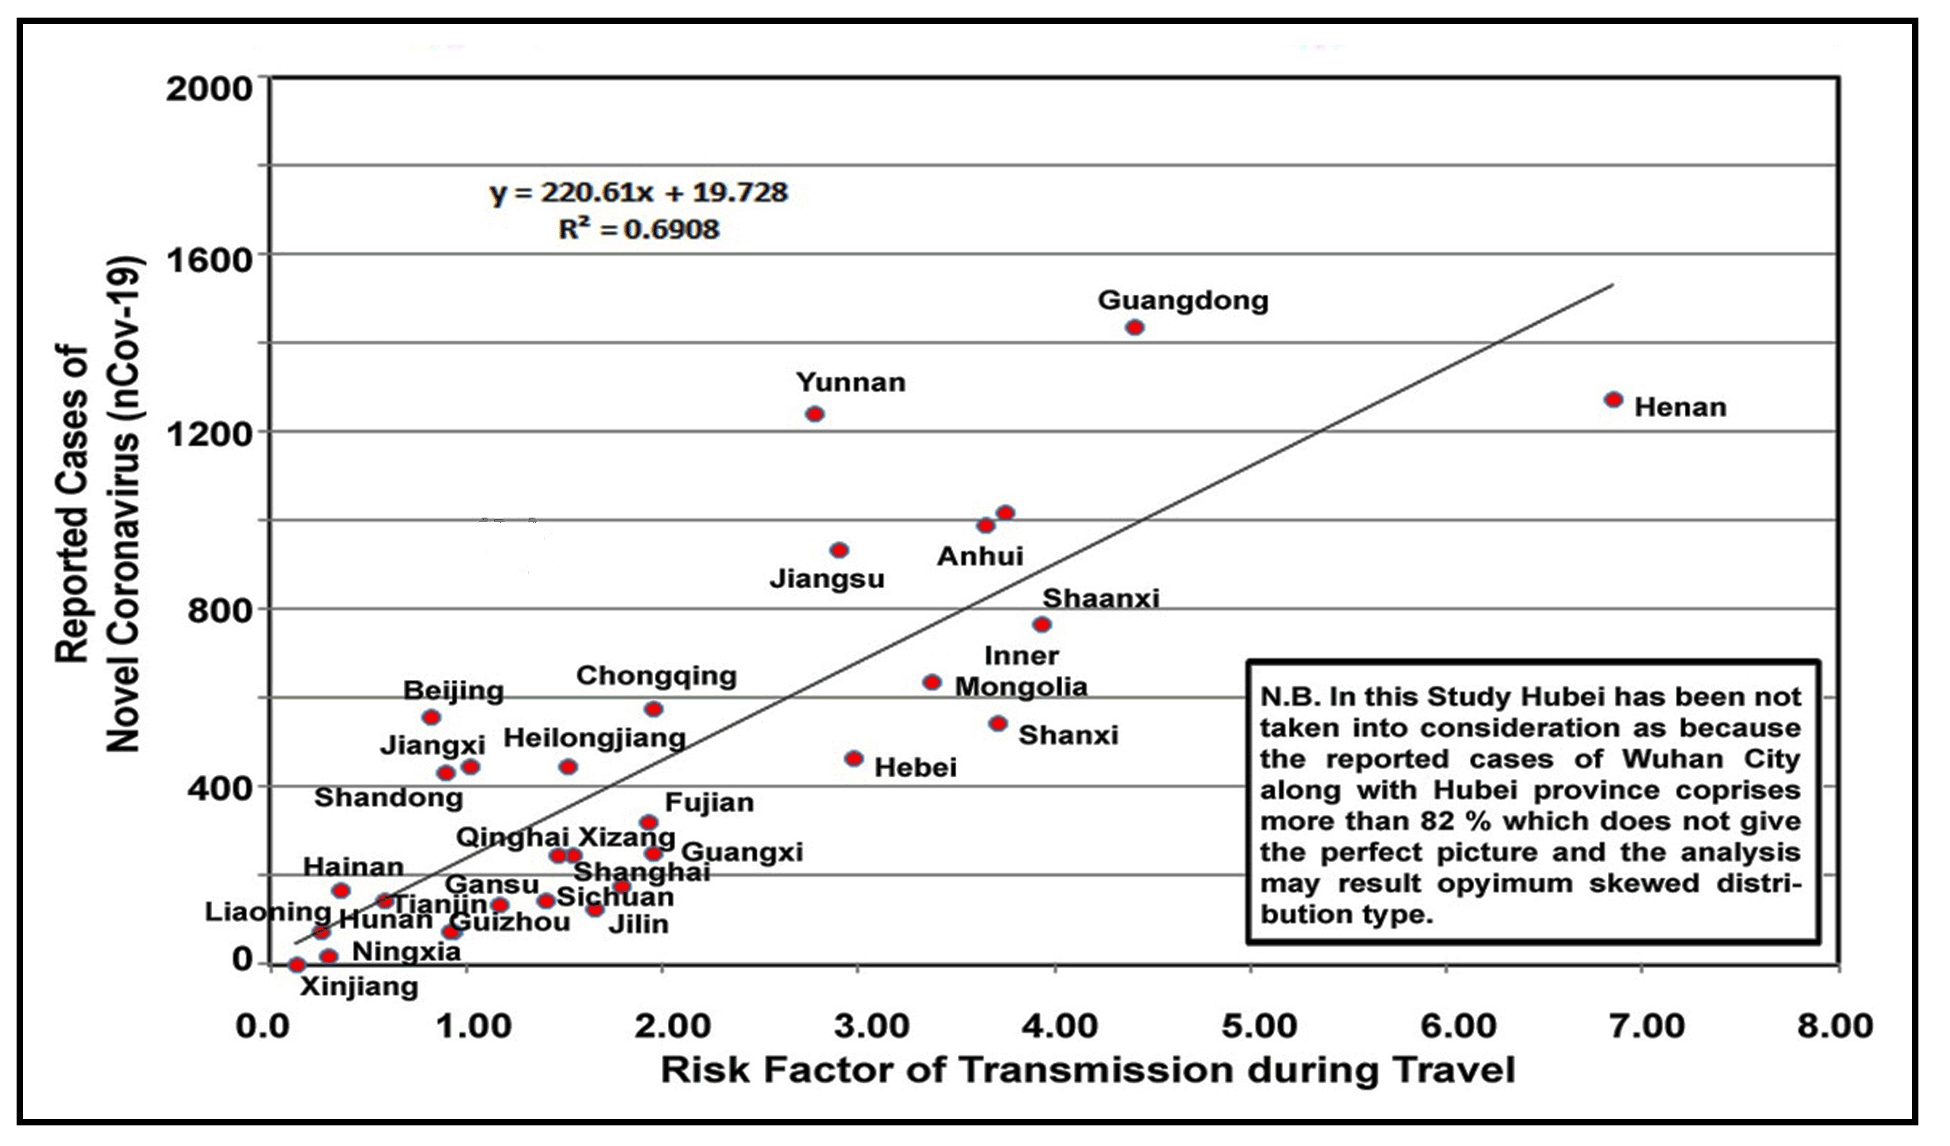
Except Hubei province, Henan gives a critical value of 6.84 having most risk factor. Border of Hubei Province share with Henan and this location makes the area most vulnerable as 2.72% of floating population coming from that province. Henan has experienced on the high positive Novel Coronavirus (nCoV-19) reported cases as before lockdown a huge amount of outward migration took place. Guangdong (RF=4.40) having 1438 cases, Shandong (RF=3.93) having 769 cases, Hunan (RF=3.75) having 1078 cases, Sichuan (RF=3.71) having 547 cases, Anhui (RF=3.64) having 990 cases and Jiangsu (RF=3.36) having 936 cases showing the highly positive correlation with risk factor of transmission. Hebei is the exception with high risk factor (2.97) but control the cases of Novel Coronavirus (nCoV-19). This is because the nearly 60% urban centres taking 3 types of measure to control the transmission which has resulted low number of transmission. Beijing, country’s political capital (RF=0.81) and economic capita, i.e. Shanghai (RF=0.89) have control the reported cases in very appreciable manner with shutdown all inter-city movement after lockdown happened in Wuhan city. Inner Mongolia (RF=0.97), Xinjiang (RF=0.92), Tianjin (RF=0.58), Hainan (RF=0.36), Qinghai (0.29), Ningxia (0.25) and Tibet Region (RF=0.13) having a least risk factor having a small amount of floating population shows a clear lower number in reported Novel Coronavirus (nCoV-19). Only Chonquing province having moderate risk factor (RF=1.94) experiencing a large number of reported Novel Coronavirus (nCoV-19) cases as because of high floating population (nearly 2%) and existence of Chonquing city which has been taken full proof measure at an early stage.
Table 3. Transportation risk of nCoV-19 and controlling variables
|
Chinese
provinces
|
Floating population
(in %)
|
Flight passenger from Wuhan (in %)
|
Risk
Factor of nCoV-19 transportation
|
Chinese
provinces
|
Floating population
(in %)
|
Flight passenger from Wuhan (in %)
|
Risk
Factor of nCoV-19 transportation
|
|
Hubei
|
74.990
|
3.465
|
39.227
|
Liaoning
|
0.142
|
3.147
|
1.645
|
|
Henan
|
6.751
|
6.937
|
6.844
|
Shaanxi
|
0.300
|
2.786
|
1.543
|
|
Guangdong
|
0.608
|
8.193
|
4.401
|
Heilongjiang
|
0.308
|
2.721
|
1.515
|
|
Shandong
|
0.617
|
7.255
|
3.936
|
Shanxi
|
0.242
|
2.685
|
1.464
|
|
Hunan
|
2.517
|
4.981
|
3.749
|
Guizhou
|
0.192
|
2.599
|
1.395
|
|
Sichuan
|
1.392
|
6.020
|
3.706
|
Gansu
|
0.417
|
1.906
|
1.161
|
|
Anhui
|
2.725
|
4.562
|
3.644
|
Jilin
|
0.083
|
1.949
|
1.016
|
|
Jiangsu
|
0.917
|
5.811
|
3.364
|
Inner Mongolia
|
0.017
|
1.826
|
0.921
|
|
Hebei
|
0.483
|
5.457
|
2.970
|
Xinjiang
|
0.042
|
1.797
|
0.920
|
|
Jiangxi
|
2.425
|
3.357
|
2.891
|
Shanghai
|
0.025
|
1.747
|
0.886
|
|
Zhejiang
|
1.392
|
4.144
|
2.768
|
Beijing
|
0.075
|
1.552
|
0.814
|
|
Guangxi
|
0.350
|
3.559
|
1.954
|
Tianjin
|
0.025
|
1.126
|
0.576
|
|
Chongqing
|
1.650
|
2.238
|
1.944
|
Hainan
|
0.042
|
0.671
|
0.357
|
|
Fujian
|
1.000
|
2.844
|
1.922
|
Qinghai
|
0.158
|
0.433
|
0.296
|
|
Yunnan
|
0.092
|
3.487
|
1.789
|
Ningxia
|
0.008
|
0.498
|
0.253
|
3.4 Transmission Dynamics of Novel Coronavirus (nCoV-19) in Africa Continent and Other Parts of the World
Three billion people are in paid employment out of 8 billion world’s population. National and international trade unions always try to make a safeguard of those 3 billion workers welfare not only for them but also for their family. Spreading of Novel Coronavirus (nCoV-19) in the different parts of the world is directly related with such mobility of workers as well as tourism industry (Balcan et al., 2010; Cummings et al., 2004; Munster et al., 2020; Qi et al., 2012). The epidemic converted into the pandemic situation as these two components giving a great stimulus for spreading of nCoV-19 worldwide.
Here, we have attempt to assess the most important factor which may cause the global pandemic applying multiple logistic correlation model. Net migration, GDP, passenger air travel data from Wuhan city to different countries, % of urban population, old age population share, Travel ban data have been used to study the nature of impact on reported cases of Novel Coronavirus (nCoV-19).
The results of multi-linear regression model (MLRM) estimation have been given in Table 2. The adjusted R2 value as well as F-value looked to be quite rational and all the estimated coefficients, except GDP per capita (X2) and old age population share (X5) all other variables namely Net Migration (X1), Air Flight Passenger before Two weeks of Spring Festival in’000 (dataset of 2018) (X3), Share of Urban Population (X4) and, International Tourism (no. of Arrivals) (X1) are found statistically significant. From the Table 2 we got the value of R2 which is representing 85.3% variability of the taken variables accounting the spreading nature of Novel Coronavirus (nCoV-19). The adjusted R2 value (0.811) is lower than the original R2 value as it is taking the sample size in lower number. Dublin-Watson is an indicator by which we can test hypothesis and having statistical significance. If the value lies within 1.5 to 2.5, there will be no serial correlation. But here, this study signifies the serial correlation as the value stands as 1.153. If we consider the F value, it has found 20.361 for the model. As the variables for MLRM increases, the F value will decreases and adjusted R value will increases. In this model, the value of F is justified for 6 variables as the driving factors for spreading of Novel Coronavirus (nCoV-19) along with significance value of 0.001 which denote that the model signifies at 1% level.
Table 4. Determinant factors of Novel Coronavirus (nCoV-19)
|
Country
|
Y
|
X1
|
X2
|
X3
|
X4
|
X5
|
X6
|
|
Developed Countries
|
|
United States
|
215344
|
+954806
|
54225
|
773.3
|
82.06
|
9.73
|
75.61
|
|
*Italy
|
110574
|
+148943
|
35220
|
152.9
|
70.14
|
16.24
|
52.37
|
|
Germany
|
77981
|
+543822
|
45229
|
234.9
|
77.26
|
15.96
|
35.55
|
|
Spain
|
104118
|
+40000
|
34272
|
105.8
|
80.08
|
13.80
|
75.31
|
|
France
|
56989
|
+36527
|
38606
|
137.9
|
80.18
|
13.08
|
82.57
|
|
United Kingdom
|
29474
|
+260650
|
39753
|
190.7
|
83.14
|
12.35
|
10.10
|
|
South Korea
|
9976
|
+43877
|
35938
|
936.6
|
81.52
|
8.62
|
17.24
|
|
Japan
|
2384
|
+347
|
39002
|
1563.3
|
91.53
|
18.49
|
24.04
|
|
Singapore
|
1000
|
+46005
|
83535
|
568.1
|
100.00
|
7.05
|
12.91
|
|
Iran
|
47593
|
+1079043
|
19083
|
N.A.
|
74.39
|
3.18
|
18.05
|
|
African Countries
|
|
Algeria
|
847
|
-10,000
|
13914
|
7.887
|
72.05
|
3.86
|
2.04
|
|
Angola
|
8
|
6,413
|
5819
|
5.994
|
64.84
|
1.36
|
0.40
|
|
Congo
|
22
|
-4,000
|
4881
|
5.248
|
66.46
|
1.58
|
0.22
|
|
Cote-D-Ivoire
|
169
|
-8,000
|
3601
|
3.511
|
50.33
|
2.06
|
1.58
|
|
Egypt
|
779
|
-38,033
|
10550
|
57.516
|
42.71
|
2.89
|
5.26
|
|
Ethiopia
|
29
|
30,000
|
1730
|
18.393
|
20.31
|
2.06
|
0.87
|
|
Gabon
|
18
|
3,260
|
16562
|
2.786
|
88.89
|
2.98
|
0.00
|
|
Ghana
|
195
|
-10,000
|
4228
|
8.211
|
55.41
|
1.95
|
0.90
|
|
Guinea
|
30
|
-4,000
|
1999
|
3.455
|
35.79
|
1.73
|
0.04
|
|
Kenya
|
81
|
-10,000
|
2993
|
13.185
|
26.56
|
1.53
|
1.27
|
|
Mauritius
|
161
|
0
|
20293
|
18.297
|
40.84
|
5.88
|
1.27
|
|
Morocco
|
654
|
-51,419
|
7485
|
16.974
|
61.91
|
4.21
|
10.33
|
|
Mozambique
|
10
|
-5,000
|
1136
|
3.928
|
35.45
|
1.87
|
1.64
|
|
Nigeria
|
174
|
-60,000
|
5338
|
13.734
|
49.52
|
1.45
|
1.89
|
|
South Africa
|
1380
|
1,45,405
|
12295
|
26.405
|
65.85
|
3.05
|
10.04
|
|
Sudan
|
7
|
-1,74,200
|
4467
|
5.433
|
34.37
|
2.03
|
0.74
|
|
Tanzania
|
20
|
-50,000
|
2683
|
8.388
|
33.05
|
1.87
|
1.23
|
|
Tunisia
|
423
|
-40,076
|
10849
|
2.912
|
68.64
|
5.08
|
5.72
|
Y = Reported cumulative cases of Novel Coronavirus (nCoV-19), X1 = Net migration, X2 = GDP per capita (2018), X3 = Air flight passenger before two weeks of spring festival in’000(2018 dataset), X4 = Share of urban population, X5 = Old age population Share (> 70 Yrs.) and X6 = International tourism (no. of arrivals).
Table 5. Correlation matrix
|
Pearson
Correlation
|
|
Y
|
X1
|
X2
|
X3
|
X4
|
X5
|
X6
|
|
Y
|
1.000
|
.681
|
.532
|
.257
|
.375
|
.568
|
.846
|
|
X1
|
.681
|
1.000
|
.400
|
.182
|
.352
|
.266
|
.428
|
|
X2
|
.532
|
.400
|
1.000
|
.614
|
.763
|
.724
|
.602
|
|
X3
|
.257
|
.182
|
.614
|
1.000
|
.528
|
.612
|
.327
|
|
X4
|
.375
|
.352
|
.763
|
.528
|
1.000
|
.622
|
.487
|
|
X5
|
.568
|
.266
|
.724
|
.612
|
.622
|
1.000
|
.730
|
|
X6
|
.846
|
.428
|
.602
|
.327
|
.487
|
.730
|
1.000
|
Y = Reported cumulative cases of Novel Coronavirus (nCoV-19), X1 = Net migration, X2 = GDP per capita (2018), X3 = Air flight passenger before two weeks of spring festival in’000(2018 dataset), X4 = Share of urban population, X5 = Old age population Share (> 70 Yrs.) and X6 = International tourism (no. of arrivals).
Table 6. Model Summery for MLRM
|
R
|
R2
|
Adjusted
R Square
|
Std. Error of
the Estimate
|
Durbin-Watson
|
F
|
Sig
|
|
.924a
|
0.853
|
0.811
|
0.0622
|
1.153
|
20.361
|
0.001
|
- Predictors (constant): VAR0001, VAR00002, VAR00003, VAR0004, VAR00005, VAR00006
From stepwise regression model, four factors out of six has been explained which have significant relation for regional livelihood diversification (Table 3). The role of international tourism has been found with a higher coefficient value (0.720) with more than 7% contribution along with statistically significant at 1% level (ρ<0.01) of significance. Reported cases of Novel Coronavirus (nCoV-19) value is clearly relate with international tourism characteristics as this is basically due to the H2H transmission and higher degree of movement having without showing any symptoms for the disease make the situation more vulnerable and perilous.
Air flight passenger from Wuhan city to different destinations has been found statistically significant (p<0.05) with a positive coefficient (0.698) which indicates that the outbound travel from Wuhan city, where the first outbreak of Novel Coronavirus (nCoV-19) has intimated and within two to three weeks it has spread like anything. Within this period of time thousands of population went to different parts of the world to enjoy their Spring holiday. This travel movement has made the situation worse in today’s context.
The value of net migration has been found a significant and positive effect on the level of reported cases of Novel Coronavirus (nCoV-19) respondents by 4.24%. As the Western countries have a huge amount of immigration for the economic growth purpose, the serious condition has been found in those countries. For the last few years, due to China’s Belt and Road Initiatives, huge amounts of Chinese population have migrated in different countries. Due to Wuhan outbreak and internal travel ban took place after 23 January 2020, most of the people return back and the situation came into focus after 20 February 2020. Most of the countries with Belt and Road initiatives have face a large number of Novel Coronavirus (nCoV-19) cases at the end of February 2020. Share of urban population found a positive impact on the reported cases of Novel Coronavirus (nCoV-19). The co-efficient has been found statistically significant at 1% level of significance. As the urban area has most mobility and this virus can easily spread through cough and sneezing by human transmission, the figure can easily ride up to any stage. New York City for USA, Madrid for Spain, Milan and Rome for Italy, Frankfurt for Germany, Teheran for Iran Seoul for South Korea, Tokyo for Japan, Johannesburg for South Africa, and Cairo for Egypt are the best example from where this pandemic have taken a great spike after third week of February 2020.
Table 7. Determinants of Novel Coronavirus (nCoV-19) derived by stepwise regression
|
Variable
|
Unstandardized coefficients
|
Standardized coefficients
|
|
B
|
Std. error
|
Beta
|
t
|
Sig.
|
|
Intercept
|
41.704
|
15132.809
|
|
0.003
|
0.998
|
|
Net Migration (X1)
|
0.070
|
0.017
|
0.485
|
4.177
|
0.001*
|
|
GDP per Capita (2018) (X2)
|
0.184
|
0.387
|
0.075
|
0.476
|
0.639
|
|
Air Flight Passenger before Two weeks of Spring Festival in’000 (2018 dataset) (X3)
|
-0.105
|
15.945
|
0.698
|
2.007
|
0.005*
|
|
Share of Urban Population (X4)
|
-375.78
|
301.783
|
0.424
|
1.245
|
0.002*
|
|
Old Age Population Share (> 70 Yrs.) (X5)
|
-163.13
|
1496.438
|
0.018
|
-.109
|
0.914
|
|
International Tourism (no. of Arrivals) (X6)
|
1433.79
|
271.513
|
0.720
|
5.281
|
0.001*
|
|
a Dependent Variable: VAR00001
|


 ,
Subhasis Bhattacharya 1
,
Subhasis Bhattacharya 1