1 . INTRODUCTION
In large areas worldwide, aquifers are the primary supply of fresh potable water, particularly in the areas where reclaimed water availability is poor. Subsurface water resources are anticipated to have 50% share from the global provision of safe water reserves (Vives, 2003). In rural parts of India, public dependency on groundwater for consumption purposes is 85% (Pahuja et al., 2010). But many areas are facing the problem of rapidly depleting saturated thickness in both confined and unconfined aquifers, unbalancing recharge-discharge equilibrium (Maggirwar and Umrikar, 2011). In order to facilitate sustainable management, there is a need to adopt systematic groundwater governance (Gaikwad et al., 2018). Hence, conventional as well as non-conventional artificial recharge techniques are employed in such regions. India being a monsoonal country where maximum rainfall takes place in June-September, it is observed that majority of rainwater is formulated as runoff causing soil erosion and floods. One such technique in enmeshing and availing this storm water is creating a succession of small-scale water harvesting structures (WHSs) across the seasonal streams. These WHSs not only benefit in saving surface water runoff, but also provide water for consumption to the inhabitants, wildlife, flood prevention, siltation down the streams, soil conservation, increasing vegetation in the vicinity, providing water for irrigation, etc. (Sur et al., 2001). But, identification of proper sites for WHSs needs careful consideration of methods and physical framework of a watershed covering factors such as climate, topography, geology, drainage network, hydrogeology and hydrology so as to derive maximum benefit out of these structures (Khan and Moharana, 2002; Maggirwar and Umrikar, 2009; Singh et al., 2013; Kadam et al., 2017a).
There are several methods available for the site selection of water harvesting structures (Rajasekhar et al., 2020; Abdullah et al., 2020; Husen et al., 2020) and the aspects like design of the dam for water harvesting (Grum et al., 2017; Vema et al., 2020; Mandal et al., 2020), role of water harvesting in agricultural drought (Dile et al., 2016; Nyagumbo et al., 2019; Reddy et al., 2020), efficacy of such structures was studied by different workers (Narayana and Sastry, 1986; Al-shabeeb, 2015; Kadam et al., 2017b). Sur et al. (2001) studied about the impact of WHSs in the Shiwalik foothills of northern India and found that there was rise in the groundwater levels and increase in vegetation in the vicinity of WHSs. Quessar et al. (2008) discuss about evaluation tools such as SWAT modeling in understanding WHSs impact. Previous studies reveal that technological advancement has provided sophisticated tools for collecting various kinds of spatial and non-spatial information to generate a sound database for watershed characterization (Umrikar, 2017). But at the same time functionality, efficacy and impact made by these structures have not been monitored or assessed. There are very few indices or guidelines proposed in this regard.
The groundwater in hard basaltic terrain of Maharashtra characteristically restricts to the secondary porosity combined with distinct morphological control on hydro-dynamics. Moreover, a large area in the state experiences deficiency of soil moisture and high potential evaporation rates that affect the recharge processes. Apart from this, the aquifers from drought prone zones get partially saturated that result in poor dug well yields. The measures like adoption of water harvesting, conservation and recharge techniques supported with the other watershed development activities have been found effective (Umrikar, 2000). Since last few decades, governmental as well as non-government organizations have taken up the task of constructing water augmenting structures on large scale involving local villagers. Ministry of Jal Shakti (2019) is promoting the construction of WHSs in water stressed districts. CGWB (2007) have already provided guidelines for construction of these structures. However, construction of WHSs requires large amount of labor and financial aid. In the present scenario, building WHSs itself requires 5 to 40 lakhs depending upon the type, size and location (Lasage and Verburg, 2015). Hence, it is important to timely assess its technological and lucrative accomplishment, its construction durability, long-term impacts, profit to local farmers and ecological benefits. But, unfortunately the evaluation of feasibility and functionary of these structures and its impact on hydrogeological set-up of that region has not been timely and regularly performed. Keeping this research gap in view, the main objective of the present study has been conducted at nine locations to understand the impact on water resources.
4 . RESULTS AND DISCUSSIONS
4.1 Geomorphology
Geomorphological assessment is helpful in understanding the groundwater availability, flow pattern and most importantly its potentiality in a particular region (Deshmukh et al., 2011). The study region characteristically represents the landforms of volcanic province, such as Mesa, denudational hills and dissected plateau, etc. From the geomorphological map, it is clear that maximum area is covered by Deccan plateau (Figure 3) which can only be differentiated by the degree of weathering and erosion. A weathered plateau of the area contributes toward towards high groundwater prospect which is prominently observed along river.
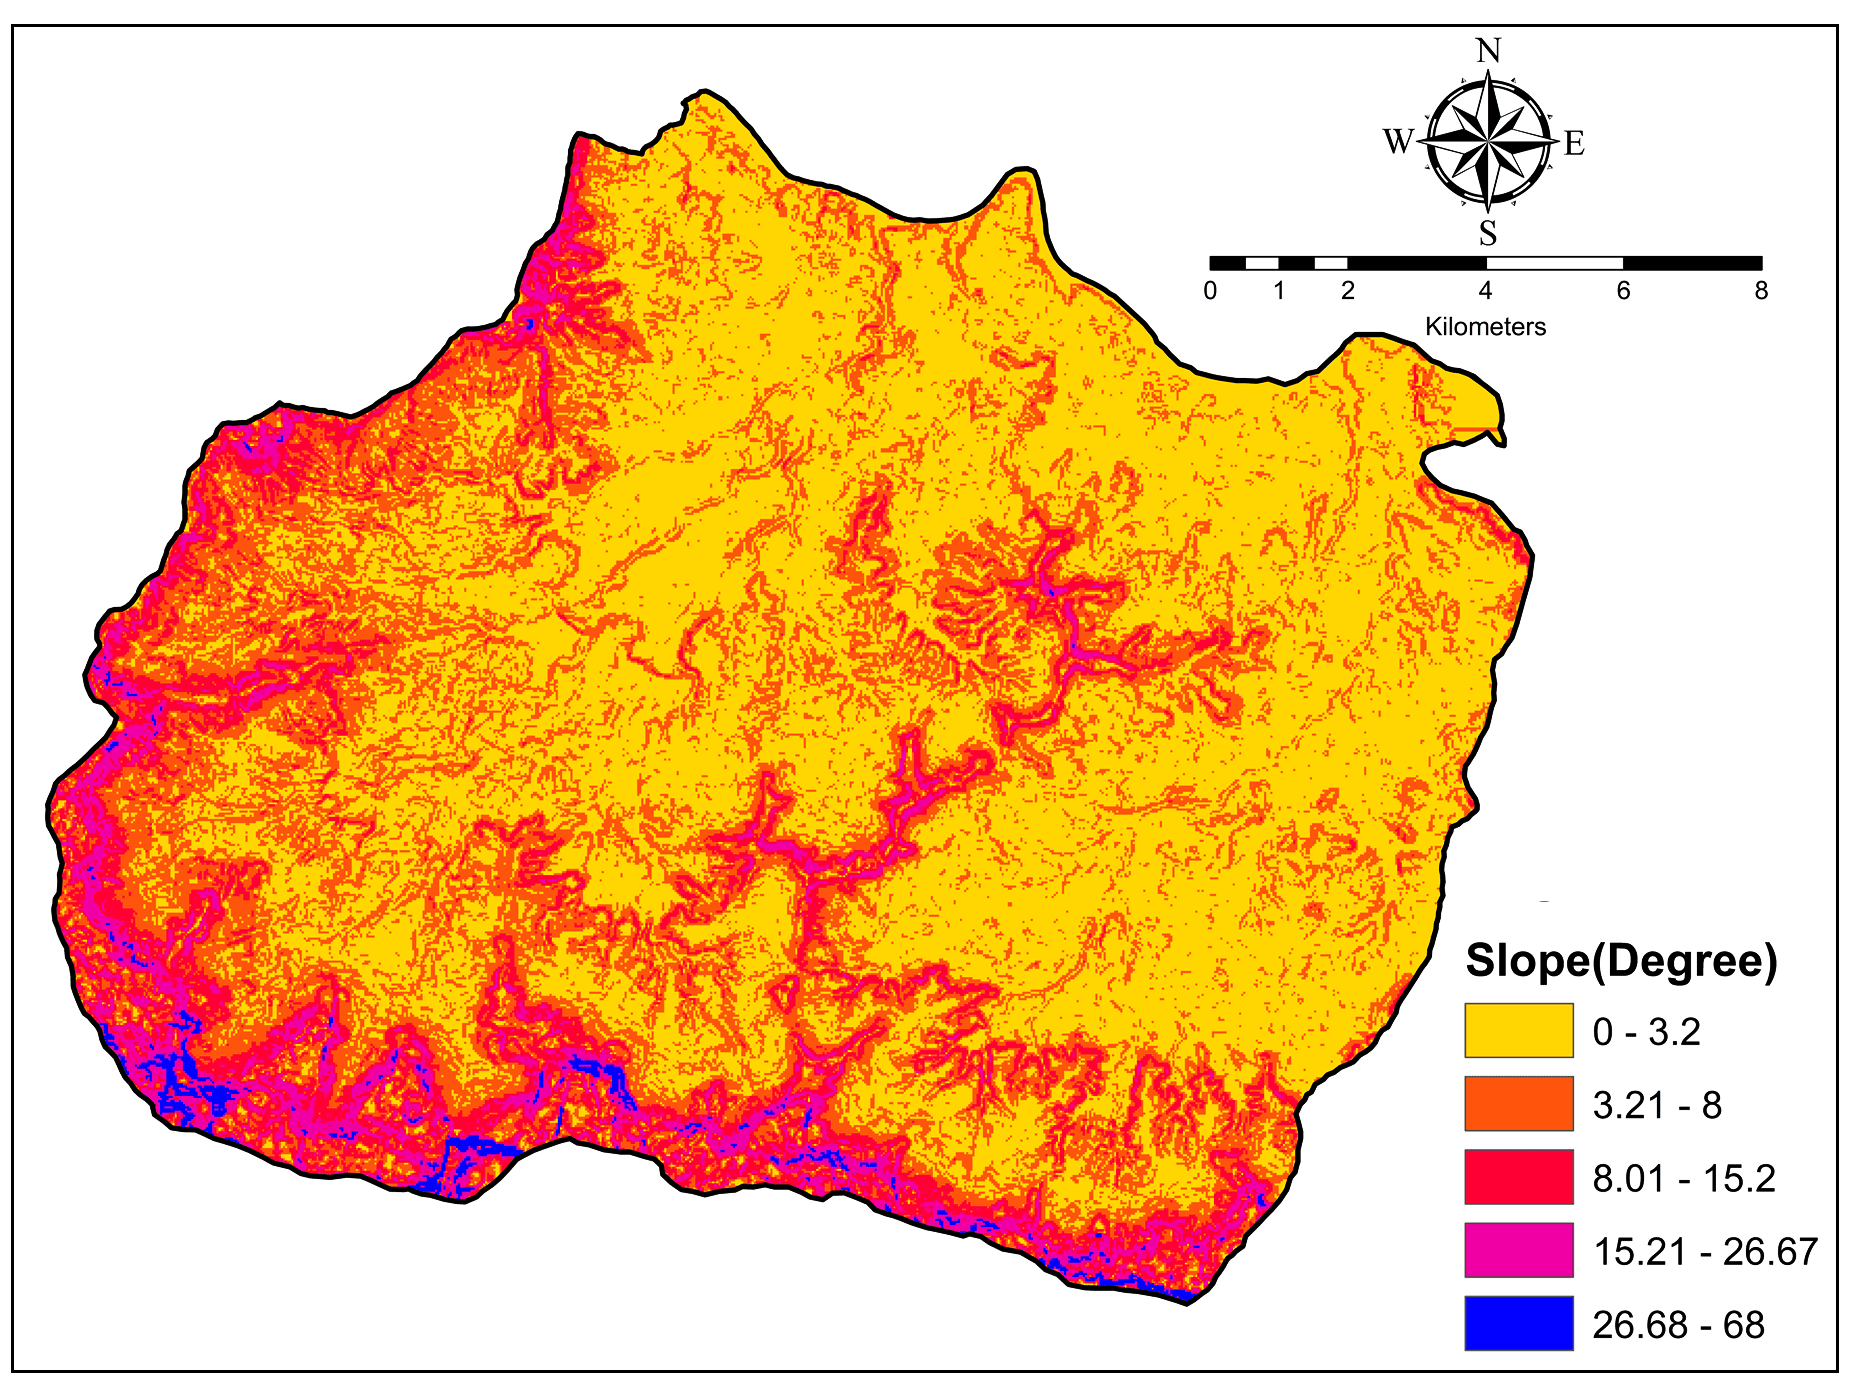
4.2 Slope
Slope is a substantial impacting component which is able to influence the hydrological approaches namely runoff, recharge as well as ground impediment duration (Kadam et al., 2012). Gentle class is assigned to the areas having 0-3º slope which indicate the high infiltration whereas the moderate class denotes the land with 3-8º slope, which signifies slightly undulating topography with some infiltration. Slope of 8-15º lead to relatively high runoff and low infiltration and fall under the moderately strong class. A slope between 15º and 26º follow the strong land slope class and ultimately, area with slope >26º are considered as steep. The majority of land falls in 0-3º and 3-8º slope categories which indicate gentle to moderate slope (Figure 4) wherein steep slopes are observed towards the southern boundary of the watershed.
4.3 Drainage Network and Drainage Density
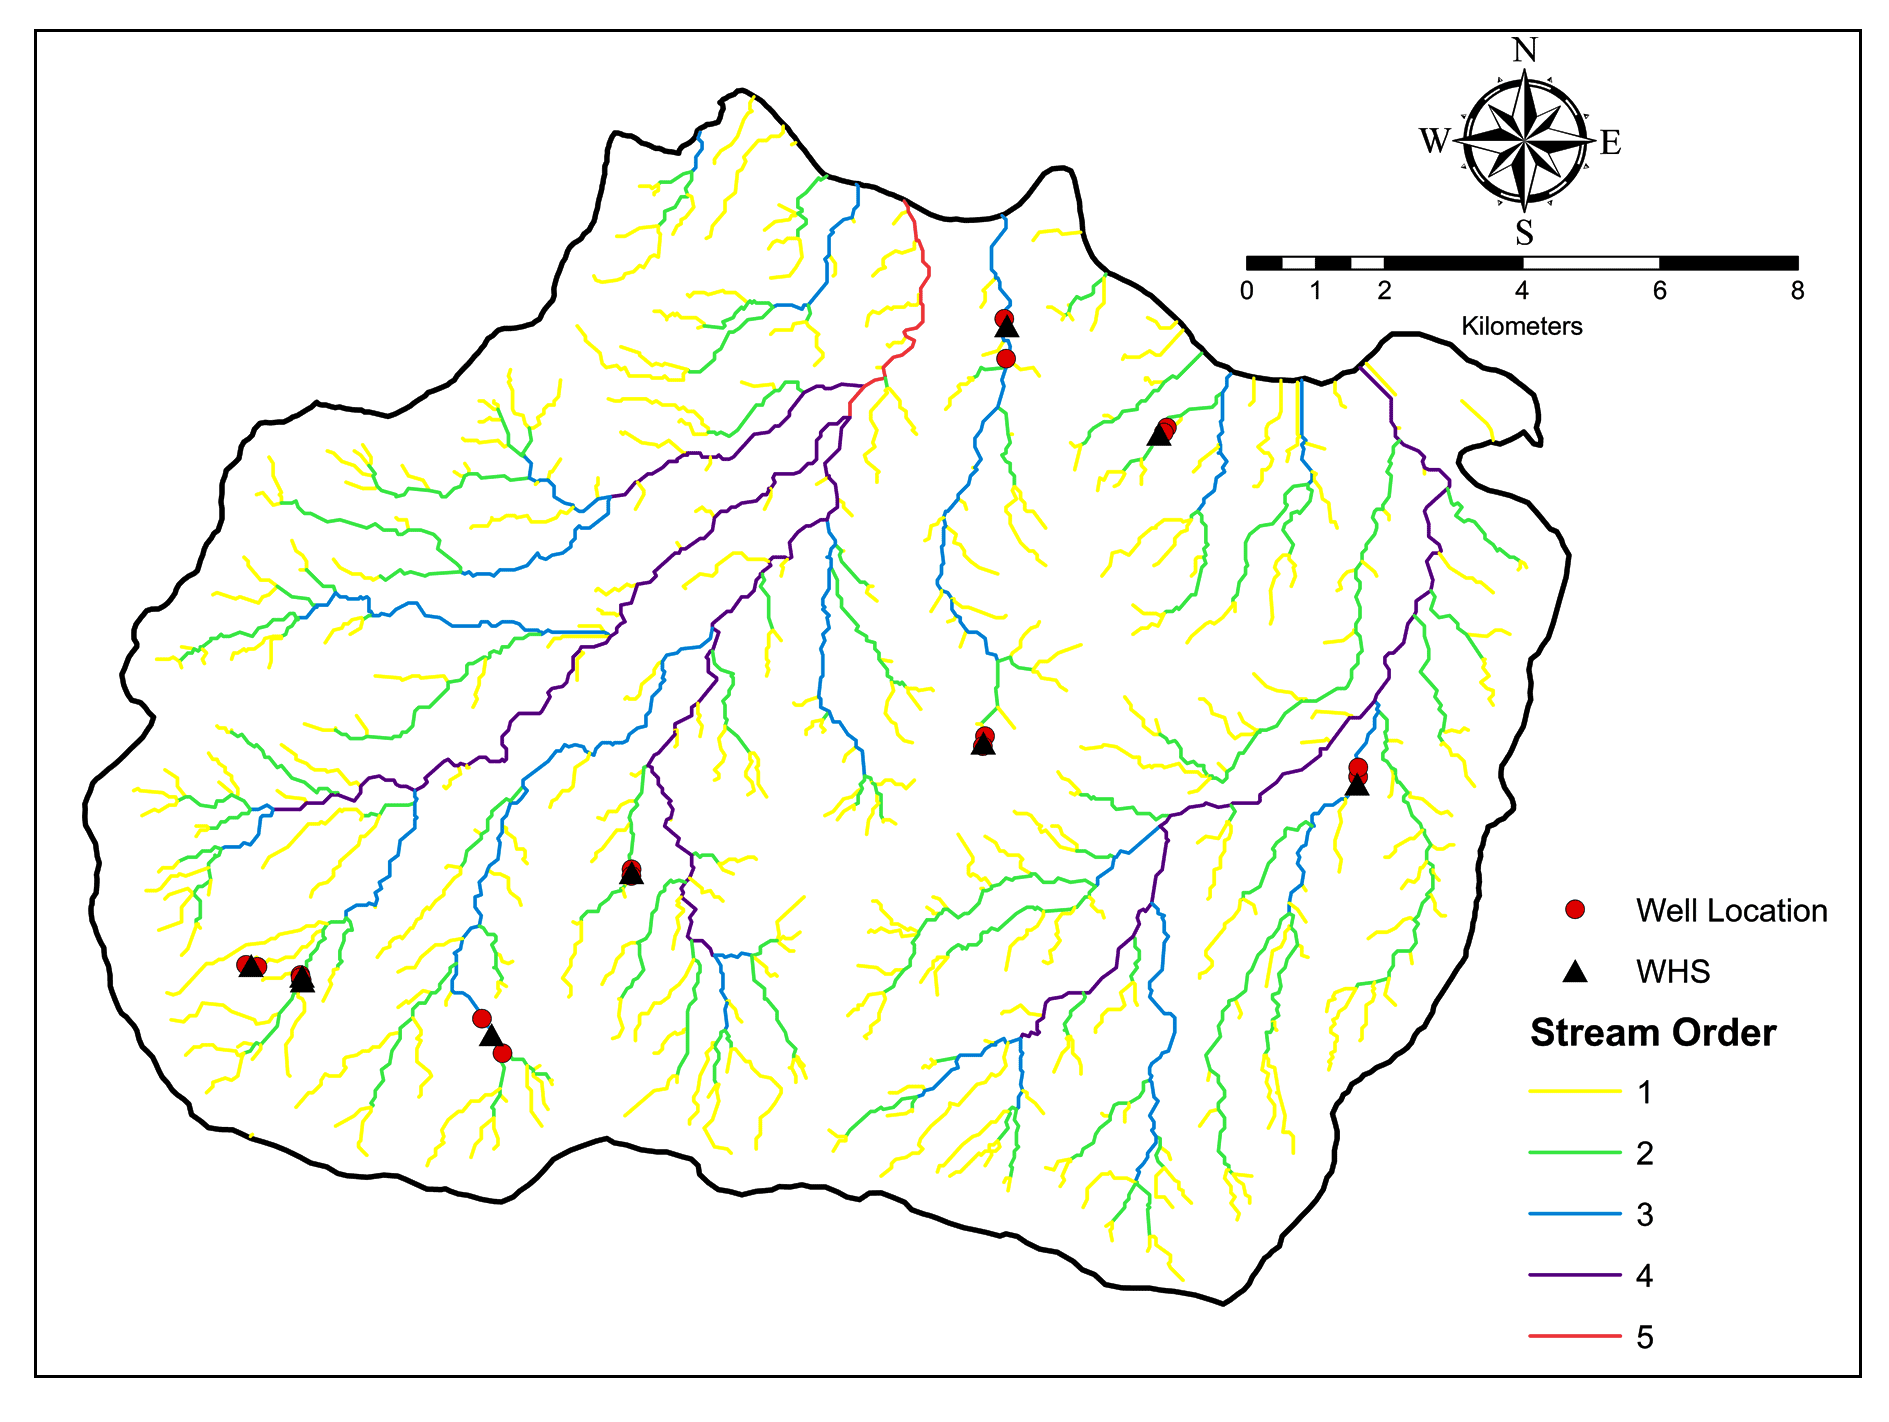
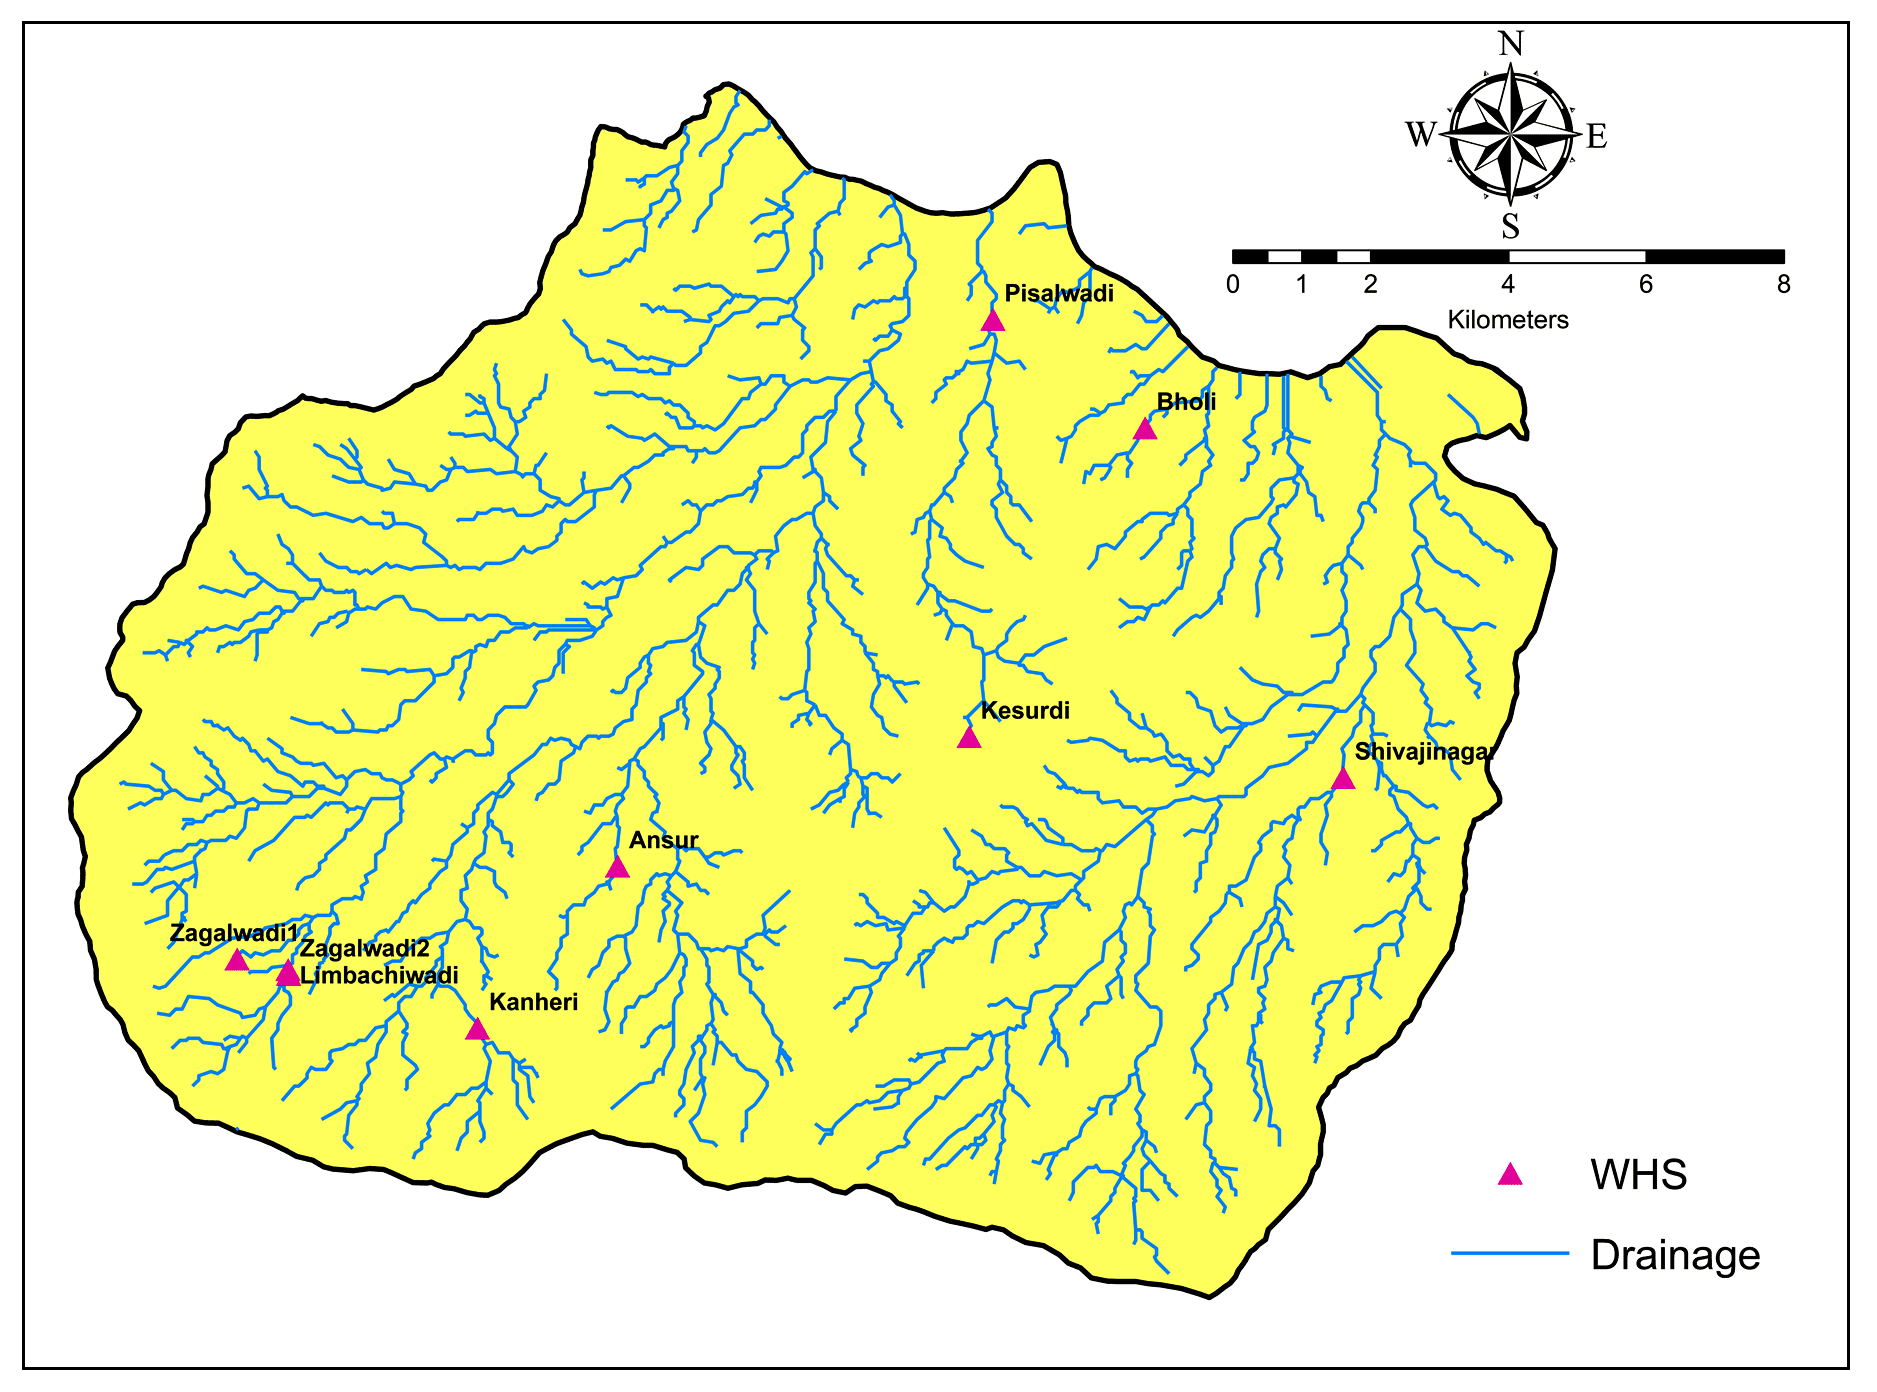
Drainage network and density are characteristic features that show resemblance with respect to lithology (Day, 1980). Drainage pattern observed is mostly dendritic in nature and shows parallel to sub parallel arrangements in first order streams (Figure 5).
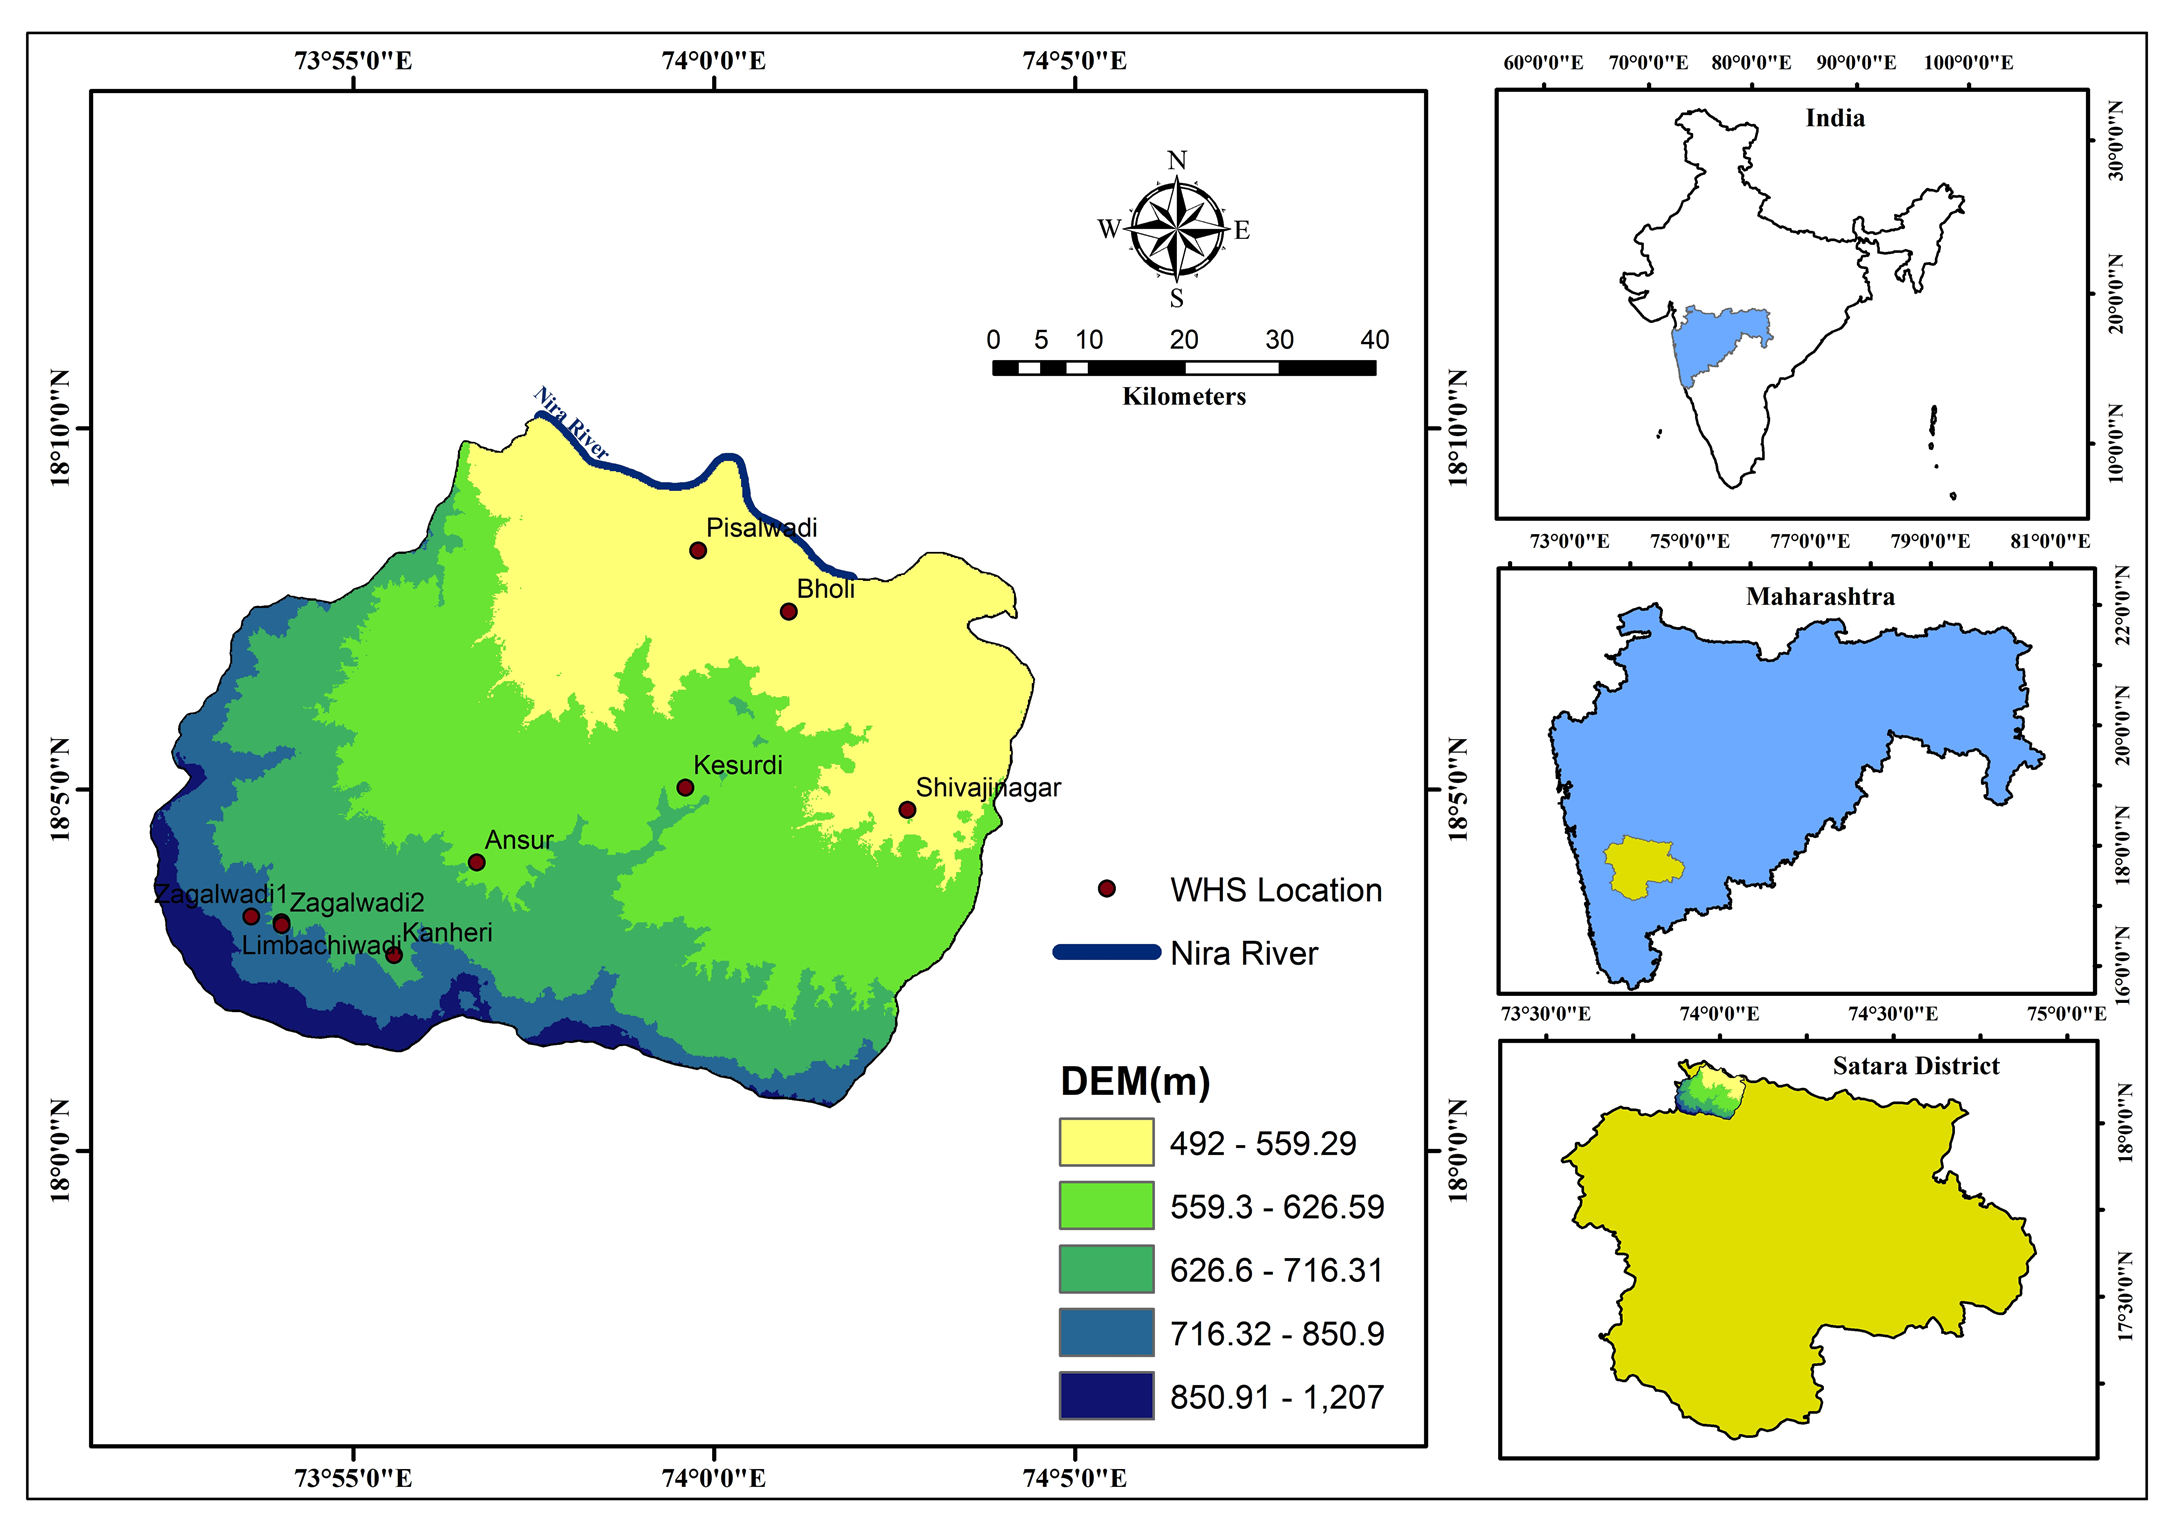
The area represents a fifth order drainage basin, based on Strahler’s (1952) stream ordering method. Out of which, Zagalwadi 1 and Kesurdi WHSs are constructed on a first order stream while at Kavathe, Zagalwadi 2, Bholi, Limachiwadi WHSs are built on second order stream and on the third order stream Kanheri, Shivajinagar, and Pisalwadi WHSs are built. The catchment areas for all the structures vary according to stream orders. Thus, Kesurdi has the smallest catchment and Pisalwadi has largest catchment area.
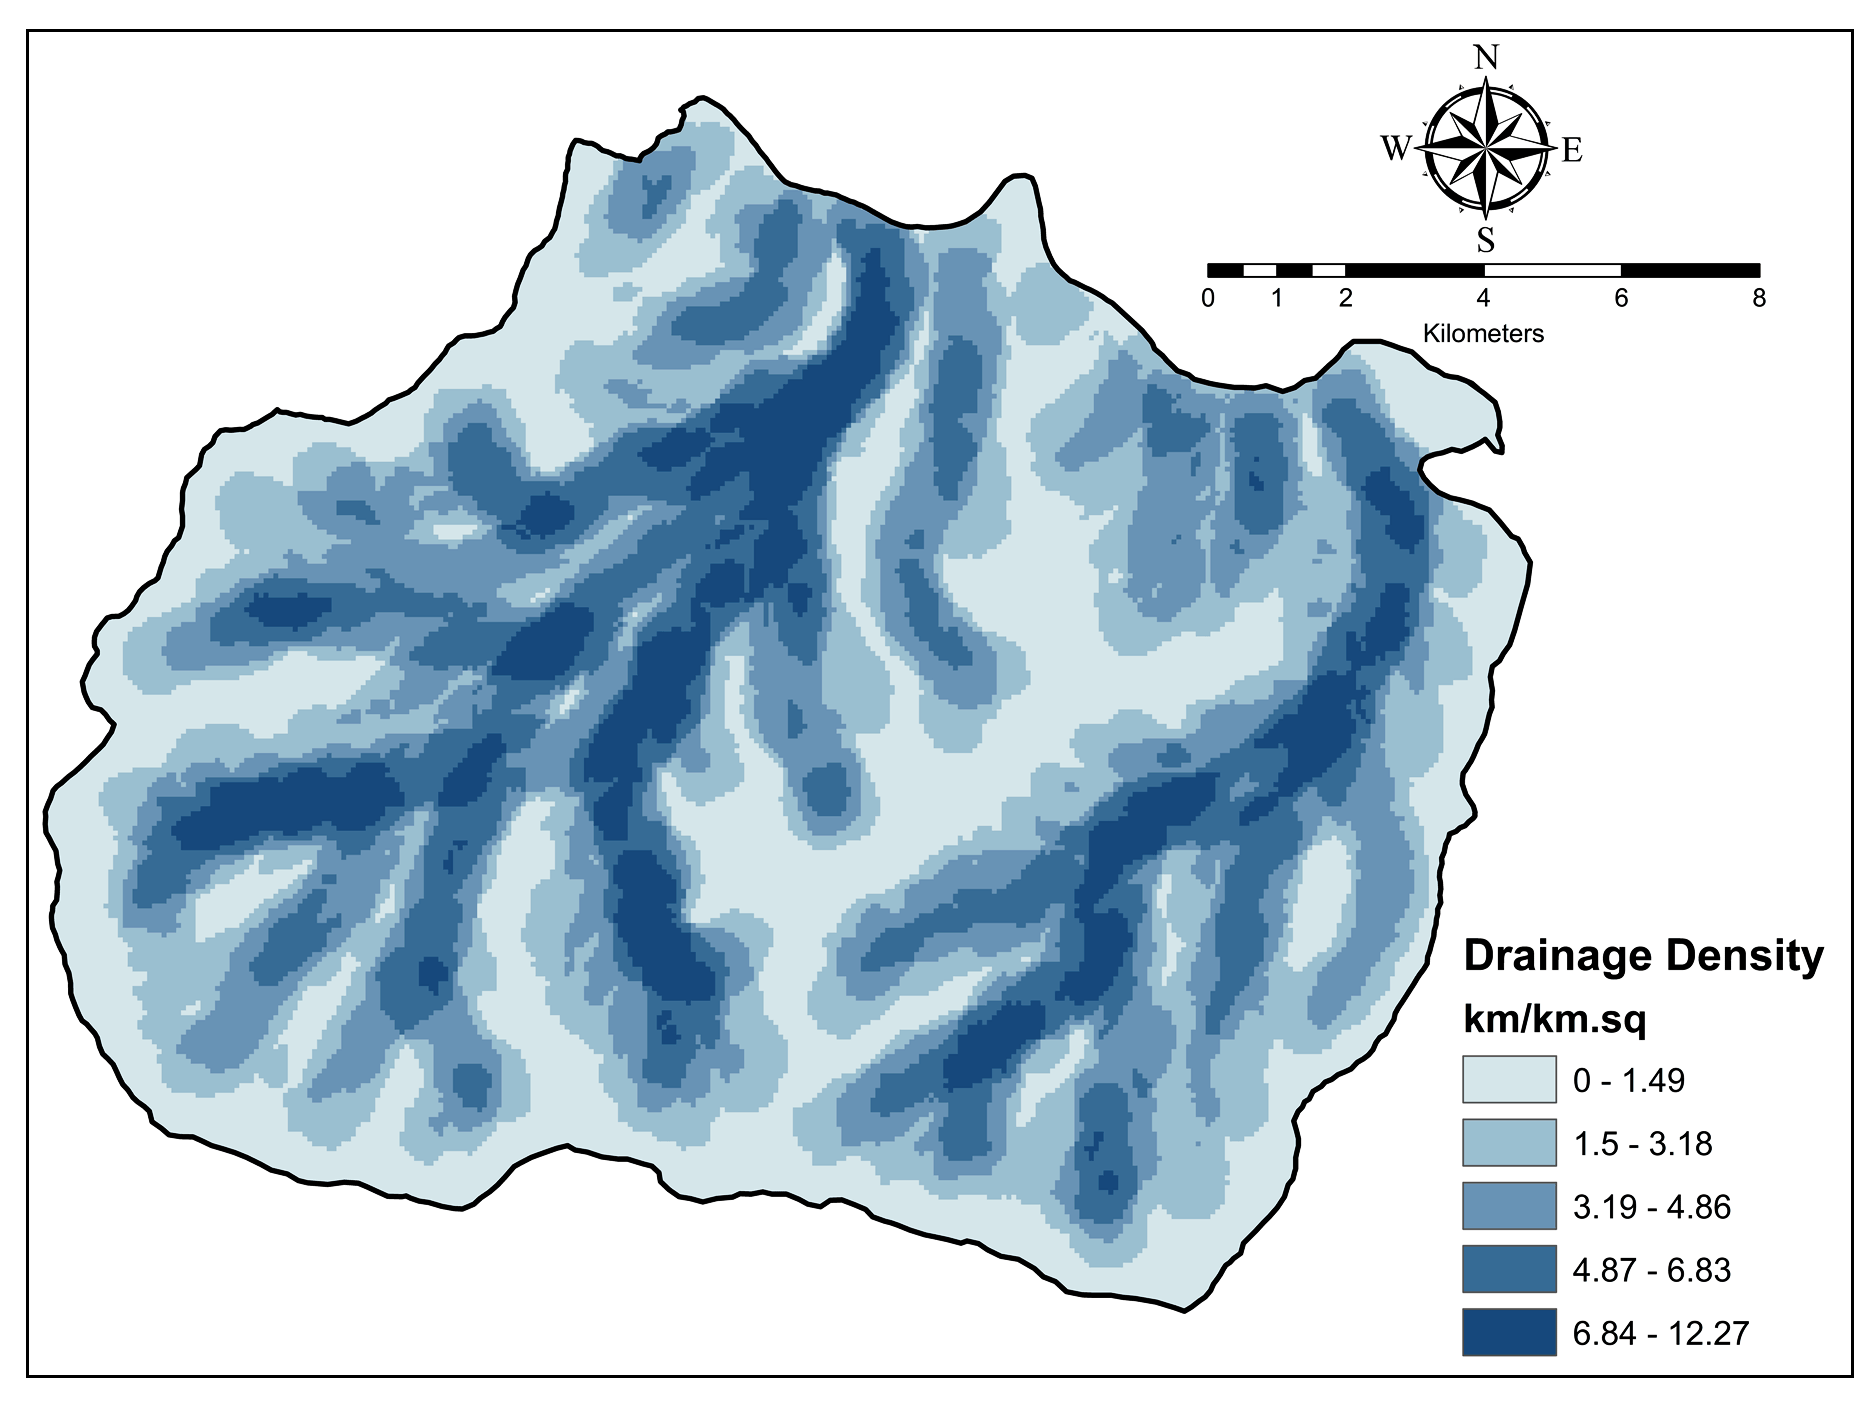
Higher drainage density indicates high surface runoff. Five classes are generated to depict the variation in drainage density. The classes assigned are very low, low, moderate, high and very high. Central part of the study region shows high to very high drainage density (Figure 6).
4.4 Geology
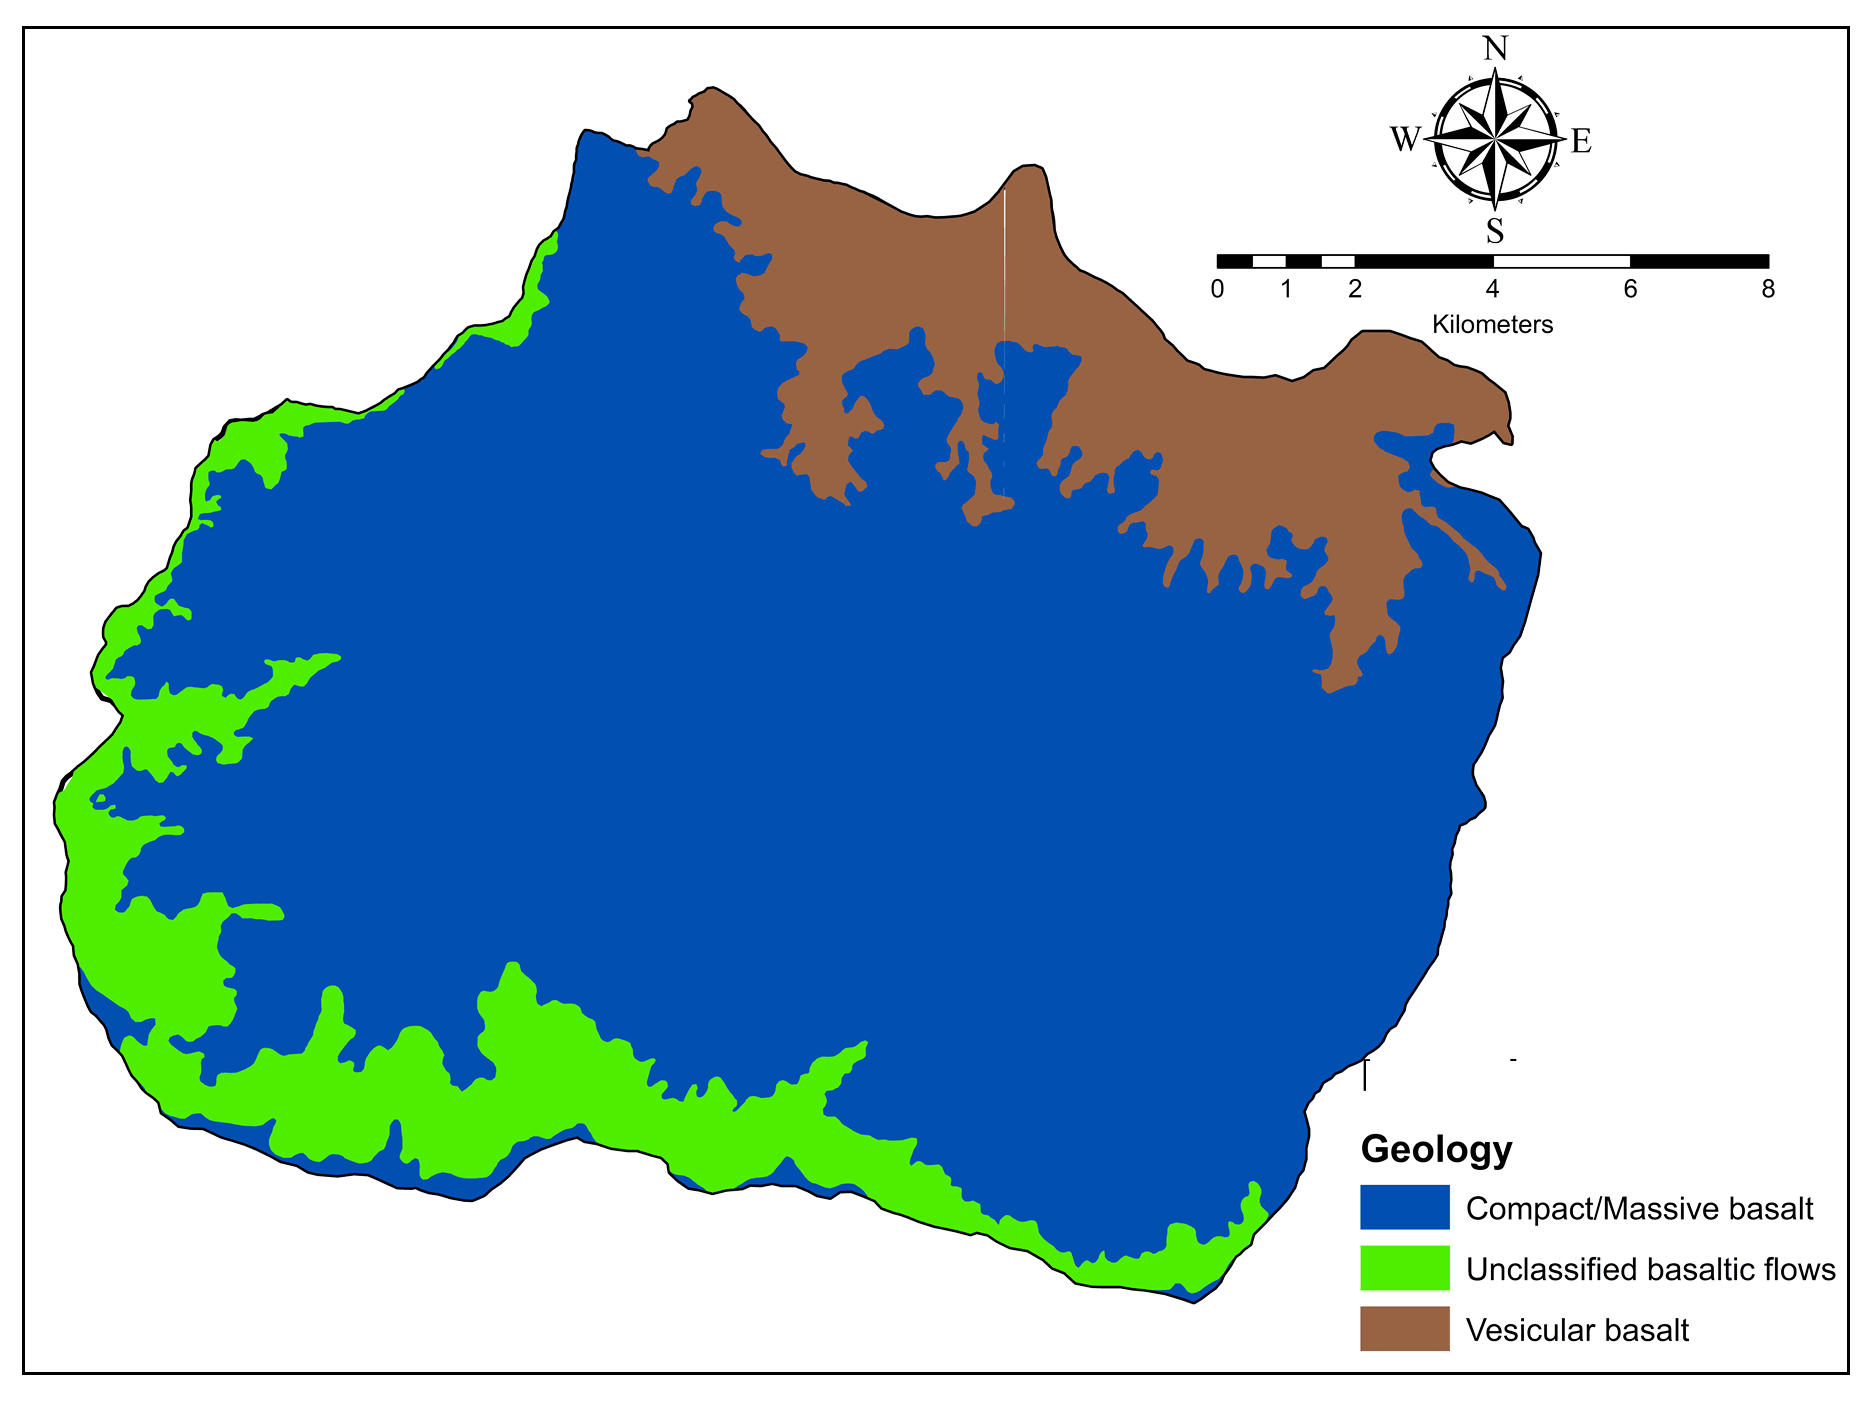
The study area belongs to the Nira basin, and is covered completely by basaltic flows of cretaceous-paleocene age, with occurrence of alluvium along the sides of river. Lithological mapping of the region was conducted by Geological Survey of India. The Geological Map of study area is generated on the basis of DRM of GSI on a scale of 1:25,000.
The lava pile exposed in the area is comprised of the Diveghat, Purandargarh formation and the Mahabaleshwar formation belong to Wai Subgroup of the Sahyadri group of Deccan Trap Super group. Wai Formation is the youngest, situated over the Lonavala Subgroup and constituents beyond 50% of entire stratum of Deccan basalt with five formations (Beane et al., 1986; Peng et al., 1994). Entire subgroup is made up of Simple flows alongside entrenched flow tops, tiny plagioclase laths, pyroxene and olivine (Beane et al., 1986). In general, flow composition of Wai supergroup is more evolved as compared to corresponding flows, although GPBs with the most evolved compositions are lacking (Beane et al., 1986). There are three types of basalt; namely: compact basalt, vesicular basalt and unclassified basalt observed in the watershed. Vesicular basalt is prominently observed along the Nira River that has the highest recharge rate (Figure 7). Fractures and joints, both vertical and horizontal in nature are frequently seen in basalt and denote the secondary porosity (Ramakrishnan and Vaidyanadhan, 2010). The overall porosity of the area is low as the compact basalt is impervious. Only two WHSs namely: Pisalwadi and Bholi had built on vesicular basalt which indicate high rate of recharge through WHS in the aquifer. Rest all other WHSs are built on compact and unclassified basalt.
4.5 Soil
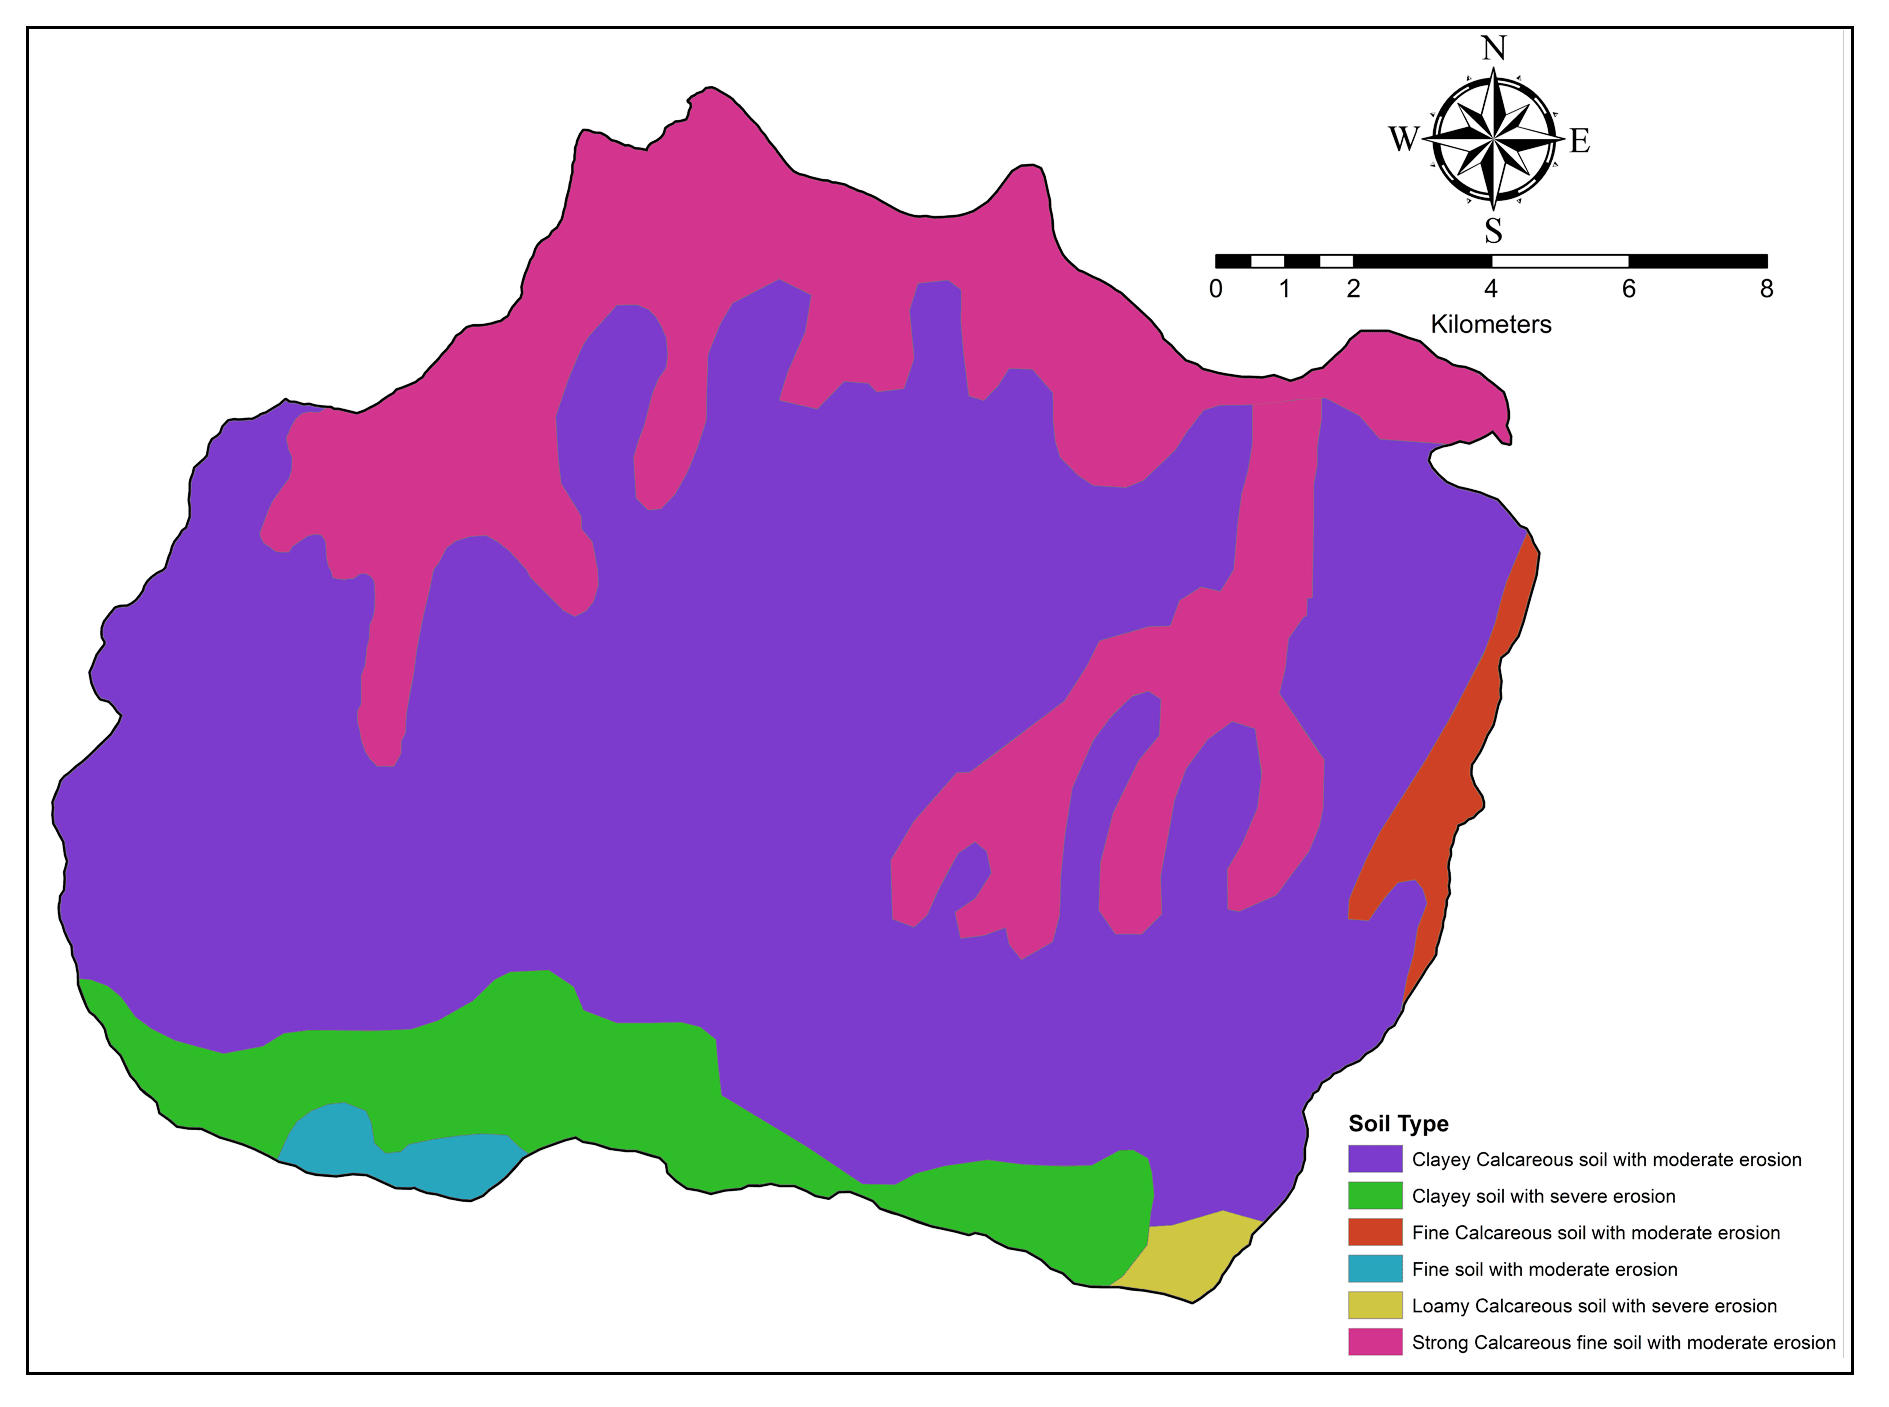
The type of soil is determined by the texture, strength, composition, pore size distribution, etc. which further controls its porosity, permeability and infiltration capacity (Osunbitan et al., 2005). The soils of the area are mainly derived from basalts (Figure 8). The soil types observed in the area are mostly calcareous, clayey, loamy and fine soil. If the clay content is increasing in the soil then it slows down the infiltration rate. The soil derived from basalt generally contains montmorillonite and kaolinite clay minerals.
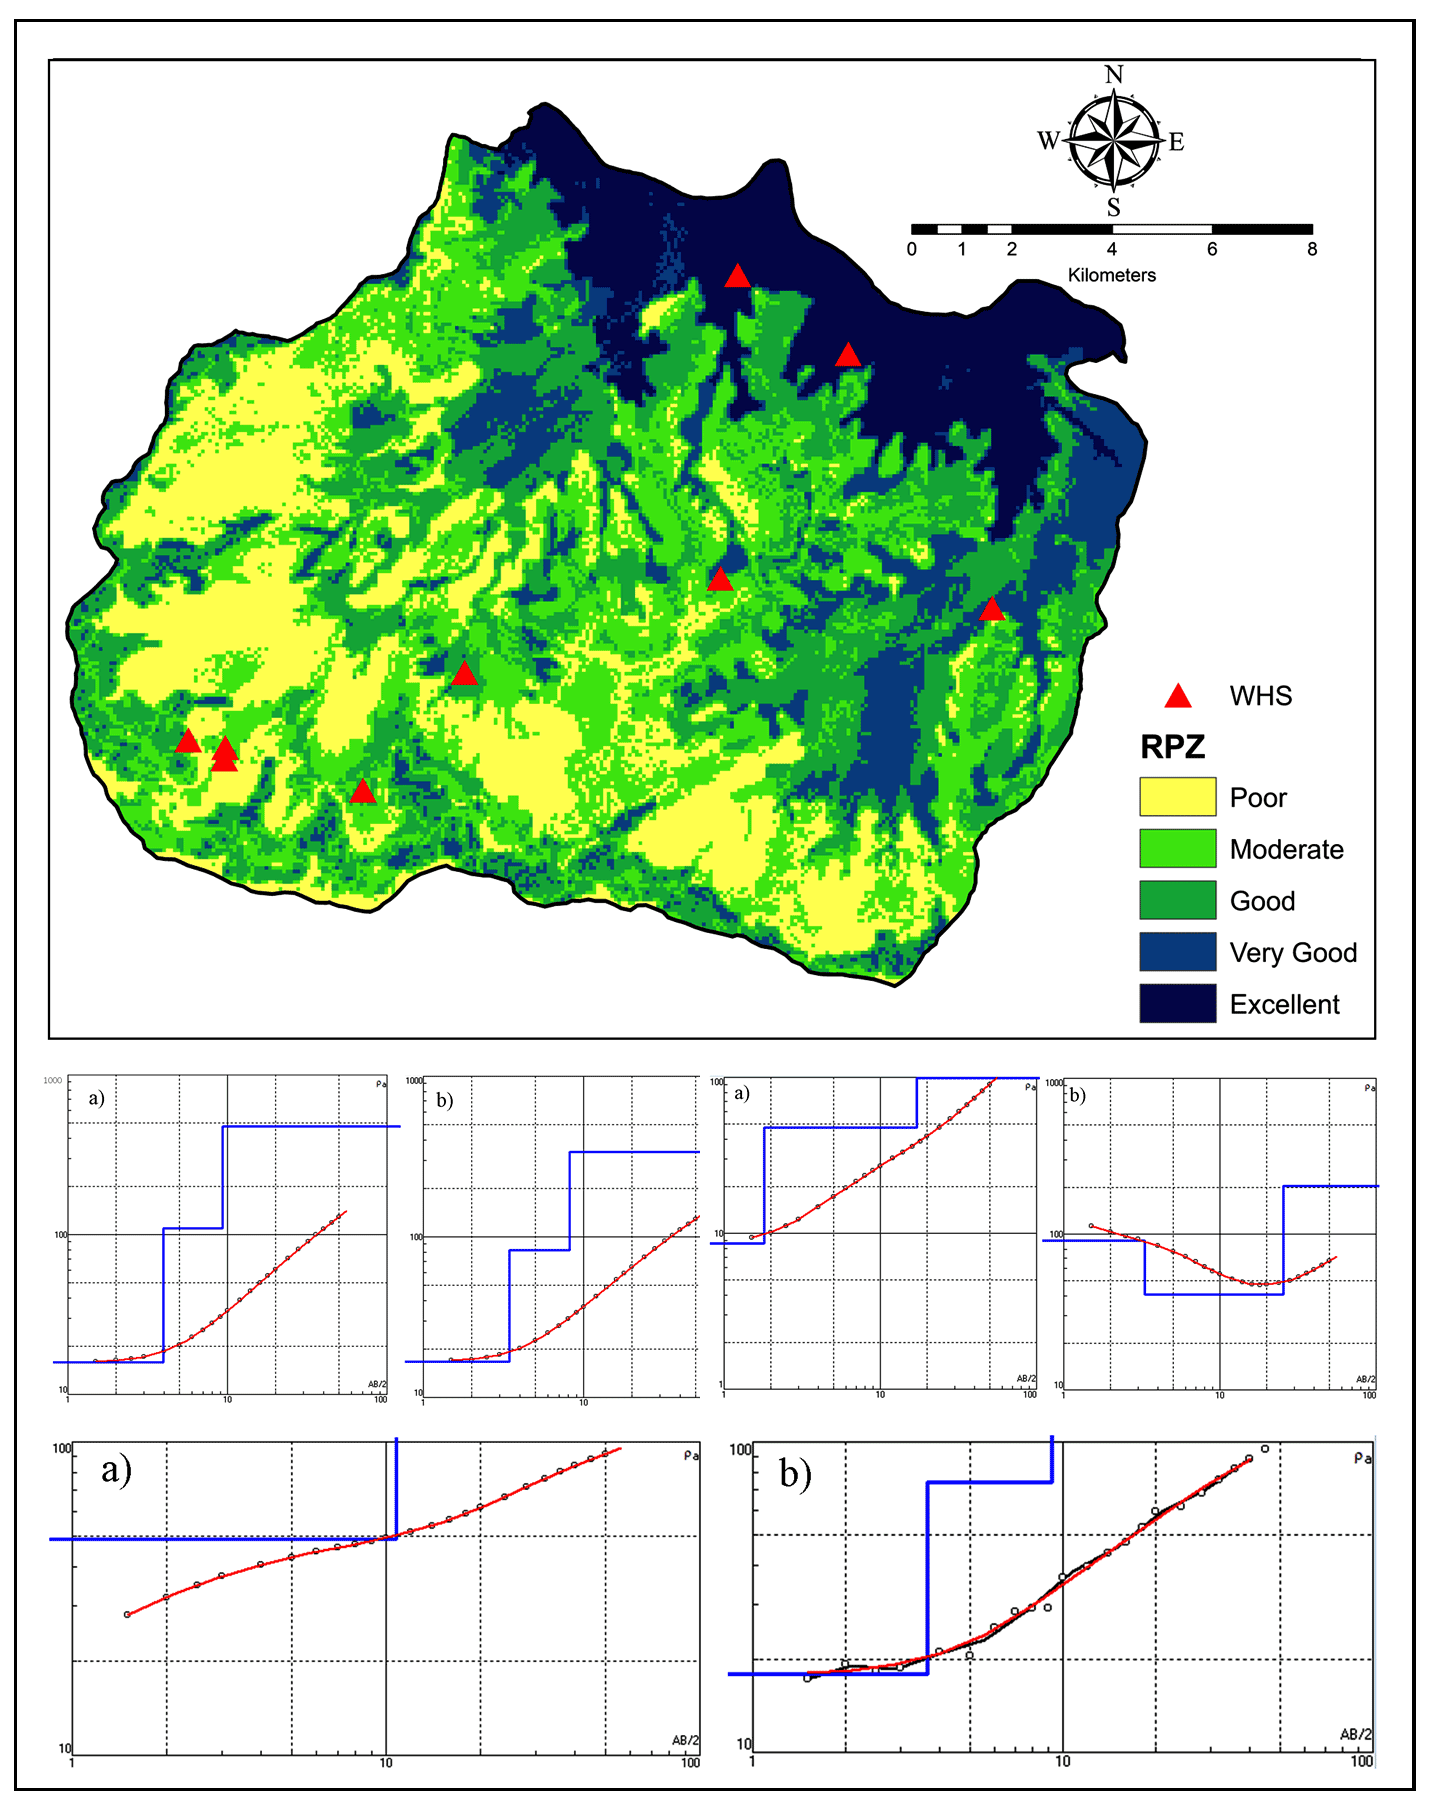
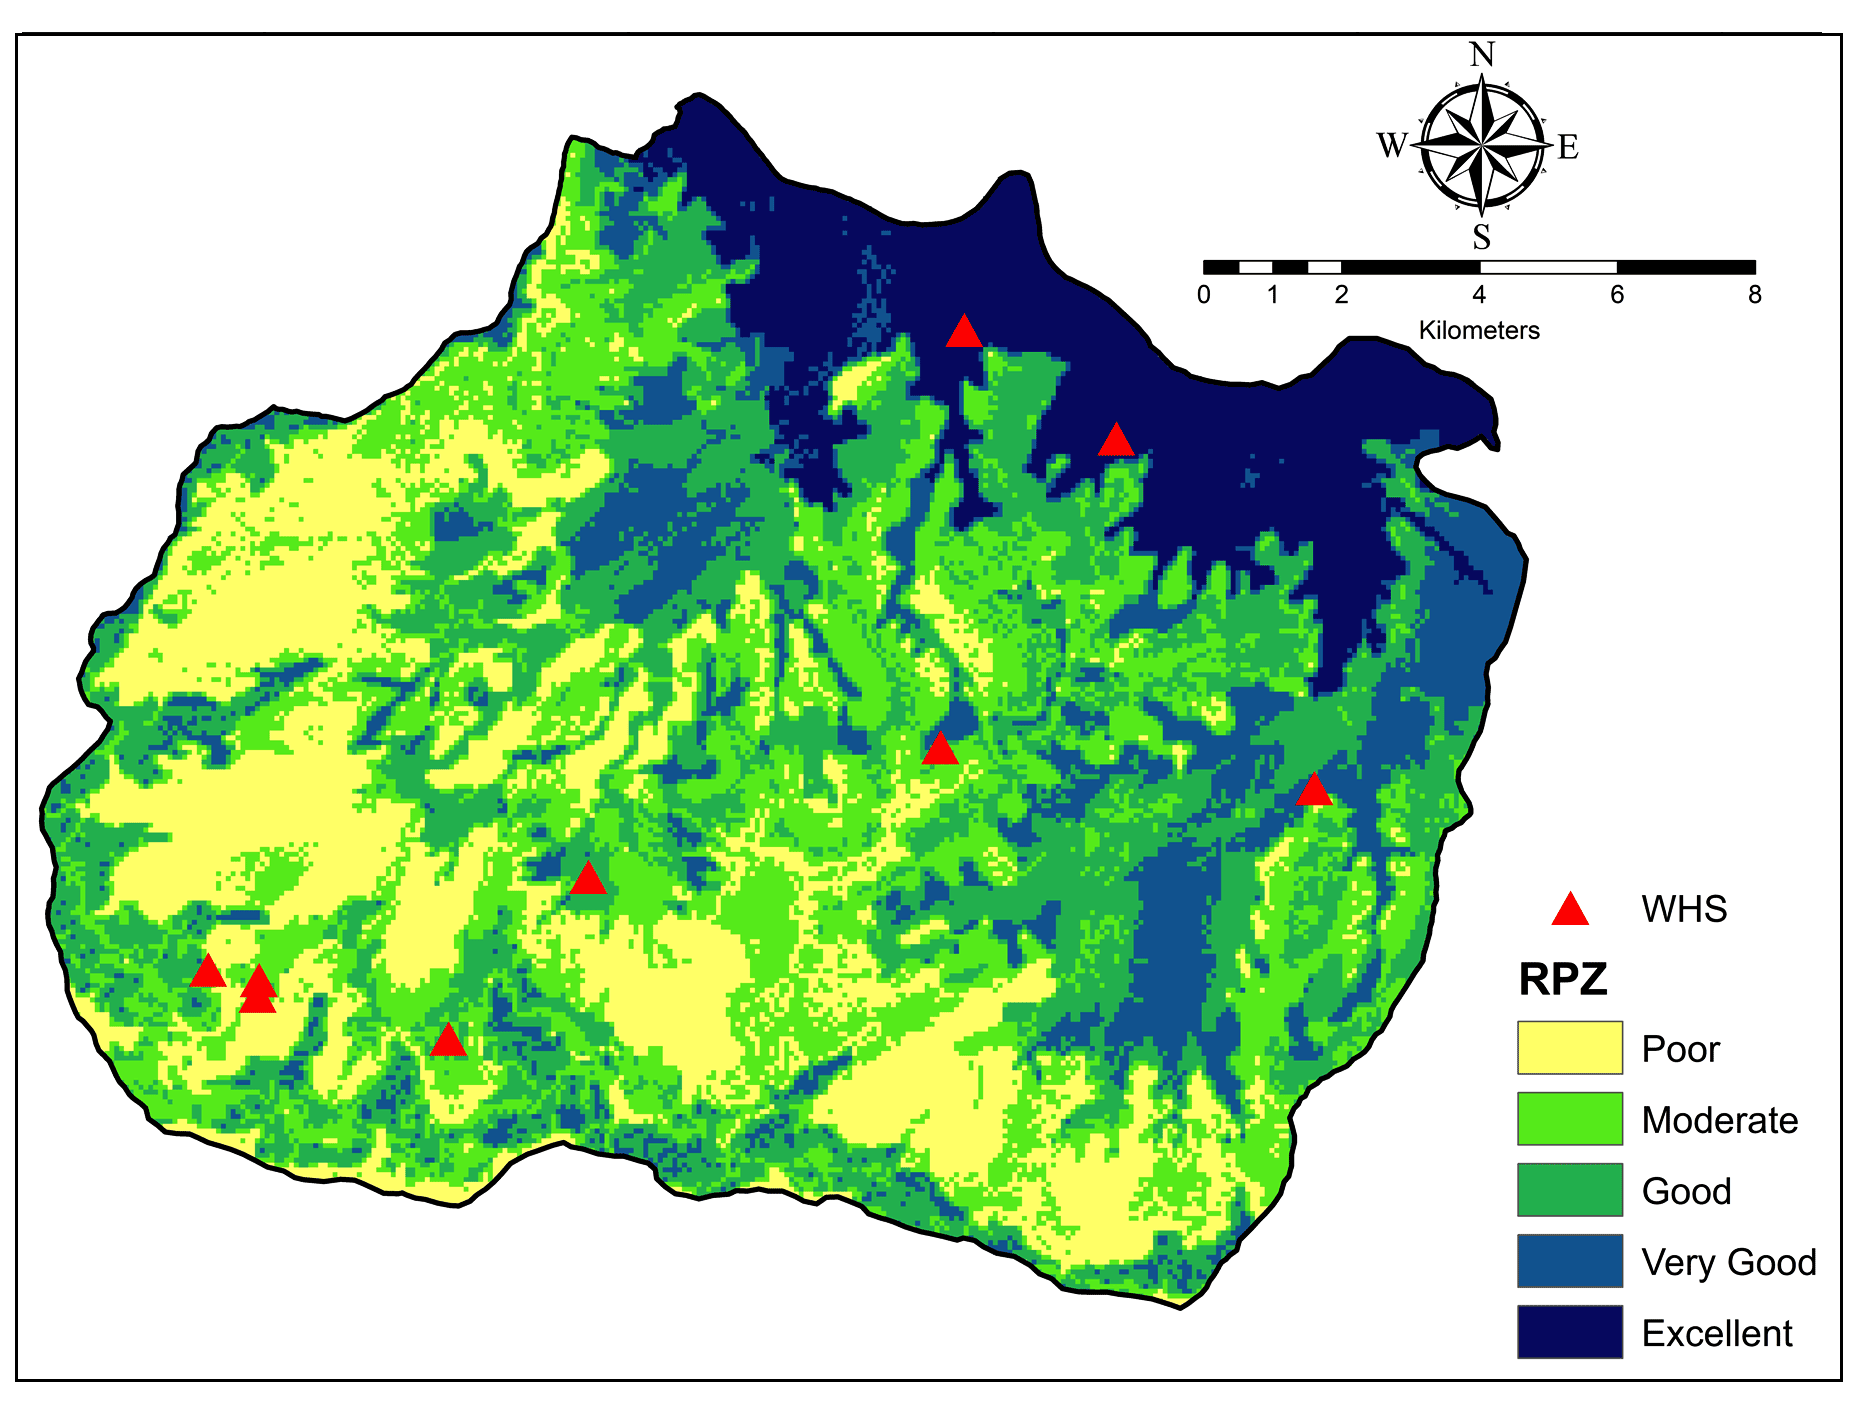
4.6 Recharge Potential Zone (RPZ)
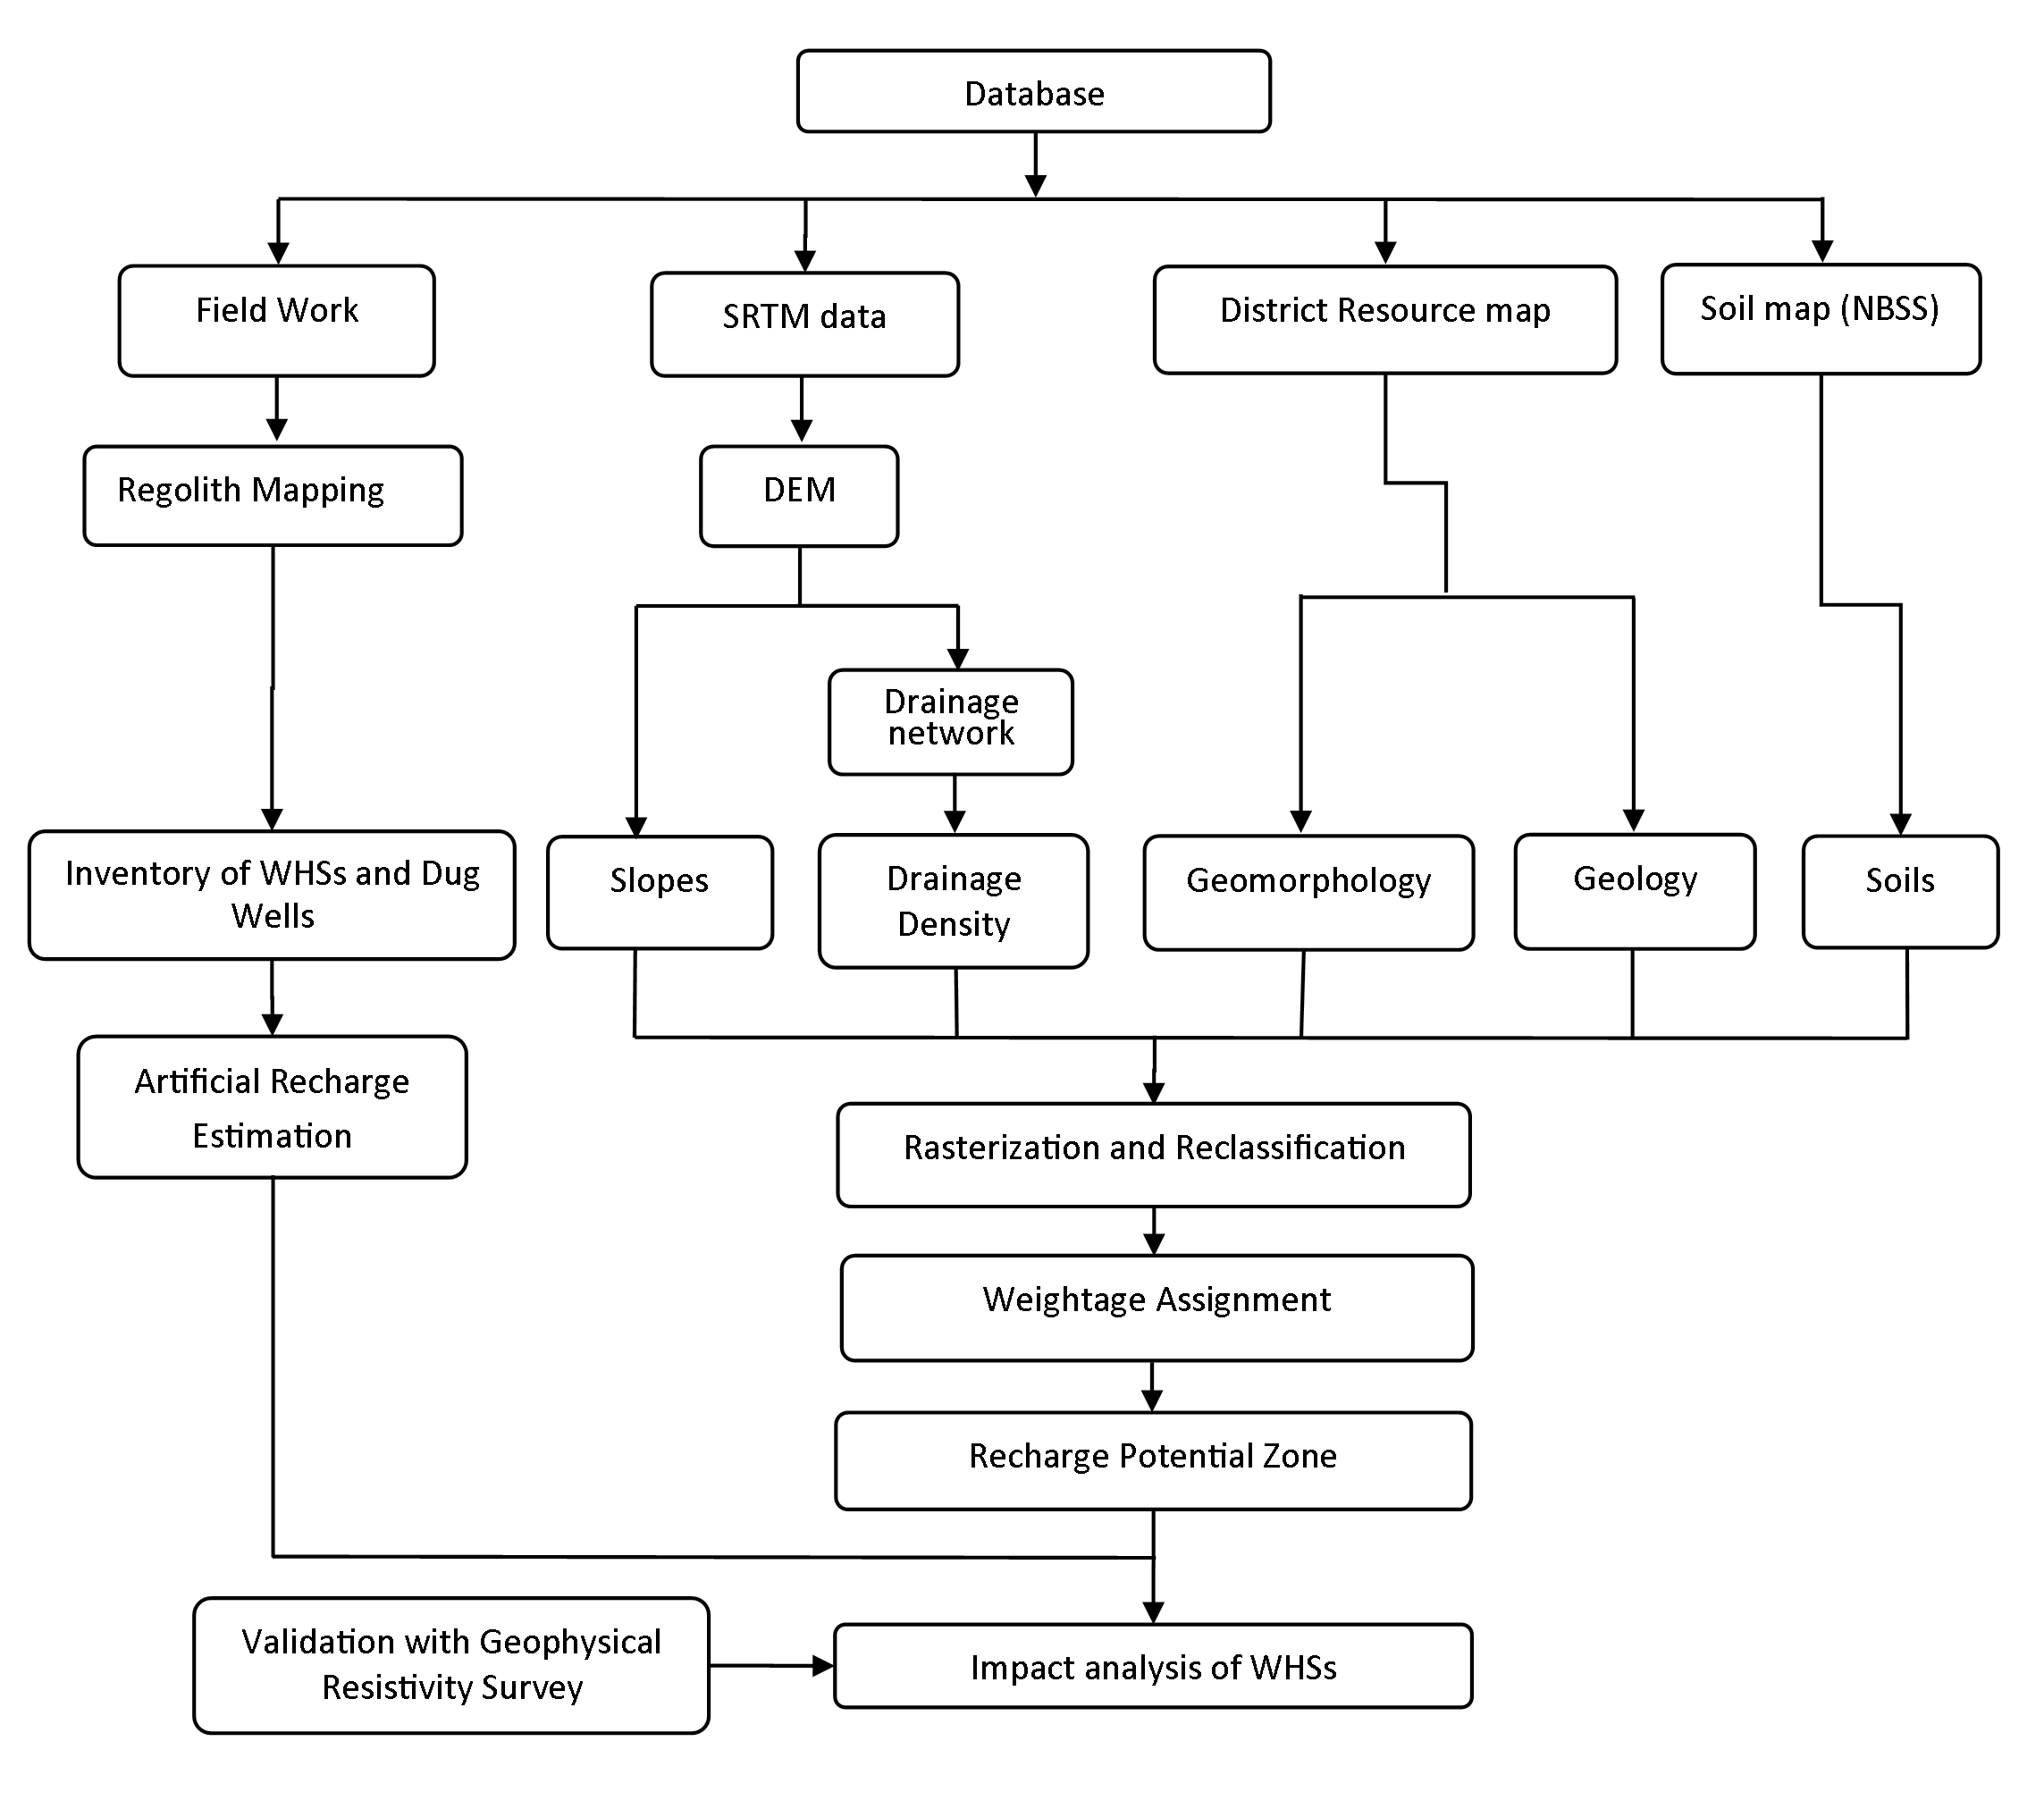
Thematic layers such as the geology, geomorphology, soil, DEM, slope, drainage density were integrated in geospatial environment in order to generate the Recharge Potential Zone map of the Nira river basin. The resultant map is classified into five zones namely excellent (33.06 sq.km), very good (31.25 sq.km), good (59.3 sq.km), moderate (64.2 sq.km) and poor (66.1 sq.km) (Figure 9). It is observed that WHS in Pisalwadi and Bholi are constructed in regions of excellent zones. Shivajinagar is situated on very good zone. These WHS are constructed in regions have less slopes and lower drainage density and hence eventually have more recharge. While, Kavathe Ansur and Zagalwadi 2 are constructed on Good recharge zone. Rest of the WHSs namely Limbachiwadi, Zagalwadi 1, Kesurdi are observed in moderate to poor regions due to presence of clayey type of soil, high slope angles and dense drainage network.
4.7 Water Harvesting Structures
In order to enhance the groundwater availability and the sustainability of both drinking as well as irrigation wells in the watershed, sufficient recharge is essential.
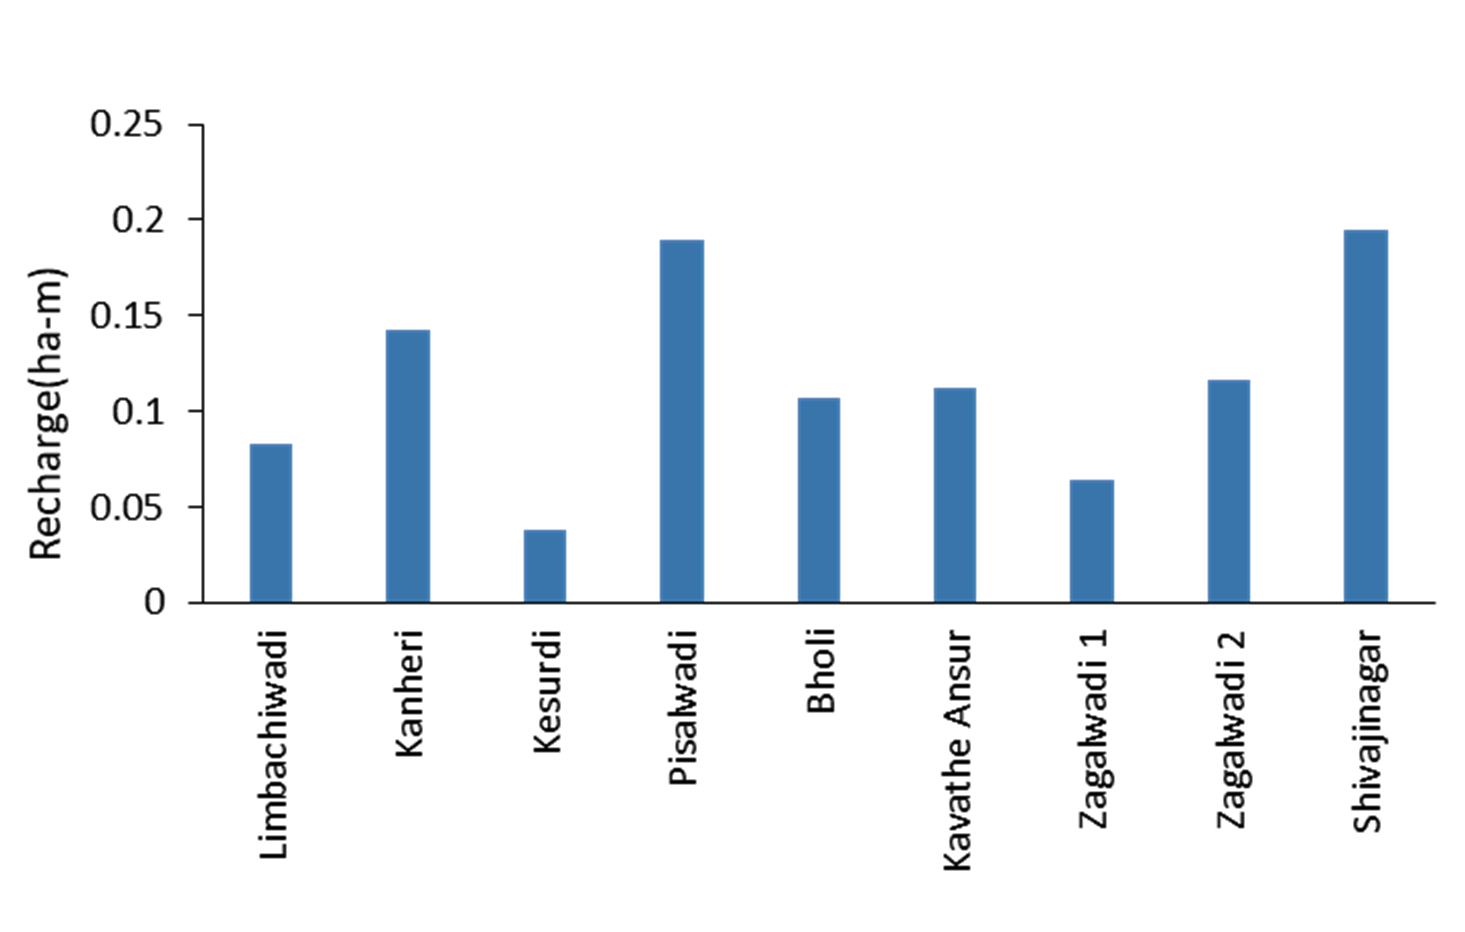
In case, shortfall of natural recharge then, it has to be met through artificial techniques. Thus, to combat the water shortage, cement nala bunds (CNBs) have been constructed at nine locations (Figure 10) namely Limbachiwadi, Kanheri, Kesurdi, Pisalwadi, Bholi, Kavathe, Shivajinagar and Zagalwadi 1 and 2. Storage capacity of individual structures is calculated and recharge in ha-m is estimated (Table 2). The structure constructed at Shivajinagar location has maximum whereas the Kesurdi has minimum storage capacity (Table 2).
Storage capacity = \(0.5×B×H×L×K\)
where, K is factor of safety (value =0.5), B is back water length, H is height and L is width (IIT Bombay, 2019).
The influenced area of single structure is quite limited so benefits of this structure is local in scale with the immediate effects being restricted to distance of about 200 to 500m. Recharge values are depending upon the different storage capacity as well as number of fillings which take place in a groundwater assessment year (Table 2). Higher the storage capacity and number of fillings result in more recharge. So the recharge found to be higher for Pisalwadi and Shivajinagar while for Kesurdi and Zagalwadi1 WHS structures show less impact. Bholi, Kavathe Ansur WHS, Limbachiwadi, Zagalwadi-2 WHSs and also Kanheri WHS depict low to moderate recharge amount (Figure 11).
4.8 Hydrogeological Investigations
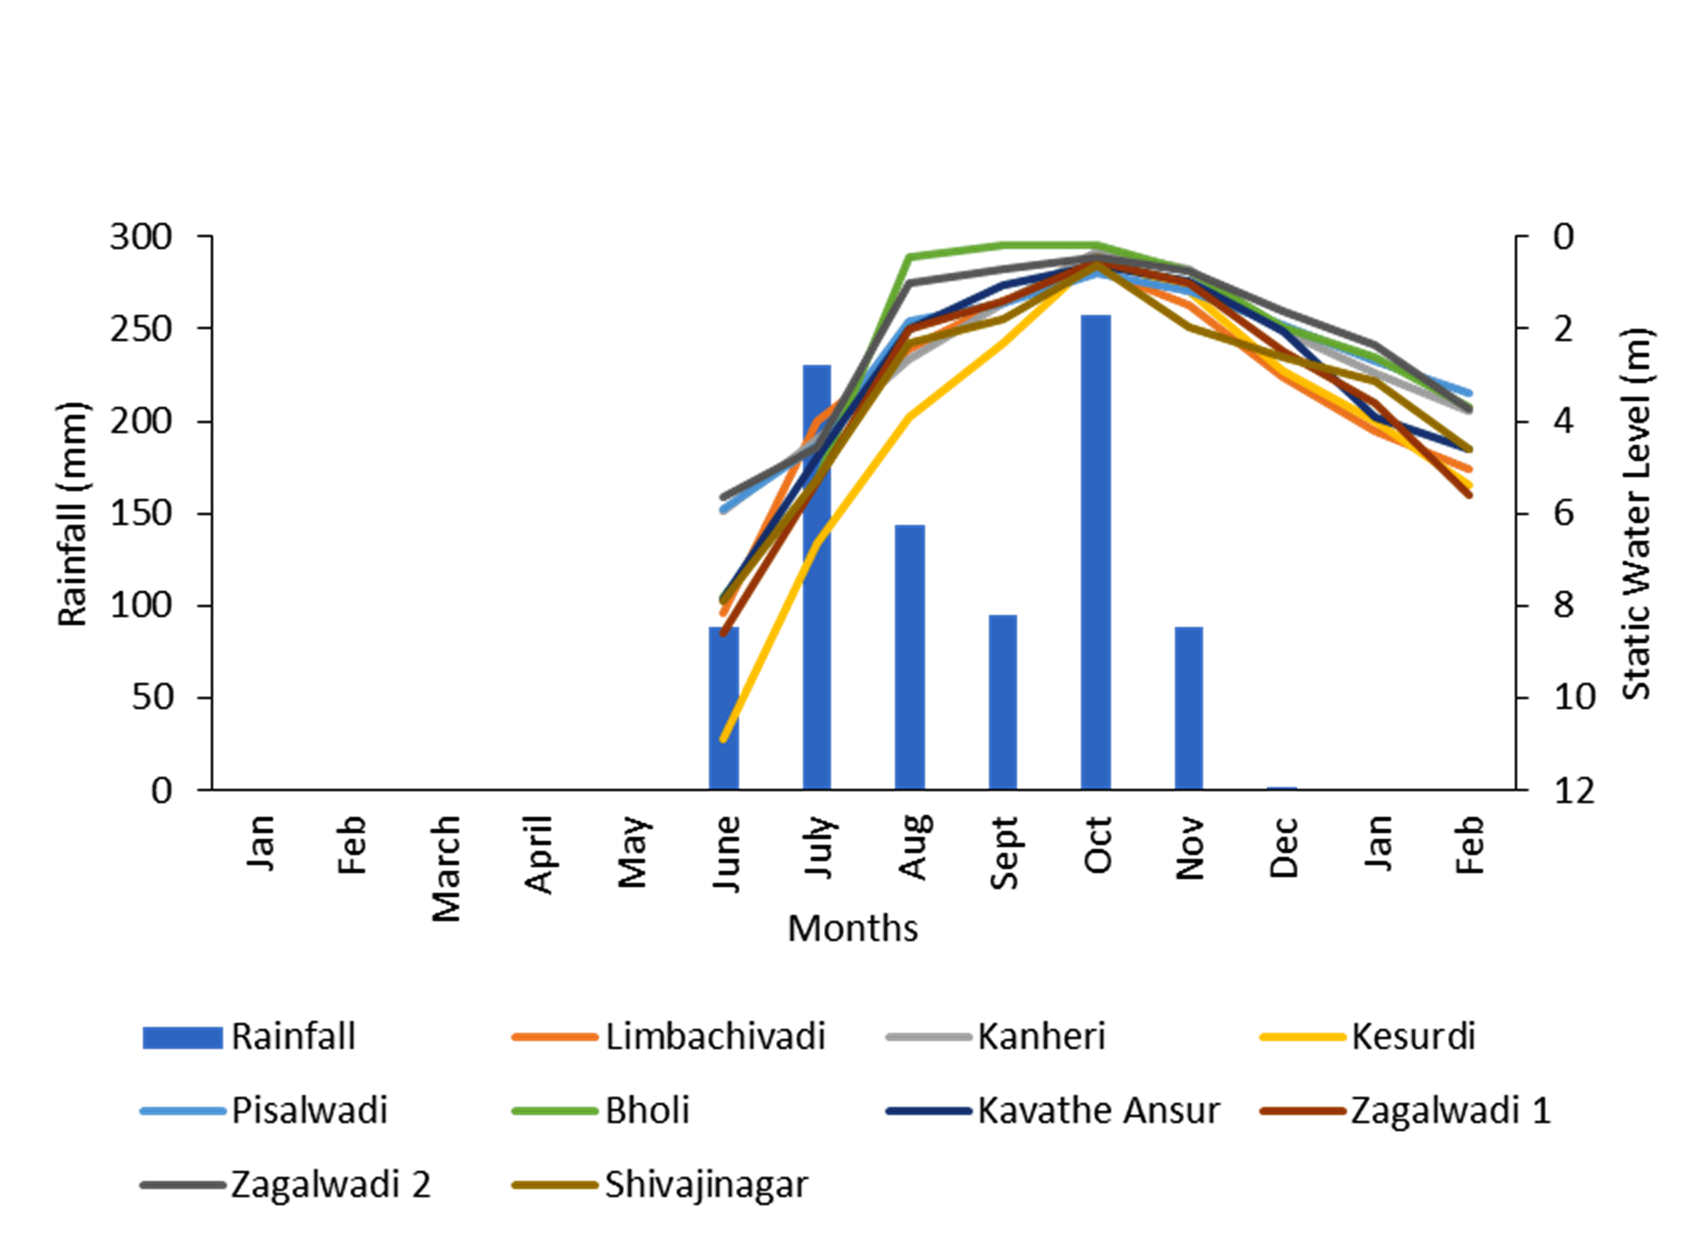
Hydrogeological investigations were carried out to assess the impacts of WHS on surrounding dug wells. Two dug wells per site were inventoried and monthly water levels were measured to understand the rise and fall in water table with respect to recharge structures. The plot of rainfall and groundwater levels (Figure 12) depicts that highest rainfall (above 200 mm) occurred in the month of July and October. The static water level measurements were made in the month from June, 2019 to February, 2020. Groundwater fluctuation ranges from 0.2m to 10.9m. All static water levels in a dug well in the proximity of the WHSs show similar trend. Out of which, wells that are in proximity of Bholi WHS depict less groundwater fluctuation indicating higher groundwater storage, well connected joints/fractures and high degree of weathering while wells in Kesurdi has higher groundwater fluctuation that is due to poor groundwater storage. All other dug wells show moderate fluctuation in groundwater levels. It is seen that the maximum benefit of the structure is up to december because the static water level gets lowered after that and the water arrested in structures reduces drastically.
4.9 Vertical Electrical Sounding (VES)
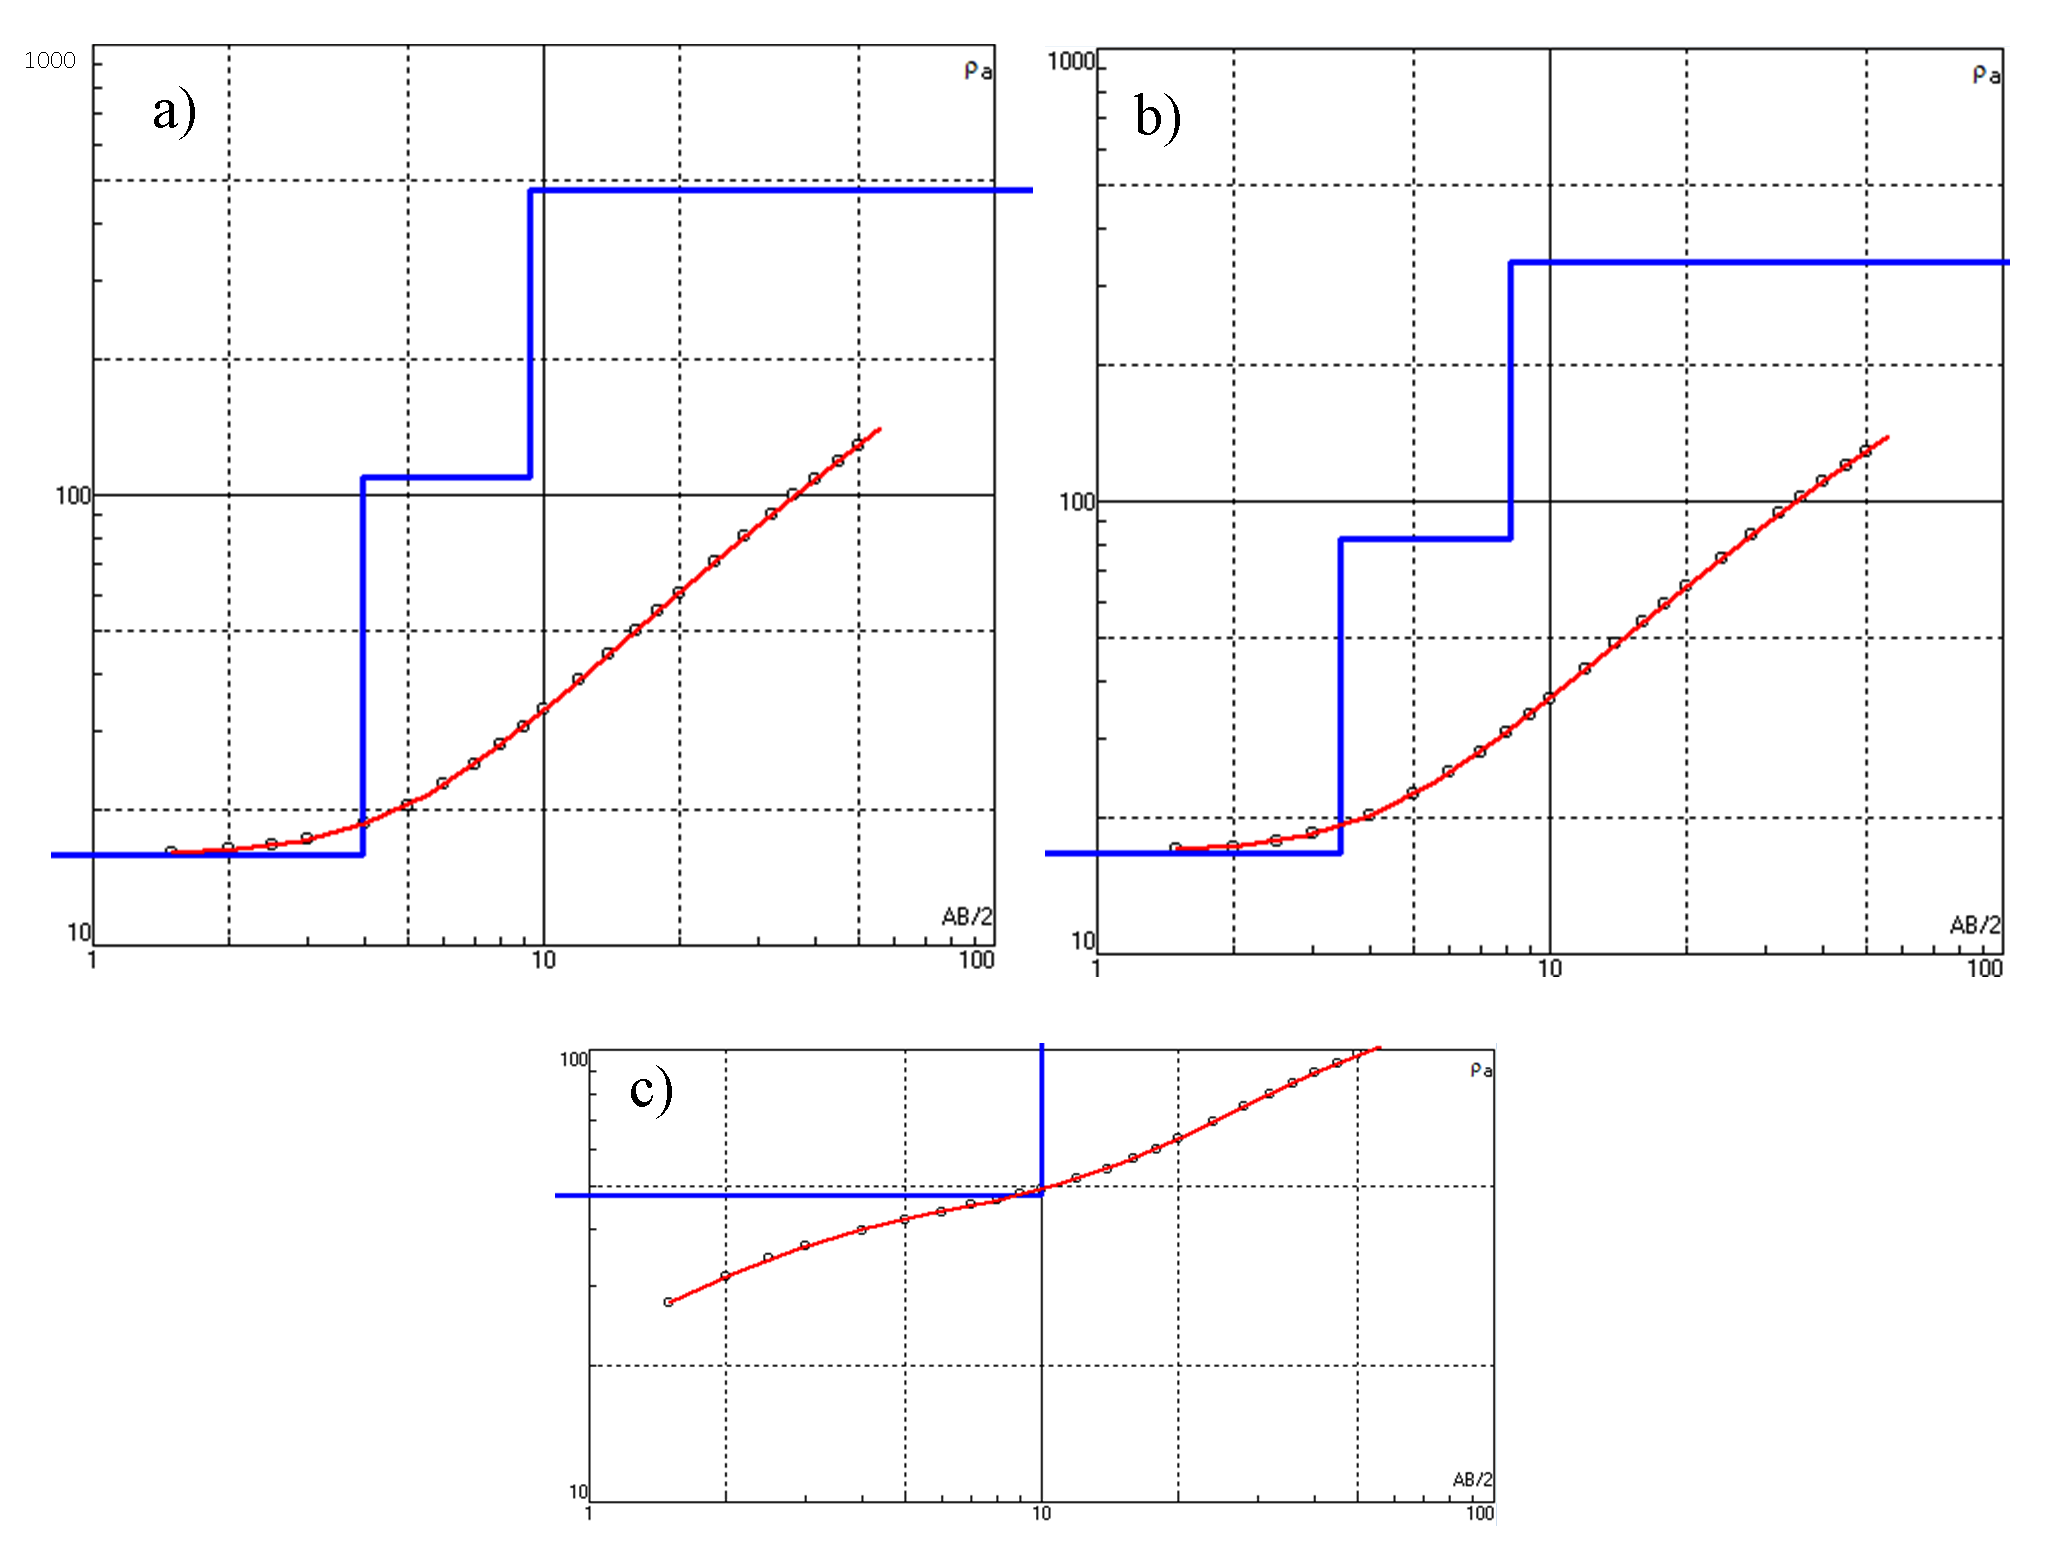
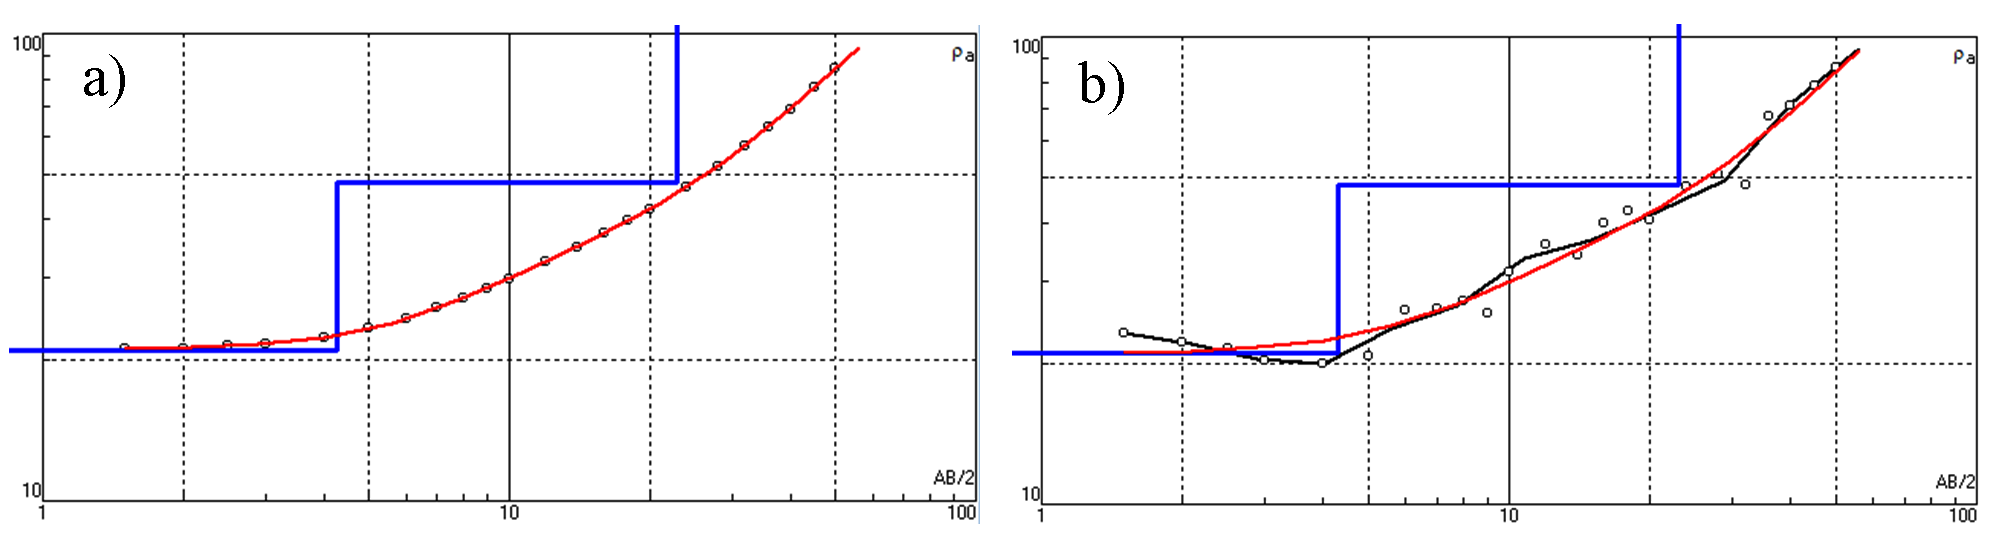
VES surveys were conducted in the proximity of WHS in order to understand the degree of GW saturation, which is further used for validation of RPZ and artificial recharge estimation. The data obtained through electrical resistivity surveys were processed and the plots of AB/2 versus Apparent resistivity generated using IPI2Win software for eight locations are presented in figures from 13 to 19. The thickness of the layers and respective resistivity values are incorporated in Table 3.
At this location, first layer is soil regolith showing 15.9Ωm resistivity with approximately 4m thickness. Further, the resistivity increases upto 109 Ωm representing fractured and weathered basalt and has depth up to 6m. After 10m depth, hard and compact basalt rock was identified and shows resistivity 475 Ωm. Moreover, the VES conducted at 50m distance depicts the similar results. The three VES surveys conducted in the proximity of water harvesting structure shows that the area up to 200m is getting benefited because of this structure.
Both the surveys show minimum resistivity values that indicate high water saturation. The saturated thickness is up to 10.4m at first location whereas this thickness reduces up to 9m in second location. The layer below shows resistivity values increasing in the range of 131-180 Ωm, this is due to reduction in water infiltration and variations in degree of jointing and fracturing in basalt.
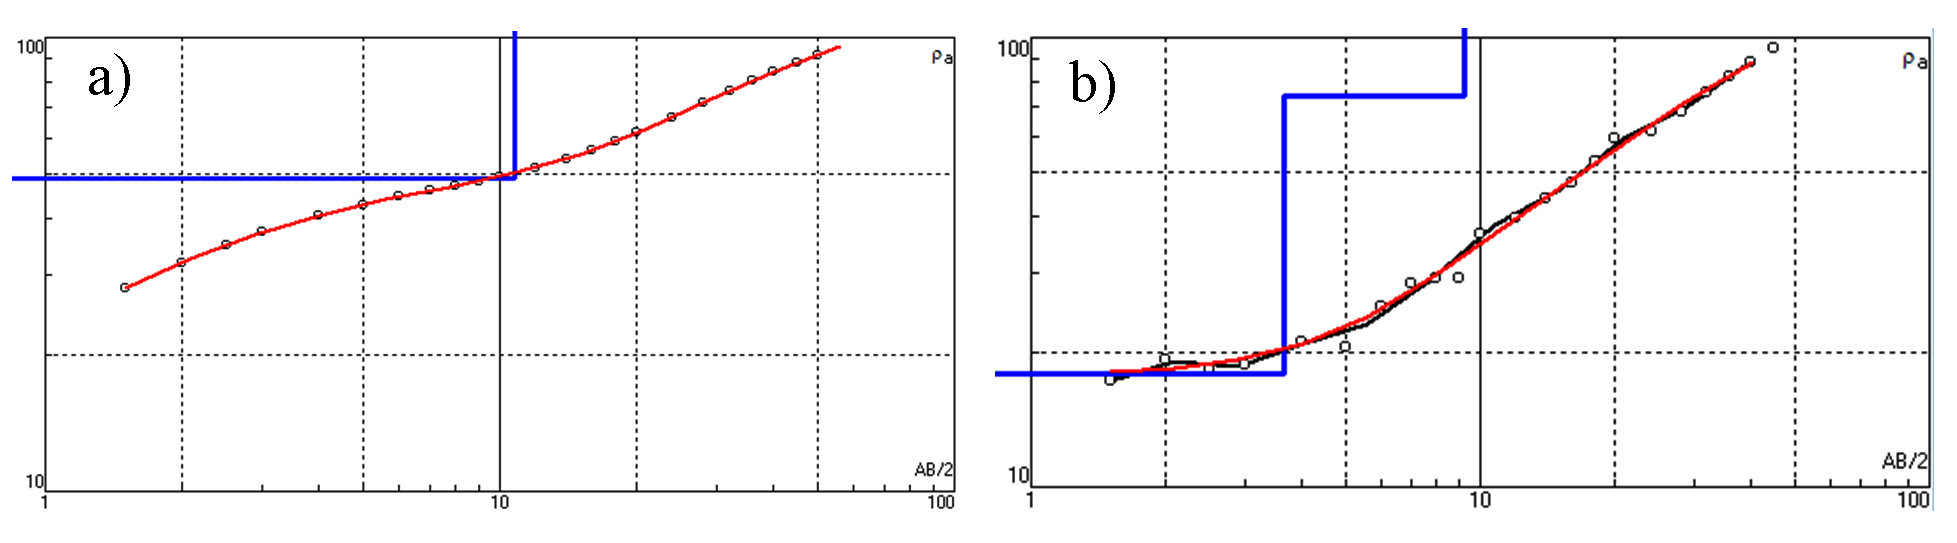
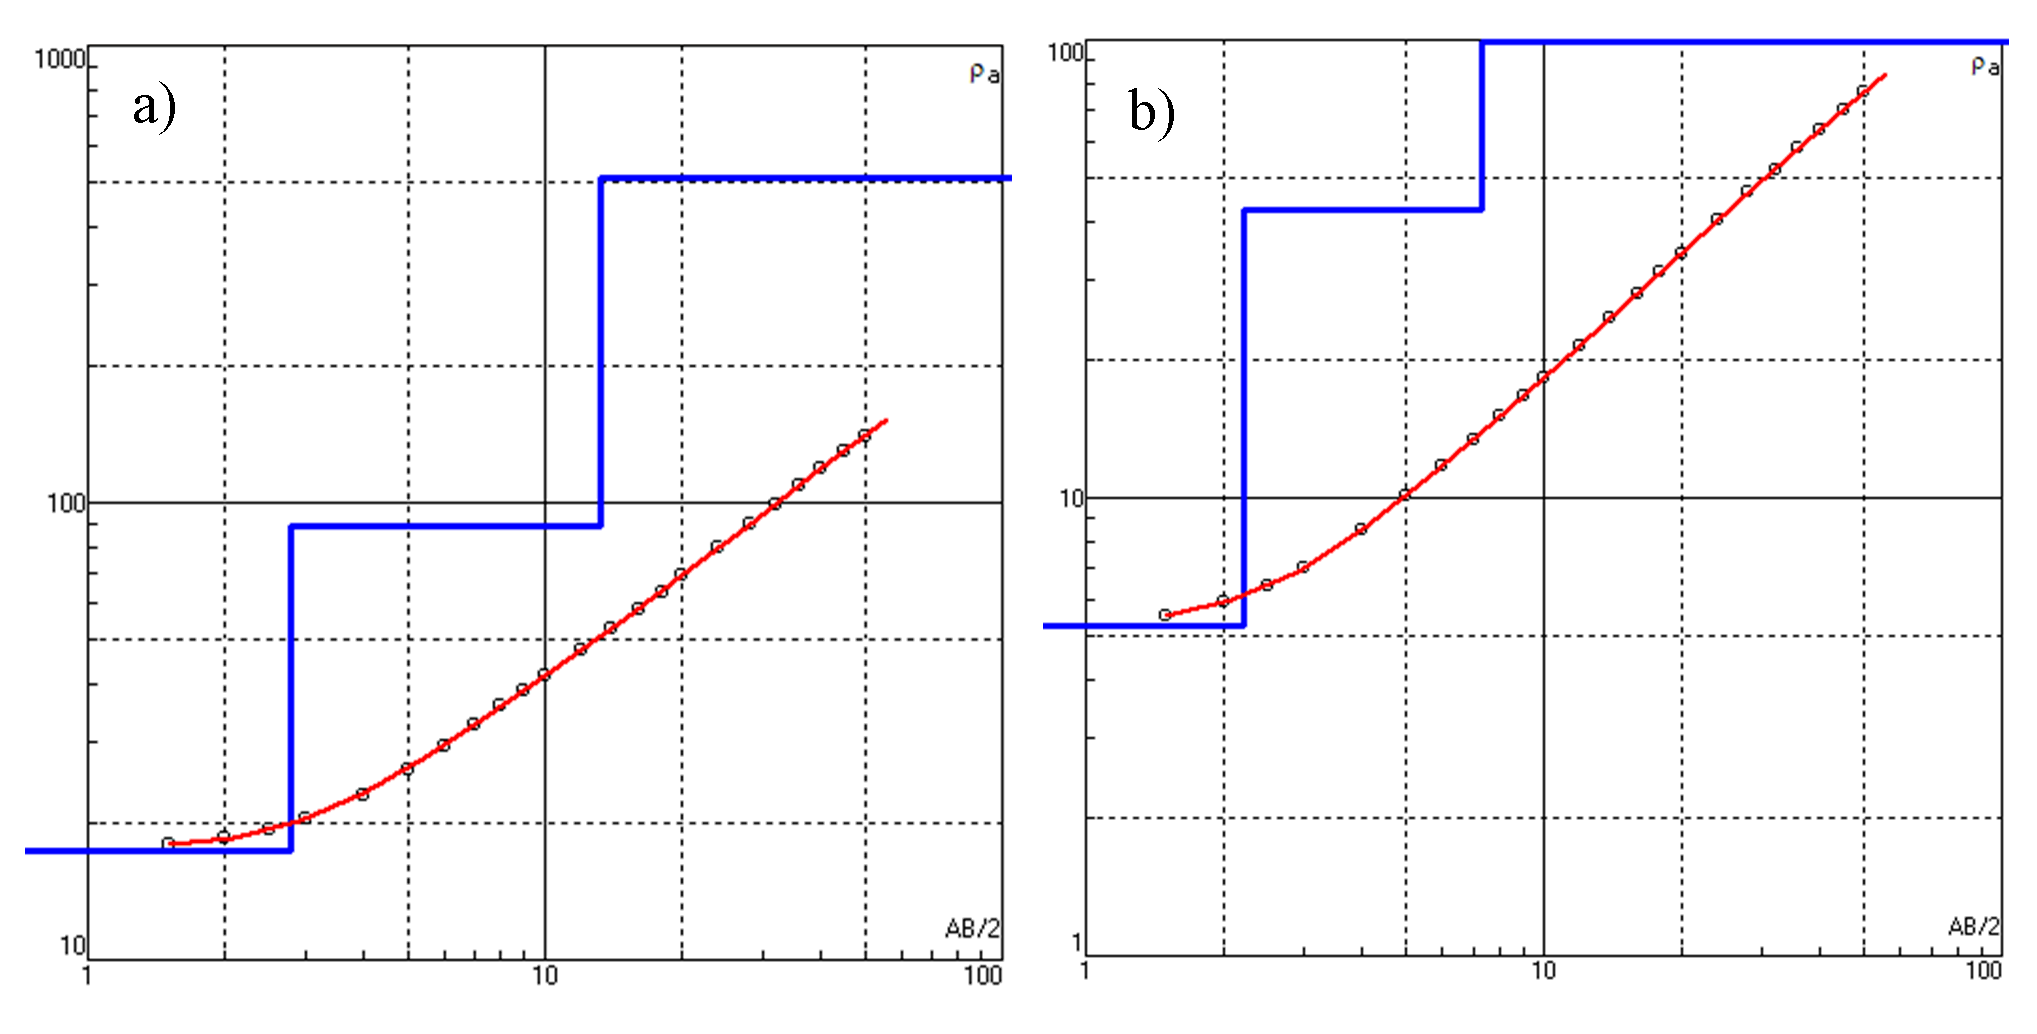
There are two water harvesting structures constructed in this village and the surveys have been conducted at both the places. The first VES survey conducted in the proximity of first structure shows weathered basalt up to 1m with resistivity of about 9 Ωm, below this layer the resistivity increases up to 47 Ωm. This layer is about 15.3m thick and then again there is increase in resistivity up to 1783 Ωm which indicate massive and compact basalt after 16m. At second location, the surface resistivity is high (144 Ωm) but it continuously decreases with increase in depth indicating high saturation up to 10m.
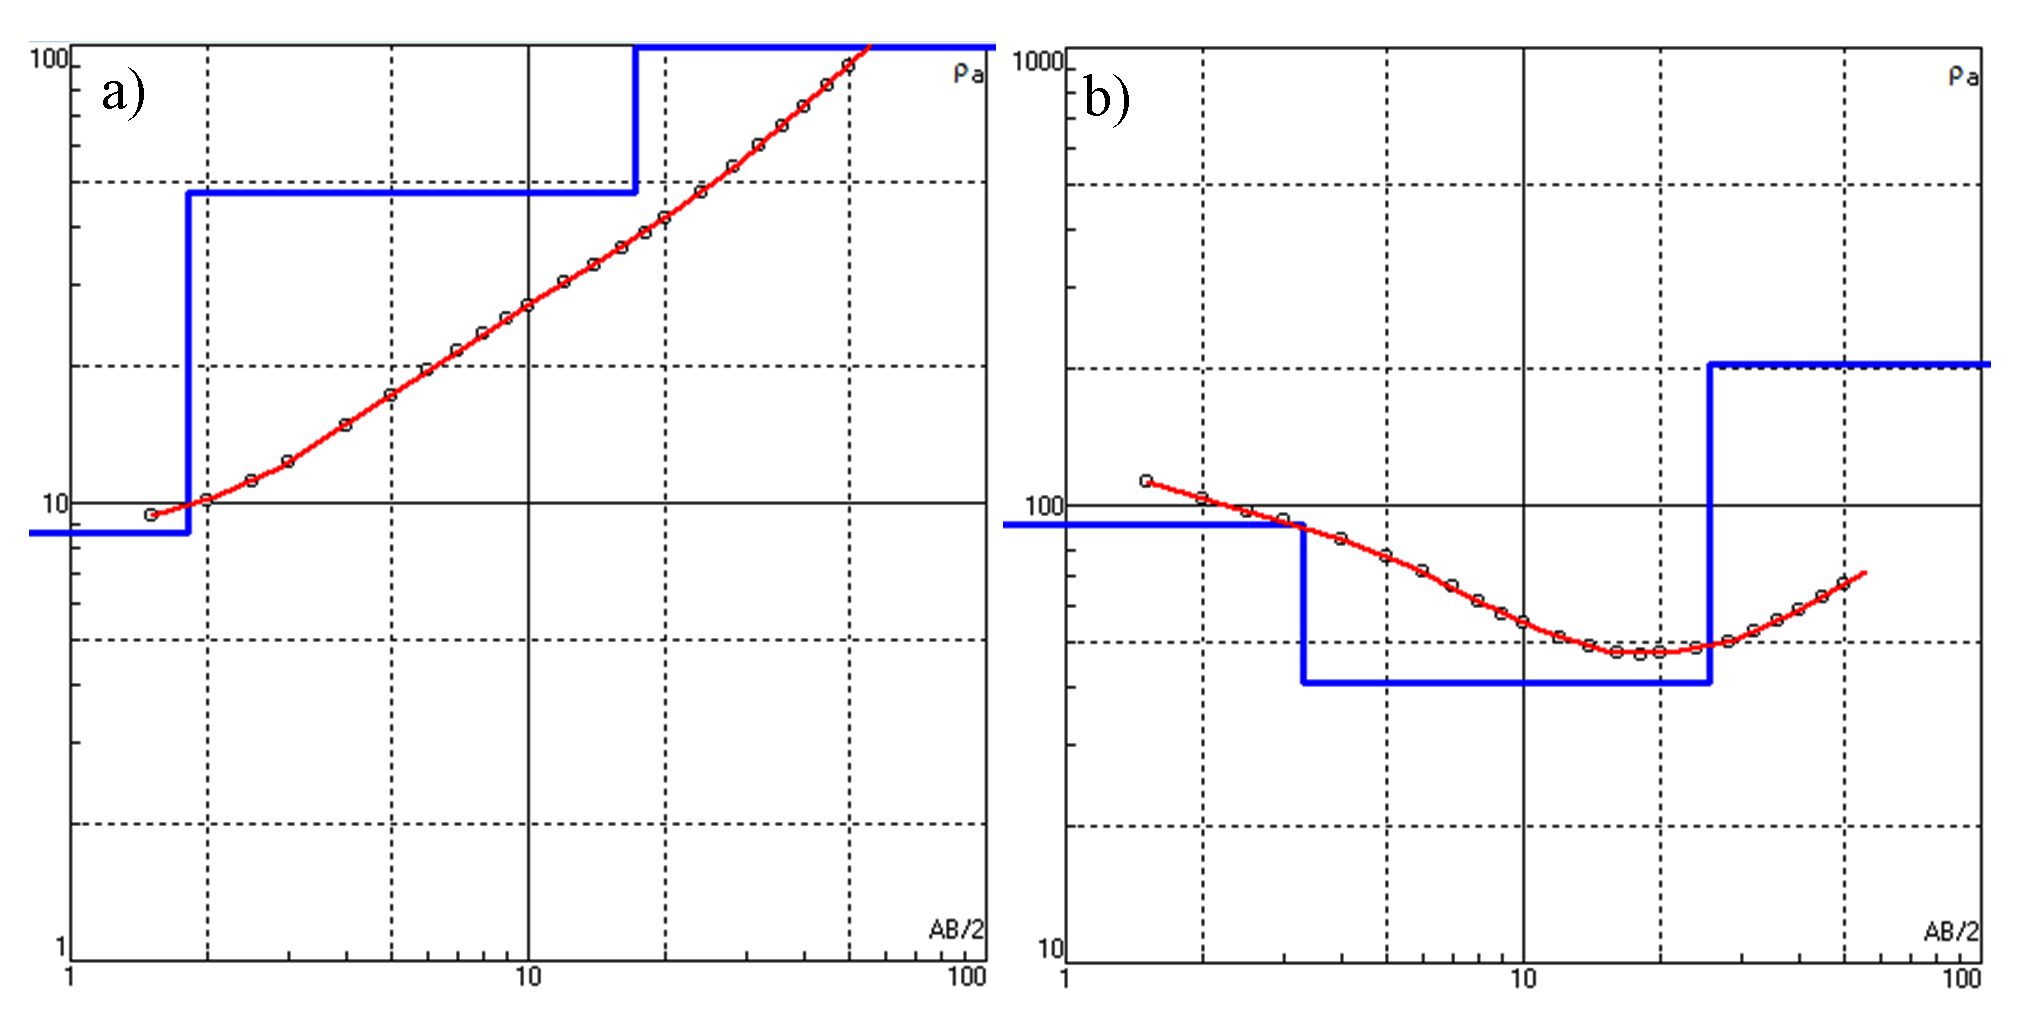
The first VES indicates full saturation of unconfined aquifer and below 15m depth, the hard rock may present that possess high (423Ωm) resistivity value. The second location indicates increase in saturated thickness. It has surface resistivity of 5 Ωm with the thickness of 1.35m. after that resistivity value increases to about 113Ωm with the possibility of fractured basalt. The third plot shows up to 15m vadose zone and aquifer have been identified with maximum saturation followed by hard and compact basalt rock with less fractures and joints. Therefore, the resistivity is 2189 Ωm. Thus, the water harvesting structure is benefiting up to 15m i.e. unconfined aquifer.
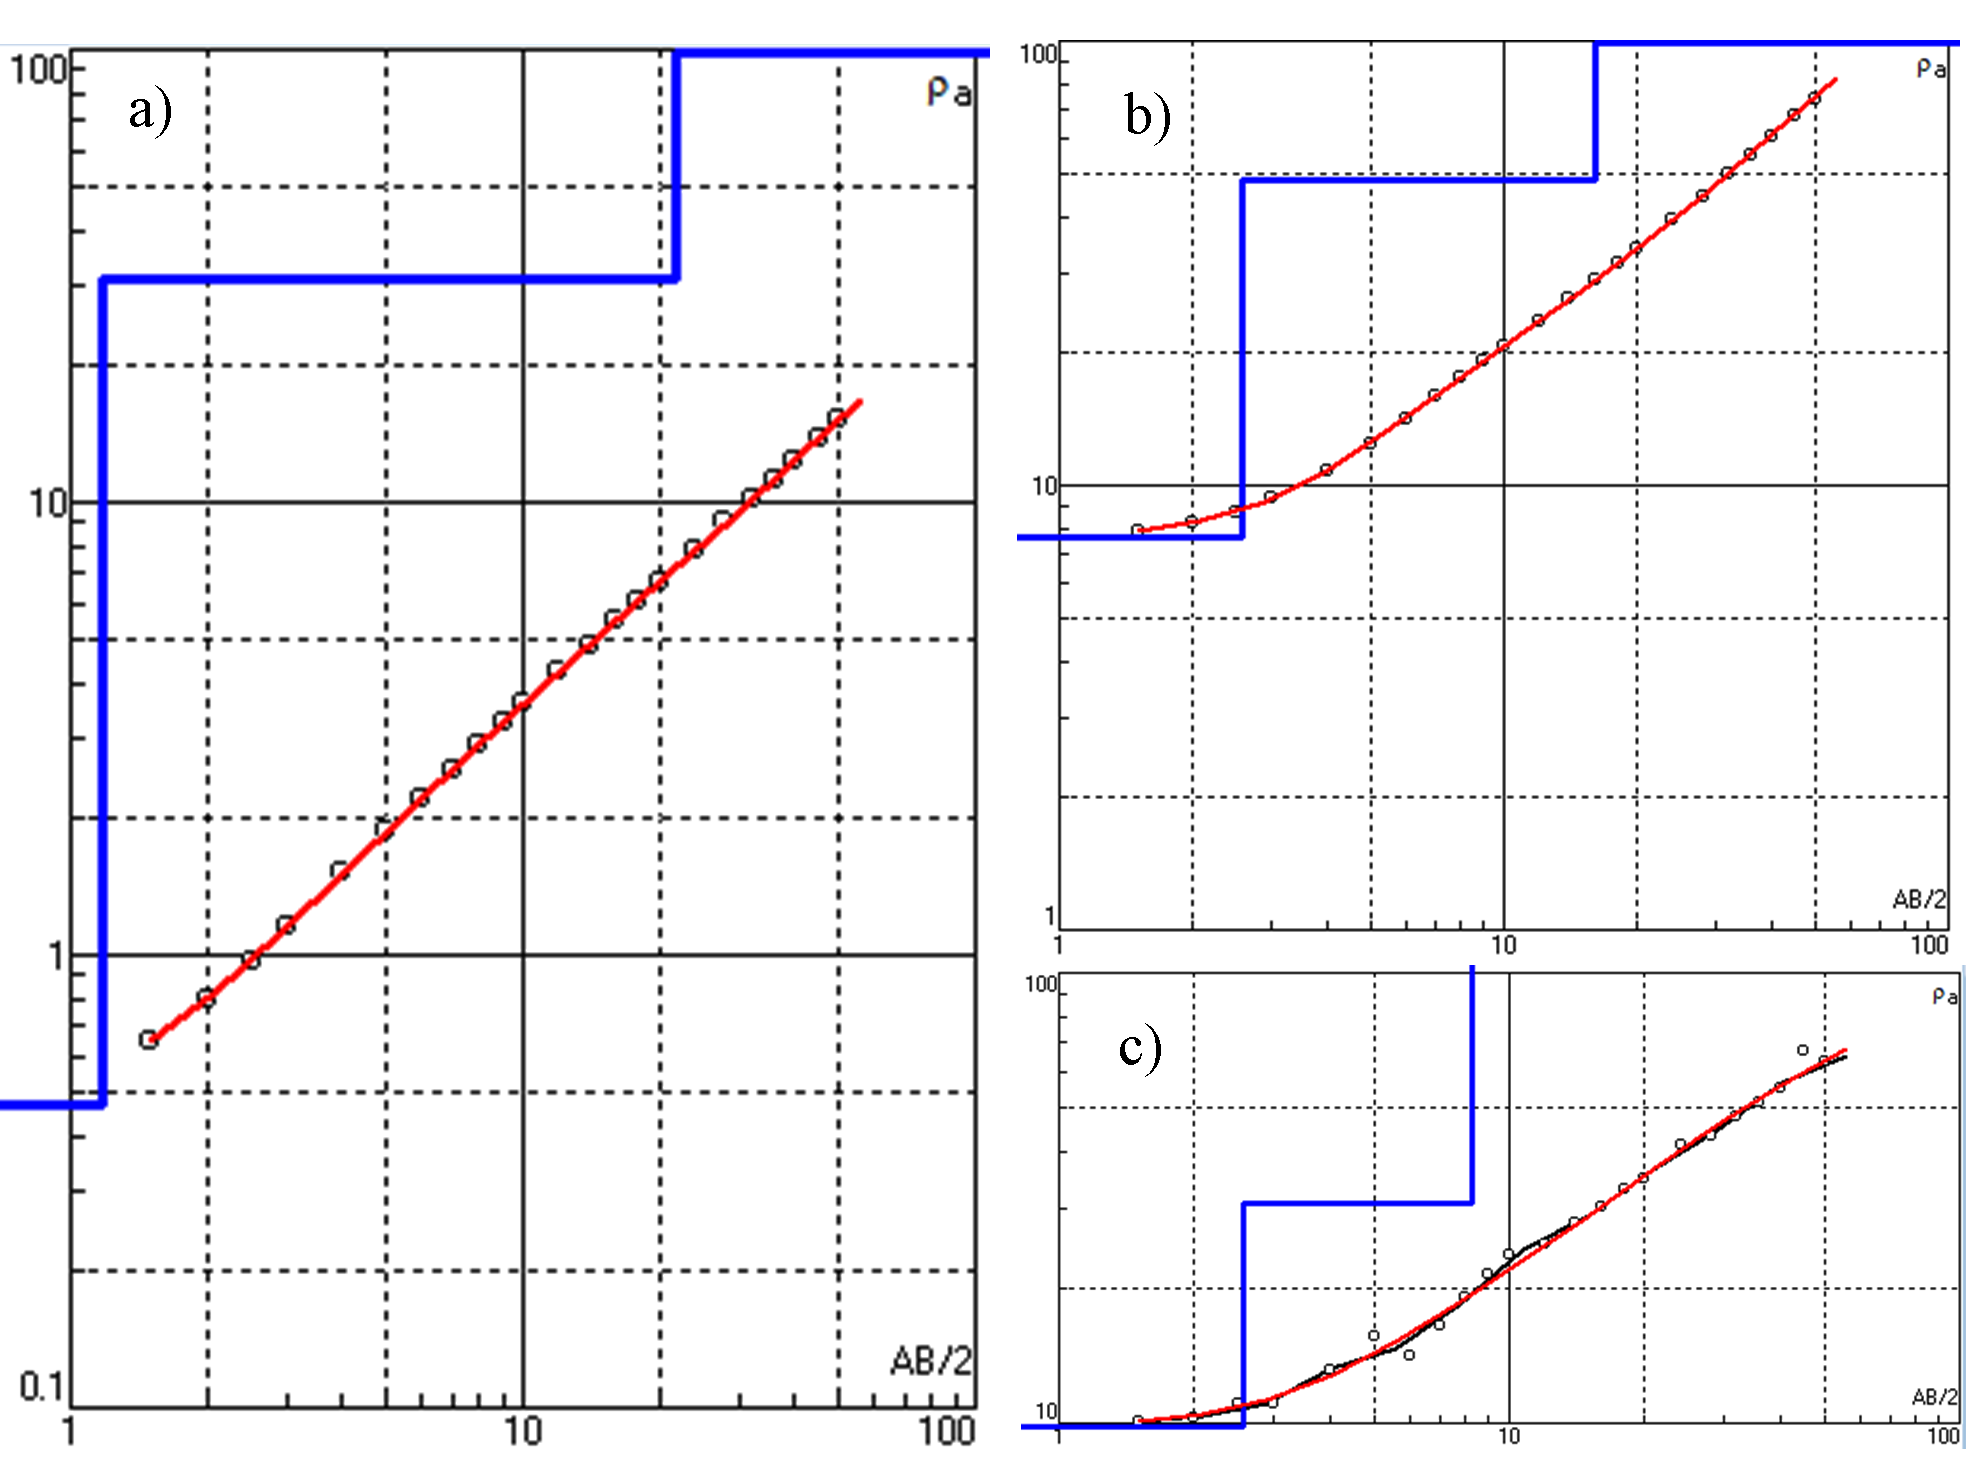
The VES conducted in the proximity of structure shows “A” type of resistivity curve i.e. р1< р2< р3 that co-inside with the weathered layer, (resistivity 21Ωm) fracture and jointed basalt (47.9Ωm) and compact basalt with absence of fractures and joints (4622Ωm). Therefore, the dug wells having depth less than 17m are beneficial because the presence of hard rock hinders the further groundwater movement.
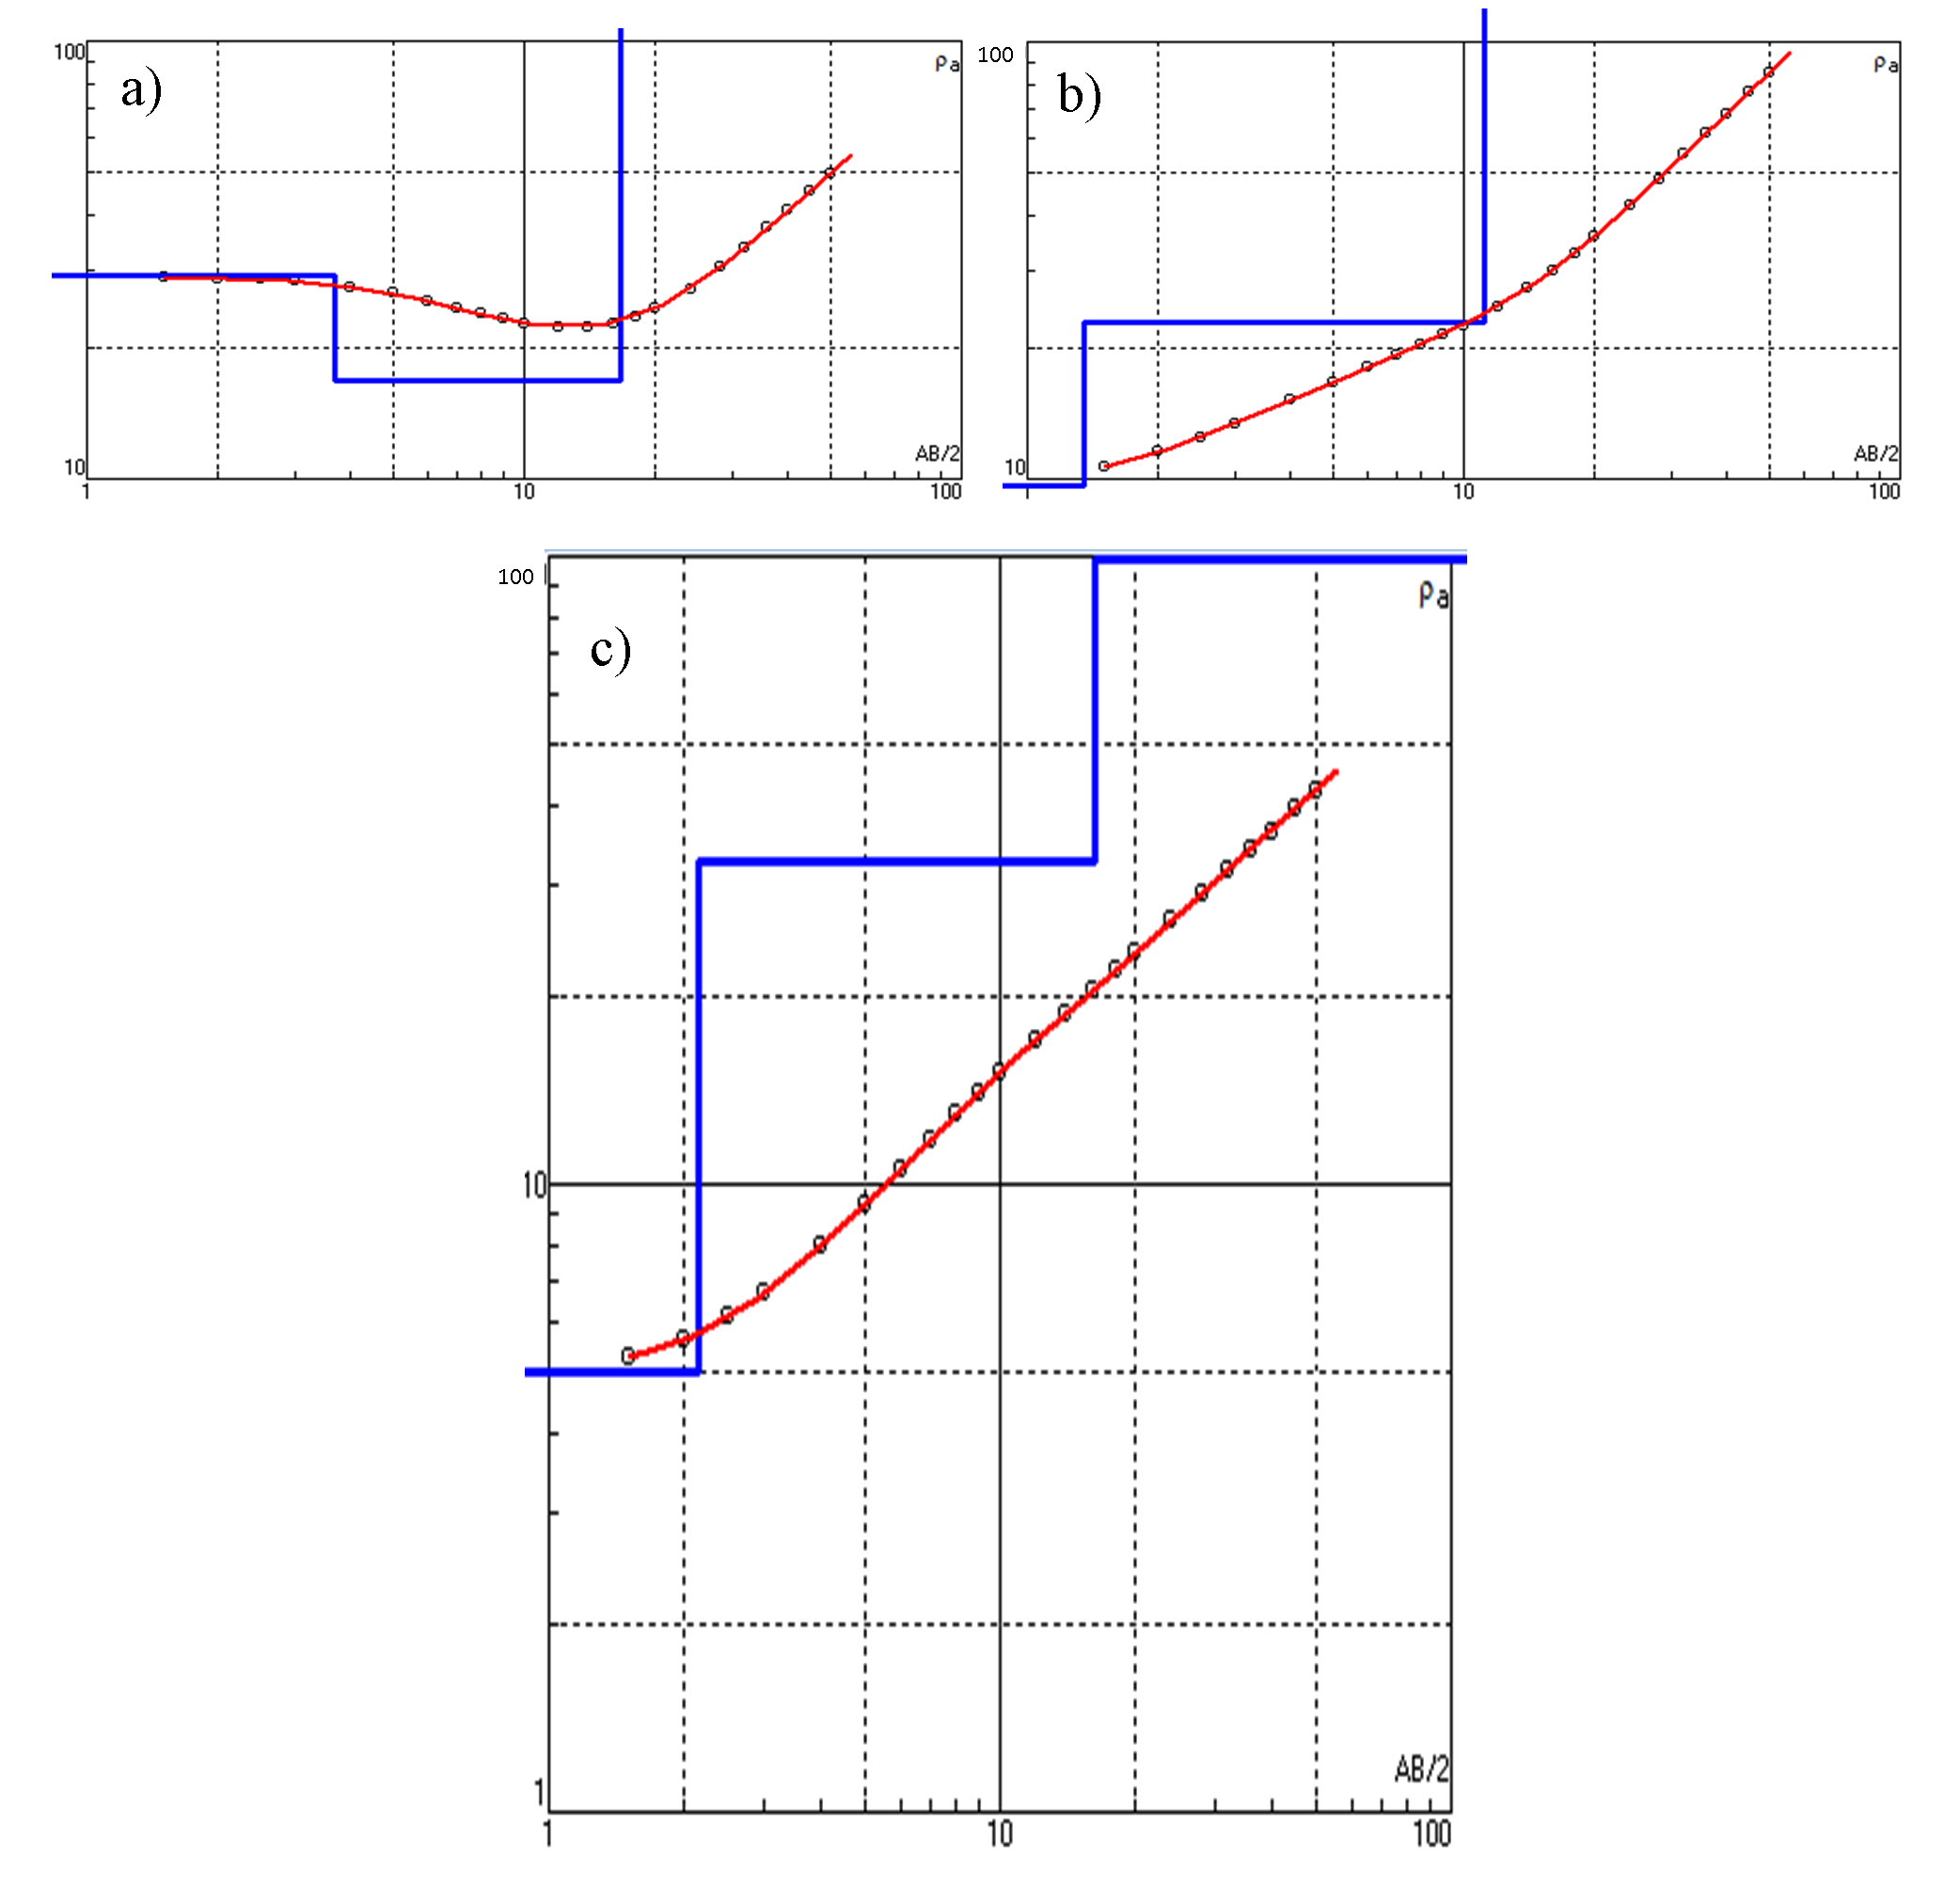
VES conducted at the distance 50m and 100, both show ‘A’ type of curve. First layer is soil layer which has resistivity value of 17 Ωm with total thickness of 2.78 m. Impact of this structure is only up to 10 m thickness because after that resistivity value increases up to 513Ωm which indicate compact basalt that restricts the percolation of groundwater.
The first VES survey conducted in the proximity of this structure show soil layer of 1m thickness. Below this layer, jointed and weathered basalt show resistivity value 31 Ωm with about 21m thickness. After that resistivity value increases in the range of 274Ωm-709 Ωm.
The VES conducted in the proximity of structure shows “A” type of resistivity curve that depict the top soil layer, weathered basalt and compact basalt layer. The resistivity increases with increase in depth.
Finally, the resistivity of saturated top soil ranges between 5.23 and 17.9Ωm whereas the weathered basalt shows the range from 21.0 to 203.0 Ωm due to the variation in water content. The hard and compact basalt depicted the resistivity values as high as 5417.0 Ωm.


 ,
HIMANSHU GAIKWAD 1
,
HIMANSHU GAIKWAD 1