Abstract
Changing climate and land-use practices influencing the natural stream flow processes in the Naryn river basin of Kyrgyzstan. Variations in stream flow regime over 33-years (1980 to 2012) were investigated using daily discharge data of three hydro-stations (Naryn, Ych-Terek and Uzunakmat), located in the Naryn River Basin. Mean monthly discharge (MMD), mean annual discharge (MAD), standard deviation (SD) and coefficient of variation (CV) were calculated to know the spatio-temporal variability. Similarly, Pearson’s correlation coefficient (r) was used to know the relationship between discharge and rainfall. Advanced time-series graph, exceedance probability and frequency distribution were computed using Hydrognomon (V.4.0.3) software to observe the variability and trends in discharge. The results from statistical calculations and software-based computations highlight the monthly, annual, and long term spatio-temporal discharge variability, extreme events, distribution and changes in stream flow records. This study preciously creates the frequency and trends of seasonal discharge, annual discharge cycle, and range of highest and lowest discharge flows. The weak and negative relationship (-0.2121, -0.4238) between rainfall and discharge propose for more investigation of climatic parameters and the topography of Tian Shan Mountain perhaps influencing discharge variability due to melting of glacier at high altitude. The flow regime of the Naryn river basin over the past 33-years perhaps changed due to climatic fluctuations, with the seasonal snowmelt timing (Post-Spring, Summer, Pri-Autumn), precipitations period (March-October), and large-scale land-use alterations.
1 . INTRODUCTION
Land use changes in the world has invited significant scholarly attention in climate, water resources, and urban area (Foley et al., 2005; Ng et al., 2010, Gao et al., 2015; Shinde et al., 2020). Climate changes may impact on hydrological processes such as melting of glacier, evapotranspiration, soil moisture, water temperature, stream flow volume, timing and magnitude of runoff and frequency, and severity of floods (Zhang et al., 2007). Besides, multifaceted processes in the river basins affecting surface and sub-surface hydrology, channel geometry, soil erosion, chemical constituents, hydro‑chemical characteristic, and land use activities (Singh et al., 2005; Easton et al., 2008, Deshmukh and Aher, 2016; Zolekar et al., 2020). Therefore, studies of hydrological process and its temporal variations in stream power (Kale and Hire, 2007), and future trends are essential in the hydrological investigation. The hydrological behavior in the river basin is significantly associated with the climatic phenomena and regional topographical arrangement which is already validated from the discharge flow pattern (Srebrenovi, 1986; Linsley et al., 1988; Aher et al., 2017).
A discharge flow record is reflected the basin integration to natural dissimilarities and man-induced changes, like regulations of large dams and changes in land use / land cover within the basins (Yang et al., 2015). The discharge of the river varies over space and time (Akter et al., 2019) due to natural and man-induced factors. Investigating the long-term changes in river discharge from discharge record is a significant way for better management of water resource (Seyam and Othman, 2015; Shinde et al., 2020). Discharge record is significant as it characterizes the spatio-temporal analysis of climate change, basin-scale water balance, alterations of land use schemes over large spatial scales, and freshwater input to the ocean (Yang et al., 2015). Thus, it is essential to know the basic features like spatio-temporal variations in discharge flows regime at numerous time periods (daily, monthly, yearly to decadal time) and various places. Many studies related to discharge variability use daily, average monthly and yearly stream flow data to observe the hydrological changes within the river basin (Poff and Ward, 1989; Mapfumo et al., 2004; Kale et al., 2009; Garba et al., 2013; Yang et al., 2015; Aher et al., 2017; Higashino and Stefan, 2019).
The hydrological data collected in the past is used to find advance statistical parameters to predict future trends, probability and events that may be possibly happen in near future. However, it is a challenge in the identification of the suitable fitting, statistical distribution for examining the data and precise predictions of the selected database. Therefore, a probability distribution is a statistical tool widely used in discharge prediction and estimation (Garba et al., 2013). Similarly, advance software based computations, precise analysis of discharge, predicting future time series, trends, and probability can give innovative directions for hydrological studies. The study of precisely extremes the events, time series, and probability so rare and there are no comprehensive data, therefore it is a challenge to hydrologist (Garba et al., 2013). In the Kyrgyzstan, flood causing many difficulties and affect infrastructure, such as bridge collapse, building damage, and traffic problems. It is unbearable to circumvent risks of floods, reduce the impact, and their damages using early warning system, community based disaster management trainings, etc. to reduce the losses (Chymyrov et al., 2018).
Armstrong et al., (2019) have studied runoff from glacier ice and seasonal snow in high Asia and Kundzewicz et al. (2015) revealed the changes in climate and river discharge with seasonal runoff predictability in the Aksu River Basin. Akmatov et al. (2019) have reported the glacier runoff and regime of rivers with glacial power using case of study of Naryn River, Kyrgyzstan. However, the study of long-term changes in discharge of Naryn river basin is not yet attempted. This study identifies the long-term changes in Naryn river basin stream flow where winter is more snowfall, high rainfall in spring and autumn, and more evaporation in summer. In this basin, formation of runoff and hydrographic network is greatly influenced by the topographic arrangement and local weather differences. The hydrological feature of Kyrgyzstan is divided into two areas - 1) runoff formation and 2) its dispersal. The first comprises the mountainous portion with more than 2000 m elevation and the area of dispersion of runoff is situated below the area of its formation, occupying the territory of foothill valleys and within the mountain. The objective of study are to examine the discharge process in the first and second parts those which associated with Naryn river basin and to investigate the possible causes of discharge variability. This study would be helpful to know the link of discharge with physical and meteorological drivers in the Naryn and other river basins which have similar hydro-meteorological characteristics.
2 . STUDY AREA
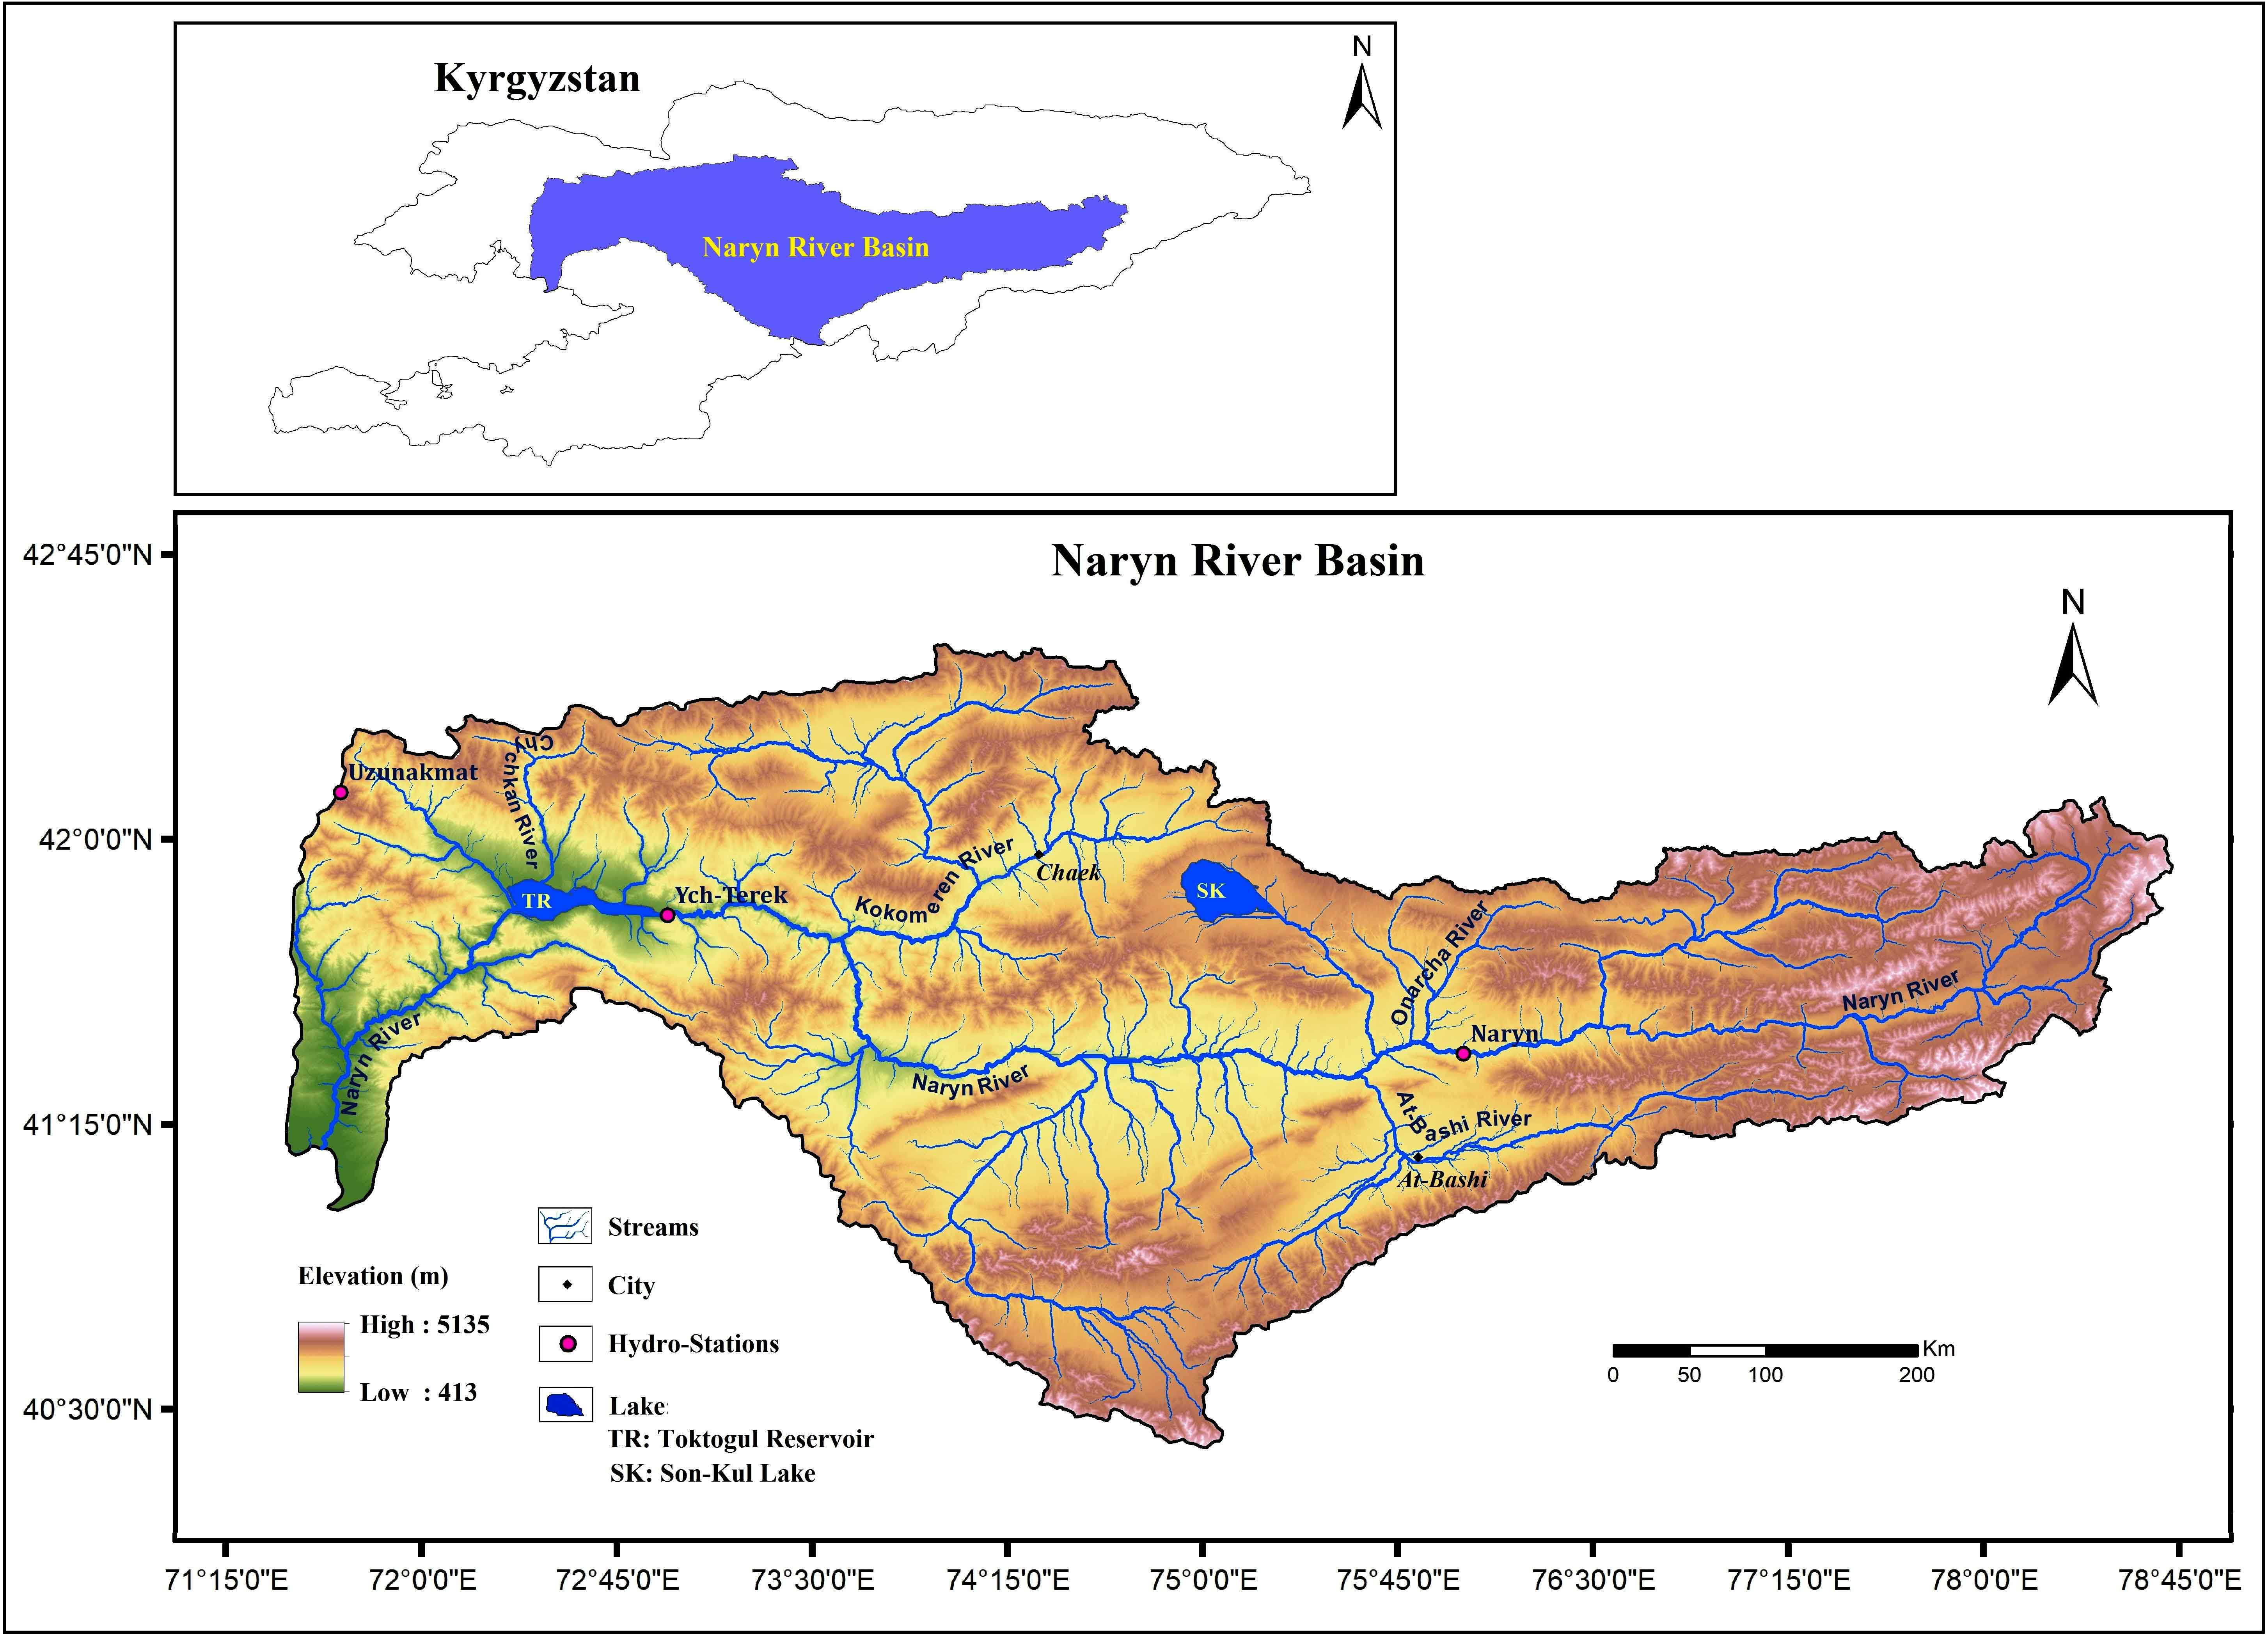
The Naryn River basin (56210 km2) located in the middle Tien Shan mountain area of Kyrgyzstan (central Asia) which extent is 40° 44' 08.77" to 42° 46' 24.10" N latitudes and 71° 61' 03.78" to 78° 35' 57.87" E longitudes (Figure 1). The total length of Naryn River in the Kyrgyzstan is about 600 km (Dixon and Wilby, 2016). The maximum altitude in the basin is 5135 m and minimum is 413 m from mean sea level (MSL). Mountain ranges of Kyrgyzstan are barriers to moist air masses from the West, Northwest and North, and natural accumulators of atmospheric moisture. The Naryn river is formed due to local rainfall, seasonal snow and glacial melting process (Hill et al., 2017). The confluence of the Big and the Small Naryn rivers made the Naryn River after that which flows into Ferghana Valley, where it merges with Karadarya to form the Syrdarya River (Hagg et al., 2013). The Kichi-Naryn, At-Bashi, On Archa, Kadjyrty, Chychkan, Alabuga, Kökömeren etc. rivers are the main tributaries of the Naryn River (Welcome, 2020). About 2% of the Naryn river basin area is glacierized and these glaciers are concentrated in the eastern part of the basin (Gan et al., 2015).
The area has four seasons of the year due to the difficult orography and every season is different from each other. The climate of the area is influenced mainly by the mountains and associated glaciers, especially in the eastern part of the basin (Akmatov et al., 2019). The average temperature of the area is 10o C in July and -18o C in January. The average precipitation ranges between 280 mm and 450 mm annually (Gan et al., 2015). The overall climate of the area considered as continental climate that is significantly varied locally. In the basin area observed the dry and hot summer and cold winter (Gan et al., 2015). The land use and land cover are mostly associated with grass and shrub, with pastoral farming on mountain sides, and some arable crop and hay production in valleys which is sustained by local irrigation (Samuel et al., 2016). The elevated ridges of the Naryn River freezes in the winter season and flood situation happen in the river channel in the summer seasons (May to June). The entire stream flow system and allied flood and drought are determined by the stream flow features like rate, magnitude, duration, and timing (Djancharov and Street, 2003).
3 . MATERIALS AND METHODS
3.1 Discharge Data and Statistical Calculation
Daily discharge (m3/s) data of three hydro-stations (Naryn, Ych-Terek, and Uzunakmat), located in the Naryn River basin were collected for 33 years period (1980-2012) from the Hydro-Meteorological agency of Kyrgyzstan. Spatial information of hydro-station was shown in the Table 1. Yang et al. (2002) have used daily discharge data to study the variability and extreme of Mackenzie River discharge.
Table 1. Spatial information of hydro-stations
|
Hydro Station
|
Latitude
|
Longitude
|
Elevation (MSL)
|
Period
|
|
Naryn
|
41.4286N
|
75.9657E
|
2037
|
1980-2012
|
|
Ych-Terek
|
41.4605N
|
73.1743E
|
998
|
1980-2012
|
|
Uzunakmat
|
42.0559N
|
72.1830E
|
1879
|
1980-2012
|
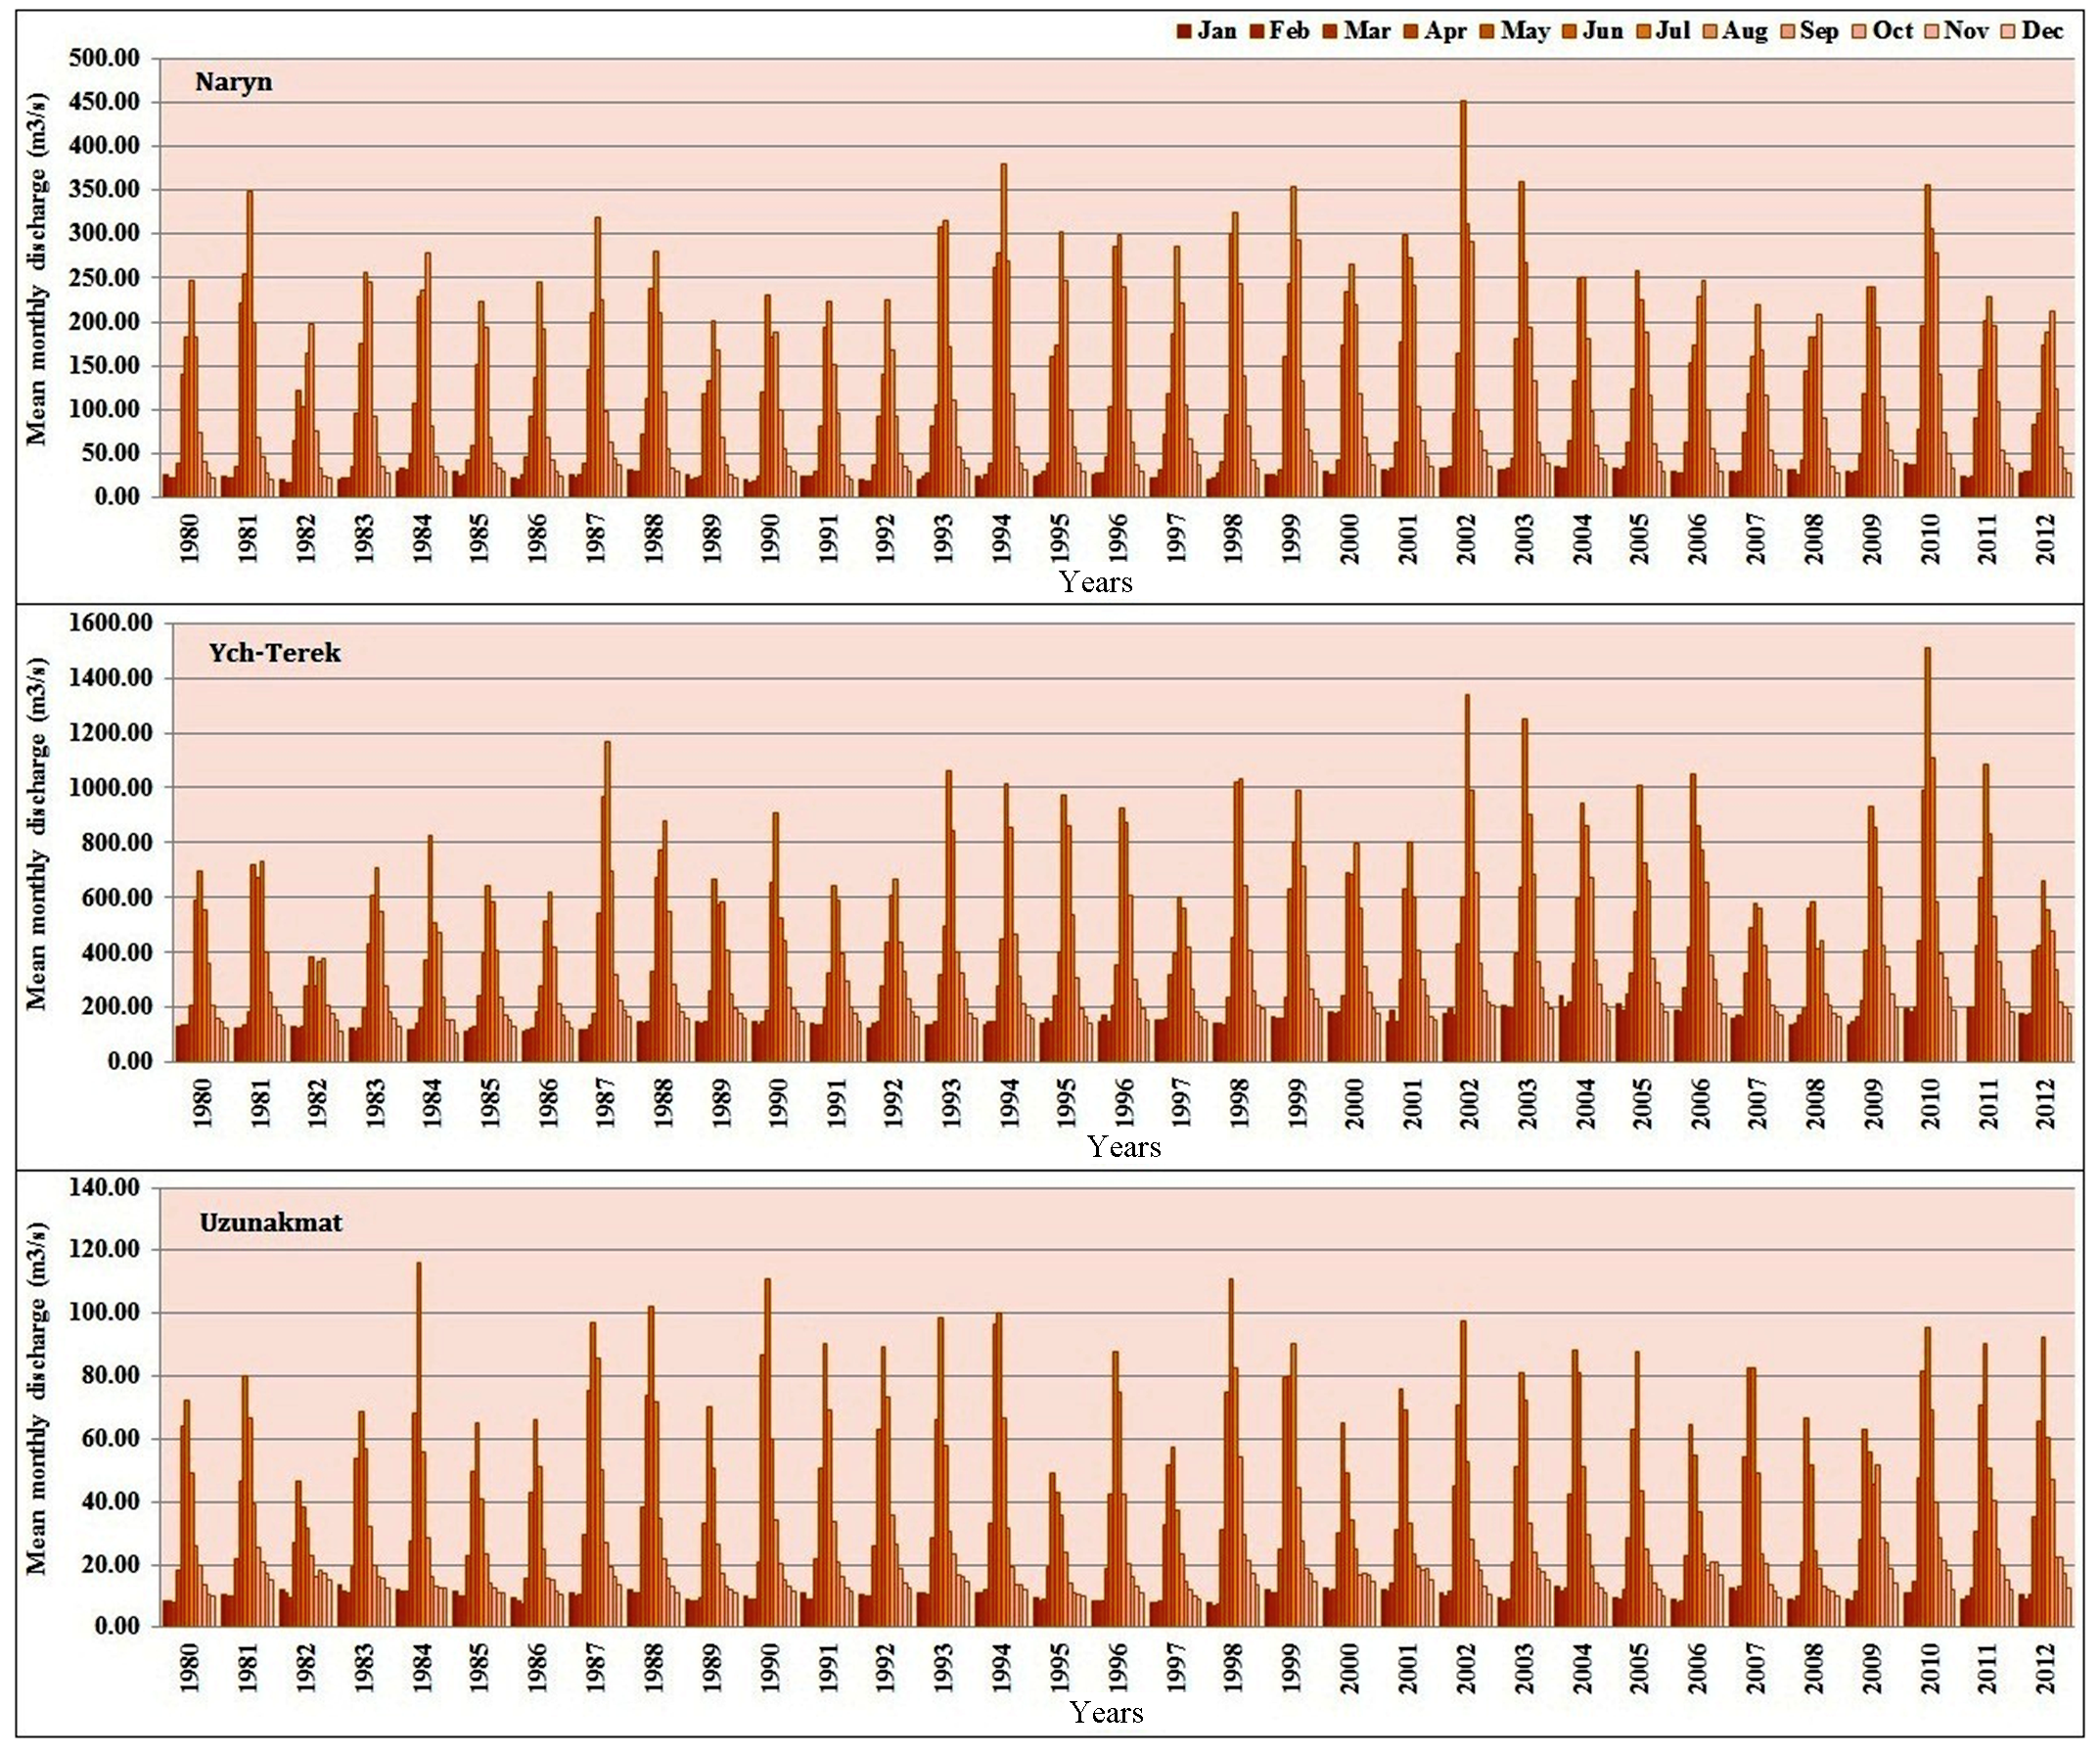
The preliminary checkup of discharge data was carried out and missing values of discharge filled by excel interpolation to form the complete data series. The statistical variables, i.e. mean monthly discharge (MMD), mean annual discharge (MAD), standard deviation (SD), and coefficient of variation (CV) which best signify the long-term variability of stream flow were then used to assess the long-term changes over the basin area (Table 2). The SD is useful to the measure the variability in the discharge data and CV is also useful to measure the relative variability of discharge data (Shinde et al., 2020). Similar variables were also used by Seyam and Othman (2015) to study the long-term variability analysis of a tropical river’s annual stream flow regime. The MMD of Naryn, Ych-Terek and Uzunakmat hydro-station was shown in Figure 2 and MAD, SD, and CV in table 2.
Table 2. Calculated statistical variables from daily discharge data (m3/s)
|
Years
|
Naryn
|
Ych-Terek
|
Uzunakmat
|
|
MAD
|
SD
|
CV
|
MAD
|
SD
|
CV
|
MAD
|
SD
|
CV
|
|
1980
|
85.9
|
79.9
|
0.9
|
288.6
|
208.4
|
0.7
|
25.6
|
23.0
|
0.9
|
|
1981
|
107.9
|
115.5
|
1.1
|
322.3
|
245.5
|
0.8
|
30.4
|
23.2
|
0.8
|
|
1982
|
72.1
|
62.4
|
0.9
|
227.7
|
105.3
|
0.5
|
22.1
|
11.6
|
0.5
|
|
1983
|
90.0
|
87.9
|
1.0
|
301.5
|
215.2
|
0.7
|
27.6
|
20.5
|
0.7
|
|
1984
|
99.0
|
93.3
|
0.9
|
284.5
|
220.9
|
0.8
|
32.1
|
32.5
|
1.0
|
|
1985
|
76.9
|
71.0
|
0.9
|
278.0
|
185.5
|
0.7
|
23.4
|
18.4
|
0.8
|
|
1986
|
79.4
|
74.4
|
0.9
|
253.2
|
171.7
|
0.7
|
23.2
|
19.4
|
0.8
|
|
1987
|
105.0
|
98.2
|
0.9
|
403.6
|
361.0
|
0.9
|
37.1
|
31.9
|
0.9
|
|
1988
|
103.9
|
90.9
|
0.9
|
218.7
|
165.6
|
0.8
|
34.6
|
31.2
|
0.9
|
|
1989
|
72.6
|
65.4
|
0.9
|
309.8
|
194.9
|
0.6
|
22.5
|
19.8
|
0.9
|
|
1990
|
85.5
|
77.3
|
0.9
|
329.9
|
251.3
|
0.8
|
33.5
|
34.2
|
1.0
|
|
1991
|
77.9
|
73.4
|
0.9
|
282.9
|
177.0
|
0.6
|
29.6
|
26.7
|
0.9
|
|
1992
|
77.9
|
68.0
|
0.9
|
313.7
|
186.4
|
0.6
|
32.5
|
27.5
|
0.9
|
|
1993
|
108.4
|
104.8
|
1.0
|
370.4
|
298.0
|
0.8
|
32.1
|
27.7
|
0.9
|
|
1994
|
129.1
|
129.9
|
1.0
|
364.4
|
291.3
|
0.8
|
35.1
|
33.5
|
1.0
|
|
1995
|
102.3
|
96.0
|
0.9
|
357.2
|
288.8
|
0.8
|
20.3
|
14.4
|
0.7
|
|
1996
|
107.3
|
105.3
|
1.0
|
360.0
|
283.0
|
0.8
|
29.3
|
27.1
|
0.9
|
|
1997
|
102.2
|
86.0
|
0.8
|
295.4
|
164.2
|
0.6
|
22.6
|
17.9
|
0.8
|
|
1998
|
114.6
|
112.6
|
1.0
|
407.1
|
325.4
|
0.8
|
38.1
|
34.6
|
0.9
|
|
1999
|
122.2
|
116.1
|
1.0
|
413.5
|
292.6
|
0.7
|
35.9
|
30.1
|
0.8
|
|
2000
|
107.9
|
91.0
|
0.8
|
311.2
|
216.7
|
0.7
|
25.4
|
16.8
|
0.7
|
|
2001
|
116.5
|
102.5
|
0.9
|
342.0
|
221.7
|
0.7
|
28.5
|
21.8
|
0.8
|
|
2002
|
140.6
|
137.8
|
1.0
|
447.6
|
394.5
|
0.9
|
32.5
|
28.4
|
0.9
|
|
2003
|
119.1
|
109.7
|
0.9
|
449.3
|
350.4
|
0.8
|
30.1
|
24.9
|
0.8
|
|
2004
|
101.8
|
82.6
|
0.8
|
430.3
|
268.7
|
0.6
|
32.3
|
27.9
|
0.9
|
|
2005
|
100.9
|
81.9
|
0.8
|
416.6
|
263.5
|
0.6
|
27.8
|
25.0
|
0.9
|
|
2006
|
98.1
|
81.7
|
0.8
|
457.2
|
302.4
|
0.7
|
25.3
|
18.0
|
0.7
|
|
2007
|
89.3
|
66.0
|
0.7
|
312.3
|
161.7
|
0.5
|
32.1
|
27.9
|
0.9
|
|
2008
|
88.6
|
70.6
|
0.8
|
288.6
|
164.7
|
0.6
|
21.4
|
18.7
|
0.9
|
|
2009
|
102.0
|
80.4
|
0.8
|
395.8
|
274.3
|
0.7
|
30.1
|
19.4
|
0.7
|
|
2010
|
135.6
|
118.5
|
0.9
|
529.0
|
439.3
|
0.8
|
37.5
|
29.7
|
0.8
|
|
2011
|
97.7
|
77.3
|
0.8
|
415.7
|
313.1
|
0.8
|
32.1
|
26.2
|
0.8
|
|
2012
|
90.5
|
68.8
|
0.8
|
332.8
|
169.9
|
0.5
|
33.7
|
27.0
|
0.8
|
The average annual discharge of a river is imperative display to know the availability of water and flood situation for further water resource management (Higashino and Stefan, 2019). This varied range of hydrological variables can be support to measure the variations in the appearances of stream flow (Moliere et al., 2009). The SD and CV are quantitative statistical measures of dispersion in a selected data arrangement around its average. The CV of annual discharge data signifies the ratio of standard deviation to the average annual flow. Moreover, CV tallies the degree of dispersion and changes within the data (Boik and Shirvani, 2009; Albrecher et al., 2010). Thus, the calculated SD is the root of the variance which highlighted here a degree of dispersion in selected mean discharge data. Spatio-temporal analysis of discharge data using statistical techniques (Shinde et al., 2020) is an important feature to describe the hydrological appearance. It helps to know the discharge variability and water availability within the basin to remark the river hydrology (Garba et al., 2013). The temporal changes in SD and CV of the Naryn, Ych-Terek and Uzunakmat hydro stations are shown in Figure 3, 4 and 5. Even though various methods have been used for trend and frequency analysis, the attempted analysis proposed to understand the spatio-temporal variation of discharge and the reasons for the variations.
3.2 Rainfall Data and Pearson’s Correlation Coefficient
Daily rainfall data of Naryn meteorological station was obtained and it converted in the mean annual rainfall. Pearson’s correlation coefficient (r) was used to know the relationship between discharge (y) and rainfall (x). The Pearson’s correlation coefficient (ranging from -1 to 1) signifies the degree of linear coherency between these two variables. The value 1 denotes a perfect positive correlation and the value -1 denotes a perfect negative relationship (Karlsson et al., 2013; SSS, 2020). The correlation coefficient was calculated using Equation 1.
\(r = {\displaystyle\sum_{i} (x_i-\bar{x}) (y_i-\bar{y}) \over \sqrt{\displaystyle\sum_{i} (x_i-\bar{x})^2} \sqrt{\displaystyle\sum_{i} (y_i-\bar{y})^2}}\) (1)
where, xi and yi are the two variables (rainfall and discharge) at time i, x and y are the mean of rainfall and discharge, respectively.
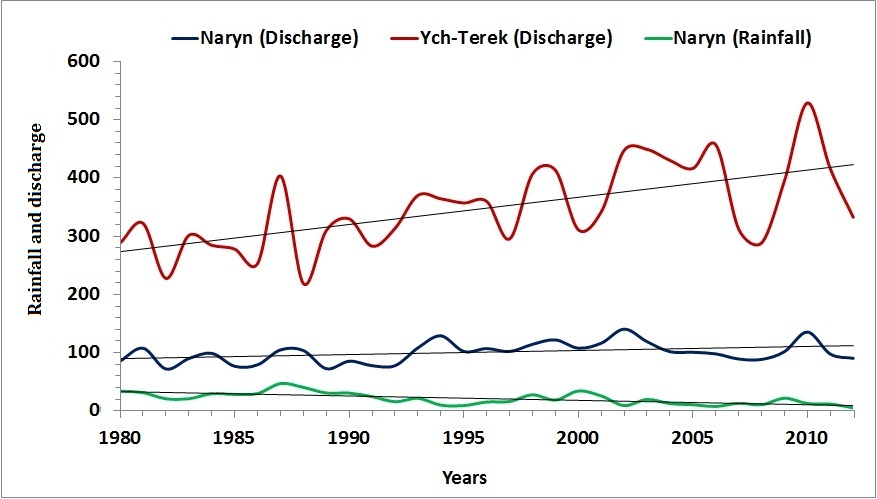
Linear trend lines are plotted (Figure 6) to know the correlations between mean annual discharge (Naryn and Ych-Terek) and mean annual rainfall (Naryn).
3.3 Time Series Graph
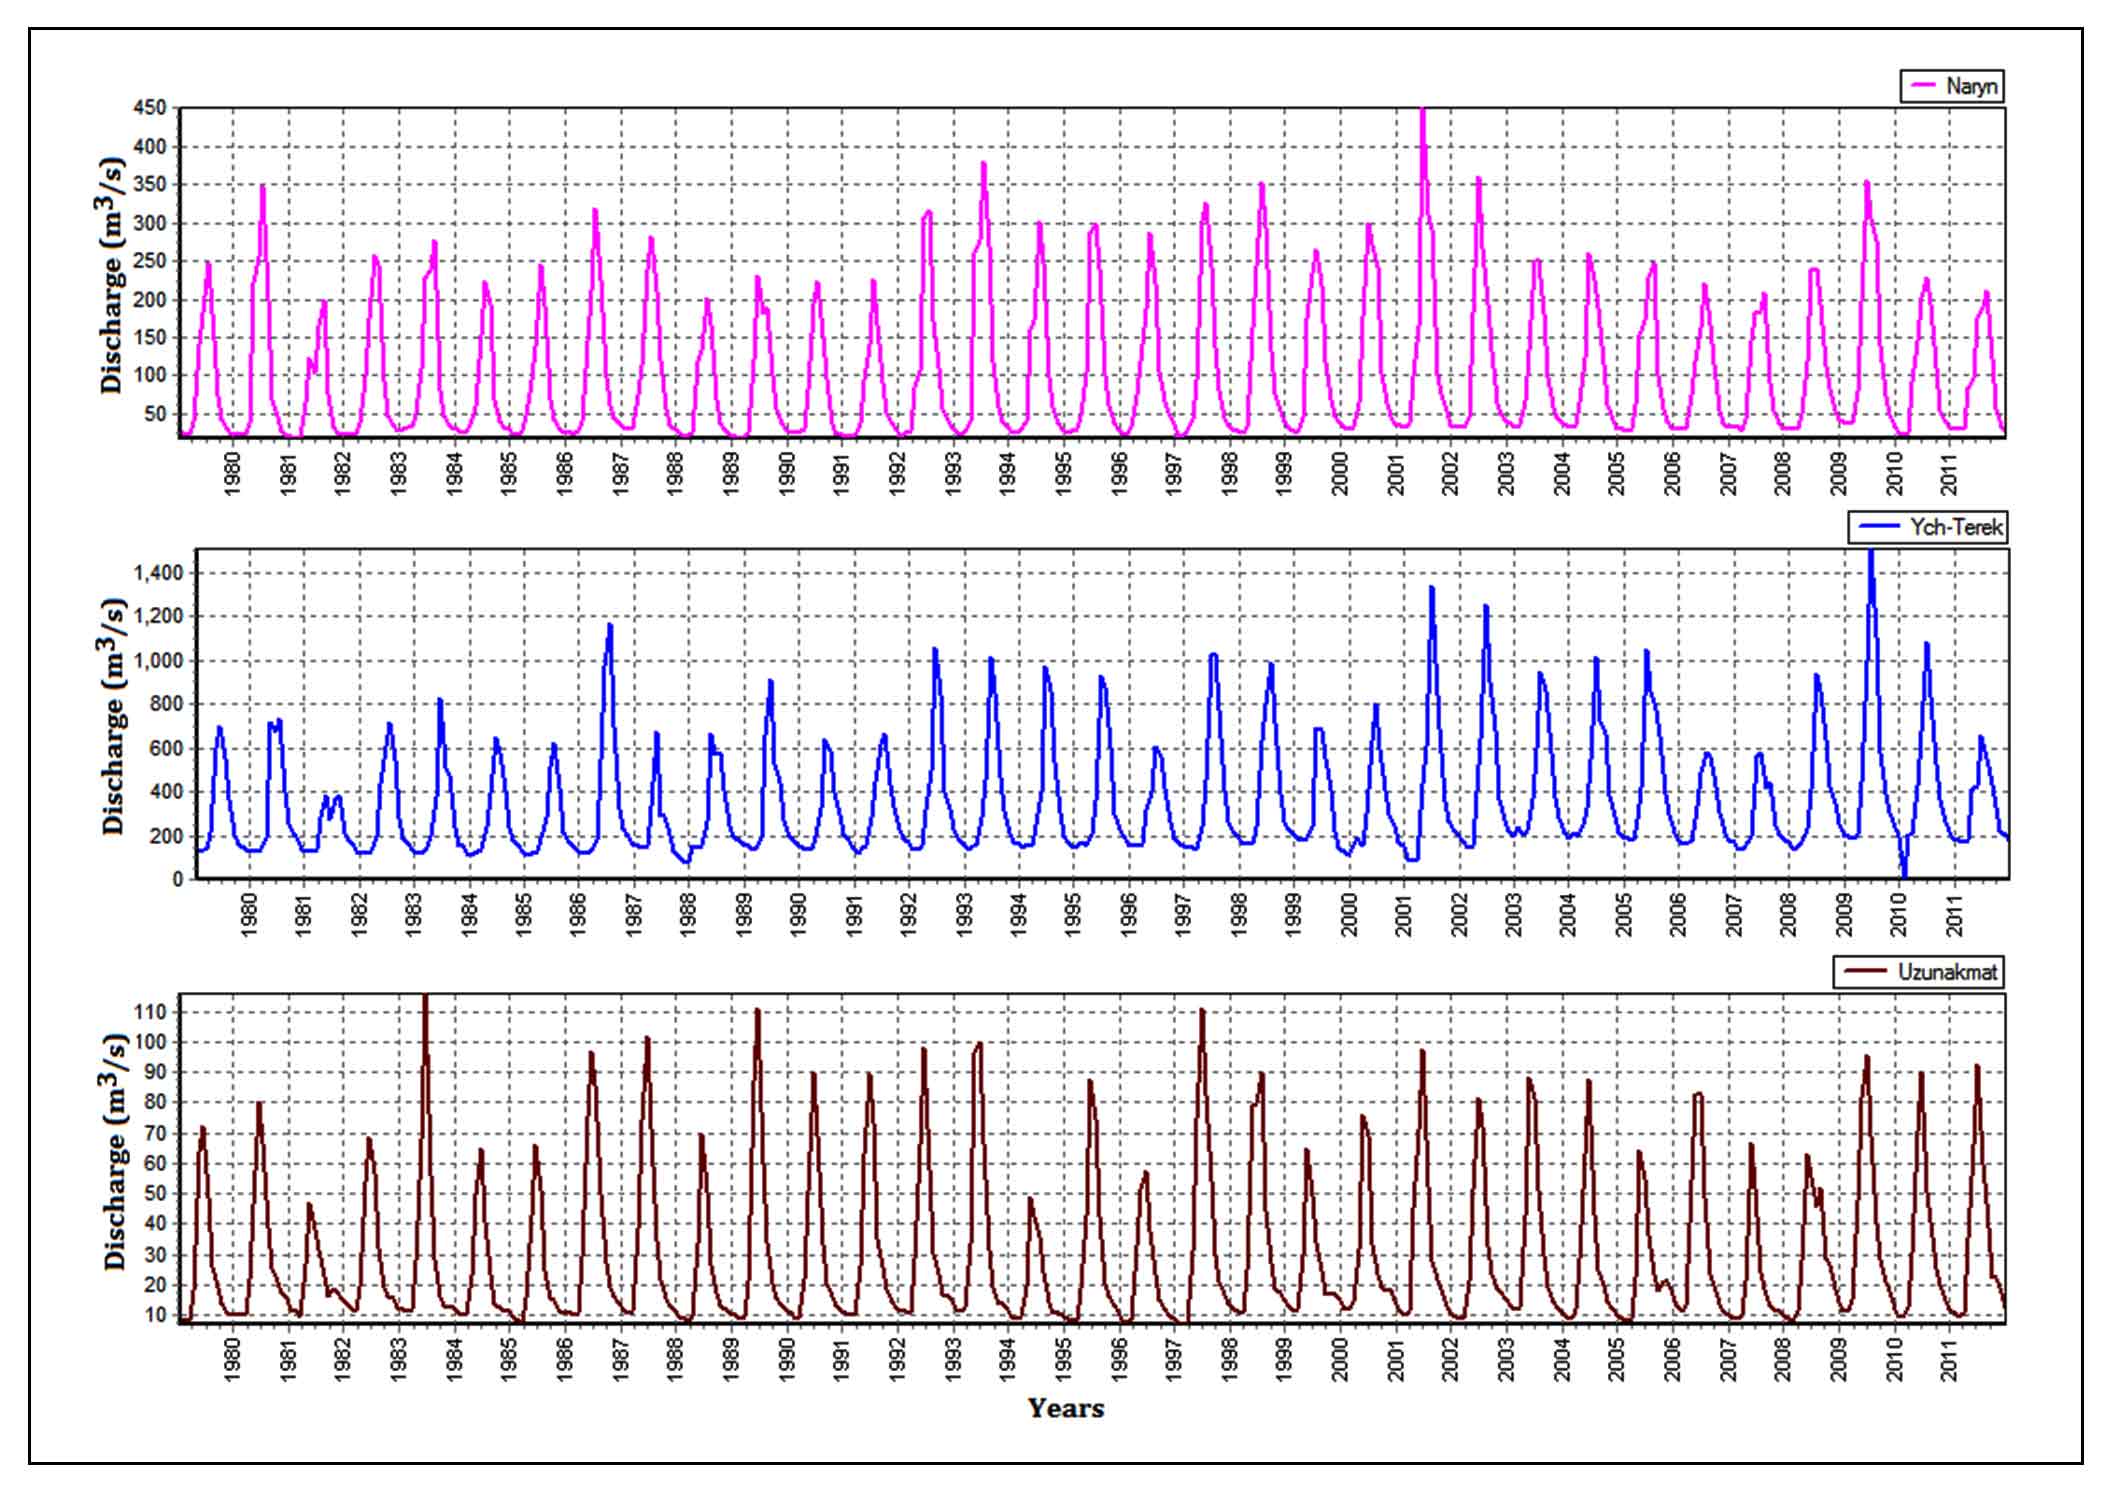
Time series graphs were prepared to show the trends or pattern of discharge using recently developed Hydrognomon (V. 4.0.3) software (Figure 7). It is a publicly available package developed by the ITIA research team of National Technical University of Athens in 1997 for processing the hydrological data. Most of the time series models applied for stream flow predictions practice which are nearly linear models because it constructed under the assumption that they follows the normal distribution process, however maximum stream flow are nonlinear (Wang, 2006). In view of this, Hydrognomon software was used because it supports several time steps from the finest minute’s scales up to decades for processing the hydrometric data and time-series data analysis (Kozanis et al., 2010; Garba et al., 2013). This software gained more and more popularity for plotting the time series graph of discharge and also supports to perform the frequency analysis among many other hydrologic tasks (Houessou-Dossou et al., 2013). Time series graph presents the regular data measurements taken over fixed time intervals. Similarly, it highlights the trends in data series values over time. Therefore, the aim of the trend plotting was to fix if values of an MMD data series of stations have an overall increase or decrease with time.
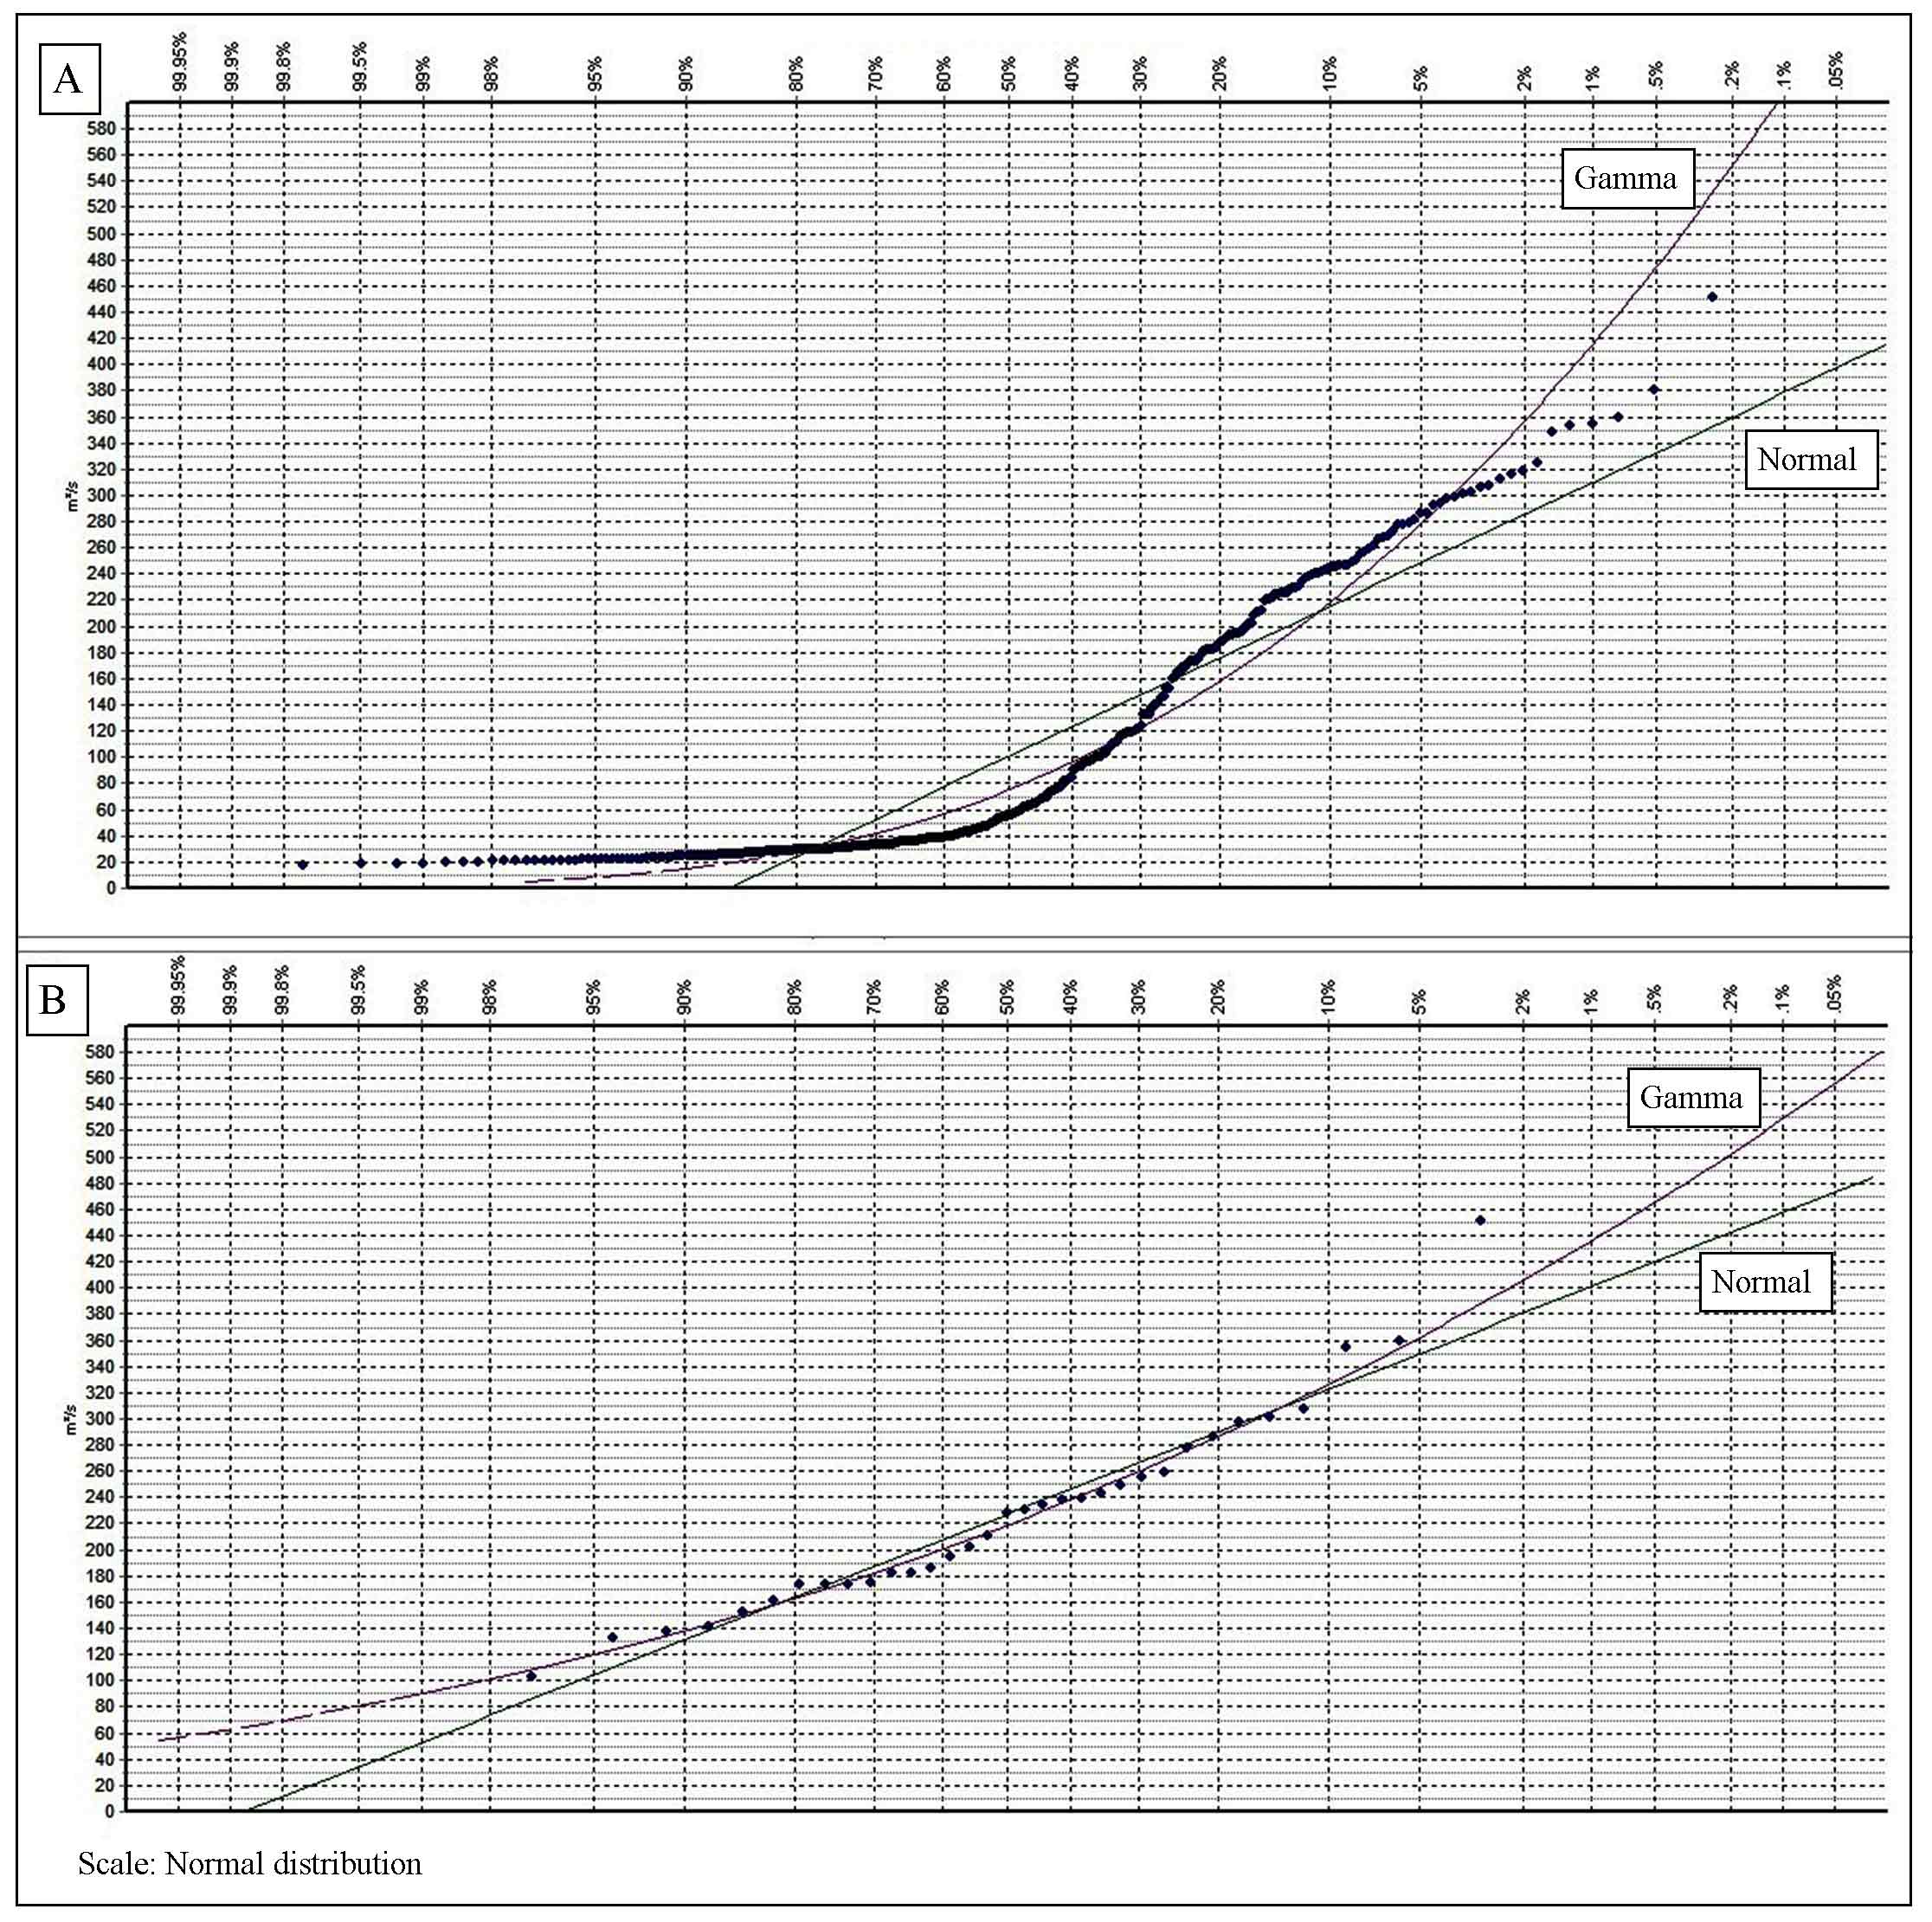
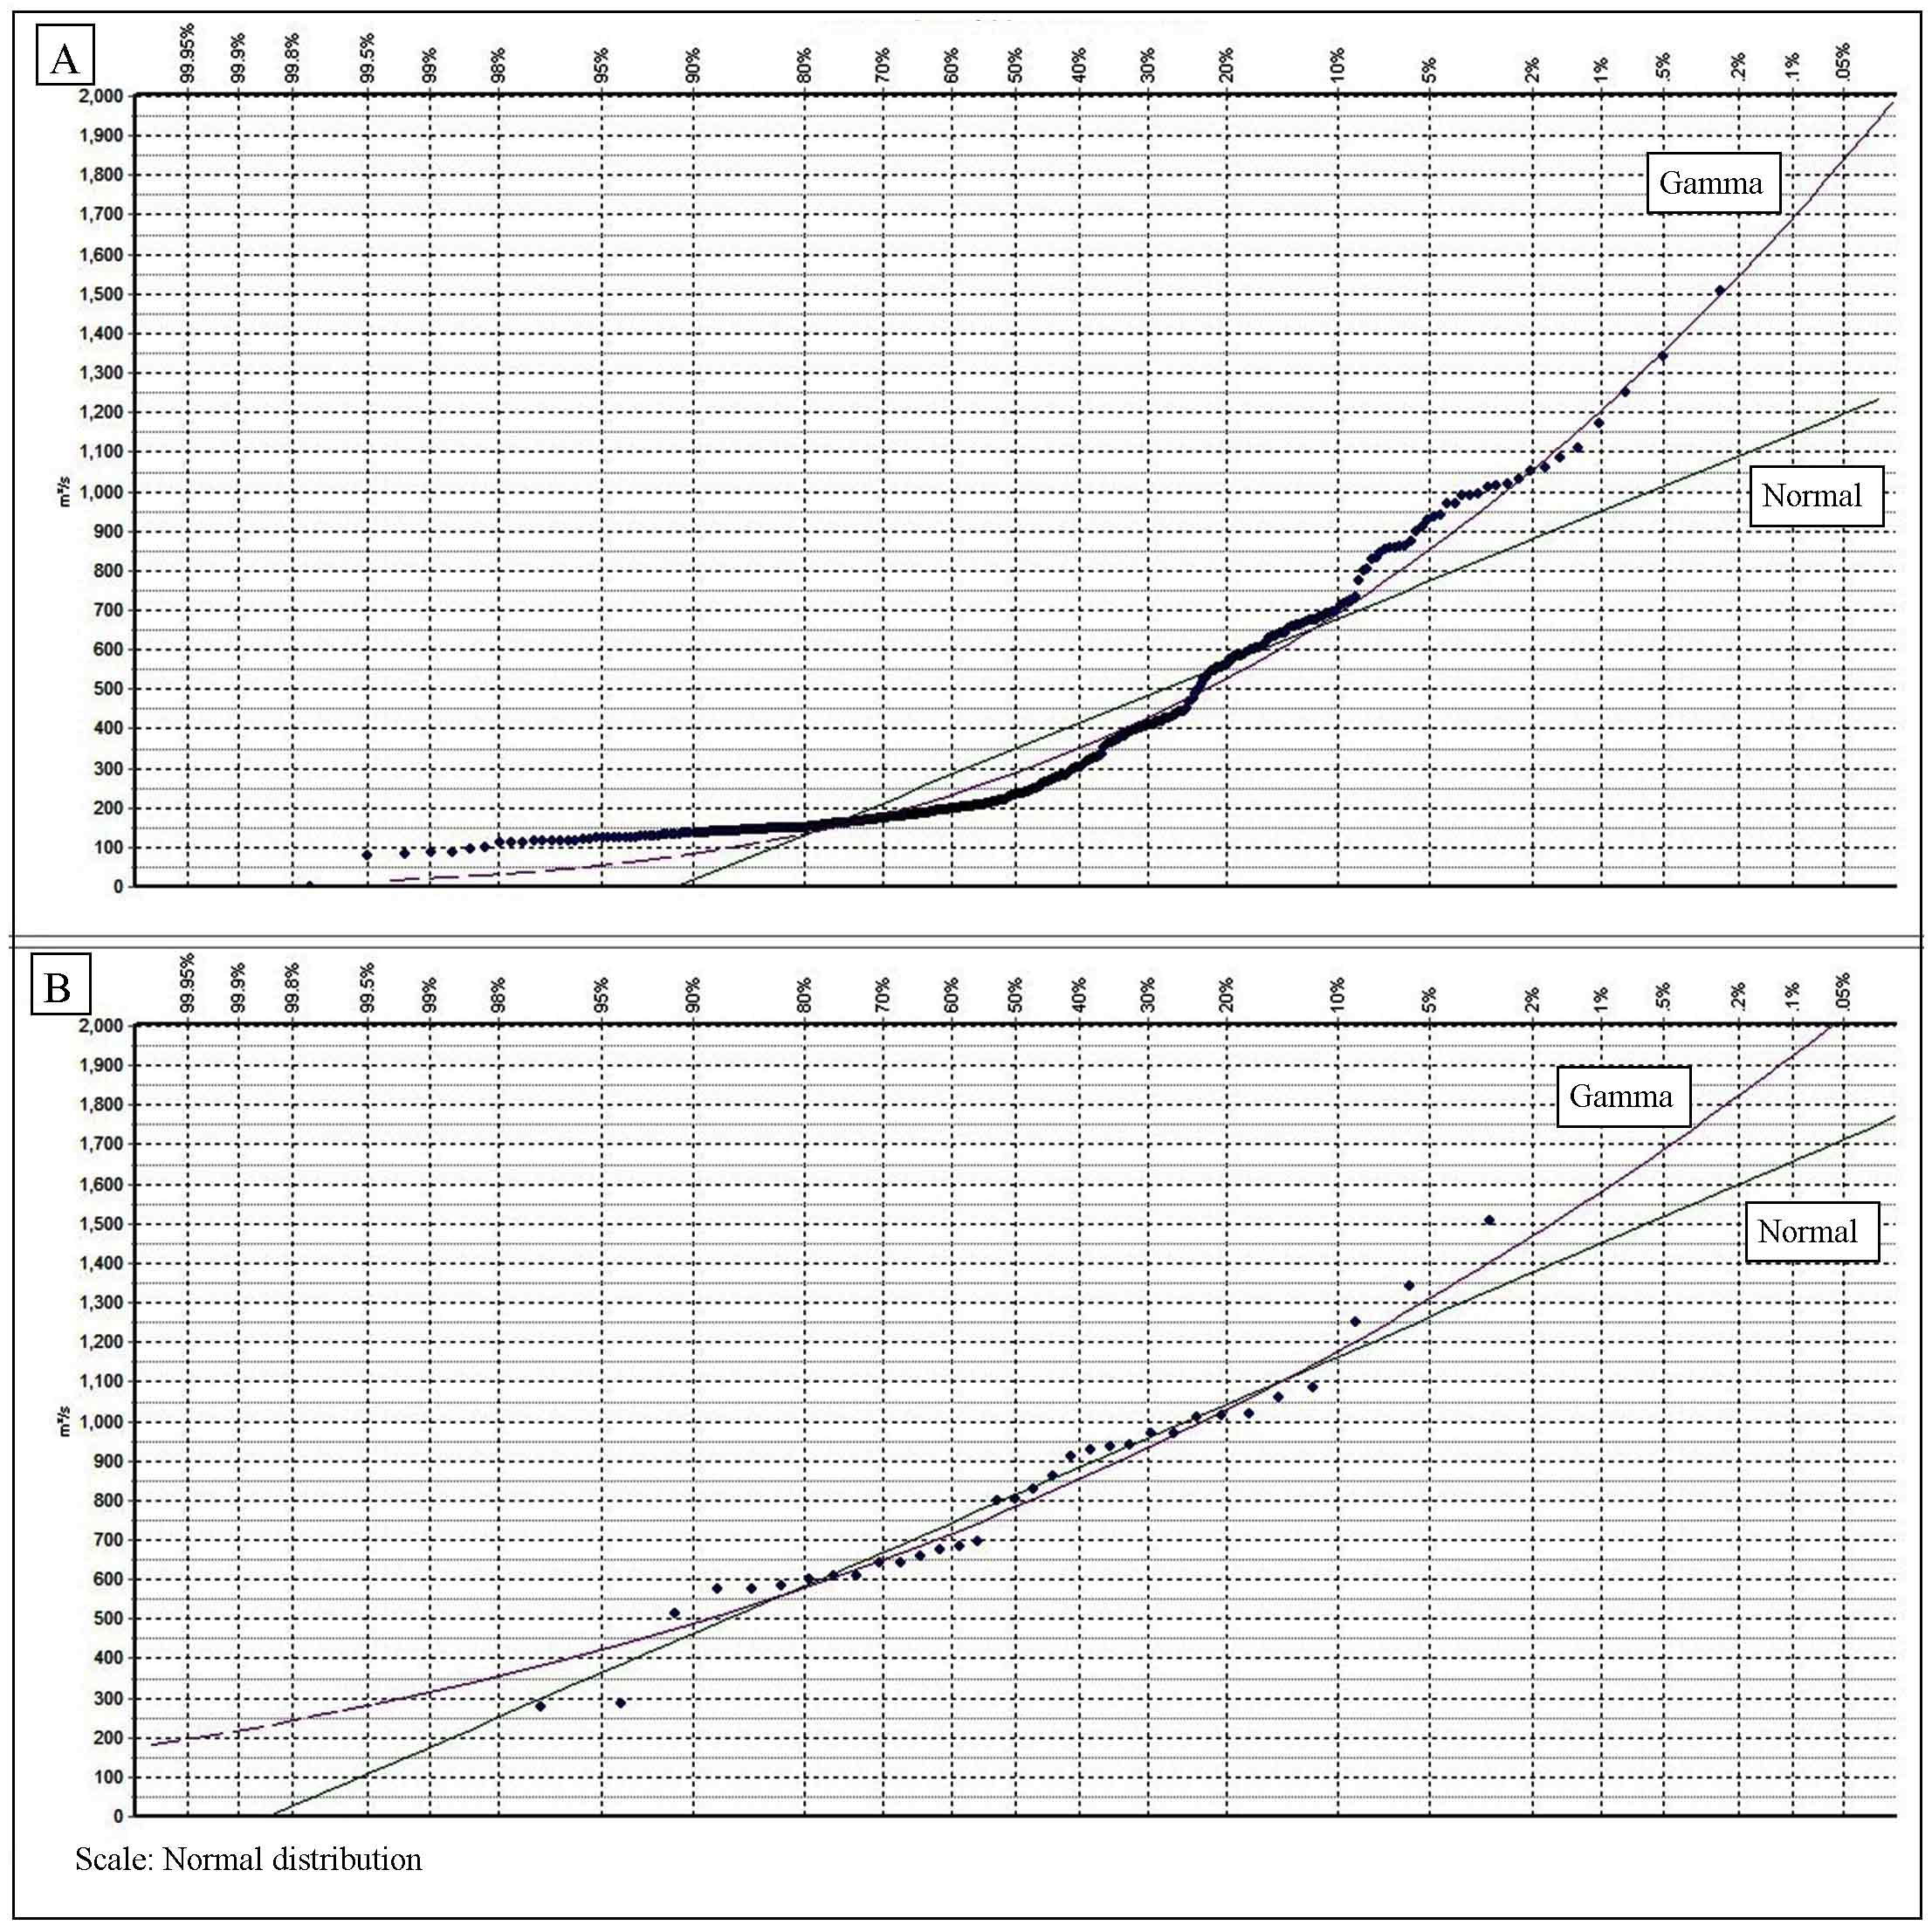
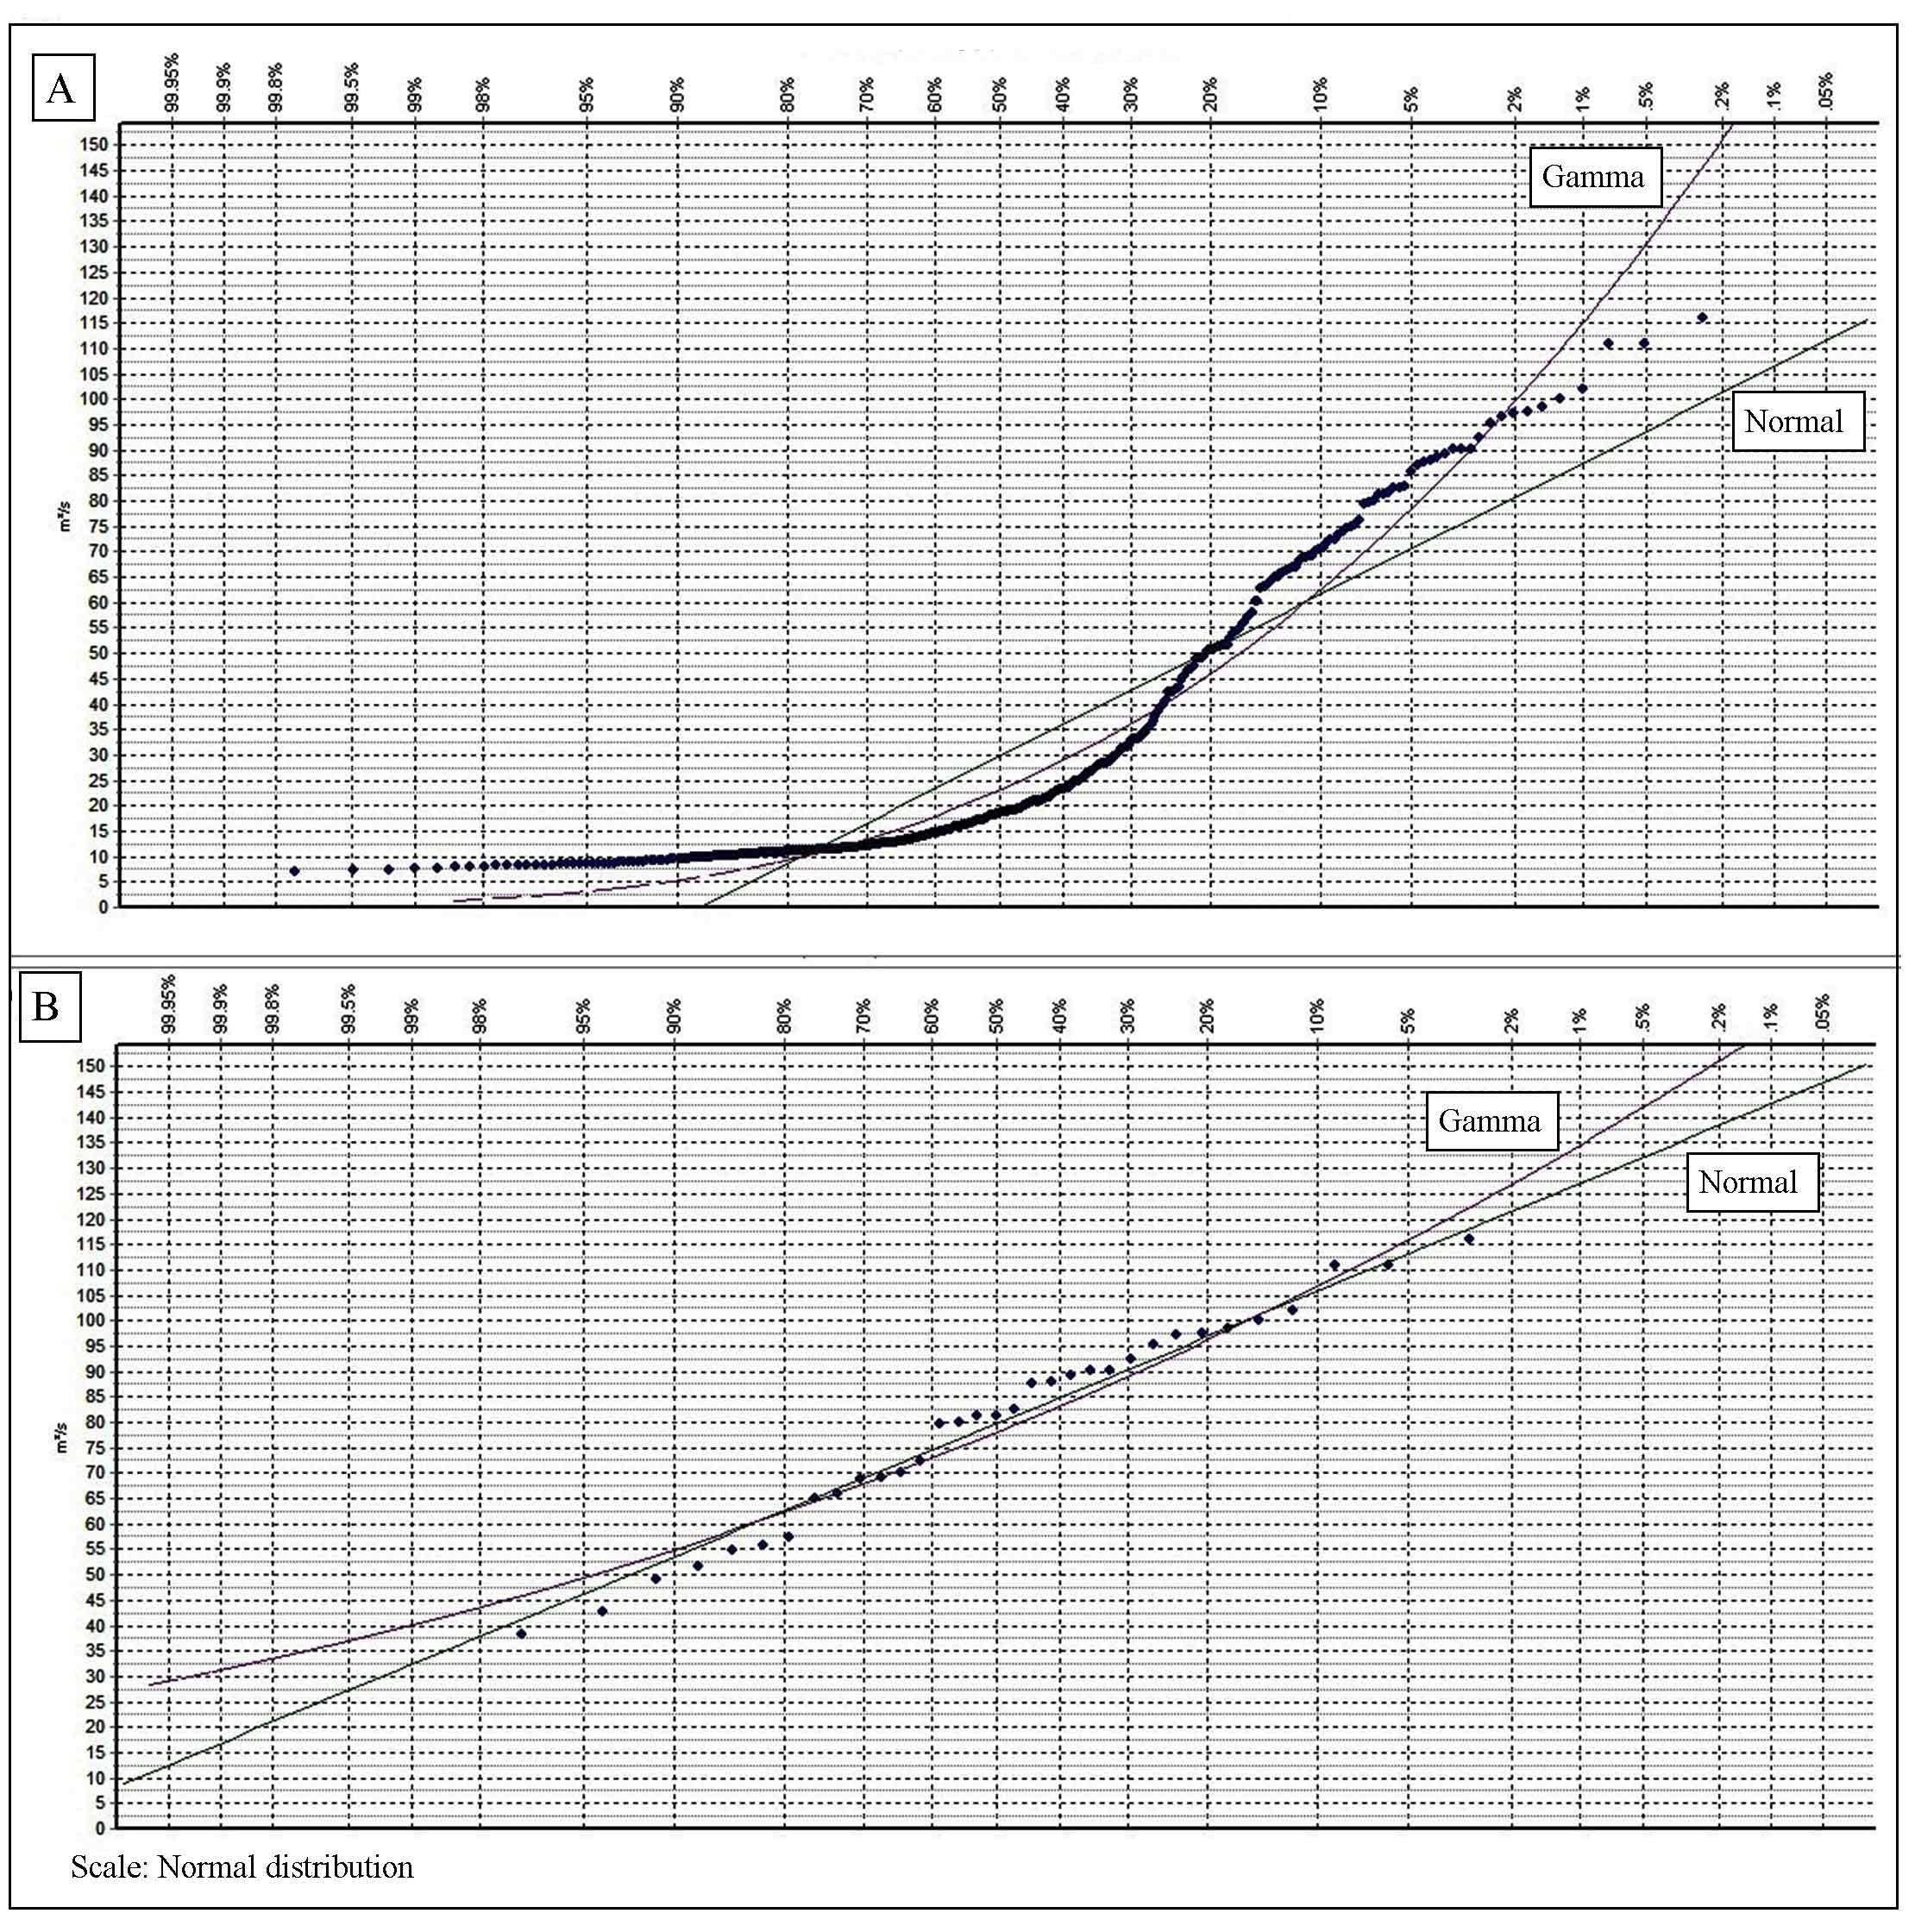
3.4 Exceedance Probability
Exceedance Probability (EP) of discharge data was plotted using advanced PYTHIA tool of Hydrognomon software for calculation of sample statistics and estimation of Normal and Gamma families. The distribution function of PYTHIA tool was used in order to plot the normal distribution and visualize the % EP of discharge data. The calculated statistical data are used to form the incidence distribution graphs that tell the likelihood of various discharges as a function of EP. A similar graph was also prepared by Garba et al. (2013) to know the discharge variability of Kaduna River. In the statistics, the normal distribution is the significant probability distribution which often used to represent the real-valuable random variables whose distributions are unknown (George and Roger, 2001). In this attempt, EP plotting was shown based on two time scales, 1) Plotting of yearly changes and 2) Plotting of monthly changes (Figure 8, 9, 10). This work takes into account for the detection of the changes in the mean monthly and mean annually duration of high and low discharge. Computation of the monthly probability of maximum seasonal discharges is required to define the flood period. Thus, to know the maximum discharge in the Naryn river basin determination of EP distribution was carried out. This distribution analysis furthermore involved an examination of variability in monthly and annual duration for investigations of the trends of changes in the discharge over the 33-years.
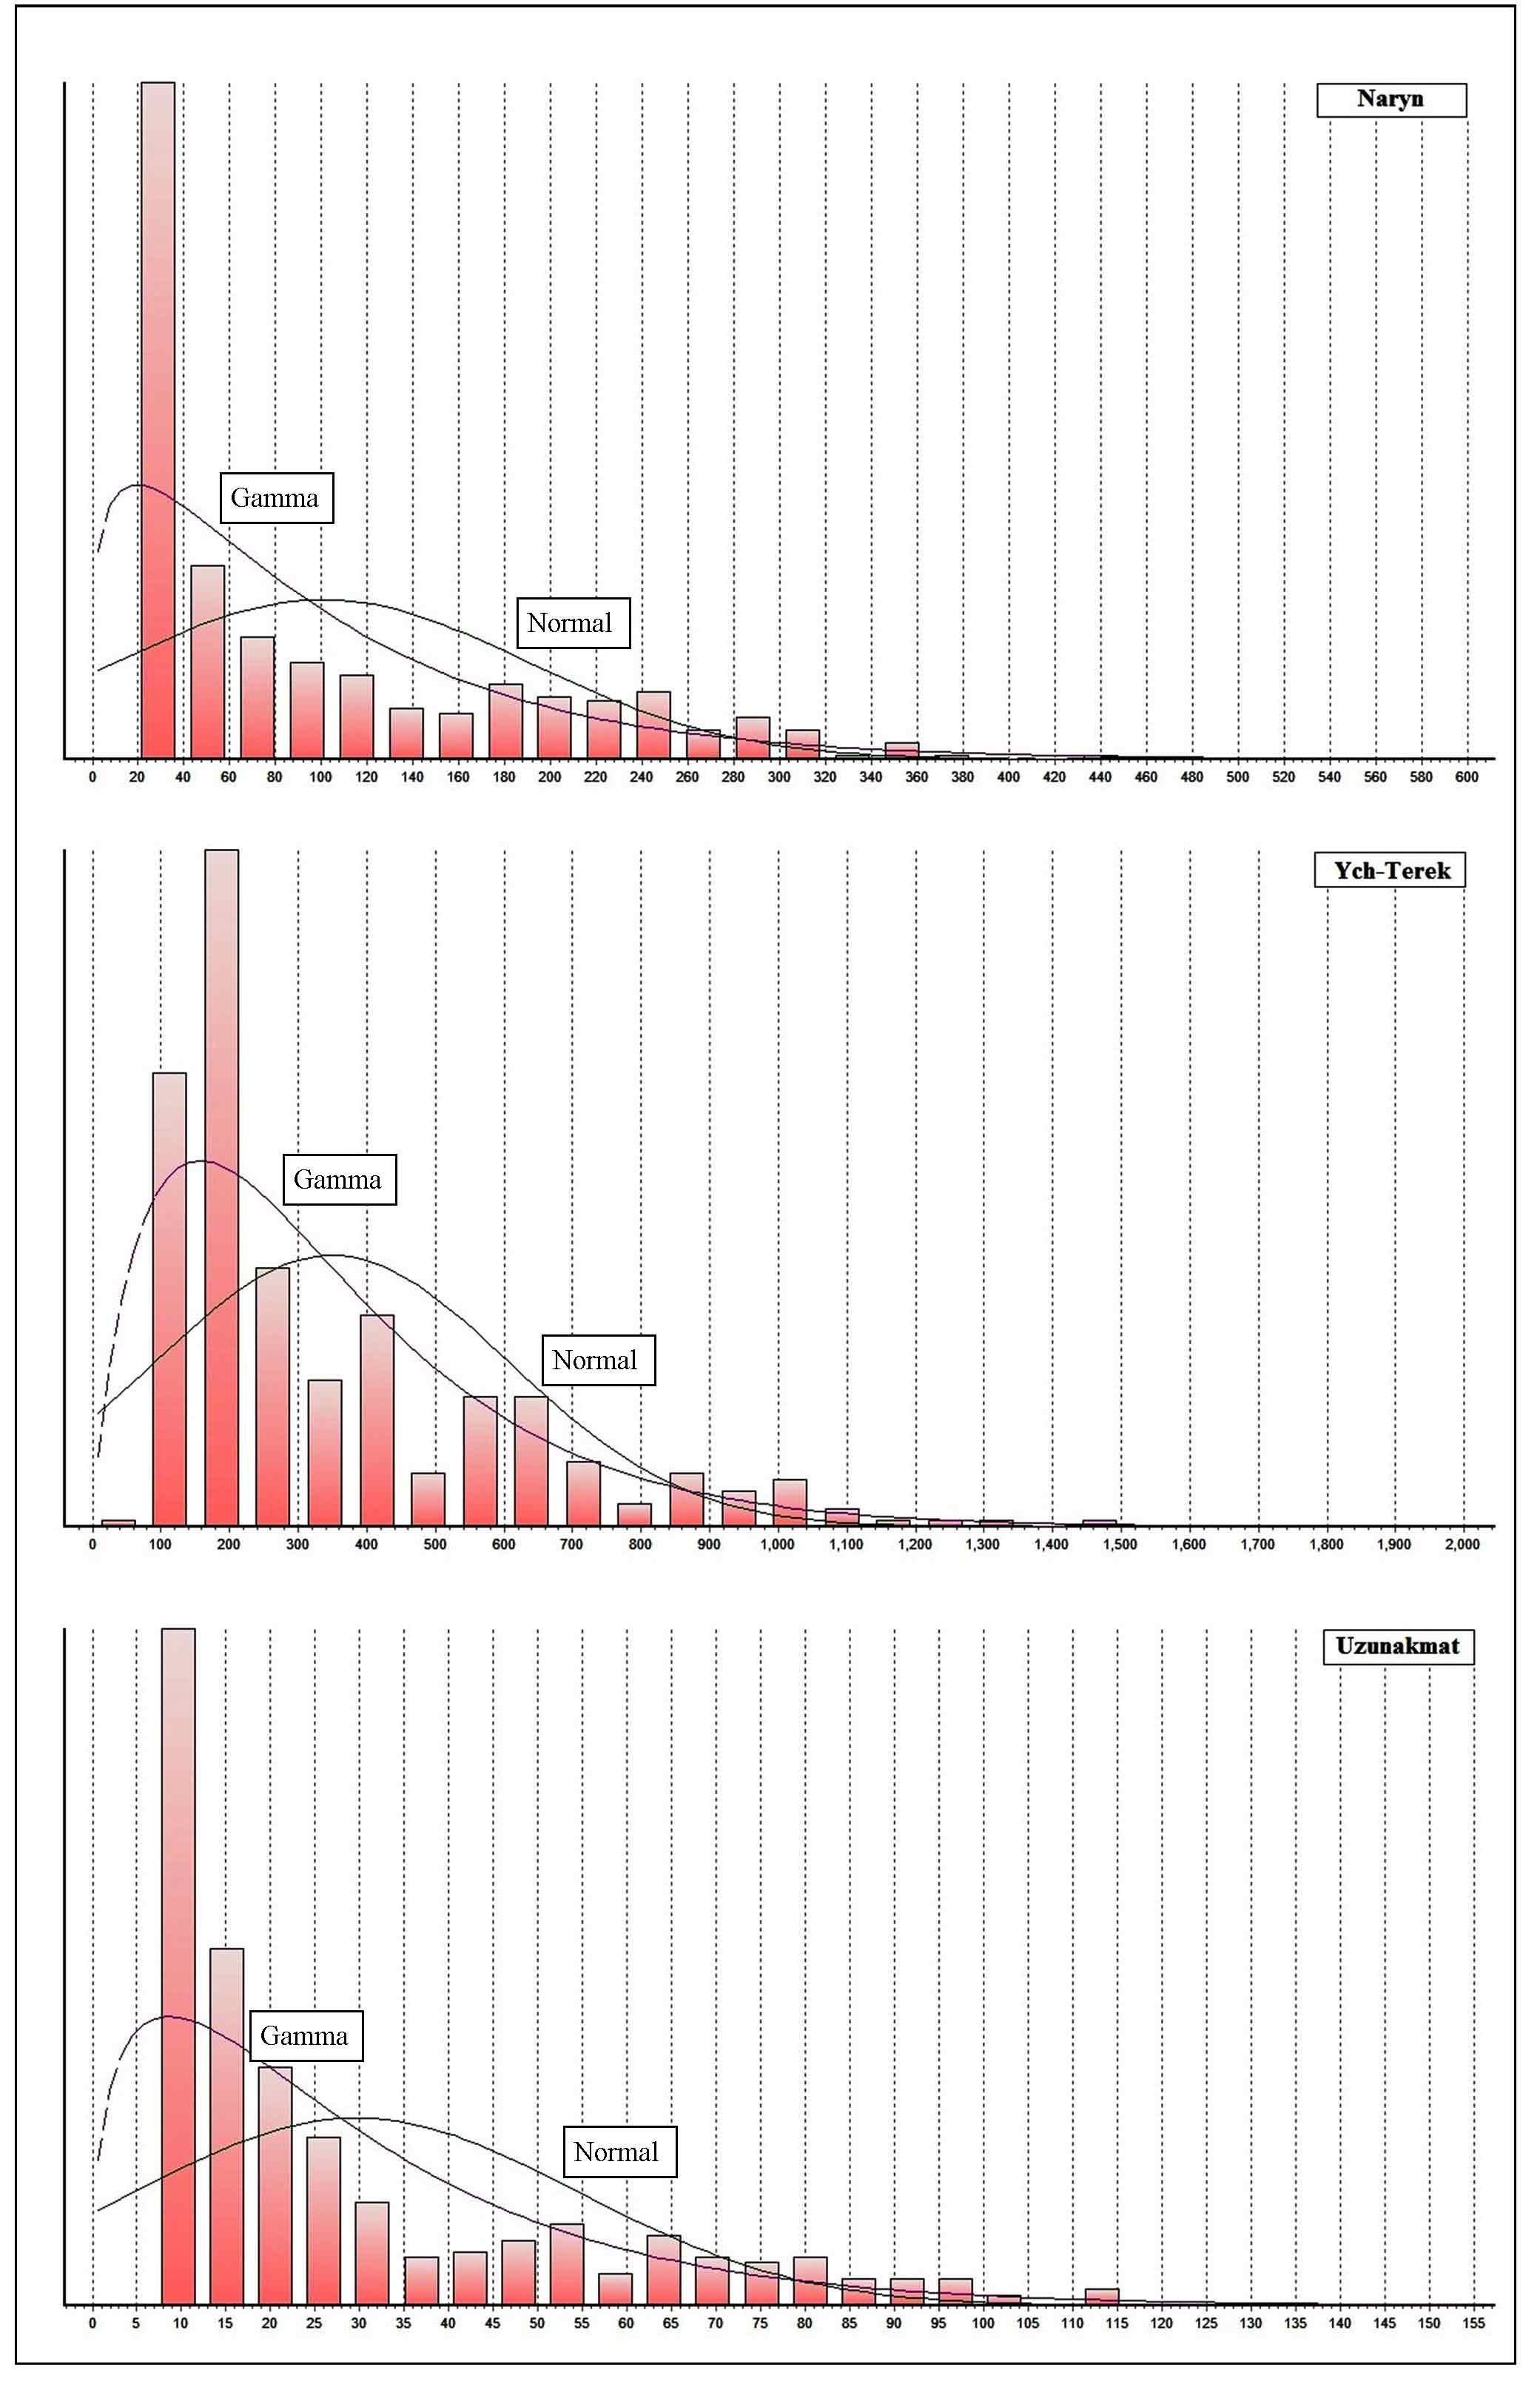
3.5 Frequency Distribution
The PYTHIA tool of Hydrognoman software was used in order to visualize the river discharge more precisely using mean monthly time series data. Because, it is quite challenging to present the precise frequency analysis of a discharge using customary time series linear and nonlinear model methods (Wei et al., 2012). Histrograph was plotted to compare the frequency distribution of discharge data using same Hydrognomon software (Figure 11). This discharge frequency analysis can be helped to predict the possible flood situations along the Naryn river channel, if any. Histrograph representation is a graphical technique to check the normality for comparing the frequency distribution (histogram) of discharge records. The histogram can be visualized whether the selected data is fine-modeled by a normal distribution or not (Coin, 2008; Seyam and Othman, 2015). Such kind of long-term fluctuations in discharge flow can be identified using stream magnitude, rate, frequency, duration, timing, and rate of change characteristics (Poff and Ward, 1989).
4 . RESULTS AND DISCUSSIONS
4.1 Discharge Characteristics
4.1.1 Mean Monthly Discharge
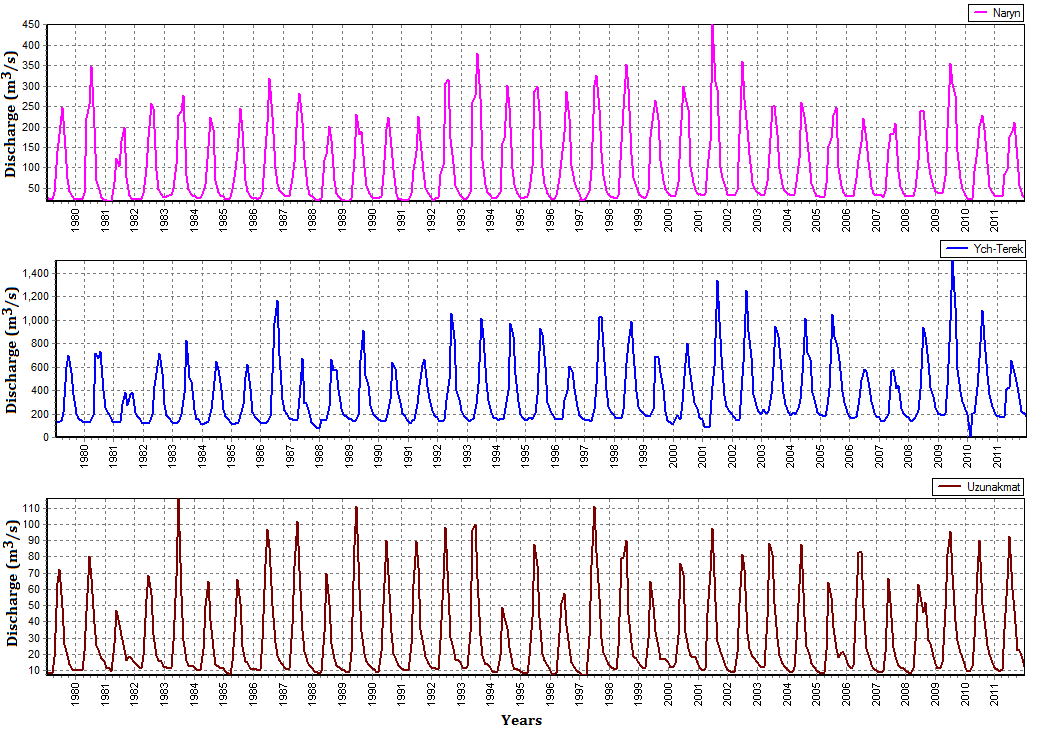
The rate of MMD was observed higher in almost all June and July months in the selected periods due to seasonal changes. In each year observed the high magnitude of discharge in the summer season, i.e. June-July-August while low magnitude in the winter season, i.e. December-January-February (Figure 2). The snow in the high elevated mountain area melts especially in June that time maximum runoff occurred which contributes to the stream flows (Gan et al., 2015). Thus, the reasons behind high MMD have been a snow melting process, especially in the eastern margin of the Naryn basin, which particularly supplies the water to the river in summer season. In a 33 years period, sometime noticed high magnitude spikes of the discharge values may be because of local weather fluctuations. At the Naryn station observed the spikes of MMD in July 1981 (348 m3/s), July 1994 (380 m3/s), June 2002 (451 m3/s), and June 2010 (355 m3/s). Similarly, at Ych-Terek station observed three spikes of discharge in July 1987 (1170 m3/s), June 2002 (1340 m3/s), and June 2010 (1507 m3/s). At Uzunakmat station also observed the spikes in MMD in June 1984 (116 m3/s), June 1990 (111 m3/s), and June 1998 (111 m3/s). Such hydrological behaviors seen in the basin area are also due to the elevations of the hydro-stations (Naryn 2037 m, Ych-Terek 998 m, Uzunakmat 1879 m), from MSL and its associations with ice saturations and melting process. Generally, in the mountains area, moisture penetration prevents into central areas which resulting in low winter precipitation, with maximum sums occurring in June and July months (Aizen et al., 1995) due to snow melting process. According to Gan et al., (2015) the peak runoff in the Naryn basin will advance in May-June month, which will shift in runoff periods likely to increase the spring runoff average and decrease the summer average.
4.1.2 Mean Annual Discharge
In the average annual discharge data series seen the discharge variability which shown the annual rise and fall. At the Ych-Terek station observed the long term trend in the MAD graph where appeared higher discharge peaks and troughs seem to be increased each year up to 2010. More than 200 m3/s discharge was observed at Ych-Terek station as compared to other two stations. It is located in the downstream channel of the Naryn River basin area where meet the multiple channels (Figure 1). The characteristic of this discharge data series graph was cyclic nature and seem to raise long-term trend up to 2010. Instead of this, normal escalation was seen at the Naryn station in the 1994 (129.1 m3/s), 2002 (140.6 m3/s), and 2010 (135.6 m3/s) year might be due to local weather changes. A high MAD can be a good indicator of climate change and/or flood risk in the basin (Higashin and Stefan, 2019). Inter-annual variation in MAD in overall 33 years was noticed at the hydro-stations because of its relative locations, altitude, and regional seasonal cycle. Higher discharge i.e. 38.1 m3/s (Uzunakmat) in 1998, 140.6 m3/s (Naryn) in 2002 and 140.6 m3/s (Ych-Terek) in 2006 whereas lower discharge, i.e. 20.3 m3/s (Uzunakmat) in 1995, 72.1 m3/s (Naryn) in 1982 and 218.7 m3/s (Ych-Terek) in 1988 was seen (Table 2). At the Ych-Terek station, significant increase in the magnitude and frequency of high discharge was recorded as compared to the past decades. The value of MAD was changed extremely after 2009 due to the relevant climatic changes. Furthermore, analysis revealed nearly negligible changes in MAD for Naryn and Uzunakmat stations. This kind of spatio-temporal changes in MAD can result of spatio-temporal differences in precipitation and spatial variations in the basin that decipher meteorological responses into the hydrological response (Burn and Elnur, 2002).
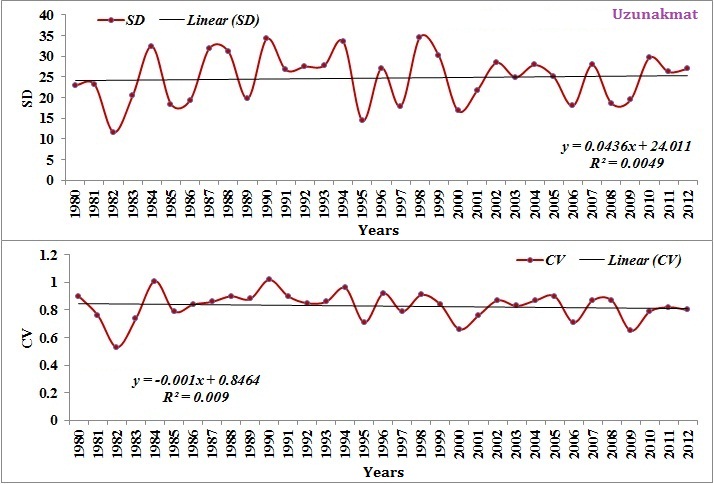
4.1.3 Standard Deviation
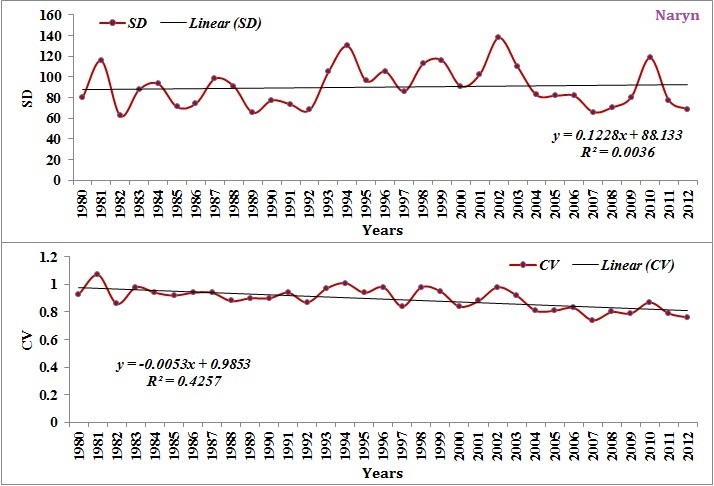
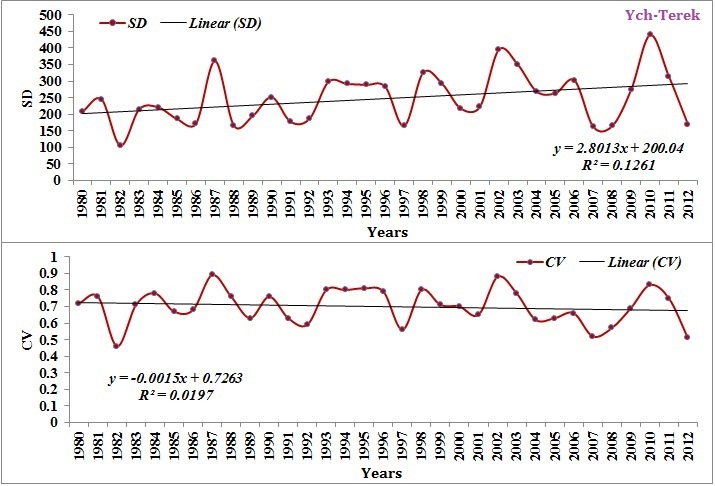
At the Naryn station seen the lower SD value (62.4) in 1982 and higher (137.8) in 2002 whereas at Uzunakmat station, low SD (11.6) in 1982 and higher (34.6) in 1998. The relative range of SD was recorded higher at Ych-Terek station. Here, recorded the higher SD value (439.3) in 2010 while lower (161.7) in 2007. Thus, the inter-hydro station and temporal variations in SD values indicated the discharge variability. The trend of SD was highly increased from 1980 to 2011 at Ych-Terek station. In 1980, it was 208.4 which increased up to 313.1 in 2011. Remaining two stations trends are not so far increased or decreased. Low SD values at the Uzunakmat station visualizes that the variations tend to be near to the average and high SD values at Ych-Terek station show that the variations spread out over a wider range of discharge values. Therefore, there was large variation in selected periods at all the hydro-stations in discharge data where these SD values can be used to form a benchmark for estimating the overall spatio-temporal variation (Shinde et al., 2020). The normal and linear SD lines showed the year-wise SD of discharge data of all gauging stations scores (Figure 3, 4, 5). The SD values of Ych-Terek station show a large variability, which reflected in a large deviation of the extreme annually discharge (Figure 5). Observed high SD at Ych-Terek station highlighted the mean discharge was not steady, which was changed over time.
4.1.4 Coefficient of Variation
The CV (Table 2) interprets the maximum discharge variability was seen in the 1981 year at the Naryn station (1.1) while minimum in 1982, 2007, 2012 at the Ych-Terek station (0.5) and Uzunakmat station (0.5) in 1982. It showed how much discharge data are dispersed around their mean in the selected stations and period (spatio-temporal variability). According to the discharge data series, more than 80% of the stream flow observed during the summer season (June-July-August) due to ice melting in the upper reaches of the basin. The reason behind low CV around Uzunakmat station is that its relative location in the western mountain part of the basin. In this area, the orographic factors produce a common decline in precipitation and temperature along a northwest to southeast slope (Sorg et al., 2012). Similarly, changes in temperature and allied snow and glacier melting process influenced this discharge process. Because, in this area more than 50% of the flow is originating from the snow and glacier melt sources (Savoskul et al., 2003). Therefore, these spatio-temporal variations in discharge were strongly influenced from regional temperature, orographic influence, precipitations, and snow melting process.
Table 3. Comparative Exceedance Probability (%) of hydro-stations
|
Hydro Stations
|
Years
|
Discharge (m3/s)
|
EP (%)
|
Probability
|
|
Naryn
|
1982
|
17
|
99.7
|
Maximum
|
|
2002
|
451
|
00.2
|
Minimum
|
|
Ych-Terek
|
1988
|
80
|
99.5
|
Maximum
|
|
2010
|
1507
|
00.3
|
Minimum
|
|
Uzunakmat
|
1998
|
6.8
|
99.7
|
Maximum
|
|
1984
|
116
|
00.3
|
Minimum
|
4.2 Rainfall and Discharge Relationship
The Pearson’s correlation coefficient (r) between Naryn station discharge and rainfall was -0.2121. Similarly, between Naryn station rainfall and Ych-Terek station discharge value was -0.4238. It means that, the result of correlation between discharge and rainfall was found negative, thus, the relationship between both the variables was weak. Therefore the possible glacier melting may be playing the significant role in the discharge variability process. The discharge pattern of the Naryn River doesn’t highly depend on rainfall pattern. It is because of the possible glacier melting in the high elevated part, located in the eastern and south-east side (Figure 1). It was also validated from the trend of rainfall at Naryn station which was seen to decrease while the discharge trend was increase slightly at Naryn and highly at Ych-Terek station (Figure 6). It means that, discharge variability in the Naryn basin was possibly determined by glacier melting process as an influence of changing climate. The reasons behind increasing trend of discharge at the Ych-Terek station was its location where various streams/drainage are meet to Naryn River. Besides, the topography of the Tian Shan Mountain perhaps influences this variability, as it acts as an accumulation of glacier due to high altitude. This consequence is evident in the spatial variation of discharge. Thus, the overall discharge increases in the plain area around the Ych-Terek station.
4.3 Time Series Discharge Distribution Trends
Plotted time series distribution highlights the temporal variability in the discharge magnitude over 33 years’ time period. Annual high and low discharge cycles were seen in the hydro-station where clearly, seasonal variations are recorded in the time series graph due to the seasonal cycles of spring, summer, autumn and winter months. In these discharge data series, clearly cyclical variation observed at these three hydro stations. The discharge manganite was seen higher, i.e. 1507 m3/s in June 2010 at Ych-Terek because of its relative location is in the lower channel section of the basin where possible amount of stream flow was higher. At the Naryn station the trends of discharge were started to increase from 1981 to 2001-2002. After that it was decreased up to 2012 except in 2009-2010 (Figure 7). At these stations probable discharge are high in summer and low in winter seasons due to seasonal variation in discharge cycles. At the Ych-Terek the trend was increased from 1980-1981 to 2009-2010 due to ice-melting process and increasing surface runoff in the upper reach of the basin area. Descroix et al., (2012) showed that the increase in the discharge flow of the river is directly proportional to the increased runoff coefficient. The general trends of discharge from a time series graph of Uzunakmat station was seen to decrease in the 33 years. Overall observed difference in discharge data from time series graphs was generally lower in the winter season (December- January- February) and higher in the spring (March-April-May) and summer melt season (Jun-July-August). Thus, it was observed that the regional seasonal cycles strongly influenced the discharge of the Naryn river basin.
4.4 Estimation of Exceedance Probability
At the Naryn station observed the maximum EP (99.7%, 17 m3/s) in 1982 while minimum (0.2%, 451 m3/s) in 2002. At this station, the trend of discharge was slightly increased after 40 m3/s where observed ~60% EP then it was raised. Similarly, at Ych-Terek observed the maximum EP (99.5%, 80 m3/s) in 1988 while minimum (0.3%, 1507 m3/s) in 2010. At this station, the trend of discharge was slightly increased after 200 m3/s where observed ~ 60% EP then it was raised. At the Uzunakmat station observed the maximum EP (99.7%, 6.8 m3/s) in 1998 while minimum (0.3%, 116 m3/s) in 1984. At this station, the trend of discharge was slightly increased after 13 m3/s where observed ~ 65% EP then it was raised (Table 3). It was interestingly noticed that with increasing the discharge values the EP was decreased (Figure 8, 9, 10). These trends are possibly produced due to continental types of climate in the present area. According to Gan et al. (2015) in the Naryn River Basin is observed the dry and hot summer and cold winter as a part of a continental climate. In this area, the average temperature is 10o C in July, - 18o C in January and precipitation ranges between 280 mm and 450 mm annually (Gan et al., 2015). Thus, the distributed discharge data highlighted the possible correlations with % EP of the discharge.
4.5 Trends of Frequency Distribution
At the Naryn station discharge data distributed within the 20 to 360 m3/s where high frequency was observed (23 - 33 m3/s). At the Uzunakmat station discharge data was distributed within the 8 to 115 m3/s where high frequency was observed (8- 11 m3/s). The large variation in frequency was seen at the Ych-Terek station. Here the discharge data are distributed within the 20 to 1487 m3/s where high frequency was observed (171 to 206 m3/s) (Figure 11). These spatio-temporal variations in the discharge frequency were occurred due to regional climate and undulating nature of basinal topography. Hence, in this Naryn river basin the precipitations and melting of snow and ice affected the frequency of discharge which influencing the hydrological systems. The changing melting of snow and ice or rainfall pattern is changing overall hydrological schemes which influencing the associated water resources in the area (Jiménez et al., 2014). There is observed the low precipitation in summer seasons. Moreover, glacier melting process in the higher elevated area are influenced the discharge frequency trends in the area. Because of about 2% of the basin area is glacierized and majority of glaciers are concentrated in the eastern part of the basin (Gan et al., 2015). The average frequency trends of the Naryn and Uzunakmat hydro stations are considered normally distributed in overall 33 years.


 ,
X Chen 1
,
X Chen 1
 ,
Alamanov Salamat 3
,
Alamanov Salamat 3