Most of the worldwide national mapping development originated in the military survey.
Updating maps is crucial as many specialists, planners, and decision-makers rely strongly on topographic maps for planning and development.
The updating of previously compiled topographic maps with modern ones to keep up to date with the developments and changes that have occurred on land.
Most of the maps that are available for Libya their contents dated back to the time of their production and only the printing renewed.
Libya Topo-project launched to Identify and develop proposals to help solve issues related to the production and updating of topographical maps in Libya.
The result of the update of 121 topographical maps was based on open-source GIS data and generated using QGIS software.
Abstract
From the beginning of the twentieth century, topographic maps for the Libyan state carried out by various compilers, where the first mapping was carried out by the Italian Military Geographical Institute, the Soviet Union Military, and the U.S. Army, followed by mapping carried out by the Libyan state from the 1950s to the 2000s. Most of these maps have not been digitized and updated using the techniques of geographic information systems and remote sensing. This paper discusses on the objectives, methodology and results of the Libya Topography Project, “Libya Topo” for updating the previously compiled topographical map at scale, 1:250000. Open spatial data from different platforms (OSM, Logistics Cluster, Landsat 8 satellite imagery, and SRTM data, etc.). Also, POIs extracted from previously compiled topographic and geological maps. Spatial database for each UTM zone created to store the features and raster. As for the cartographic style, the map layout adopted is the style of the U.S. Defense Mapping Agency maps. The results of the project are an update of 121 topographical map sheets using Quantum (GIS), those will be freely available for the interested users on request (e.g., environmentalists, academics, and university students, etc.).
Topographic maps are essential for geomorphological, regional and local studies and defined as a detailed and precise two-dimensional characterization of the land surface’s distinctive natural and human-made features. They used for various applications such as urban planning, resource management, surveying, and outdoor adventures like hunting, fishing, and racing. The most distinguishing components of the topographic maps are the elevation contours, which are imaginary lines connecting similar elevation, and allow the representation of heights for ridges, hills, and the mountains in addition to the steepness of the slope in three dimensional. Also, the topographic maps contain many symbologies to categorize both human-made and natural features such as roads, buildings, quarries, lakes, streams (Pidwirny, 2009; Kennedy et al., 1987; USGS, 2020; Brock et al., 2002). Topographic maps are the essential types of maps and have passed through many stages of their development and the means of production. Their importance is due to their deepening in different fields, since they represent all the phenomena on the earth’s surface, whether these are human-made or natural. One of the first topographic mappings of large scale began when John Wesley Powell persuaded the U.S. on 4-5 December 1884. Then Congress permitted the U.S. Geological Survey (USGS) to enter systematic mapping of U.S. topography. Twenty-five hundred years later, the mapping techniques have currently moved forward from field surveys to methods based on the computer through photogrammetry. Also, topographical map scales and content have changed, and through that time USGS, compiled maps in scales of (1:250,000 and 1:125,000). The scales extended with time, and through 1894 maximum maps had been created at a scale of 1:62,500. Where the characteristics are shown on the maps included; state, county, town, or village civil divisions, in addition to public utilities, such as tunnels, railroads, wagon roads, trails, bridges, ferries, fords, dams, and canals (Usery et al., 2009; Usery et al., 2018; Kind, 2014).
Furthermore, the Soviet Union conducted during the cold war, the most extensive cartographic project in the world during the twentieth century that already covered foreign territories in 1938. Where, the global sheet of International Map of the World System nomenclature adopted for the produced map sheets. The mapping initiative was staggering in scope (Watt, 2005; Kent et al., 2019; Barney, 2014), where the entire world mapped at scales: 1:1 million, 1:500,000 and 1:200,000:
Most of Asia, Europe, northern Africa, and North America mapped at scale 1:100,000.
USSR and most of Europe, and the Far and Near East at scale 1:50,000;
USSR and Eastern Europe at scale 1:25,000.
A quarter of the USSR at scale 1: 10,000.
The Soviet Union embarked secretly on the most extensive and systematic global mapping project ever undertaken in the Cold War period. Several scales of detailed topographical maps and plans of foreign territories (i.e. 1:5,000, 1:10,000, 1:15,000, 1:25,000, 1:50,000, 1:100,000, 1:200,000, 1:500,000 and 1:1,000,000) were produced by thousands of cartographers working within the Union of Soviet Socialist Republics (USSR) in accordance with standard specifications (Davis and Kent, 2017; Kent et al., 2019). The Soviet Union maps became available to a broader audience as the Soviet Union broke up. It started to appear in international map dealer catalogs. Telecommunications and oil agencies have been eager clients shopping for up Soviet maps of Central Asia, Africa, and other parts of the developing world for which there were often used by aid groups and scientists (Mustard, 2020; Kostelnick, 2018)
Moreover, topographical mapping represents a complex process that requires human resources and time. Specialized manner improvement is likewise the conventional approach for updating a country wide topographical map. Many governmental mapping agencies and survey agencies have taken several years to update topographical maps (Wagle and Acharya, 2020). Topographic mapping has developed from field data collection based on ground control surveying and field-sketching the terrain and planimetric features by photogrammetry to digital collection geographic information systems and remote sensing, which have brought considerable progress to map design and production (Usery et al., 2018). The development has reflected in the external and internal layout of the topographic map. Presently many countries developed and updated their historical topographical maps using modern data processing technologies inherent in GIS geographic information systems and based on remote sensing data. Moreover, platforms and map servers also offered many free spatial data, not limited to significant landmarks such as highways, urban areas, interest points, and local geographical names, where this has facilitated the process of updating topographical maps.
The U.S. Topo series is an example of topographic mapping updates, where the USGS topographic maps updated to make a new generation of American landscape maps, where the topographic maps of the U.S. Topo created by the U.S. National Geospatial Program of the U.S. Geological Survey (USGS). The project began late 2009, and the word “U.S. Topo” explicitly refers to quadrangle maps launched in 2009 and beyond. Those maps primarily based totally at the acquainted 1947-1992 quadrangle maps of 7.5 minutes. Still, they are mass-produced on a repeated cycle. U.S. from country wide GIS databases, Topo-maps geographic information system: repackaging data in standard map form, aiding non-specialist map users as well as standard map applications (USGS, 2020).
In the early twentieth century, topographic maps accomplished for the Libyan state by the various compiler and some of the produces maps is illustrated, as shown in Table 1. During the Italian occupation period, the Italian Military Geographical Institute carried out the first completed extensive mapping covering all the Libyan territories that followed in the 1940s by the Soviet Union mapping, and the U.S. military mapping in the 1960s. Following the establishment of the Libyan state in the 1950s, the government embarked on several topographical mapping projects by the Libyan Surveying Authority.
Furthermore, the topographical mappings conducted by some Libyan institutions such as:
General water authority
Secretariat of agriculture and land reclamation
Libyan national army
Urban planning authority
These mapping were focused on specific regions or application; geological research, hydrogeology, water resources, and agricultural research. Also, most of these maps have not digitized and updated according to modern techniques of GIS and RS since they do not include, for example, the change in human-made features, urban areas, roads, and electricity networks, etc. Nevertheless, some maps were produced during the 2000s by some foreign geoinformation agencies, which are not published publicly and are restricted to use by some institutions.
Since there are no new editions for the Libyan topographic maps and have not subjected to accurate, comprehensive updates, it is also not in proper format for geospatial software, so this limits the benefit to users of these maps.
The Libya Topography Project “Libya Topo” was launched in 2015, in cooperation with the Spatial Vision Company, as an initiative of the New Libya association. Where the project has as its objectives:
Identify and develop proposals to help solve issues related to the production and updating of topographical maps in Libya.
Updating previously compiled topographic maps with modern ones to keep up to date with the developments and changes that have occurred.
Since many specialists, planners, and decision-makers in the state sector need to update topographic maps to plan the development of natural and environmental resources. Also, the topographic maps are the basis for many studies. In addition to this, topographical maps are a vital source of base maps. Therefore, the objectives achieved by updating the topographic map scale 1:250000 using GIS techniques that support facilitating and manipulating map content and modification at all times and issuing maps at different scales using Free Open Source Software (FOSS) and open geospatial data. The generated maps and the spatial databases from the project will be available on request in an open-source format for interested users (e.g., environmentalists, academics and university students, etc.).
2 . MATERIALS
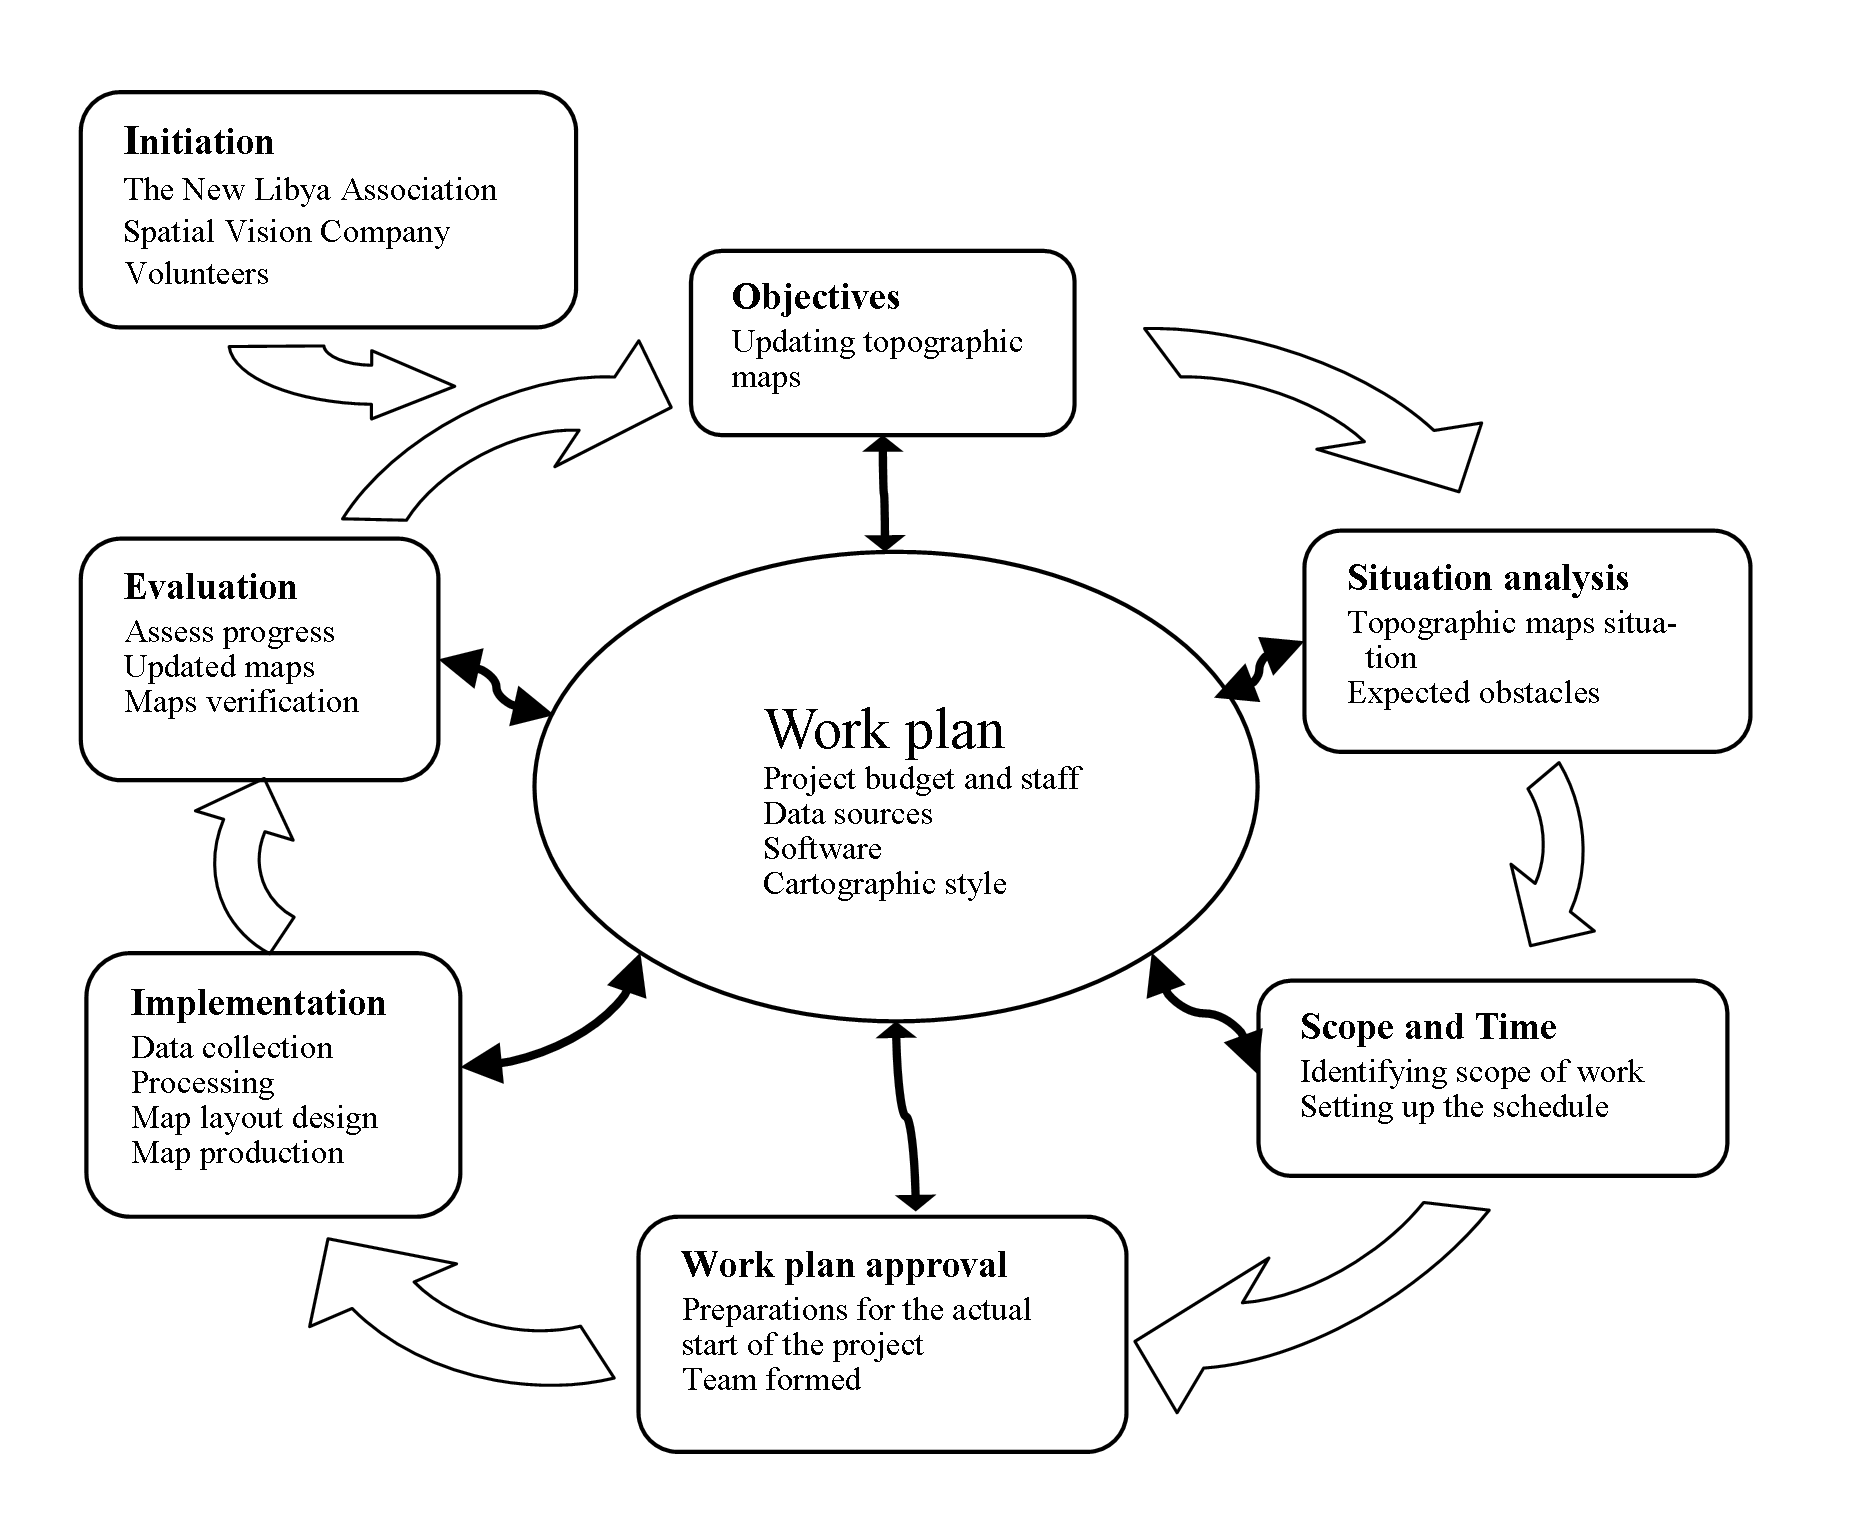
The project cycle for updating the topographical maps as illustrated in Figure 1 and the project workflow implementation steps summarized in (Figure 2) based on the data shown in the Table 2.
File type: Geopdf, Data type: Topographic maps scale1:250,000 (UTA, 2020)
Libyan General Establishment for Water Resources (GEWR)
File type: MS-Excel, Data type: Water wells
General Electricity Company of Libya (GECOL)
File type: MS-Excel, Data type: Electric towers, Oil sites
Libyan Urban Planning Authority (UPA)
File type: MS-Excel, Data type: Urban
International Air Transport Association (IATA)
Online airports database
World Ports database (E-PORTS)
Online ports database
The acquisition of free spatial data of varying resolution and funded by multiple sectors for scientific, environmental, engineering, and planning purposes has seen tremendous growth over the past decade, due to the abundance of these data sets as well as their free availability. Also, this data is often of great value beyond the application that drove its acquisition and therefore, of interest to a large and diverse user community.
Also, the Volunteered Geographical Information (VGI) which known by multiple names such as user-generated geographic content and crowd sourced geospatial data.
This data is Community-Driven identified a decade ago as a new source of spatial data that would blur the traditional boundary between data producers and users (Basiri et al., 2019; Goodchild, 2007; Fast and Rinner, 2014) . The Libya Topo project relied heavily on open source spatial data and other spatial data, as given in Table 2 and described as:
OpenStreetMap (OSM)
The extensive availability of location data has made mass market place mapping feasible primarily based totally on low-priced GPS receivers, domestic computer systems, and the internet supports the community-driven mapping. OSM is one of the famous crowd sourced data created by a mapping community that contributes and maintains data from all over the world for the roads, trails, shops, railway stations, and other features. OSM emphasizes the local spatial knowledge, in which the participants use aerial imagery, GPS logs, and low-tech discipline maps to affirm the OSM is precise and up-to-date (OpenStreetMap Contributors, 2020; Mordechai and Patrick, 2008) .
GeoNames
The GeoNames is a geographical database under a Creative Commons Attribution License that integrates geographic data such as names of places in various languages, in addition to the geographic coordinates, elevation, and population. The database depends on 385 sources of several deferent organizations around the world. Also, the database available for download free of charge through several web services, allow the users to manually edit correct and add new names through the user interface (GeoNames, 2020).
The Logistics Cluster GIS
The GIS Logistics Cluster affords the humanitarian network with logistical choice assist gear at some point in emergency operations by working in a timely manner on accurate geographic information by aggregating and disseminating logistical data. It also develops operational systems and tools to support humanitarian organizations in improving their performance and preparedness for emergency response. All the maps, GIS data are posted on the Crisis Map catalog pages on the Logistics Cluster website, the World Food Program Map Center, and Relief web.
NASA Landsat-8 and Digital Elevation Model (DEM)
The project also relied on satellite images from NASA Landsat-8 to generate land use and land cover layers, as well as on Digital Elevation Model (DEM) to generate the contour lines, coastline, and higher and lower elevation points. Where this data available for download via the USGS Earth Explorer (EE) website which is a tool that enables users to query, search, and order satellite images, aerial photographs, and multi-source cartographic products.
ESRI ArcGIS Online Base maps
ArcGIS Base maps are group features consisting of a variety of base maps accessed from ArcGIS Online as tile layers and added to the QGIS desktop to provide background geography for preferred content. The project utilized World Imagery that provides 1 meter or better satellite and imagery in many parts of the globe and globally lower resolution satellite imagery (ESRI, 2009).
General Bathymetric Chart of the Oceans (GEBCO)
GEBCO gridded bathymetric data are ocean and land, worldwide terrain models available for downloading or accessing as grids via Web Map Services.
Geological maps of Libya
In the 1970s and 1980s, the Industrial Research Center in Libya made a geological mapping of all Libyan lands, from which maps containing surface geology were produced and supported by human-made features such as roads, roads, towns, and villages, as well as designations of geographical locations
In 1972, the United States DMA emerged in the Department of Defense to increase efficiencies and economies by bringing the services mapping, charting, and geodesy (MC and G) activities into one organization. (NGA, 2020). Topographic map sheets produced by DMA in 1980s and 1990s for Libyan territory are available to download free of charge at the University of Texas libraries.
Land cover mapping of Libya (FAO)
The land cover mapping of Libya carried out as one of the activities the Food and Agriculture Organization (FAO), according to the project “Mapping of Natural Resources for Agricultural Use and Planning in Libya” (LIB/00/004) (FAO, 2002).
3 . METHODOLOGY
The extensive use of FOSS is evident in the GIS field, where FOSS-GIS projects encapsulate a wide range of software types, ranging from specialist tools used to complete spatial analytical functions to multiuse and purpose desktop or web GIS that incorporates a variety of functionalities (Chand, 2014; Singleton et al., 2016). Quantum GIS (QGIS), the development of System for Automated Geo-Scientific Analyses (SAGA GIS), Map Window GIS, and Geographic Resources Analysis Support System (GRASS GIS) are the most famous and significant in the FOSS. In particular, QGIS is a substantial contributor to the use of Earth Observation (EO) data, mapping, and spatial analysis (Correia et al., 2018). QGIS is a user-friendly FOSS for the official Geospatial Foundation (OSGeo) project. It runs on different operating systems (Linux, Unix, Mac OSX, Windows, and Android) and supports various formats and functionalities in vectors, rasters, and databases (QGIS-DT, 2020).
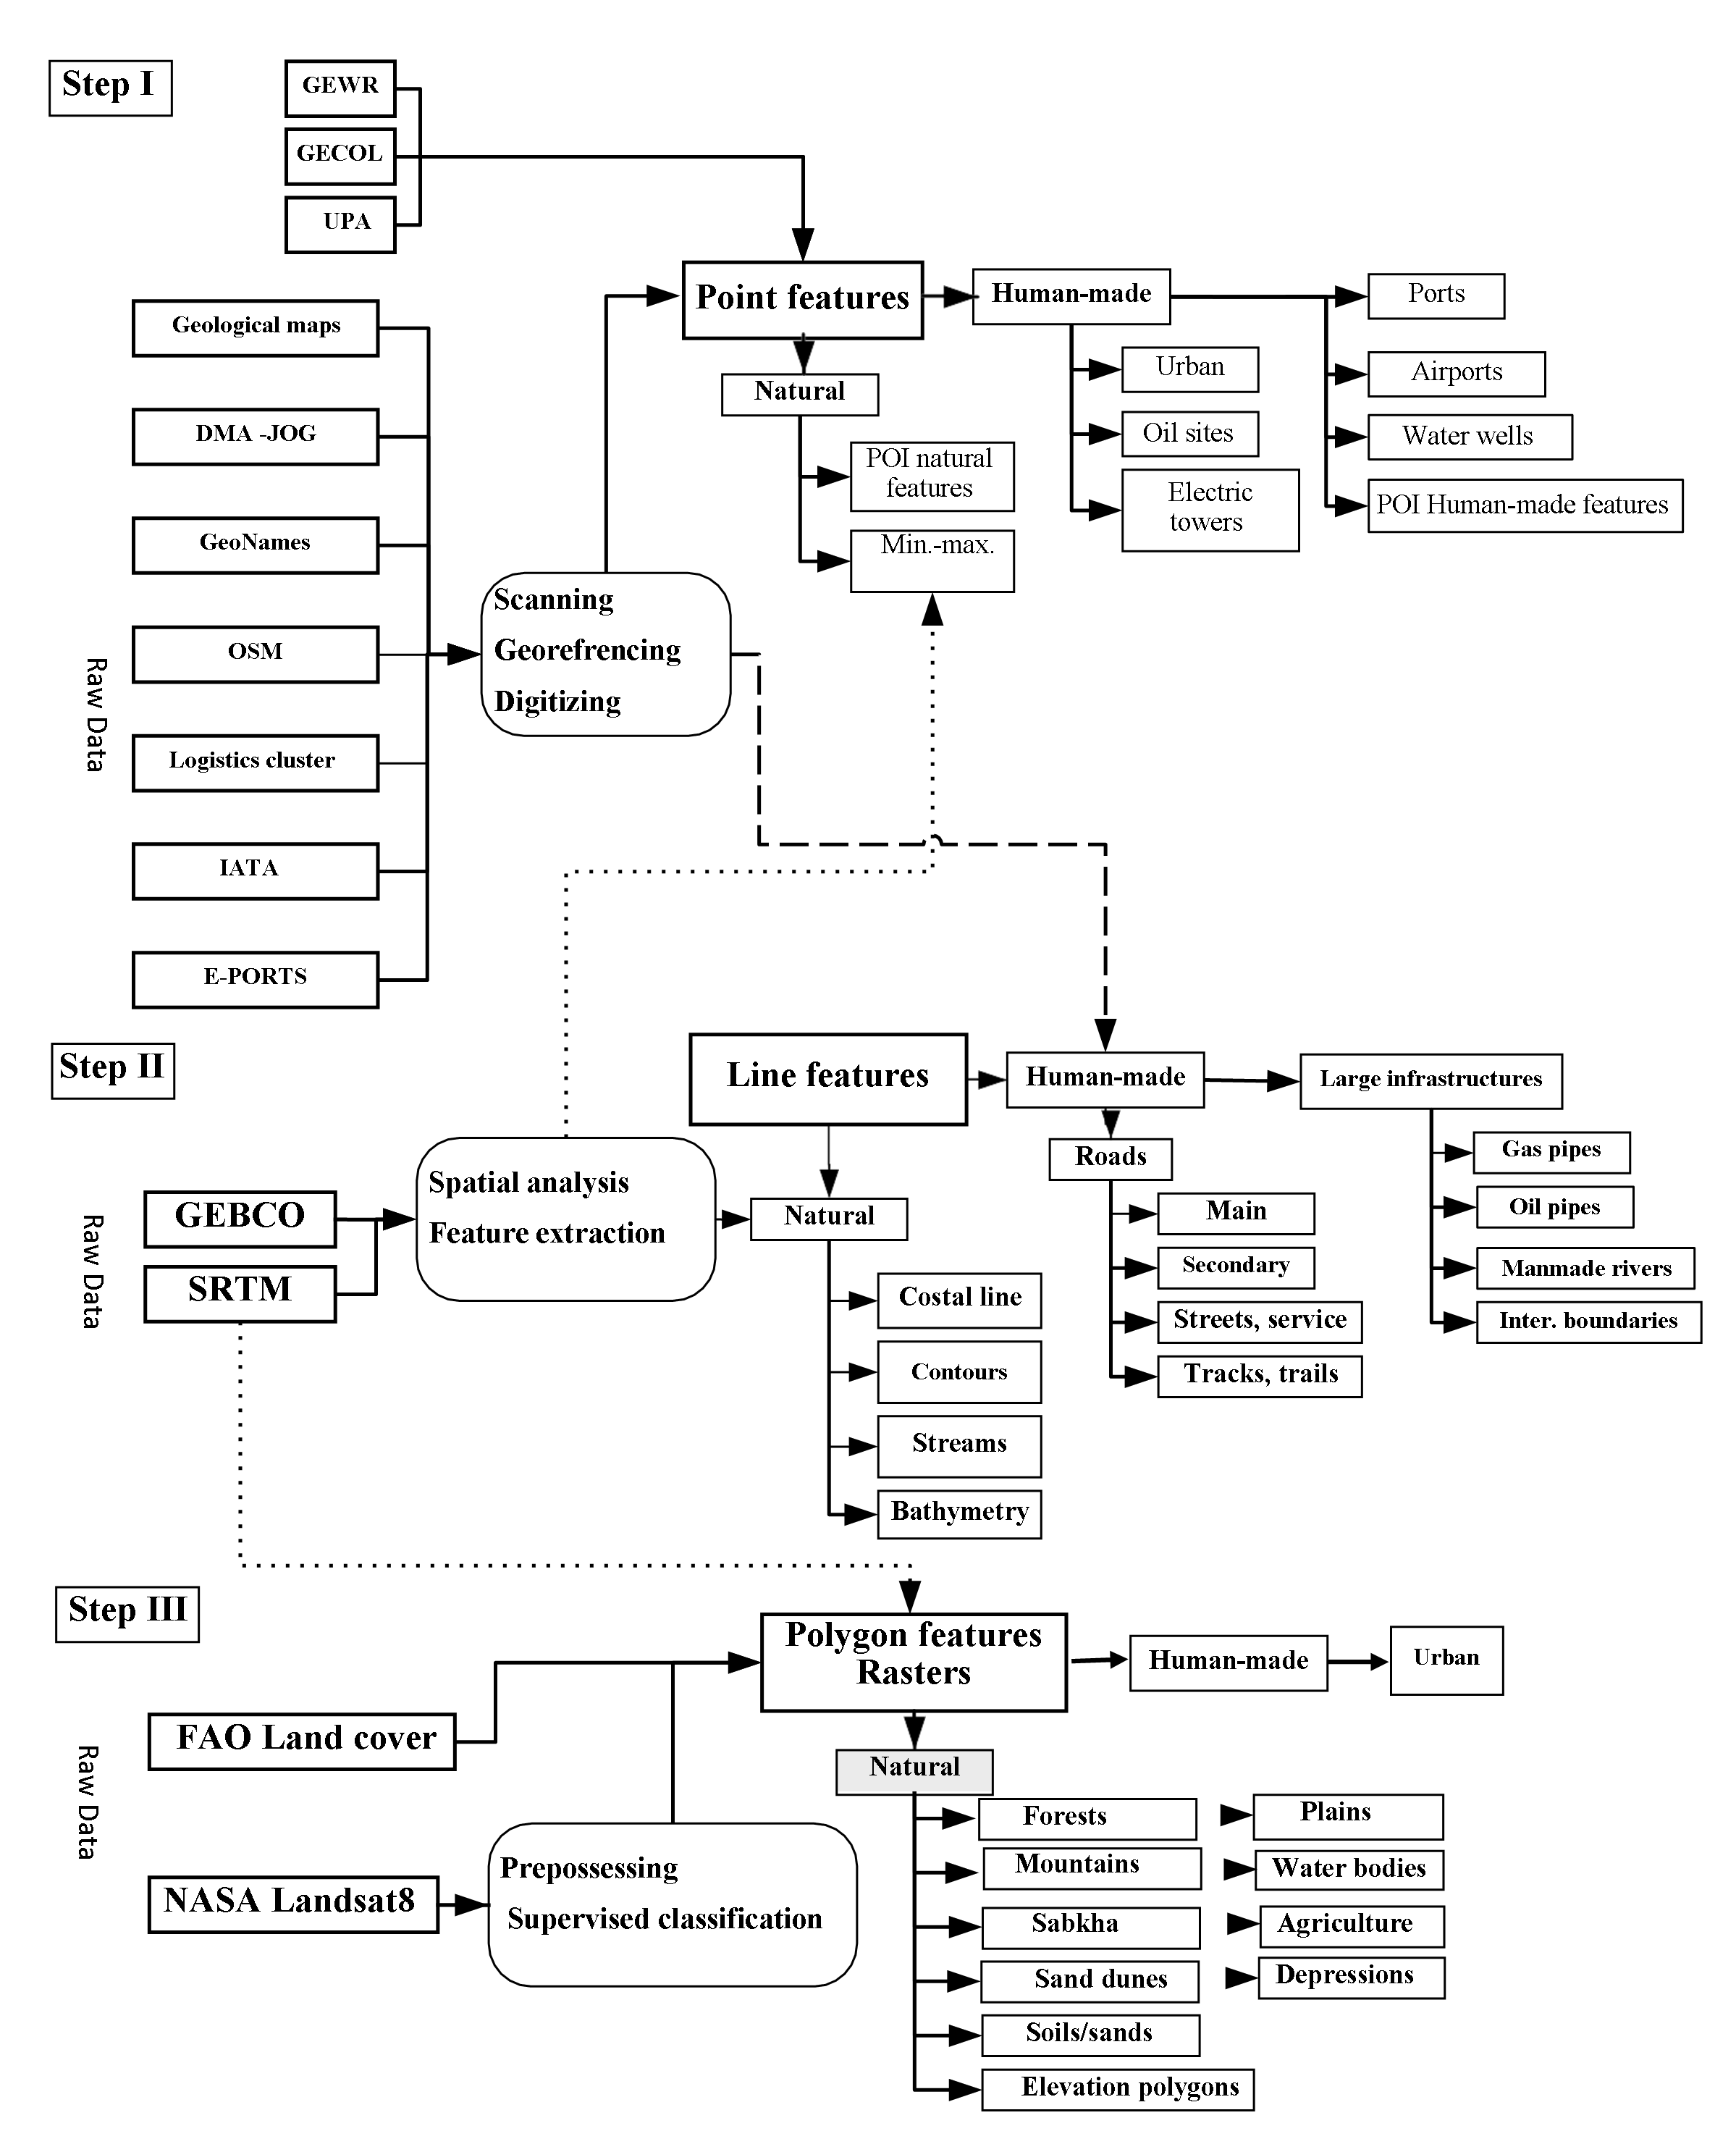
The project depends entirely on the QGIS software in all operations as shown in workflow of the project implementation steps (Figure 2) and following discusses on the methodological approach for updating the topographic maps.
Figure 2. Project workflow
Point features
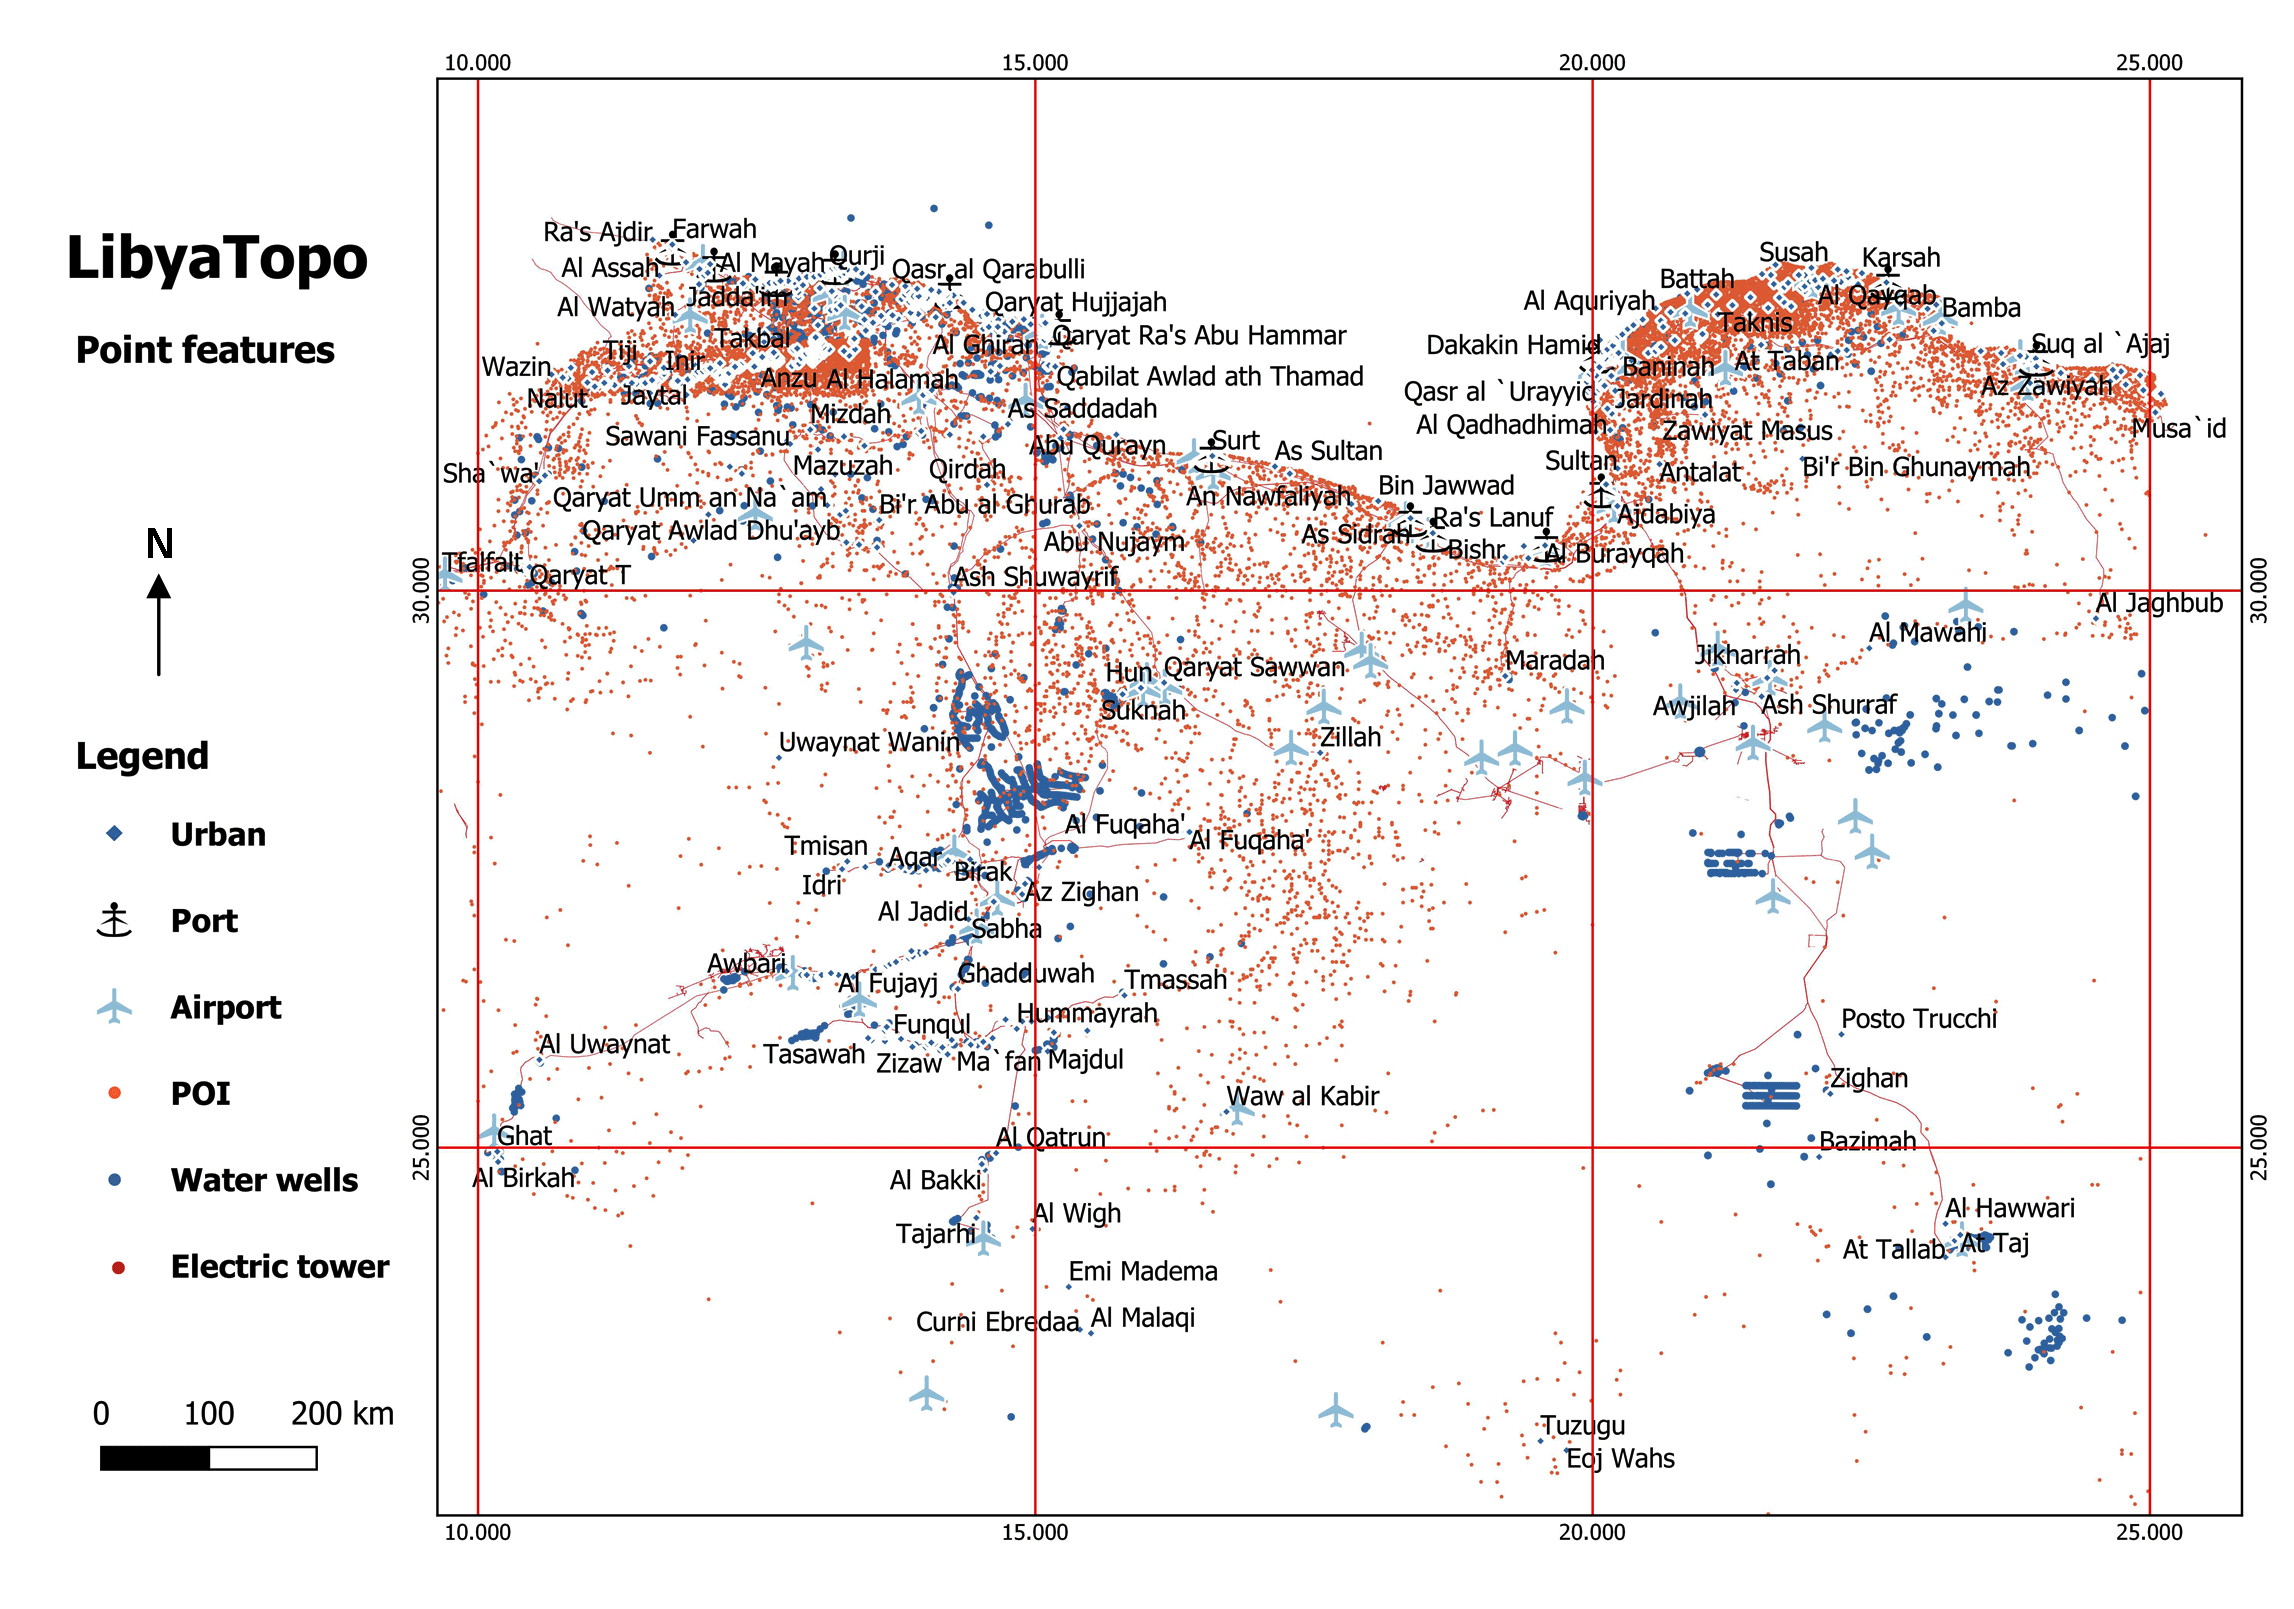
The point features processed as in step-I of the workflow in (Figure 3) Geological maps scanned and georeferenced using QGIS software, and the Point of Interest (POIs) extracted. Also, the geological maps used for verification, in particular, the geographical location labels for point data obtained from the platforms (OSM, GeoNames, Logistics Cluster) and the topographic maps of DMA- JOG. Other point data such as electricity towers, airports, oil sites, etc. are also included, as shown in (Figures 3). The SRTM data also analyzed for each map grid to extract points of higher and lower elevations.
Figure 3. Libya: Point features
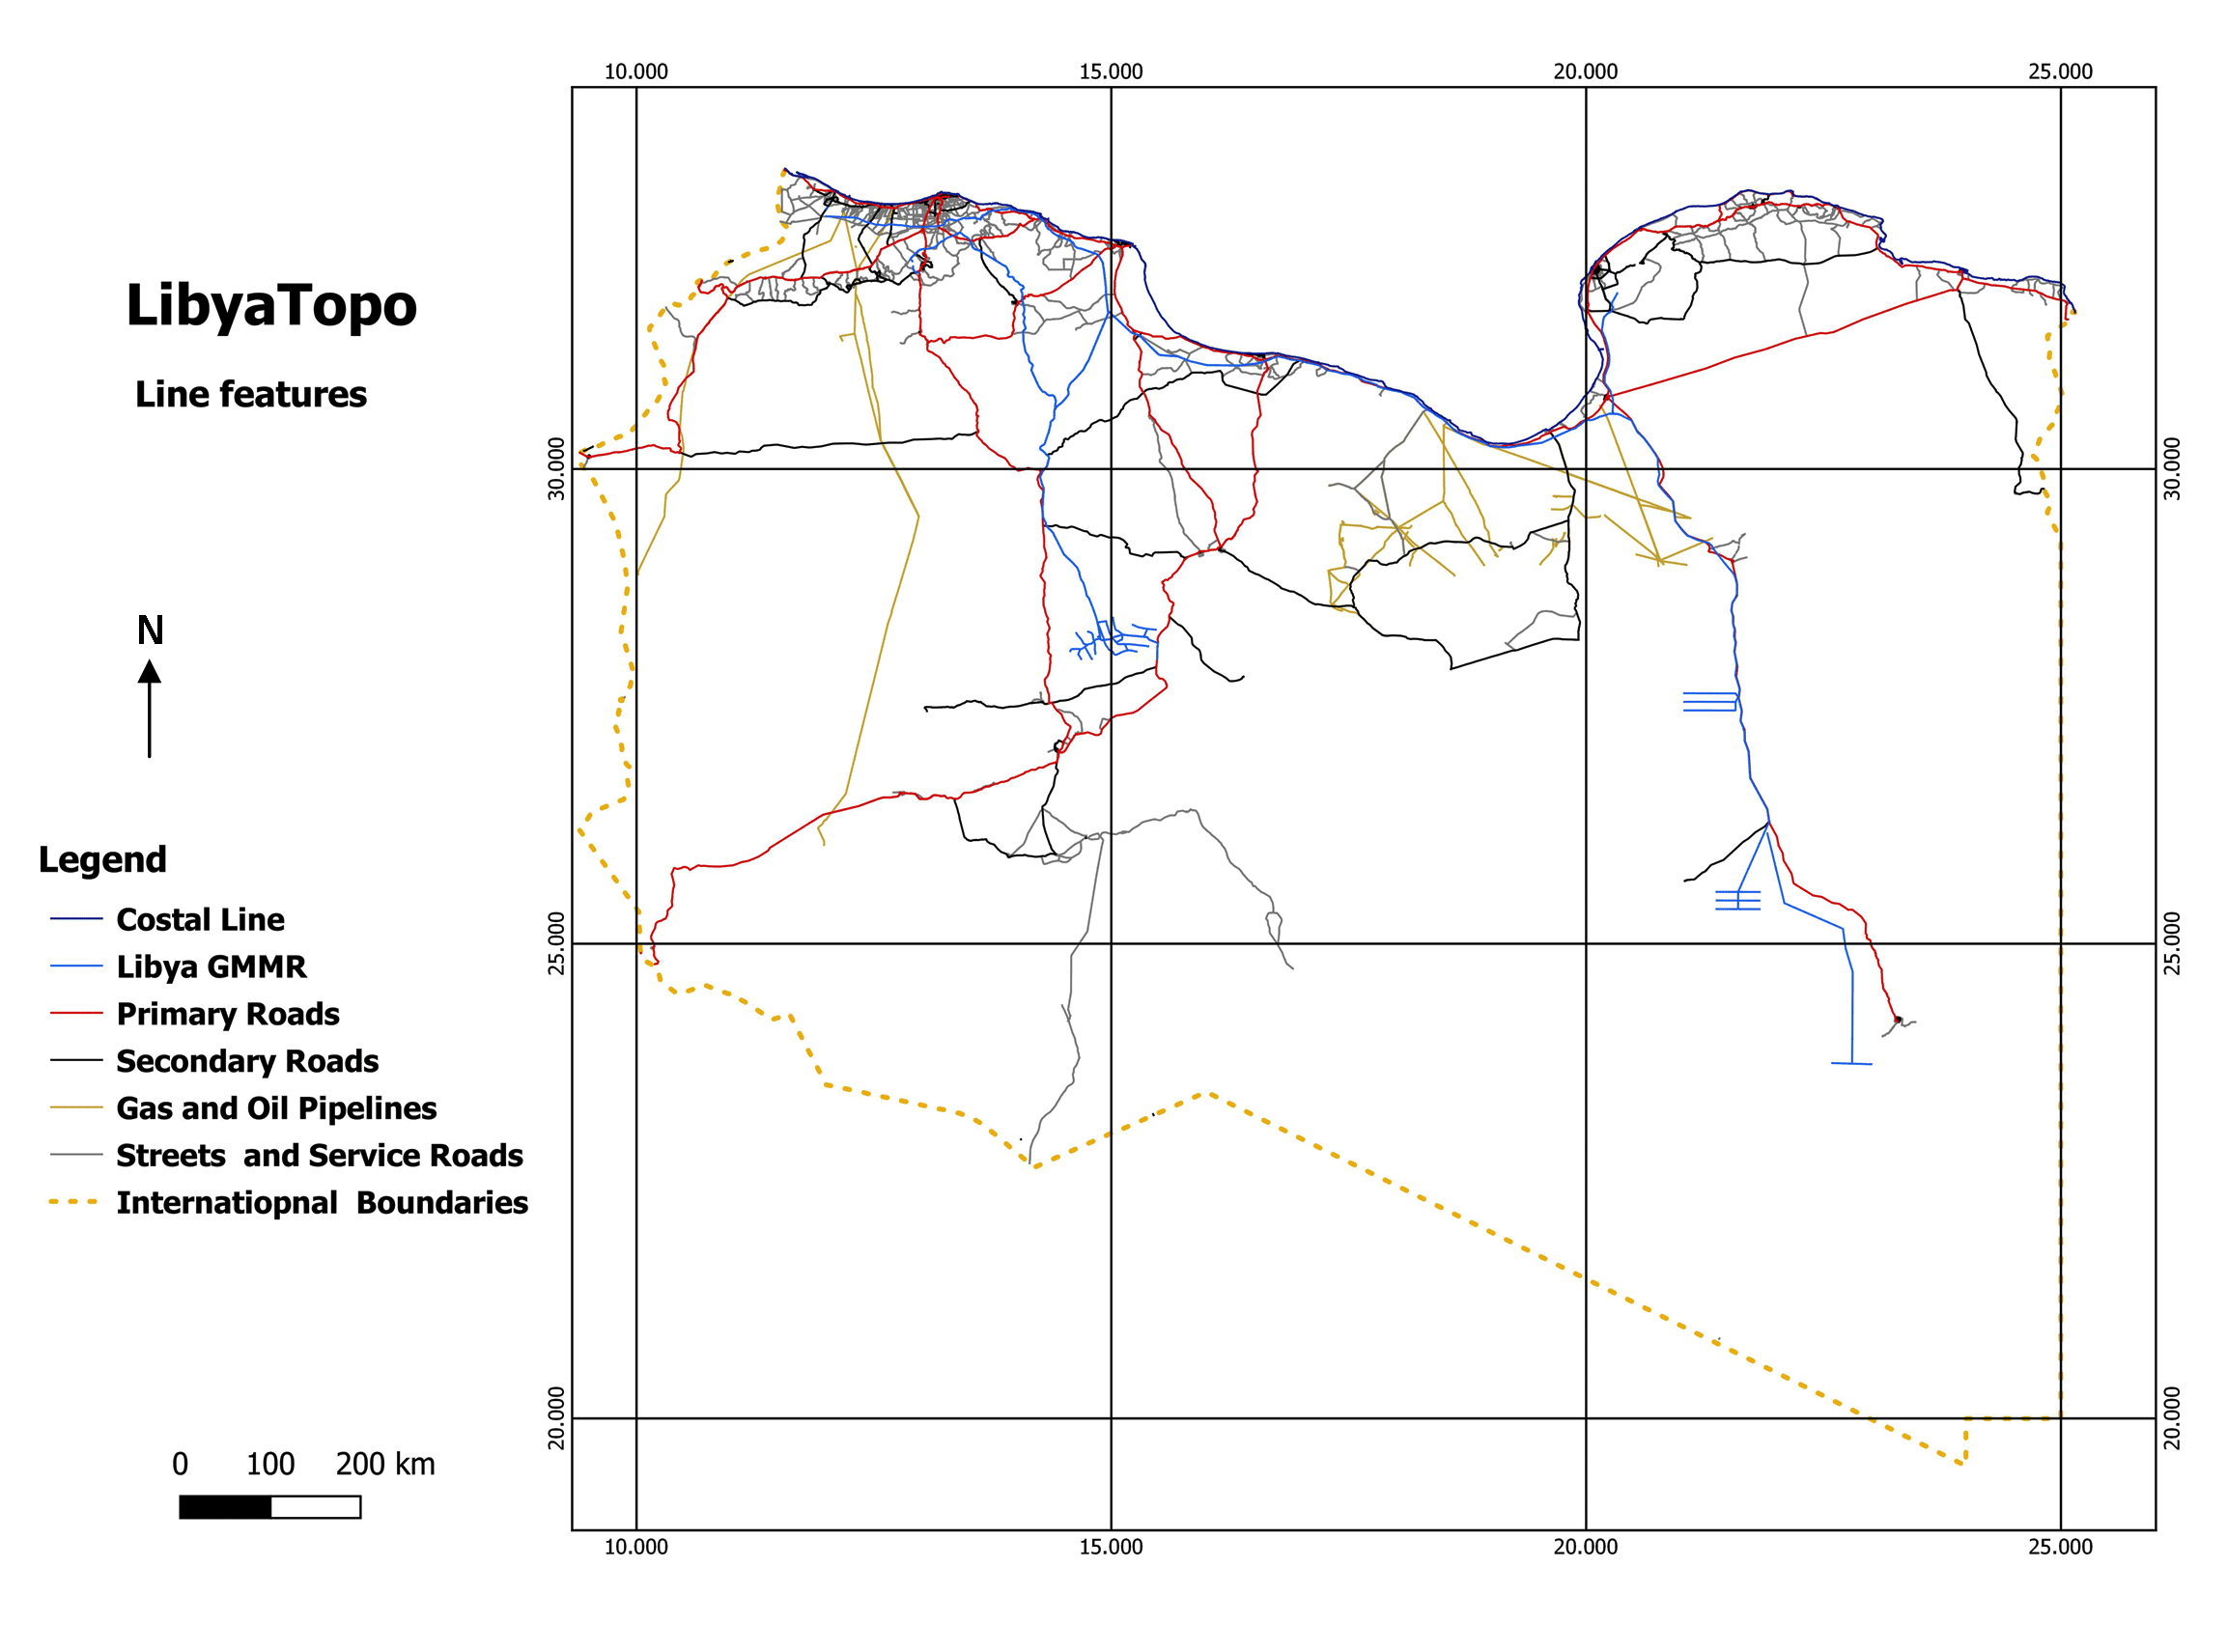
Line features
Data for human-made line features, such as roads, oil, and gas pipelines and the Libyan man-made river, were used extensively from (OSM, Logistics Cluster, and verified via NASA Landsat-8 satellite imagery, and ESRI online base map world imagery. Also, the old topographic maps were an excellent guide for checking line features labels. Mainly, the natural line features extracted by the processing of the DEM processed according to step-II of the workflow in (Figure 4). The hydrology toolset provided in QGIS software automatically delineate a river basin Stream networks using GRASS tools in the processing toolbox. Additionally, the QGIS raster extraction was used for DEM processing to generate elevation contours and coastline features, and also for GEBCO raster to create bathymetry contours.
Figure 4. Libya: Line features
Polygon features and rasters
The project polygon data are the main land cover features and generated using satellite Landsat-8 OLI [Operational Land Imager] imagery. The classification conducted using Semi-Automatic Classification (SCP) tool, which is an open-source plugin for Quantum GIS (QGIS) software. The SCP performs semi-automatic supervised and unsupervised classification of the satellite images; also, it provides several tools for the pre-processing and post-processing of the classifications (Congedo, 2016).
The land cover features produced according to steps-III (Figure 2). Moreover, after the image classification, the resultant land cover thematic data integrated with the land cover mapping of Libya (FAO, 2002), and labeling performed using old topographical maps, geological maps, and projects.
Since Libya is part of Africa and the Northern hemisphere, therefore, it lies in four Universal Transverse Mercator zones. Thus, the SpatiaLite database in QGIS for each UTM zone was created to store the extracted features and raster.
4 . RESULTS AND DISCUSSIONS
The project began in March 2015 on the basis of the project cycle summarized in (Figure 1) and was carried out in accordance with the workflow steps as shown in (Figure 2) and is still in progress. The project team was volunteer, where the group consisted of five GIS and RS-specialized technicians, administrators, and volunteers who contributed to verification for the names of geographical places. The funding was by the New Libya Association for Environment and Natural Resources.
The counts of created point features for each UTM zone are given in Table 3, where total of the created point feature is 87698.
Table 3. Point features
Features
UTM Zone
32
33
34
35
POI natural and human-made
768
2391
1750
371
Urban
33
323
146
11
Electric tower
10100
37409
29564
1492
Air port
4
28
30
0
Ports
2
9
8
0
Water wells
126
1436
1267
20
Oil sites
11
47
110
0
Min. and max. elevation
38
80
98
26
The POIs extracted from sources, as shown in Figure 3 and classified into natural and human-made, also according to DMA- JOG map glossary. Where it has been noted that most of the human-made point features in remote areas do not exist on nature, perhaps because of the time maps were prepared, and the temporal changes that occurred, and some POI geographical location is inaccurate. Therefore, verification conducted by comparing different data sources and by the project volunteer.
Urban point features created according to the Libyan UPA, and due to lack of recent accurate census data and the Libyan urban areas classification (town, village, town), the urban features left unclassified, and add to the layout of the maps without designation. Airports and ports point features extracted mainly from OSM and logistic cluster and verified by the International Air Transport Association (IATA) and World Ports database (E-PORTS). Moreover, water wells, oil sites, and electric towers extracted from GEWR and GECOL database in addition to OSM.
The line features were extracted according to the data and the method mentioned previously. As with the point features, the line features were also different from the DMA-JOG maps, where many road networks were established and not included, as well as there are roads that dispensed. The line features from Logistics Cluster and OSM were extensively used in the project and verified through NASA Landsat 8 satellite imagery and ESRI online base map world imagery. Additionally, Table 4 shows the measurable lengths of the line created, in addition to lines features such as the elevation contour and bathymetry.
Table 4. Measurable line feature length (km)
Features
UTM Zone
32
33
34
35
Costal line
122
802
1063
195
Inter. boundaries
1439
692
1107
1432
Main roads
4411
3025
4852
353
Secondary roads
3022
9911
1214
340
Streets, service
2179
31265
15950
1974
Tracks, trails
11832
48904
15030
4789
Gas and oil pipes
428
4566
1972
-
Libyan GMMR
187
3000
1726
-
Most of the topographical maps do not include much detailed information regarding the land cover, where it expressed in terms of labels or simple polygons. During the project, the land cover included since one of the objectives of the project is to provide a service for environmental activities. Therefore, some details will be useful. The following polygons of main land cover features created:
Sabkha
Depressions
Mountains ranges
Dunes
Plains
Agriculture
Large urban areas
Forests
The adopted cartographic is according DMA- JOG style with minor color and symbol changes as required. In addition to other information such as maps grid, number, and titles, as shown in Table 5, where 121 map sheets were produced to cover the entire Libyan territory using QGIS layout.
Table 5. Updated map sheets
Coding (1:250,000)
UTM Zone
32
33
34
35
NI
2
2
3
1
NH
8
16
15
4
NG
8
16
16
4
NF
1
6
15
4
Total
19
40
49
13
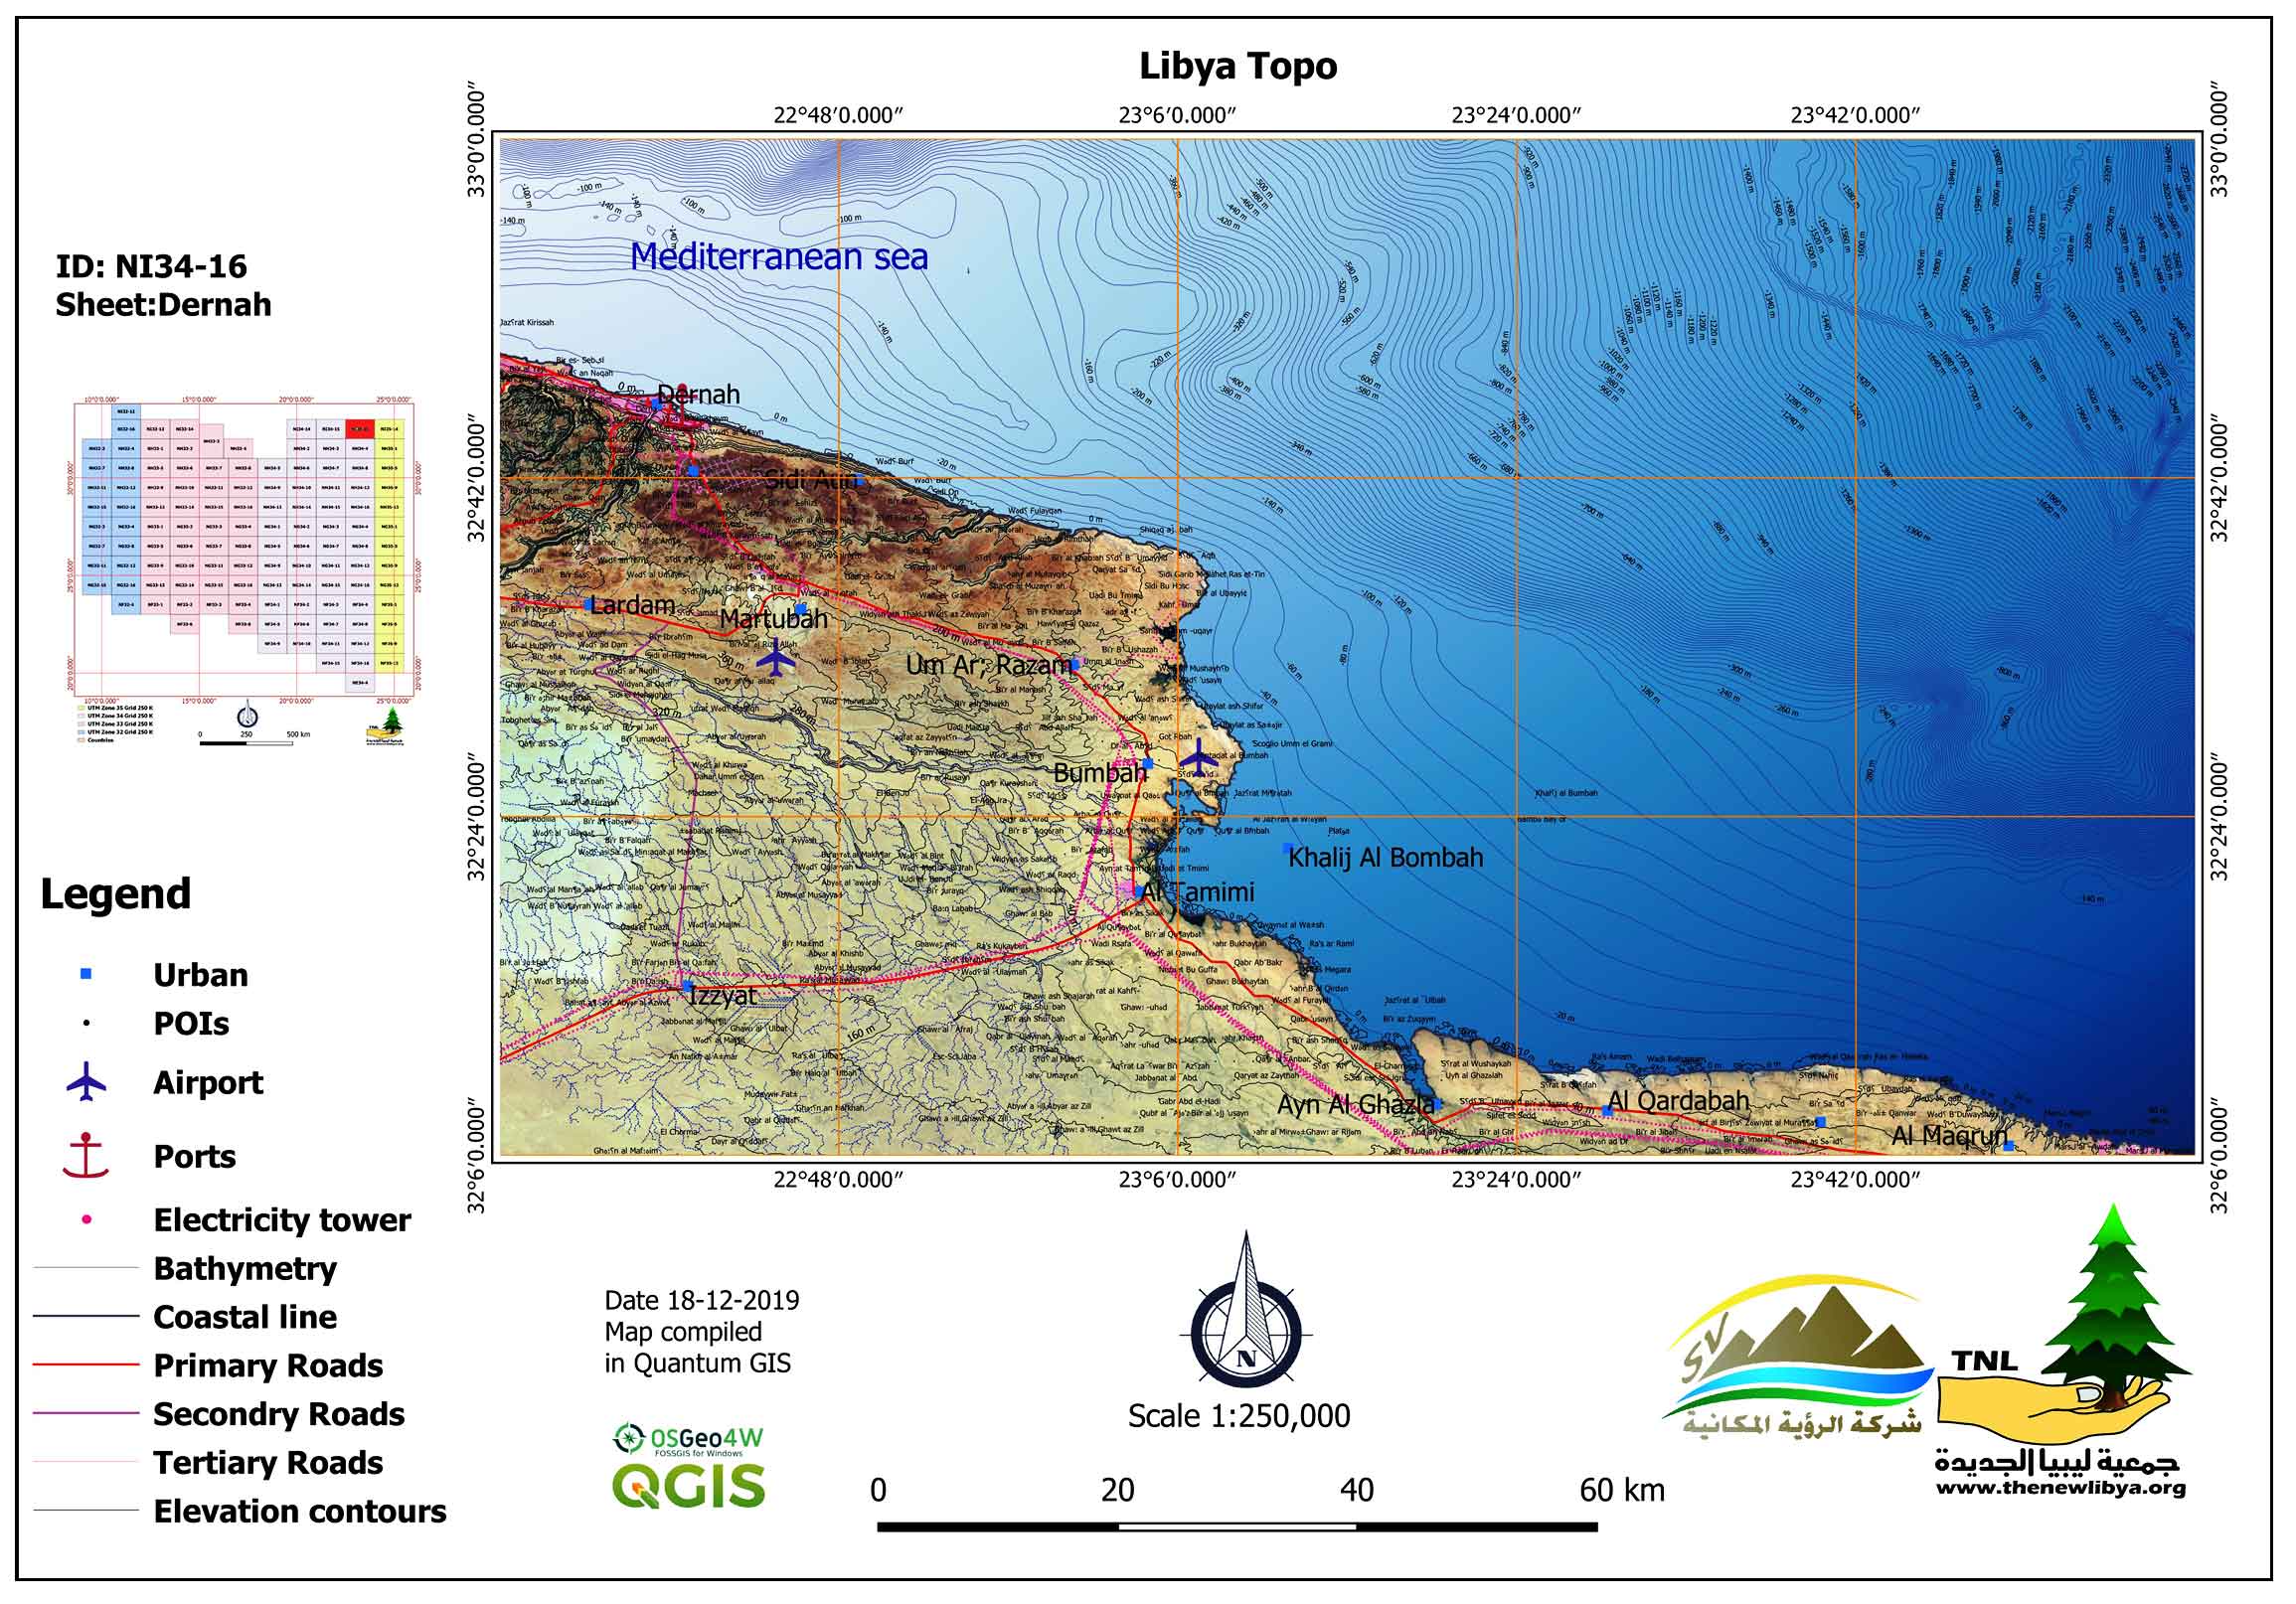
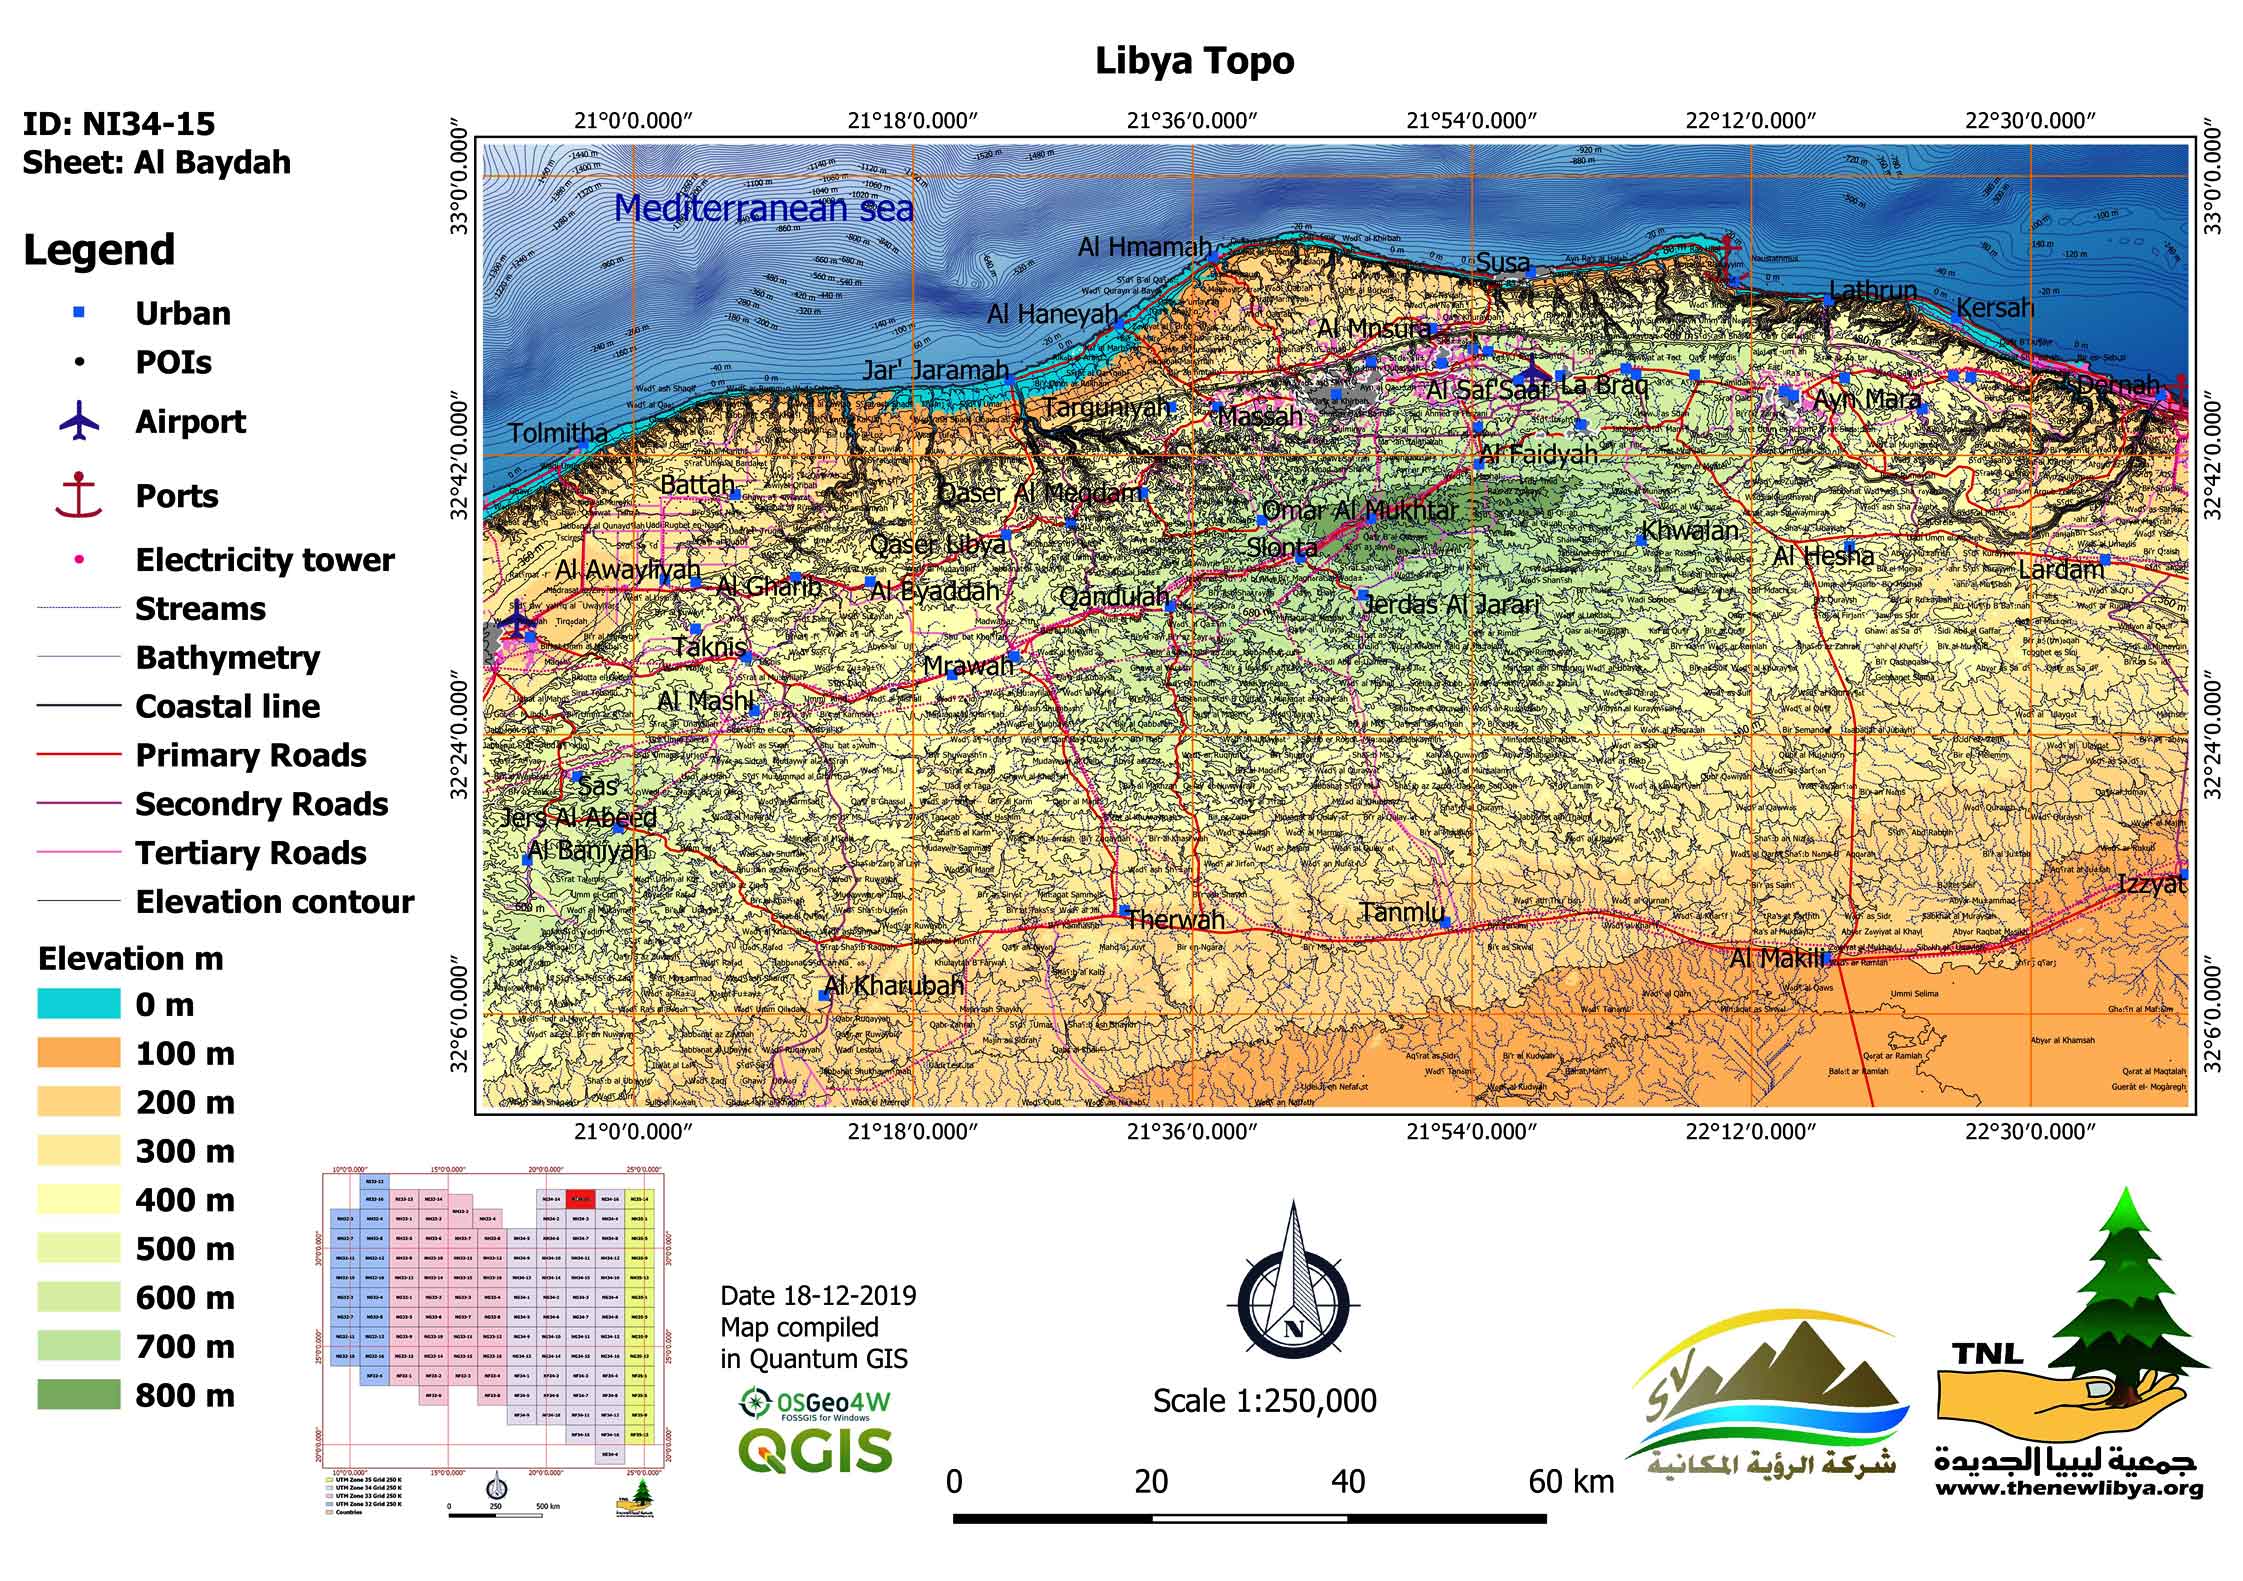
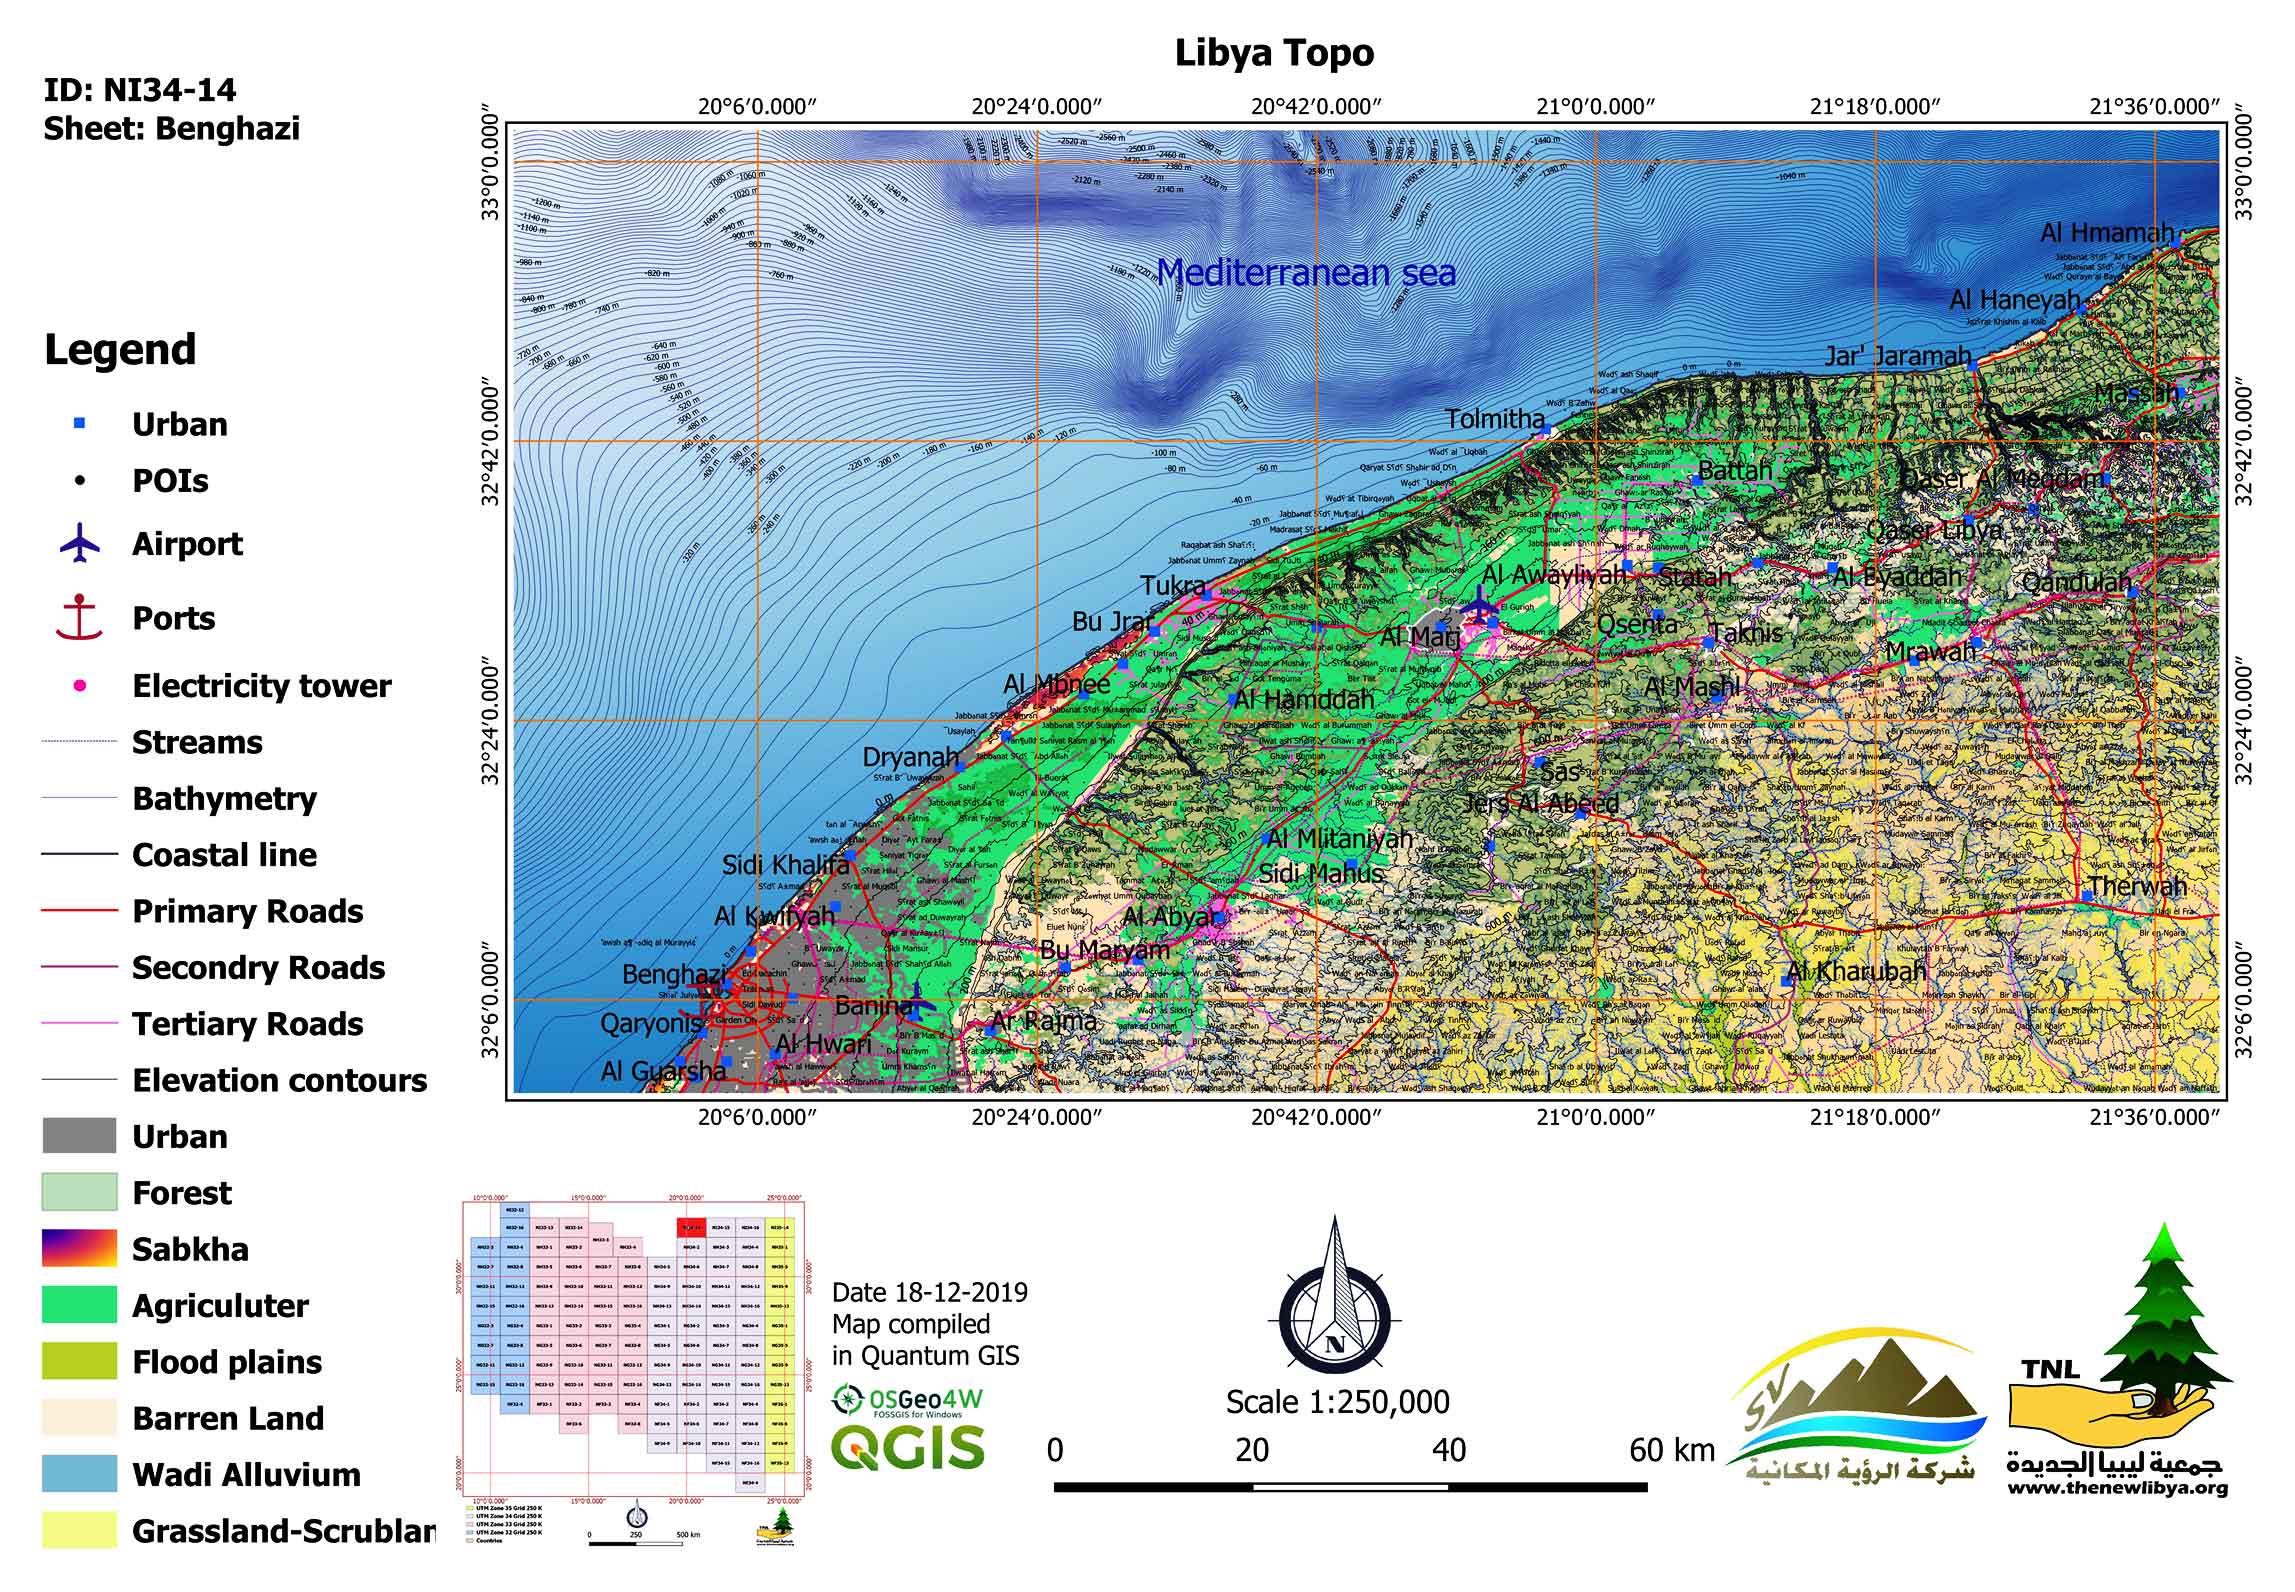
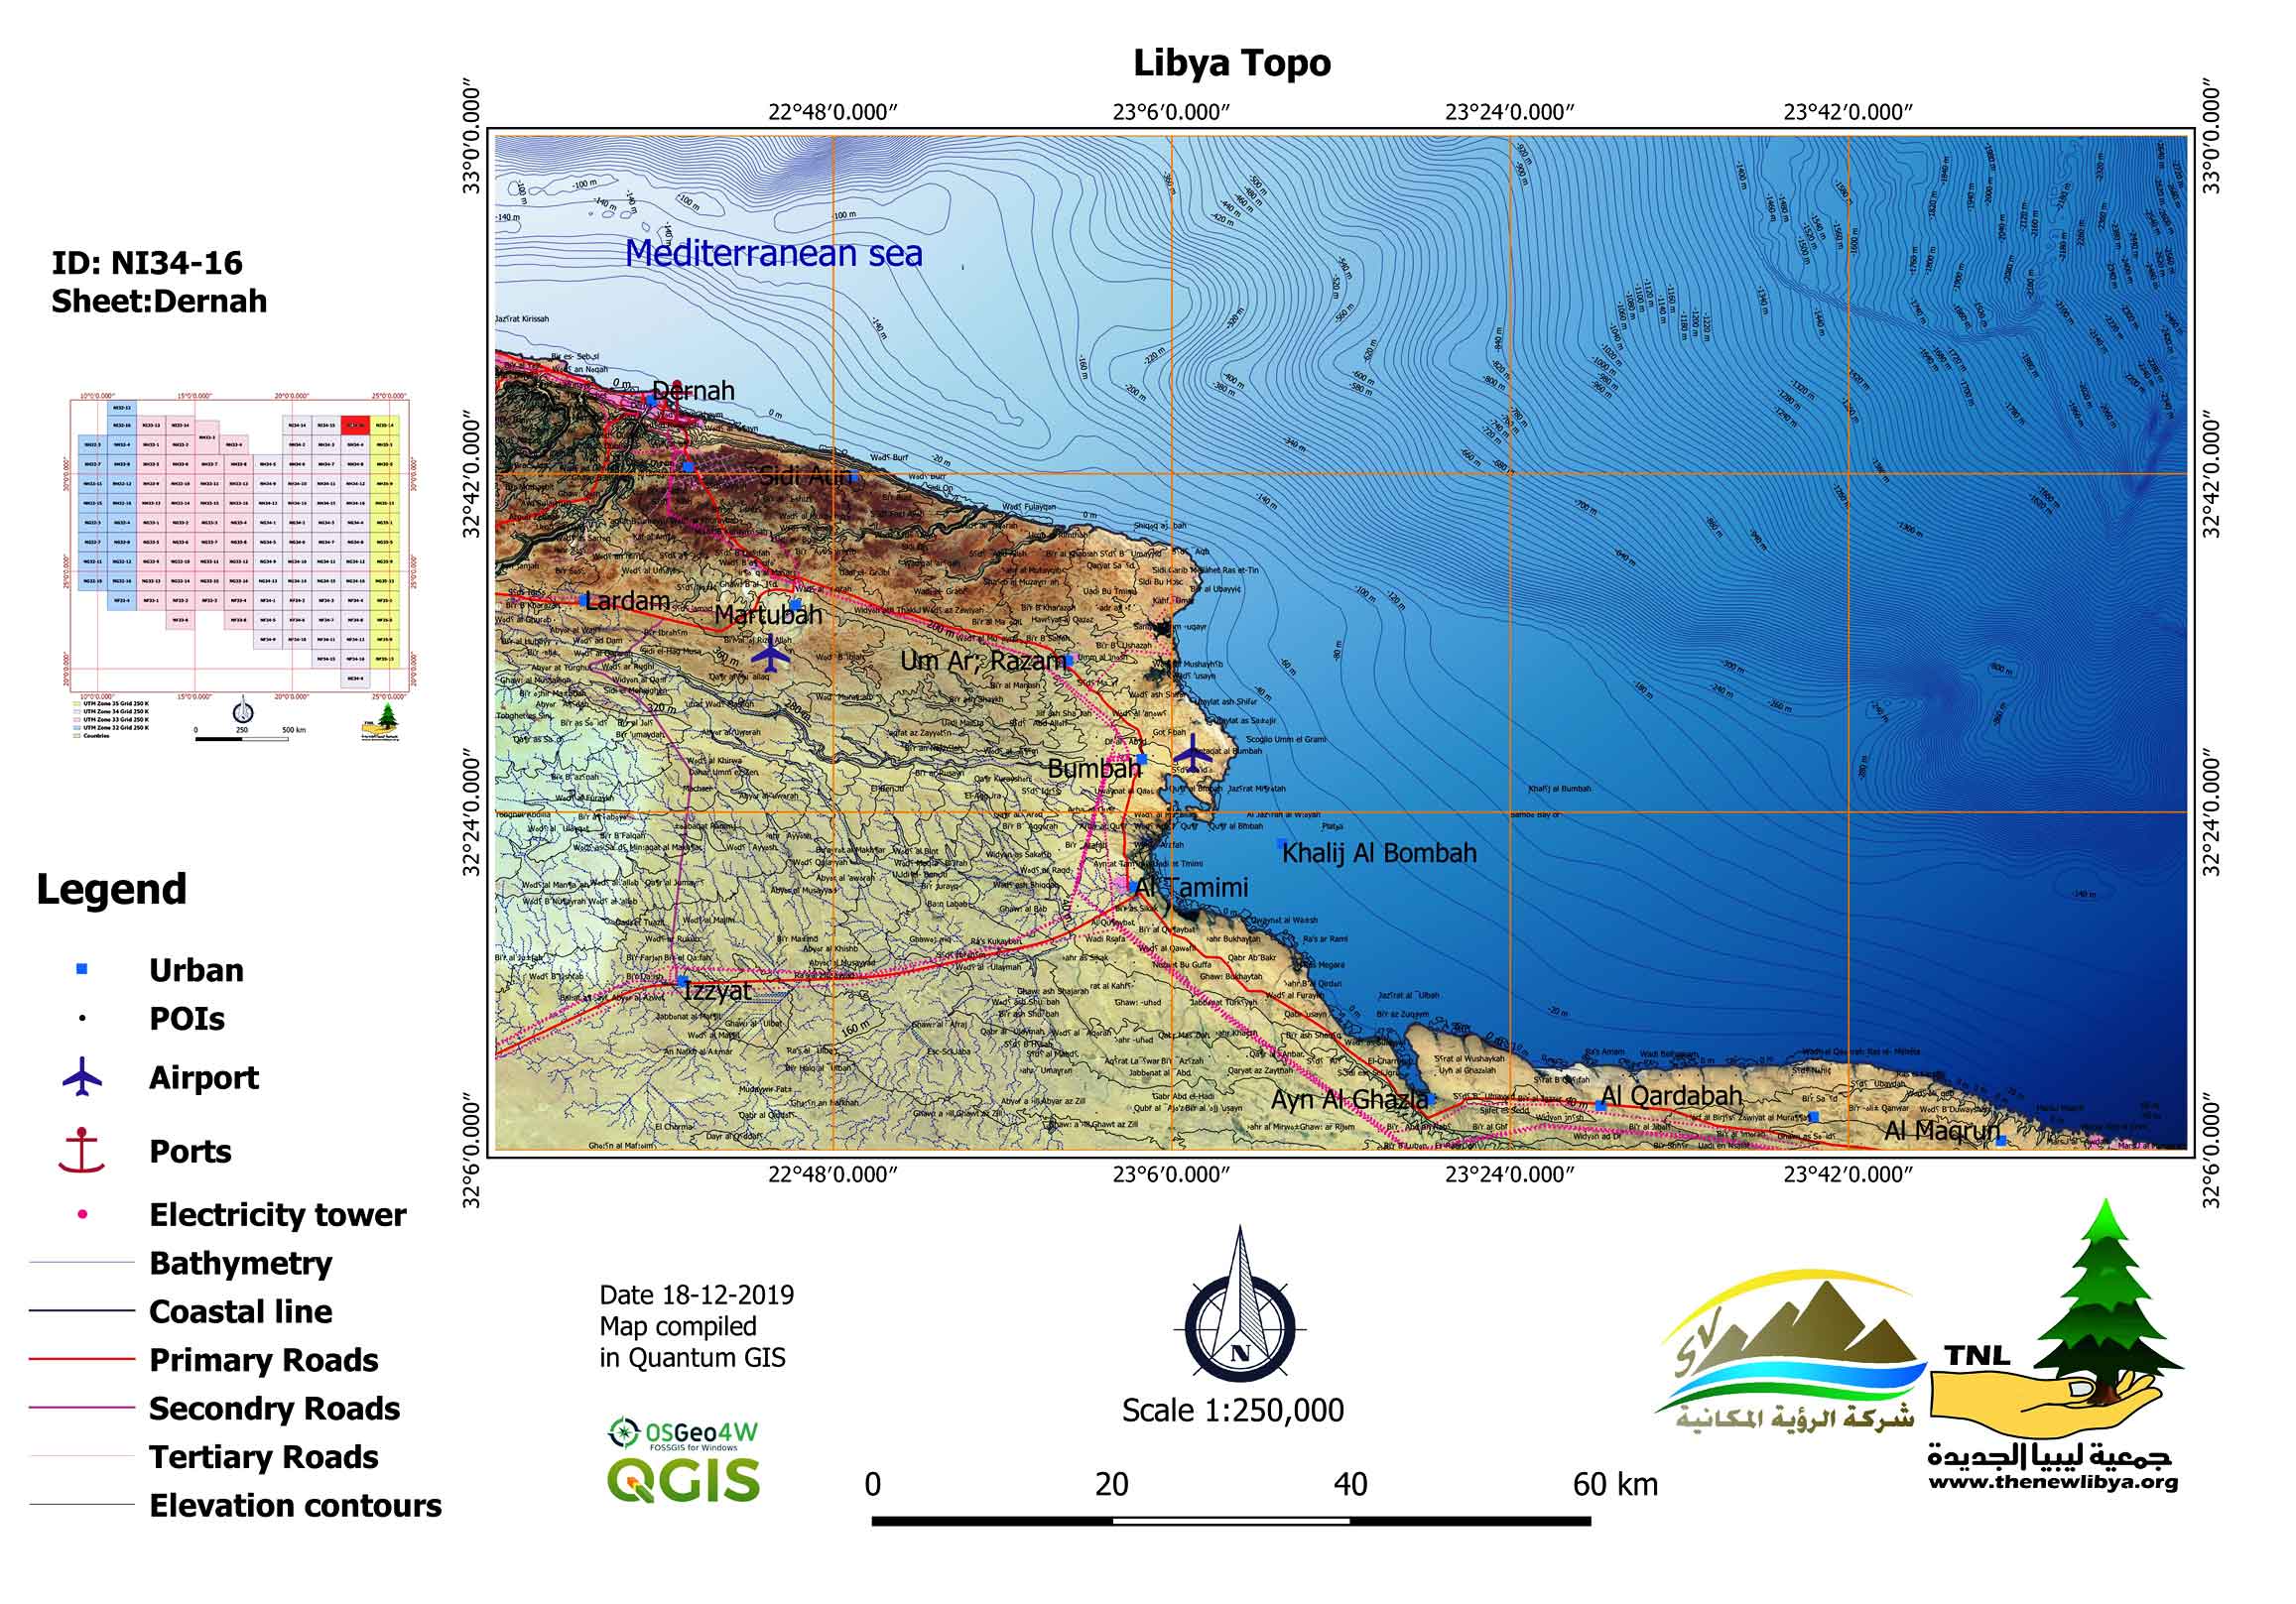
Samples of the updated topographic maps produced are shown in (Figure 5, 6 and 7). Land cover and ArcGIS world imagery has been added to the layout content, providing background geography for preferred content, which is an important addition to the map layout from which topographic maps are supported by land cover and high-resolution background imagery of satellites.
Figure 5. DEM based topographic map
Figure 6. Land cover based topographic map
Figure 7. World Imagery based topographic map
5 . CONCLUSIONS
Most of the worldwide national mapping development was originated in the military survey. Prior to 1900 civilians in the United States and Canada were engaged in mapping. Thus, the military mapping control resulted in significant consequences; topographic maps were produced primarily for military purposes. Therefore, the maps were classified and inaccessible to the public in some countries. Moreover, most of the maps currently updated in most countries are only updated copies, and this is indicated by modern geospatial technology verification, as it is noticed that the content does not keep pace with changes. As for topographic maps in Libya, the following observed
Most of the maps that are available and that circulated publicly their contents dated back to the time of their production and only the printing renewed.
The Libyan state lacks of a spatial data infrastructure
Most of the maps produced executed by foreign agencies or organizations. Consequently, they require precision, particularly concerning geographical names and locations.
The specialized relevant Libyan institutions do not classify the road networks and urban areas.
Therefore, updating maps is crucial as many specialists, planners, and decision-makers rely strongly on topographic maps for planning and development. Hence, the updated maps at a scale of 1:250000 through this project using the stated methodology will be an essential map source. Where a large amount of data has added to the maps and a spatial database has created to be enriched by more spatial data collection. So, the maps produced in the shortest possible time. Besides with more verification, the maps can be generalized on a scale smaller than 1:250000. So, in the shortest possible time, the maps can be produced. Also, the maps can be generalized on a scale smaller than 1:250000 in case of further verification. Furthermore, this project is an initiative of NGOs to update the topographical maps for supporting the efforts of the individuals and civil society organizations interested in the environment and natural resources conservation as the updated maps and the spatial database will be freely available on request for the environmental projects. Also, due to many resource constraints, it is recommended that such a project be officially initiated by relevant Libyan governmental institutions as a comprehensive combined project supported by geodesic control that will result in much-improved accuracy and unified mapping system that eliminates errors and gaps and increases the accuracy of spatial information.
Tables
Figures
Conflict of Interest
The author declares that they have no conflict of interest.
Acknowledgements
The author would like to thank all the staff members of the New Libya Organization, Spatial Vision Company especially Mr. Ahmed Rhuma CEO of the New Libya Association, Sacramento California-USA, Mr. Younes Ahweej, Moataz Alhasee, Akram Buawena and the project Volunteer. Moreover, all the people who have been supported for project implementation, directly or indirectly.
Abbreviations
DEM: Digital Elevation Model; DMA- JOG: Defense Mapping Agency Joint Graphic Operation; EO: Earth Observation; E-PORTS: World Ports Database; FAO: Food and Agriculture Organization; FOSS: Free Open Source Software; GEBCO: General Bathymetric Chart of the Oceans; GECOL: General Electricity Company of Libya; EWR: General Establishment for Water Resources; GIS: Geographic Information Systems; GRASS GIS: Geographic Resources Analysis Support System; IATA: International Air Transport Association; IRC: Industrial Research Center; Libya Topo: Libya Topography Project; NGA: National Geospatial-Intelligence; OLI: Operational Land Imager; OSM: OpenStreetMap; POIs: Point of Interest; QGIS: Quantum GIS; RS: Remote Sensing; SAGA GIS: Automated Geo-Scientific Analyses; SCP: Semi-Automatic Classification; TIRS: Thermal Infrared Sensor; UPA: Urban Planning Authority; USGS: Unites states Geological Survey; USSR: Union of Soviet Socialist Republics; UTM: Universal Transverse Mercator.