The results of all analyzed physicochemical parameters of sampled groundwater are provided (Table 1) with their respective study locations and the statistical description of the measured parameters compared to the minimum values set by the recommendations of the Nigerian Industrial Standard (NIS, 2015).
Table 1. Groundwater physicochemical parameters
|
Locations
|
Chemical parameters
|
In-situ physicochemical parameters
|
|
Ca
|
Mg
|
Na
|
Fe
|
Cl
|
SO4
|
PO4
|
NO3
|
TH
|
Alk
|
EC
|
pH
|
Temp
|
TDS
|
Turb
|
|
Chiranchi Yamma
|
60.9
|
9.23
|
24
|
0.02
|
140
|
13.3
|
0.38
|
0
|
190
|
12
|
796
|
6.66
|
30.5
|
453
|
0
|
|
Danbare B
|
22.4
|
3.4
|
8.61
|
0.06
|
45
|
4.98
|
0.5
|
8.6
|
70
|
6
|
279
|
6.86
|
29.7
|
160
|
0.75
|
|
Dandago
|
170
|
25.7
|
47.1
|
0.01
|
385
|
53
|
0.06
|
7.2
|
530
|
20
|
934
|
6.7
|
26.9
|
533
|
8.64
|
|
Diso
|
80.1
|
12.1
|
28.8
|
0.01
|
105
|
82
|
0
|
0
|
250
|
24
|
948
|
7.15
|
29.7
|
536
|
0
|
|
Dorayi Gidan Sarki
|
0
|
0
|
9.3
|
0.03
|
55
|
21.6
|
0.25
|
5.3
|
0
|
12
|
157
|
6.69
|
29.7
|
89.5
|
0.33
|
|
Dorayi Yankifi
|
44.9
|
6.8
|
21.6
|
0.05
|
80
|
23.2
|
0.25
|
0
|
140
|
10
|
550
|
6.35
|
29.7
|
315
|
0
|
|
Farin Gida
|
54.5
|
8.26
|
17.4
|
0.02
|
80
|
15.7
|
0.25
|
0
|
170
|
10
|
540
|
6.8
|
28.1
|
309
|
1.65
|
|
Gadon Kaya
|
28.8
|
4.37
|
23.8
|
0.02
|
160
|
15
|
0
|
1.1
|
90
|
10
|
615
|
6.04
|
32.4
|
347
|
0
|
|
Gidan Dagachi
|
99.3
|
15.1
|
40.7
|
0.1
|
150
|
9.96
|
0.05
|
0.6
|
310
|
26
|
1044
|
6.85
|
29.5
|
599
|
4
|
|
Goron Dutse
|
83.3
|
12.6
|
15.8
|
0.01
|
115
|
40
|
0.04
|
0
|
260
|
6
|
660
|
6.7
|
28.7
|
378
|
0.03
|
|
Hauren Legal
|
28.8
|
4.37
|
16.5
|
0.05
|
50
|
6.64
|
0.25
|
1.41
|
90
|
12
|
418
|
6.83
|
29.7
|
239
|
0.56
|
|
Hauren Makaranta
|
122
|
18.5
|
35.0
|
0.02
|
325
|
52
|
0
|
7.2
|
380
|
24
|
1998
|
6.94
|
29.7
|
1145
|
1.25
|
|
Janbulo
|
48.1
|
7.29
|
23.2
|
0.05
|
135
|
13.3
|
0.25
|
0.3
|
150
|
10
|
626
|
6.72
|
29.7
|
359
|
0
|
|
Kabuga
|
76.9
|
11.7
|
25.3
|
0.01
|
110
|
92
|
0.03
|
0
|
240
|
10
|
724
|
6.63
|
31.3
|
413
|
0
|
|
Kuntau
|
41.6
|
6.31
|
18.3
|
0.06
|
90
|
0.83
|
0.5
|
0
|
130
|
10
|
601
|
6.79
|
29.7
|
343
|
0
|
|
Kwanar Ganduje
|
22.4
|
3.4
|
17.2
|
0.01
|
85
|
14.1
|
0.37
|
0
|
70
|
12
|
444
|
6.55
|
30.7
|
254
|
2.27
|
|
Magashi
|
220
|
28.6
|
44.1
|
0.02
|
380
|
124
|
0.04
|
0
|
590
|
12
|
1058
|
7.08
|
25.2
|
599
|
4.36
|
|
Makera
|
80.1
|
12.1
|
27.5
|
0.04
|
215
|
14.9
|
0.12
|
0
|
250
|
14
|
1060
|
5.94
|
30.9
|
604
|
0
|
|
Mandawari
|
208
|
27.1
|
41.9
|
0.03
|
340
|
142
|
0.04
|
0
|
560
|
22
|
1054
|
6.99
|
29.5
|
607
|
0.64
|
|
Mundadu
|
28.8
|
4.37
|
19.6
|
0.01
|
90
|
19.9
|
0.37
|
3.5
|
90
|
8
|
511
|
6.69
|
29.7
|
291
|
0
|
|
Rinji
|
64.1
|
9.71
|
25.6
|
0.01
|
165
|
14.1
|
0.3
|
0
|
200
|
8
|
992
|
6.45
|
29.1
|
564
|
0
|
|
Salanta
|
179
|
27.9
|
34.9
|
0.02
|
290
|
15
|
0.38
|
1.4
|
560
|
30
|
1783
|
6.72
|
29.4
|
1020
|
0.48
|
|
Sani Mainagge
|
60.9
|
9.23
|
34.9
|
0.01
|
240
|
72
|
0
|
4
|
190
|
12
|
1191
|
6.73
|
32.7
|
681
|
0.93
|
|
Shago tara
|
73.7
|
11.2
|
15.6
|
0
|
150
|
26.5
|
0.25
|
0
|
230
|
8
|
855
|
6.3
|
29.9
|
488
|
0
|
|
Sharada Housing Est
|
41.6
|
6.31
|
13.5
|
0.02
|
55
|
11.6
|
0.5
|
0
|
130
|
10
|
320
|
6.86
|
28.4
|
182
|
17.1
|
|
Tudun Yola
|
54.5
|
8.26
|
22.9
|
0.02
|
95
|
58
|
0.17
|
0
|
170
|
14
|
653
|
6.56
|
29.3
|
377
|
1.1
|
|
Unguwar Lalle
|
22.4
|
3.4
|
16.1
|
0.02
|
80
|
16.6
|
0.25
|
0
|
70
|
6
|
416
|
6.7
|
29.4
|
238
|
0.71
|
|
Yamadawa
|
64.1
|
9.71
|
30.4
|
0.05
|
215
|
25.7
|
0.38
|
0.2
|
300
|
16
|
1242
|
6.64
|
29.7
|
709
|
0.66
|
|
Statistical summary
|
|
Mean
|
74.3
|
11.0
|
25.0
|
0.03
|
158
|
35.6
|
0.21
|
1.46
|
229
|
13.4
|
803
|
6.68
|
29.6
|
458
|
1.62
|
|
Standard Deviation
|
56.8
|
7.88
|
10.4
|
0.02
|
102
|
364
|
0.17
|
2.58
|
161
|
6.46
|
421
|
0.27
|
1.44
|
241
|
3.56
|
|
Minimum
|
0.00
|
0.00
|
8.61
|
0.00
|
45.0
|
0.83
|
0.00
|
0.00
|
0.0
|
6.00
|
157
|
5.94
|
25.2
|
89.5
|
0.00
|
|
Maximum
|
220
|
28.6
|
47.1
|
0.10
|
385
|
142
|
0.50
|
8.60
|
590
|
30.0
|
1998
|
7.15
|
32.7
|
1145
|
17.1
|
|
Skewness
|
1.39
|
1.17
|
0.55
|
1.52
|
1.06
|
1.67
|
0.20
|
1.78
|
1.1
|
1.19
|
1.12
|
-1.01
|
-0.68
|
1.14
|
3.56
|
|
Kurtosis
|
1.29
|
0.59
|
-0.46
|
2.70
|
0.03
|
2.19
|
-1.2
|
1.97
|
0.4
|
0.55
|
1.68
|
1.62
|
3.17
|
1.73
|
13.9
|
|
NIS 2015
|
75
|
20
|
200
|
0.3
|
250
|
100
|
3.5
|
50
|
150
|
250
|
1000
|
6.5 -8.5
|
Ambient
|
500
|
5
|
Note: Samples exceed the drinking standards of Nigerian Industrial Standard (NIS) are in bold.
3.1 Chemical Analysis
3.1.1Calcium
Calcium is the most essential yet abundant element in the human body and for normal growth and health, sufficient intake is necessary. The overall recommended daily intake is between 1 and 2 grams and is primarily
extracted via dairy products. There is also some evidences that show in the region covered by a drinking water source with a high degree of hardness, the primary component of which is calcium, the occurrence of heart disease is decreased and as such the presence of the element in the water supply is advantageous to health.
High level of calcium can be beneficial and calcium rich water is very palatable (EPA, 2001). Severe calcium deficiency, however, is related to certain forms of children’s hypertension, prostate and colorectal cancer, certain forms of kidney stones, miscarriage, birth defects. It may result in menstrual and premenstrual complications, various bone-, joint- and periodontal disorders, muscle spasms and cramps, sleep disorders, psychological health / depressive disorders, cardiovascular and/or hemorrhagic illnesses, and many others, if a mother is deficient in calcium throughout pregnancy. Arthritic/joint and vascular degeneration, soft tissue calcification, hypertension and stroke, an increase in triglycerides, gastrointestinal disorders, mood and depressive disorders, chronic fatigue, increased alkalinity and general mineral imbalances are connected with excessive calcium levels. Besides, high calcium levels are often correlated with some forms of atherosclerosis, cardiovascular disease, arrhythmias, heart diseases and stroke, high blood pressure, low stomach acid, depression, weakness, glaucoma, increased risk of multiple cancers, muscle joint pain, osteoporosis, osteoarthritis, calcification, dry skin, constipation (Arabi et al., 2013). The calcium values for groundwater samples obtained for different sampling locations ranged from 0.00 to 220 mg/L (Table 1). The minimum and maximum of calcium concentrations were obtained in Dorayi Gidan Sarki and Magashi, respectively (Table 1). The concentrations of calcium above the NIS specified value of 75 mg/L were observed at the following locations; Magashi (220mg/L), Mandawari (208mg/L), Salanta (179mg/L), Dandago (170mg/L), Hauren Makaranta (122mg/L), Gidan Dagachi (99.3mg/L), Goron Dutse (83.3mg/L), Makera (80.1mg/L), Diso (80mg/L) and Kabuga (76.6mg/L).
3.1.2 Magnesium
Like calcium, magnesium remains abundant and a significant dietary requirement for humans (0.3-0.5 g / day). It is also the second major element of hardness and typically accounts for 15-20 % of the overall hardness (EPA, 2001).
Some kinds of irregular heartbeat, cardiovascular disease, anxiety, insomnia, nervousness, weakness, muscle/joint pain, osteoporosis, epilepsy, high stomach acid, asthma, high blood pressure, PMS, anxiety, sweating, muscle spasms/cramps, dysmenorrhea, angina, constipation, migraine/headaches are associated with low magnesium intake.
High magnesium intake, however, can lead to cardiovascular disease, arrhythmia, cardiac arrest, coma, muscle spasms, joint/spinal degeneration, bone loss, low stomach acid, low body temperature, low blood pressure, increased risk of multiple cancers, bowel / genitourinary bleeding, dry skin, fatigue, depression, vomiting, diarrhea (Arabi et al., 2013). Magnesium concentrations range from 0.00 to 28.60 mg/L from the samples analyzed at different locations, while the minimum and maximum values of magnesium were obtained at Dorayi Gidan Sarki and Magashi, respectively (Table 1). From the investigated study locations, four of the samples; Magashi (28.6mg/L), Salanta (27.9mg/L), Mandawari (27.1mg/L), and Dandago (25.7mg/L) magnesium concentrations above the permissible NIS standard value of 20mg/L with the highest value of magnesium exhibited by groundwater sample collected from Magashi.
3.1.3 Sodium
Sodium in natural waters is still present. It is also a necessary dietary requirement and the usual consumption in food is the same as common salt (sodium chloride); 5 grams or more can be ingested daily. The key explanation for restricting it is the joint effect that can induce hypertension by exercising with sulphate, but too extreme an intake (the latter usually being 2-3 times the dietary threshold). If intake excess, the sodium induces hypertension inculcates in human brain (EPA, 2001). From the basis of the findings described in Table 1, the minimum and maximum sodium concentrations, 8.61 and 47.10 mg/L were exhibited for Dandago and Danbare B, respectively. All values obtained were, however, below the permissible 200 mg / L concentration defined by the NIS.
3.1.4 Iron
In soils and rocks, iron is present in large quantities, mainly in insoluble forms. Many complex reactions that occur naturally in soil formations, however, will give rise to more soluble iron forms that will therefore be present in water passing through such formations. Therefore, large quantities of iron can be found in the groundwater. Serious issues can be caused by the presence of iron in drinking water sources, but there is typically no adverse impact on people who ingest water with large quantities of iron. Instead, the concerns are largely aesthetic. When washed in water with excessive iron, laundry becomes stained and vegetables are also discolored when cooked. Problems with taste can also occur.
The iron objections are mainly organoleptic, but recent medical concerns have been raised about high levels of drinking water. Besides, anaemia has been discovered as a result of an iron deficiency in humans (Popoola et al., 2019). Haemosiderosis (liver-damage disease), diabetes mellitus, arteriosclerosis and many other neurodegenerative disorders are the products of substantial drinking water intake containing elevated levels of iron. (Nagendrappa et al., 2010; Brewer, 2009). The minimum and maximum iron values, 0.00 and 0.100 mg/L were observed at Gidan Dagachi and Shago Tara, respectively (Table 1). From the samples tested, the iron concentrations of all samples were below the allowable NIS standard value of 0.30 mg / L.
3.1.5 Chloride
Water will begin to taste salty at levels above 250 mg/L and will become increasingly undesirable as the concentration further increases. External conditions, however, regulate acceptability and water containing up to 2,000 mg/L is consumed in some arid areas, but not by people who are unfamiliar with such concentrations. Similarly, high levels of chloride can make freshwater unsuitable for agricultural irrigation. Chloride does not pose a health risk to humans and palatability is the main factor. Excessive chloride concentrations in water, however, could lead to (1) laxative effects, (2) damage to metal pipes and (3) inadequacy of water for agricultural irrigation (Raviprakash and Krishna, 1989). As shown in Table 1, the concentration of chloride in the study area ranges from 45.00 to 385 mg/L with Dandago and Danbare B having the lowest and highest concentrations, respectively. From the examined samples, five of the samples (Dandago, Hauren Makaranta, Magashi, Mandawari and Salanta) have Chloride concentrations above the permissible NIS standard value of 250 mg/L with the maximum concentration level revealed by groundwater sample collected from Dandago. The observed chloride concentrations above the permissible level could be linked to (1) dissolution of chloride-containing soils and rocks into groundwater bodies via leaching (Aremu et al., 2011) and (2) high chloride-rich sewage and municipal effluents discharged by residents in investigated locations for all the five sampling locations which later found its way into underground water (Gorde and Jadhav, 2013).
3.1.6 Sulphate
In almost all natural waters, sulfates occur, with concentrations varying according to the nature of the terrain from which they flow. They are also extracted from heavy metal (iron, nickel, copper and lead) sulphides. In sedimentary rocks from which they can be oxidized to sulphate in tropical weather, iron sulphides are present; the latter can then leach into water courses such that sulphate groundwater is always extremely high.
Large amounts sulphate, particularly in combination with magnesium and/or sodium, seems to have a laxative effect. Sulphate accumulation in water, however, can lead to an increase in water pH that causes acidosis (Asamoah and Amorin, 2011). The maximum and minimum concentrations of sulphate in the sample areas were 0.830 mg/L (Kuntau) and 142 mg/L (Mandawari) (Table 1). Sulphate concentrations of two locations, Mandawari (142 mg/L) and Magashi (124 mg/L) were above the standard limit of 100 mg/L provided by the NIS (Table 1).
3.1.7 Phosphate
The importance of phosphorus is primarily related to the eutrophication (over-enrichment) phenomenon of lakes and, to a lesser degree, rivers. Along with nitrogen as nitrate, phosphorus having access to such water bodies promotes the growth of algae and other plants that lead to blooms, littoral slimes, large-scale diurnal dissolved oxygen variations and related issues. Phosphate does not pose a health hazard to humans (EPA, 2001). Four locations (Diso, Gadon Kaya, Hauren Makaranta, Sani Mainagge) and three locations (Danbare B, Kuntau and Sharada Housing Est.) exhibited minimum and maximum of phosphate concentrations of 0.00 mg/L and 0.50 mg/L, respectively (Table 1). Phosphate concentrations of all examined samples were below the allowable level of 3.50 mg/L defined by the NIS (Table 1).
3.1.8 Nitrate
There is very little mineral origin of the nitrate present in natural waters, much of which comes from organic and inorganic sources, the former including discharges of waste and the latter including primarily artificial fertilizers. Bacterial oxidation and nitrogen fixation by plants, however, may also produce nitrates. Risk to infants over 11, however, when discharged into the atmosphere, highly concentrated waste containing nitrogen compounds may have been oxidized to nitrate and made its way by percolation into groundwater (Bruning-Fann and Kanaeme, 1993). The results obtained indicated a nitrate content of 0.00 mg/L and 8.60 mg/L with minimum and maximum concentrations (Table 1). All calculated values were below the 50.0 mg / L NIS permitted value.
3.1.9 Total Hardness
Hardness was commonly measured by titration with a soap solution, initially known to be the water’s capacity to kill the lather of soap. Nowadays, the study includes calcium and magnesium determination, which are the key components of hardness. While hardness can also lead to barium, strontium and iron, their concentrations are usually so low in this context that they can be overlooked. Thus, overall hardness is taken to include the concentrations of calcium and magnesium. In rock formations, the widespread abundance of these metals also contributes to very significant levels of hardness in surface and groundwater.
Hardness is a natural feature of water that can increase its palatability for drinking purposes and consumer acceptability. In recent years, health reports in many countries show that mortality rates from heart disease in areas with hard water are lower (EPA, 2001). The overall hardness concentration ranged from 0.00 mg/L (Dorayi Gidan Sarki) to 590 mg/L (Magashi) in the examined samples (Table 1). More than half (60.7%) of the samples tested were administered by the NIS above the acceptable limit of 150 mg/L.
3.1.10 Alkalinity
Alkalinity in natural water can be ascribed to carbonates and hydroxides. Usually analysis is carried out to differentiate between the alkalinity elements and this is done by using different indicators in the titration process and by making suitable calculations. The indicators most widely used are phenolphthalein (color change around pH 8.3) and methyl orange (color change around pH 4.5), leading to additional terms phenolphthalein alkalinity and methyl orange alkalinity. Alkalinity-related sanitary significance is unknown (even up to 400 mg / L), while unpalatability can lead to highly alkaline water (EPA, 2001). From the results presented in Table 1, the minimum and maximum total alkalinity concentration of 6.00 mg/L and 30.00 mg/L were observed in (Danbare B, Goron Dutse and Unguwar lalle) and (Salanta), respectively. However, all values obtained were below the allowable NIS specified concentration of 250 mg/L.
3.1.11 Electrical Conductivity
The electrical conductivity of water is often referred to as conductivity and is an indication of its capacity to conduct electricity. Since this ability is related to the sample’s ionic content, which in turn is a measure of the concentration of dissolved (Ionizable) solids, the importance of easily performed measures of conductivity is apparent. In itself, conductivity is a property of little interest to a water analyst but it is an invaluable measure of the range from which the value of hardness and alkalinity are likely to fall, as well as the order of the water’s dissolved solids material (EPA, 2001). The results from the collected samples showed that EC values ranged from 157.0 µS/cm (Dorayi Gidan Sarki) to 1998.0 µS/cm (Hauren Makaranta) (Table 1). The examined samples (28.6%) were above the permissible value of 1000 µS/cm set by the NIS (Table 1). The unacceptable EC value exhibited by these samples may be due to (1) dissolution of ionic heavy metals from manufacturing activities of heavy machines that later made their ways into groundwater via leaching of sub-soil layers (Eruola and Adedokun, 2012) and (2) higher temperature of the location enhancing movement of ions under electrostatic potential (Oguntona et al., 2012). The side effects are primarily water corrosion and the presence of heavy metals that render water unsafe for drinking (Popoola et al., 2019).
3.1.12 pH
The pH is, by definition, the negative logarithm of the solution's hydrogen ion concentration and is thus an indicator of whether the liquid is acidic or alkaline. The scale of pH (derived from the water ionization constant) varies between 0 (very acidic) and 14 (very alkaline). The most commonly encountered range, however, is 6.5-8.0. Extremes of pH can influence the water palatability, but a more urgent issue is the corrosive effect on delivery systems (EPA, 2001). As shown in Table 1, the pH values in the study areas varied from 5.94 to 7.15 with a mean value of 6.68±0.27, indicating acidic to slight alkaline in nature (Bodrud-Doza et. al., 2016). The measured values of groundwater samples at Makera (5.94), Gadon Kaya (6.04), Shago Tara (6.30), Dorayi Yankifi (6.35) and Ringi (6.45) were slightly acidic and values were not within the allowable range (6.5-8.5), provided by the NIS (Table 1). The slightly acidic nature of these locations can arise from the deposits of carbonic acid released by the reaction of carbon dioxide to rainwater (Tiwari et al., 2015). This may be exported through soil surface layer to form deposits in the groundwater through one of those chemical processes over some time. Nevertheless, acidic water has also been identified to cause damage to cells of mucous membrane, eyes and skin irritation (Meinhardt, 2006). Acidic water also contributes significantly to metal corrosion, combined with disinfection efficiency, which has an indirect effect on human health (Popoola et al., 2019).
3.1.13 Temperature
Fundamental biological and chemical processes that affect the cycling of oxygen, carbon and other elements in soil and groundwater are regulated by temperature. Nevertheless, recent research has shown that even minor temperature changes below 25ºC still can affect the quality of groundwater (Riedel, 2019). Of course, thermal pollution will also affect the position, possibly very substantially. The effect of temperature on living organisms, and particularly changes in temperature, can also be critical, and indeed the subject is very broad and complex.
It does not affect human health (EPA, 2001). However, a higher temperature may directly accelerate the degradation of organic pollutants in groundwater. Changes in temperature can also influence the redox chemistry of groundwater. In the study area, the temperature of the groundwater samples ranged from 25.20 to 32.70˚C (Table 1). Generally, at a higher temperature, the rate of chemical reactions increases. Water, especially groundwater, can dissolve more minerals from the rocks at higher temperatures. It will therefore have higher electrical conductivity (Kale, 2016).
3.14 Total Dissolved Solid
The parameter is determined as total solids, except that the sample is previously filtered by a given medium. Using the very rapid determination of conductivity to provide an estimate of the total dissolved solids is also convenient and appropriate. The minimum and maximum values of TDS of the investigated groundwater samples were 89.50 mg/L (Dorayi Gidan Sarki) 1145 mg/L (Hauren Makaranta) (Table 1). Nearly (39.3%) of the water samples recorded maximum TDS values higher than the 500 mg/L threshold limit as given by the NIS. The maximum TDS values revealed by these locations are an indicator of salty water that can be due to (1) the presence of natural solute by soil dissolution and weathering; and (2) the discharge from industrial treatment plants causing leaching of soil contamination and pollution of groundwater by point-source. The ionic intensity also increases as the TDS concentration of water samples increases (Popoola et al., 2019).
3.1.15 Turbidity
The presence of very finely dispersed solids results in turbidity in water. The presence of turbidity in water can influence its consumer’s acceptability and may also have a direct effect on its usefulness in some industries. Turbidity-forming particles can also interfere with the physical and chemical characteristics of water, and the effects can be severe in the case of the disinfection process. Since turbidity can be caused by sewage matter in water, there is indeed a danger that the turbidity particles may support pathogenic organisms and thus escape the disinfectant’s action (EPA, 2001). Direct health effects are dependent on the precise composition of the materials that cause turbidity, but there are other consequences. The turbidity values in the study areas ranges from 0.00 NTU to 17.10 NTU with a mean value of 1.62±3.56NTU (Table 1). Only two sampling locations, Sharada Housing Est. (17.1 NTU) and Dandago (8.64 NTU) were above the NIS permissible value of 5.00 NTU, as presented (Table 1).
3.2 Correlation of Groundwater Pollutants
The results from correlation analysis reveal that majority of assessed groundwater parameters were significantly correlated with one another, positively or negatively at various levels of significance (1% and 5%) (Table 2). The concentration of Ca was significantly, strongly correlated with Mg (r=0.99) , TH (r=0.99) , Cl (r=0.88) , and Na (r=0.84) . The examined Mg exhibits a strong and positive correlation with TH (r=0.99) , Cl (r=0.88) , Na (r=0.84) , EC (r=0.72) , and TDS (r=0.72) . A significant strong correlation was obtained between Na and Cl (r=0.73) , Na and TH (r=0.86) , Na and EC (r=0.73) , and Na and TDS (r=0.73) . Also, the measured Cl was strongly associated with TH (r=0.90) , EC (r=0.77) , and TDS (r=0.77) . Other parameters that correlated strongly with one another include TH with EC (r=0.74) and TH with TDS (r=0.73) ; Alk with EC (r=0.71) and Alk with TDS (r=0.72) ; and EC with TDS (r=1) . The strong correlation between EC and TDS indicates EC is attributed to the dissolution of salts and inorganic pollution load in the water (Wagh et al., 2018). These parameters were strongly correlated with one another based on a 1% level of significance. The remaining parameters were moderately or weakly correlated (positively or negatively) with one another at a 1% or 5% level of significance. However, the strong correlation between the examined parameters: EC, TDS, Ca, TH, Mg, SO4 and Cl, is an indication that anthropogenic and industrial activities were responsible for contamination of the assessed groundwater parameters in the study area.
Table 2. Correlation matrix
|
Parameters
|
Ca
|
Mg
|
Na
|
Fe
|
Cl
|
SO4
|
PO4
|
NO3
|
TH
|
Alk
|
EC
|
pH
|
Temp
|
TDS
|
Turb
|
|
Ca
|
1
|
|
|
|
|
|
|
|
|
|
|
|
|
|
|
|
Mg
|
.99
|
1
|
|
|
|
|
|
|
|
|
|
|
|
|
|
|
Na
|
.84
|
.84
|
1
|
|
|
|
|
|
|
|
|
|
|
|
|
|
Fe
|
-.12
|
-.12
|
.03
|
1
|
|
|
|
|
|
|
|
|
|
|
|
|
Cl
|
.88
|
.88
|
.88
|
-.17
|
1
|
|
|
|
|
|
|
|
|
|
|
|
SO4
|
.68
|
.62
|
.59
|
-.33
|
.58
|
1
|
|
|
|
|
|
|
|
|
|
|
PO4
|
-.44
|
-.43
|
-.58
|
.19
|
-.48
|
-.64
|
1
|
|
|
|
|
|
|
|
|
|
NO3
|
.01
|
.03
|
.05
|
.02
|
.20
|
-.05
|
-.02
|
1
|
|
|
|
|
|
|
|
|
TH
|
.99
|
.99
|
.86
|
-.10
|
.90
|
.62
|
-.41
|
.02
|
1
|
|
|
|
|
|
|
|
Alk
|
.61
|
.66
|
.69
|
.18
|
.56
|
.28
|
-.33
|
.12
|
.66
|
1
|
|
|
|
|
|
|
EC
|
.67
|
.72
|
.73
|
-.08
|
.77
|
.32
|
-.38
|
.10
|
.74
|
.71
|
1
|
|
|
|
|
|
pH
|
.34
|
.31
|
.23
|
.09
|
.13
|
.41
|
-.02
|
.20
|
.31
|
.33
|
.11
|
1
|
|
|
|
|
Temp
|
-.50
|
-.48
|
-.24
|
.01
|
-.30
|
-.22
|
-.06
|
-.02
|
-.48
|
-.08
|
-.01
|
-.47
|
1
|
|
|
|
TDS
|
.67
|
.72
|
.73
|
-.08
|
.77
|
.32
|
-.38
|
.10
|
.73
|
.72
|
1.0
|
.11
|
-.01
|
1
|
|
|
Turb
|
.16
|
.16
|
.12
|
-.04
|
.10
|
.01
|
.15
|
.08
|
.16
|
.08
|
-.12
|
.24
|
-.44
|
-.11
|
1
|
The significant correlation at 1% and 5% levels are bolded.
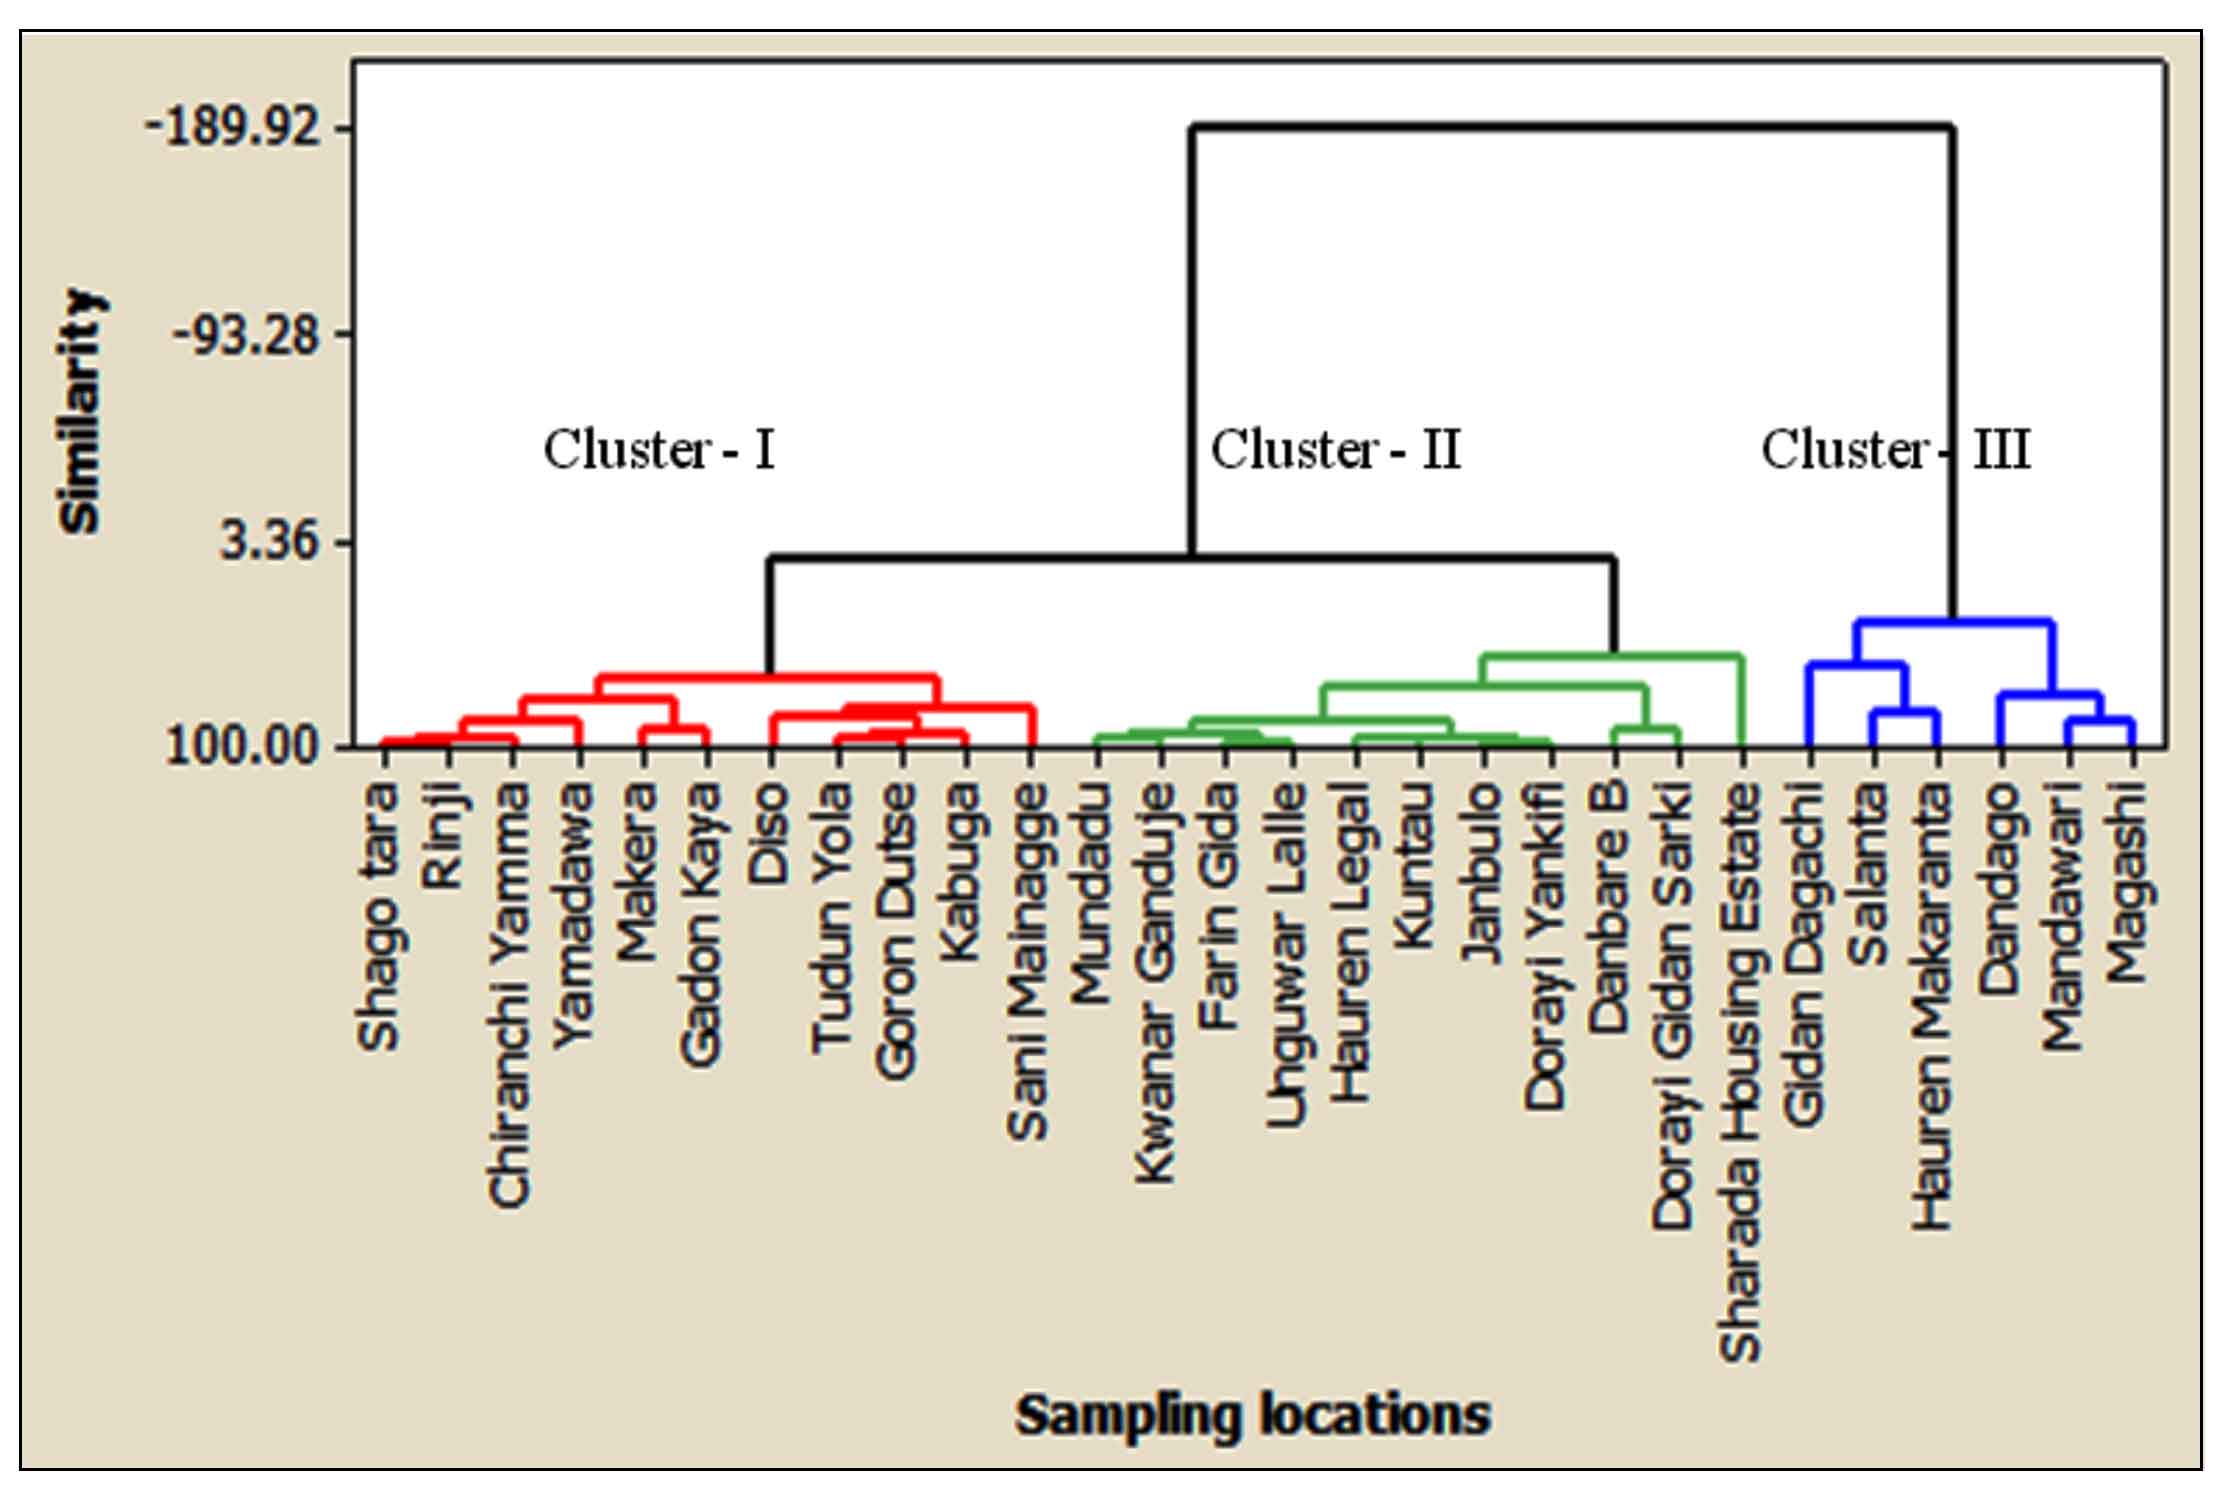
3.3 Cluster Analysis
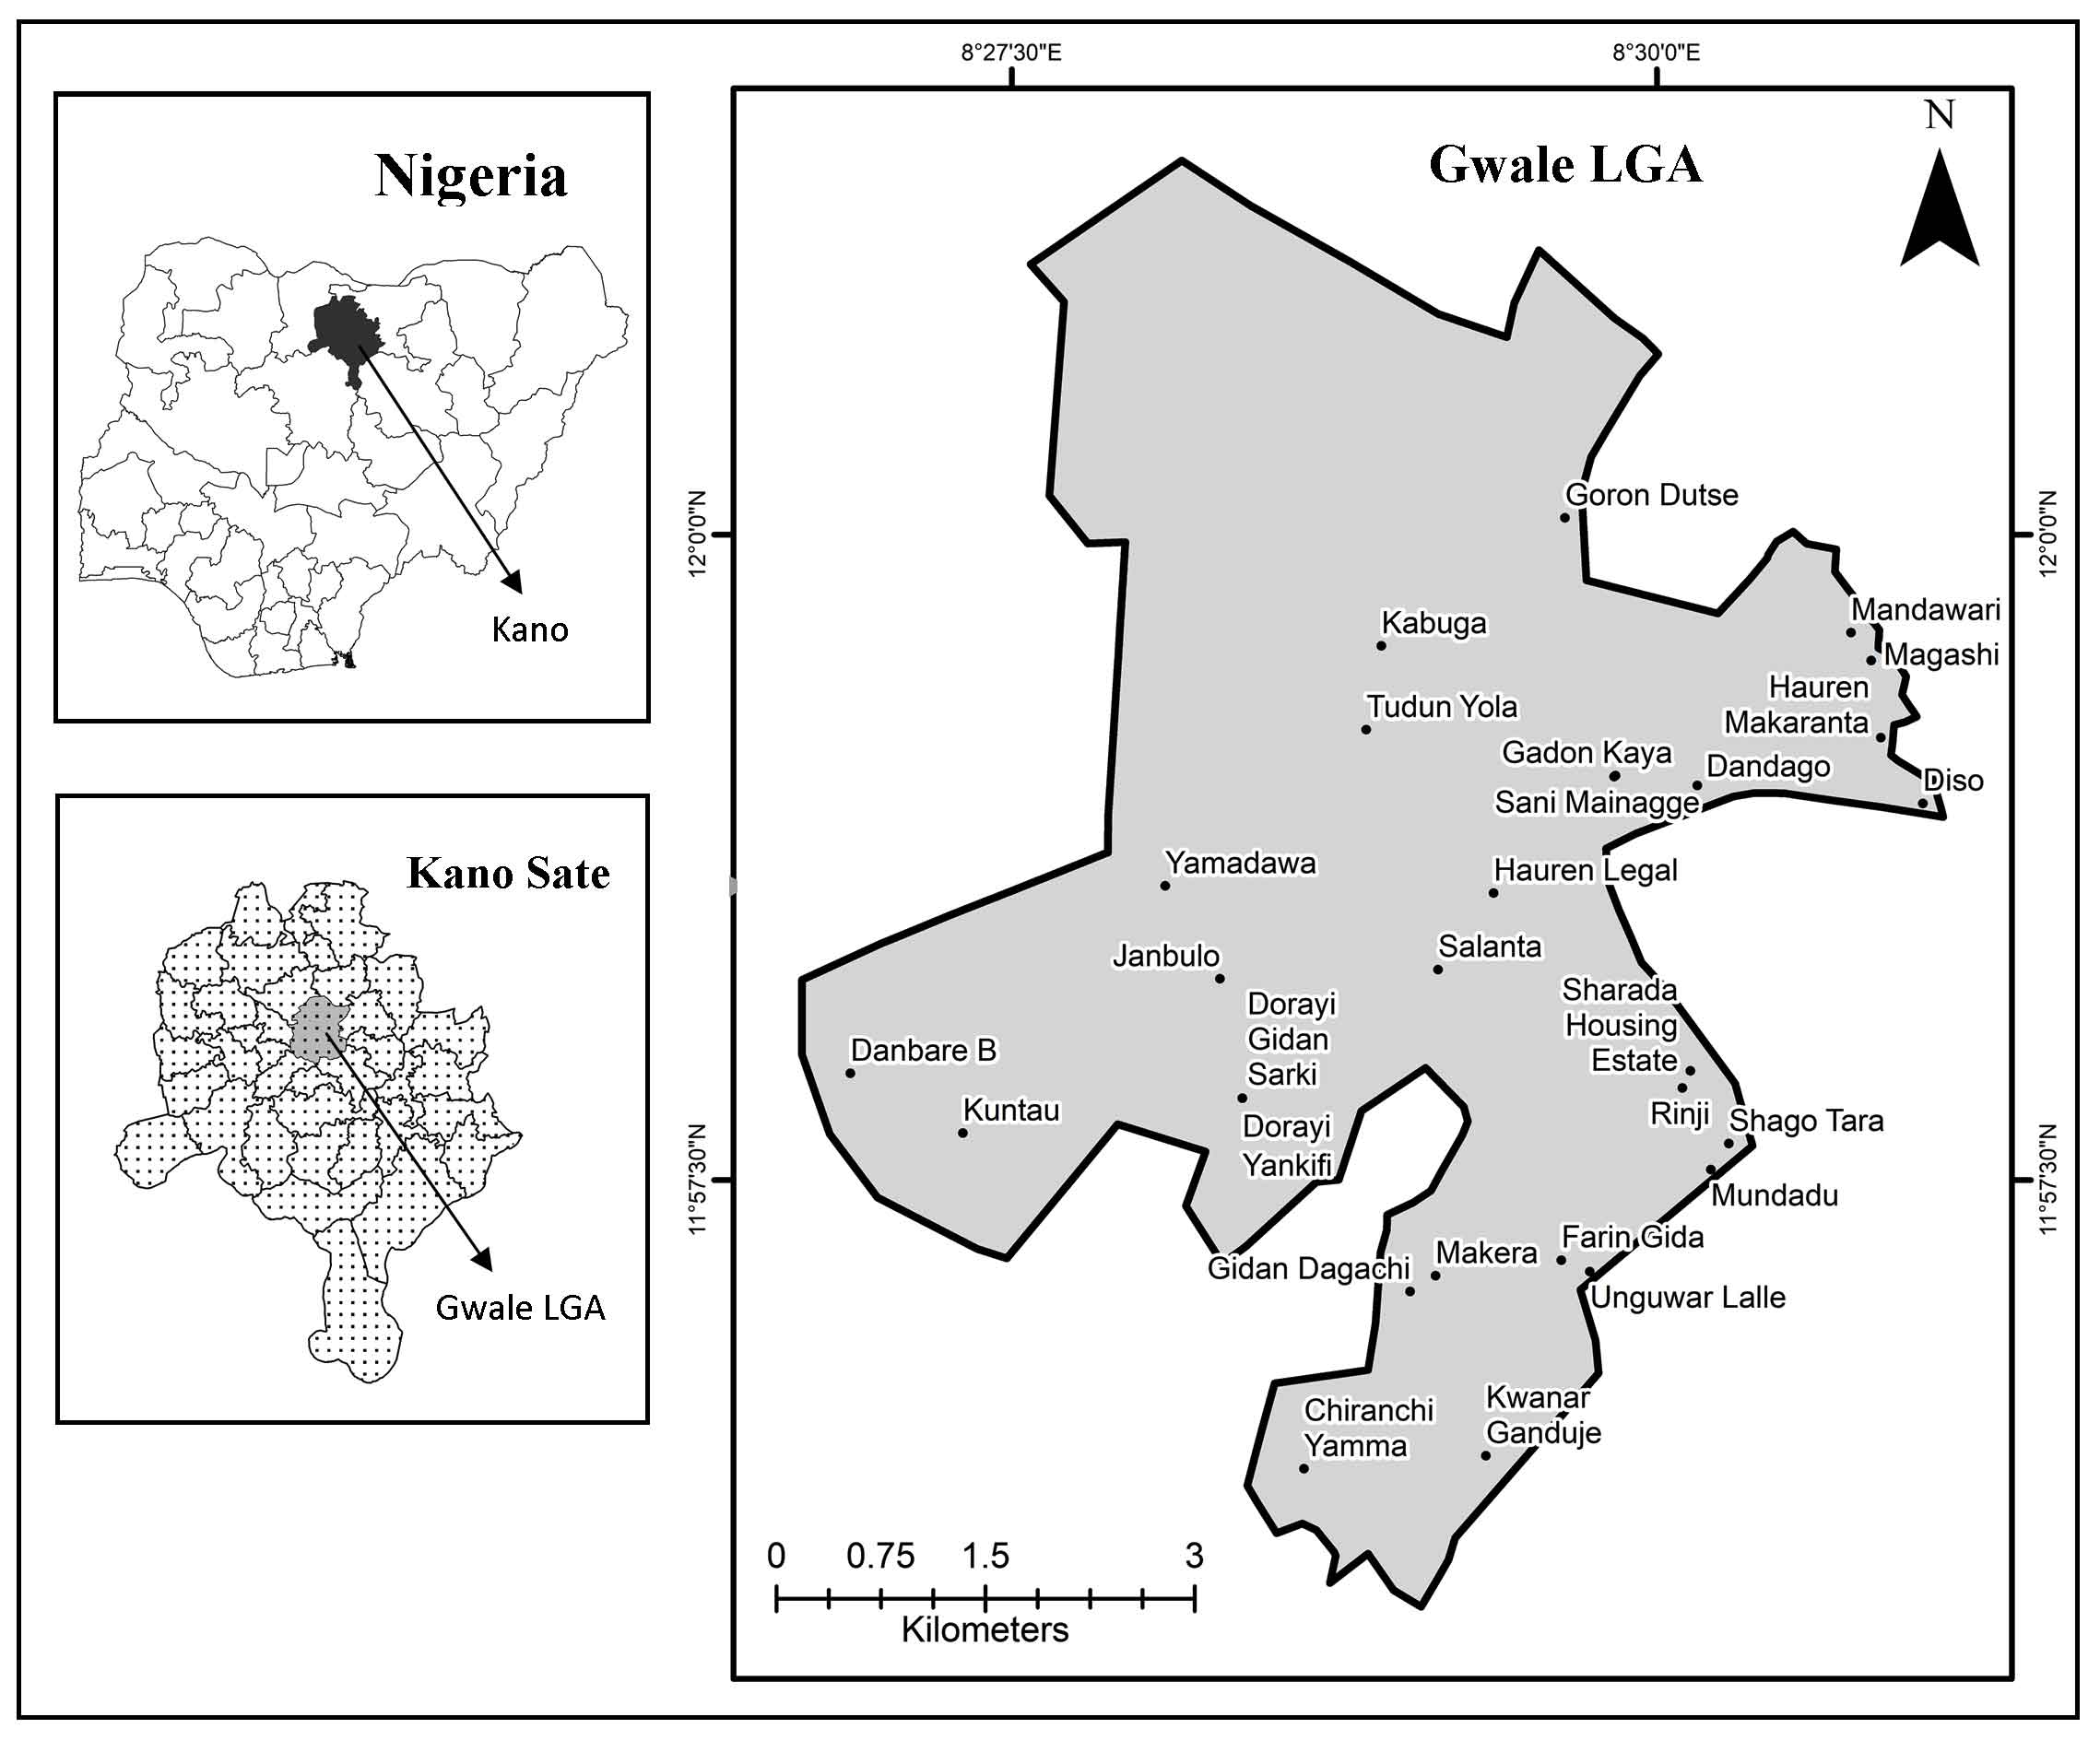
The cluster analysis of 28 sampling stations provided three clusters of similarities based on groundwater contamination, as shown in (Figure 3). Cluster 1 corresponds to 11 sampling locations namely: Shago tara, Ringi, Chiranchi Yamma, Yamadawa, Makera, Gadon kaya, Diso, Tudun yola , Goron dutse, Kabuga and Sani Mainagge. However, two samples, Shago tara and Ringi are situated at an industrial site and the remaining samples are located at the residential site of the study area. Hence, anthropogenic and industrial activities were identified as the main sources of groundwater contamination in cluster 1. Cluster 2 consists of 11 sampling sites: Mundadu, Kwanar Ganduje, Farin gida, Unguwar lalle, Hauren legal, Kuntau, Janbulo, Dorayi yankifi, Danbare B, Dorayi gidan sarki, and Sharada housing estate. Five groundwater samples collected from Mundadu, Kwanar Ganduje, Farin gida, Unguwar lalle, and Sharada housing estate are from the industrial area and the remaining samples are located in residential areas. Therefore, the water contaminations in this cluster were influenced by anthropogenic and industrial activities. The groundwater of industrial locations of cluster 1 and cluster 2 is contaminated due to various categories of wet industries, including leather and tanning, metal, glass, cosmetic industries, among others. Cluster 3 contains 6 groundwater samples such as Gidan dagachi, Salanta, Hauren makaranta, Dandago, Mandawari and Magashi, and contaminated by various anthropogenic processes. This cannot be a surprise that locations of cluster 3 are surrounded by various anthropogenic activities such as municipal waste and effluents being discharged by the residents, discharges of domestic waste dumpsites and improper soak away sites, among others. However, locations in cluster 3 showed the highest contamination levels compared with cluster 2 and cluster 1. Consequently, the locations in cluster 3 were classified as higher contaminated areas, while locations in cluster 2 and cluster 1 were classified as moderate and lower contaminated areas, respectively. Hence, the groundwater of sampling locations of cluster 3 is not suitable for drinking. The contamination levels of EC, TH, TDS, Cl, SO4, Ca and Mg in most sampling locations identified in these clusters are influenced by rainfall, anthropogenic and industrial sources (Wagh et al., 2019; Mukate et al., 2020).


 ,
Auwalu Ibrahim 1
,
Auwalu Ibrahim 1