Article Title :
Spatial Dynamics of Occupational Structure in Eastern Uttar Pradesh: A Multi-Census Location Quotient Analysis (1991-2011) 

10 (2026)
1-13
Uttar Pradesh , Occupational structure , Location Quotient (LQ) , Workforce , Regional Development




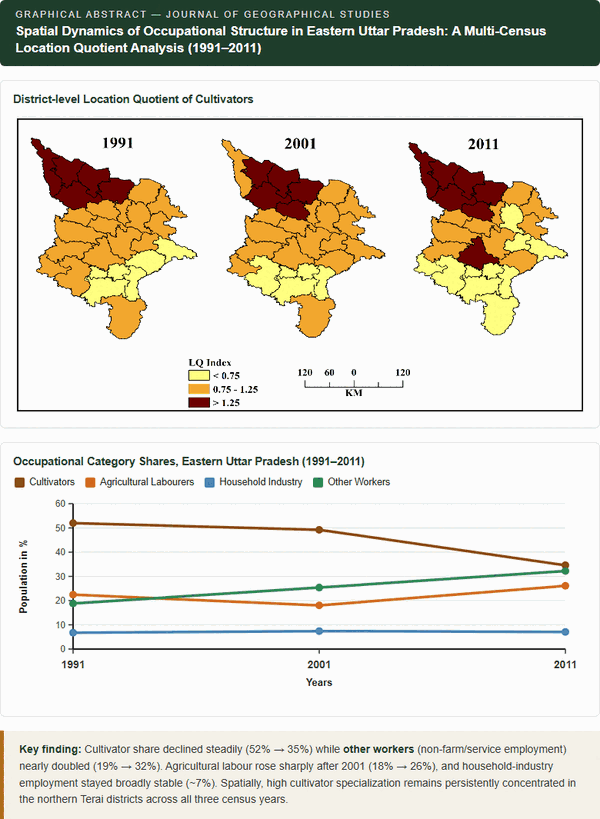
This study analyzes the spatial and temporal dynamics of occupational specialization across districts of Eastern Uttar Pradesh, an area characterized by persistent socio-economic disparities and a predominantly rural workforce. Using district-level data from the 1991, 2001, and 2011 Censuses of India, the research applies the Location Quotient (LQ) method to four major occupational groups—cultivators, agricultural laborers, household industry workers, and other workers—to trace long-term structural shifts. A standardized three-tier classification identifies districts with high, moderate, and low specialization, and GIS-based mapping (ArcGIS 10.2) visualizes spatial patterns and inter-decadal changes. The findings reveal distinct and evolving spatial clusters: an agrarian core with high cultivator concentration, labor-intensive belts dominated by agricultural laborers, traditional artisanal districts marked by strong household industry specialization, and emerging urban-industrial nodes showing diversification into non-farm activities. Several transitional districts display balanced occupational structures, indicating gradual rather than abrupt shifts. An evident east-west gradient emerges, with service-oriented growth near urban centers and persistent agrarian dependence in northern border districts. Overall, the study highlights uneven structural transformation across the region and underscores the need for context-specific policies to enhance agricultural productivity, strengthen rural industries, build skills, and expand urban-linked employment. Multi-period LQ mapping is shown to be a robust tool for assessing regional development trajectories in Eastern Uttar Pradesh.
Applies Location Quotient (LQ) analysis to Census data (1991, 2001, 2011) across 27 districts of Eastern Uttar Pradesh.
Identifies four distinct occupational clusters: agrarian core, labor-intensive belt, artisanal districts, and urban-industrial nodes.
Cultivator share fell from 52.0% to 34.6% (1991–2011) but remained concentrated in the northern Terai districts.
The Varanasi-Bhadohi-Mau-Chandauli belt sustains a resilient household-industry cluster, while the
Reveals a spatially uneven, non-linear structural transformation, calling for context-specific, place-based development policies.
Extends LQ-based specialization methods used in manufacturing and industrial studies (e.g., Tewari, 2022; ISID, 2022) to Census-based occupational categories.