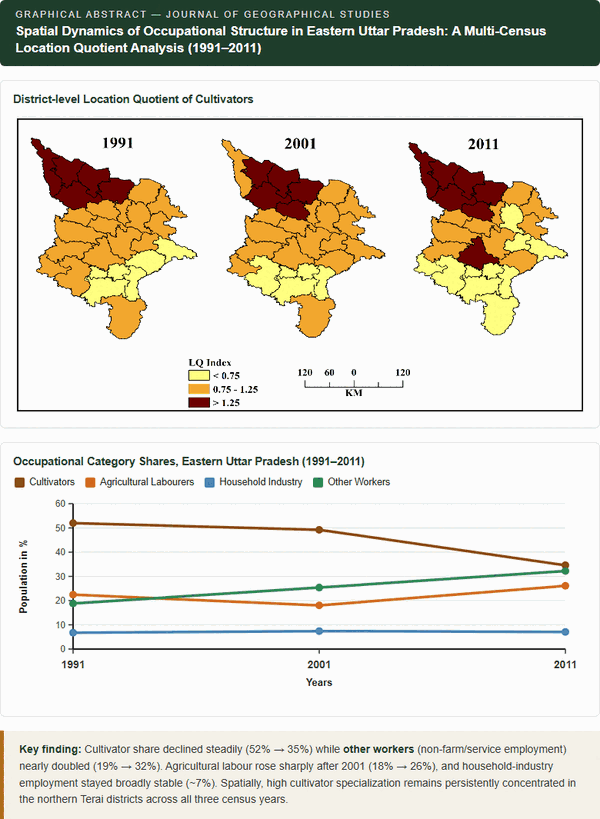
Applies Location Quotient (LQ) analysis to Census data (1991, 2001, 2011) across 27 districts of Eastern Uttar Pradesh.
Identifies four distinct occupational clusters: agrarian core, labor-intensive belt, artisanal districts, and urban-industrial nodes.
Cultivator share fell from 52.0% to 34.6% (1991–2011) but remained concentrated in the northern Terai districts.
The Varanasi-Bhadohi-Mau-Chandauli belt sustains a resilient household-industry cluster, while the
Reveals a spatially uneven, non-linear structural transformation, calling for context-specific, place-based development policies.
Extends LQ-based specialization methods used in manufacturing and industrial studies (e.g., Tewari, 2022; ISID, 2022) to Census-based occupational categories.
Abstract
This study analyzes the spatial and temporal dynamics of occupational specialization across districts of Eastern Uttar Pradesh, an area characterized by persistent socio-economic disparities and a predominantly rural workforce. Using district-level data from the 1991, 2001, and 2011 Censuses of India, the research applies the Location Quotient (LQ) method to four major occupational groups—cultivators, agricultural laborers, household industry workers, and other workers—to trace long-term structural shifts. A standardized three-tier classification identifies districts with high, moderate, and low specialization, and GIS-based mapping (ArcGIS 10.2) visualizes spatial patterns and inter-decadal changes. The findings reveal distinct and evolving spatial clusters: an agrarian core with high cultivator concentration, labor-intensive belts dominated by agricultural laborers, traditional artisanal districts marked by strong household industry specialization, and emerging urban-industrial nodes showing diversification into non-farm activities. Several transitional districts display balanced occupational structures, indicating gradual rather than abrupt shifts. An evident east-west gradient emerges, with service-oriented growth near urban centers and persistent agrarian dependence in northern border districts. Overall, the study highlights uneven structural transformation across the region and underscores the need for context-specific policies to enhance agricultural productivity, strengthen rural industries, build skills, and expand urban-linked employment. Multi-period LQ mapping is shown to be a robust tool for assessing regional development trajectories in Eastern Uttar Pradesh.
Understanding the occupational structure of a region is central to analyzing spatial patterns of development, labor mobility, and economic transformation. Occupational composition reflects the degree to which a regional economy has diversified beyond primary activities into secondary and tertiary sectors; it also signals the historical legacy of land relations, industrial development, and infrastructural access (Clark, 1940; Johnston and Clark, 1982). Regions with a high concentration of cultivators and agricultural laborers tend to demonstrate slower structural transformation, whereas those with higher shares of non-farm workers typically exhibit stronger linkages to markets, urbanization, and technological change (Lewis, 1954). Hence, examining the distribution of workers across occupational categories provides an entry point into assessing spatial inequalities and the uneven pace of development across districts. In the Indian context, occupational structure has long been used to interpret regional disparities, agrarian relations, and the progress of rural transformation. Despite decades of planned development, India continues to exhibit stark contrasts between regions with dynamic non-farm growth and those still embedded in traditional agrarian systems (Bhalla and Singh, 2010). Migration patterns, rural industrialization, and service-sector expansion have reshaped the workforce, yet the pace of structural change remains highly uneven. Studies show that sectors such as household industries and services have grown substantially in several states, even as large segments of the workforce remain tied to low-productivity agriculture (Mehrotra et al., 2014).
This dualistic structure underscores the need for disaggregated, district-level assessments capable of capturing localized variations rather than relying solely on state-level indicators.
Uttar Pradesh, India’s most populous state, exemplifies such uneven development. The state’s economy ranges from densely populated agricultural plains to industrial belts, mining regions, and vibrant urban centers. However, disparities persist in agricultural productivity, non-farm employment, and infrastructural capacity (NITI Aayog, 2021). Research indicates that occupational distribution across Uttar Pradesh reflects deep-rooted socio-economic divides, with western districts generally displaying greater non-farm diversification, while the eastern districts remain more agrarian and labor-intensive (Singh and Rai, 2018). This spatial imbalance has implications for poverty, migration, and livelihood vulnerability.
Within this broader state context, the eastern districts of Uttar Pradesh constitute a distinct socio-economic sub-region shaped by unique historical, demographic, and environmental factors. The area is characterized by high population density, fertile alluvial plains, relatively small landholdings, and a labor-surplus agrarian economy. Household industries such as weaving, carpet-making, and brassware form important non-farm employment sources alongside emerging service-sector activities. Yet the region still exhibits persistent dependence on agriculture and agricultural labor, which contributes to lower income levels and continued out-migration. Although several district-level studies exist on poverty, agriculture, or migration, comprehensive assessments of occupational specialization across multiple census years remain limited. In particular, the application of Location Quotient (LQ) techniques to map spatial patterns of occupational concentration has been rarely undertaken for this region.
Given this gap, the present study analyzes district-level occupational specialization across the 27 districts of Eastern Uttar Pradesh for 1991, 2001, and 2011 using the Location Quotient (LQ) approach to identify long-term spatial patterns and structural shifts in the workforce. The objective is to map and classify how cultivators, agricultural laborers, household industry workers, and other workers are spatially distributed; how this distribution has evolved; and what it reveals about the region’s development trajectories, while examining how historical, socio-economic, and geographic factors shape these spatial variations. By employing a multi-year, district-scale GIS-based analysis, the study provides new insights into the region’s labor structure and contributes to broader debates on regional disparities, spatial economic transformation, and balanced regional development in India.
2 . LITERATURE REVIEW
2.1 Regional Disparities and Development
Regional disparities have long been a central concern in development geography and regional planning in India. Early works by Mishra (2002) emphasized that uneven development arises from variations in resource endowments, infrastructure, institutional capacity, and policy interventions, leading to persistent regional inequalities. Similarly, Das and Barua (1996) and Bhattacharya and Sakthivel (2004) highlighted widening inter-regional disparities in India despite overall economic growth, particularly during the post-reform period. Recent assessments such as the NITI Aayog SDG India Index (NITI Aayog, 2021) further reveal substantial variations in social and economic development indicators across states and districts.
Within Eastern Uttar Pradesh, several studies have documented significant intra-regional disparities despite relatively similar agro-climatic conditions. Kumar et al. (2021) employed a composite development index and identified considerable differences in literacy, infrastructure, workforce participation, and living standards across districts. Their analysis revealed that districts such as Shravasti and Balrampur continue to lag behind more developed centers such as Varanasi and Prayagraj. Likewise, Tanwar et al. (2016) used Principal Component Analysis (PCA) to demonstrate that infrastructural deficiencies and continued dependence on agriculture have contributed to uneven development trajectories across the region. Tiwari and Sharma (2020) further observed that while improvements have occurred in selected socio-economic indicators, structural transformation has remained limited and rural-urban disparities continue to persist. Collectively, these studies provide valuable insights into the developmental landscape of Eastern Uttar Pradesh; however, their emphasis on composite indices and aggregate development measures offers limited understanding of the occupational processes that underpin regional inequality.
2.2 Occupational Structure and Workforce Transformation
Occupational structure is widely regarded as a key indicator of economic development and structural transformation. Classical theories of development suggest that economic progress is accompanied by a gradual shift of labor from primary activities to secondary and tertiary sectors. In the Indian context, however, this transformation has often been uneven and incomplete. Chadha (2003) highlighted the growing importance of the rural non-farm sector in generating employment opportunities and reducing dependence on agriculture. Similarly, Himanshu et al. (2011) demonstrated that diversification into non-farm activities contributed significantly to poverty reduction and livelihood improvement in rural India. Binswanger-Mkhize (2013) argued that India’s structural transformation has been relatively slow, with a large proportion of the workforce remaining dependent on low-productivity agricultural activities. Studies by Abraham (2013) also pointed towards changing labor-force participation patterns and emerging complexities within rural labor markets.
At the regional level, Kumar et al. (2016) documented notable shifts in the occupational structure of Jaunpur district, observing movement away from cultivation towards household industries and non-farm occupations. Similarly, Kumar and Mishra (2022) examined district-level disparities and reported increasing occupational diversification in selected districts of Eastern Uttar Pradesh. More recently, Hashmi et al. (2024) analyzed NSSO and PLFS data and found that rural non-farm employment has become an increasingly important source of livelihood in Uttar Pradesh, reflecting broader processes of labor-market restructuring. Although these studies provide important evidence of occupational change, most are geographically restricted to individual districts or rely on short-term datasets, thereby limiting their ability to capture long-term regional patterns of workforce transformation across Eastern Uttar Pradesh.
2.3 Location Quotient and Spatial Specialization
The Location Quotient (LQ) is one of the most widely used methods in regional science and economic geography for measuring spatial concentration and specialization. Isserman (1977) emphasized its usefulness in identifying sectors that are over- or under-represented in a region relative to a larger reference area. Subsequently, Miller et al. (1991) described LQ as a fundamental analytical tool for regional economic development studies because of its simplicity and effectiveness in identifying specialized activities. More recent contributions by Billings and Johnson (2012) and Tian (2013) have demonstrated the usefulness of LQ in analyzing industrial agglomeration, economic clustering, and regional competitiveness.
In India, the application of LQ has been largely concentrated in studies of manufacturing, industrial concentration, and regional economic development. Tewari (2022) used the technique to examine the spatial distribution of manufacturing activities and identified significant interstate variations in industrial concentration. Similarly, the Institute for Studies in Industrial Development (ISID, 2022) employed district-level Economic Census data to map manufacturing clusters and regional specialization patterns. While these studies confirm the effectiveness of LQ for analyzing spatial economic structures, its application to occupational categories derived from the Population Census remains limited. Internationally, LQ has been widely used to investigate labor-market specialization, industrial clustering, and regional competitiveness, yet relatively few studies have employed the method to examine long-term occupational restructuring in predominantly rural regions. Consequently, the potential of LQ to reveal patterns of workforce specialization and occupational concentration in Eastern Uttar Pradesh remains largely unexplored.
2.4 Research Gap
The existing literature reveals several important gaps. First, studies on Eastern Uttar Pradesh have predominantly focused on socio-economic development and regional disparities using composite indices and aggregate indicators, with limited attention to occupational structure as a driver of regional transformation. Second, research on occupational change has largely been confined to individual districts and lacks a comprehensive regional perspective. Third, although the Location Quotient method has been extensively applied in studies of industrial concentration and regional specialization, its use in analyzing census-based occupational categories remains scarce. Furthermore, no previous study has systematically examined occupational specialization across all 27 districts of Eastern Uttar Pradesh over the Census years 1991, 2001, and 2011 while addressing the issue of newly created districts and changing administrative boundaries. Therefore, the present study seeks to fill this gap by employing the Location Quotient technique to analyze four major occupational categories over a twenty-year period, thereby providing a comprehensive understanding of workforce transformation, spatial specialization, and regional inequality in one of India's most socio-economically diverse regions.
3 . STUDY AREA
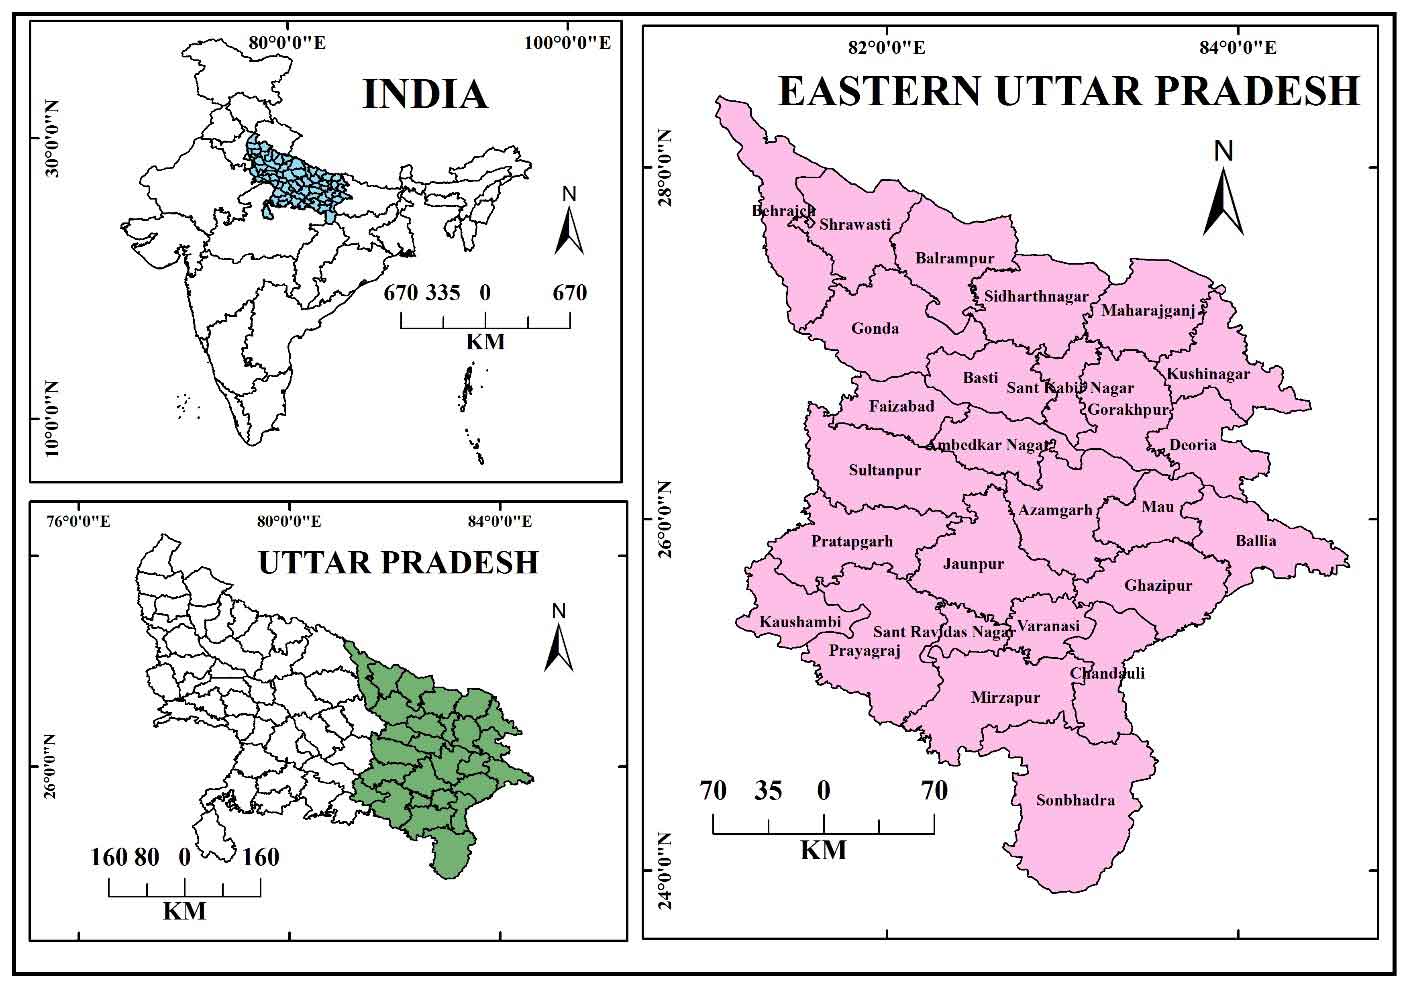
Eastern Uttar Pradesh forms a geographically coherent part of the Middle Gangetic Plain, extending roughly between 24°-27.5° N and 81°-84.5° E and comprising 27 districts ranging from major urban centers like Prayagraj, Varanasi, and Gorakhpur to predominantly rural and agrarian districts such as Shravasti, Balrampur, and Siddharthnagar (Figure 1). The region lies mostly below the 100-metre contour, a physiographic reference extensively highlighted by R.L. Singh in his delineation of Uttar Pradesh and consists of flat alluvial plains shaped by the Ganga, Ghaghara, Gandak, Rapti, and Sarayu rivers, with fertile khadar and bhangar soils and a humid subtropical climate that supports dense rural settlement and intensive agriculture. Demographically, it is one of northern India’s most densely populated areas, characterized by a high rural population share, a youthful age structure, and substantial out-migration. Its occupational structure remains dominated by cultivators and agricultural laborers, with pockets of household industry and emerging non-farm employment around urban nodes. These contrasting but interconnected economic profiles make the region well suited for Location Quotient (LQ) analysis, enabling a clear assessment of inter-district variation, evolving specialization patterns, and the broader trajectory of structural transformation.
Figure 1. Eastern Uttar Pradesh, India
4 . MATERIALS AND METHODS
4.1 Data
The study examines workforce specialization across the 27 districts of Eastern Uttar Pradesh using district-level data from the Population Census of India for 1991, 2001, and 2011. These census years provide a consistent basis for analyzing long-term structural changes in the regional occupational economy. Workforce data were extracted according to the standard Census classification and grouped into four occupational categories: (i) cultivators, (ii) agricultural laborers, (iii) household industry workers, and (iv) other workers. These categories broadly represent the primary, secondary, and tertiary sectors and are widely used to examine occupational transformation and regional economic change. To ensure temporal comparability, occupational categories were harmonized across census years wherever classification differences occurred.
The analysis is restricted to main workers, defined by the Census of India as individuals engaged in an economic activity for at least six months during the reference year. This choice is methodologically justified because main workers reflect relatively stable and long-term employment relationships, whereas marginal workers are often seasonal, intermittent, or distress-driven, particularly in agrarian regions. Previous studies on structural transformation and occupational diversification have similarly emphasized the use of main workers to capture enduring labor-market characteristics and regional specialization patterns (Chadha, 2003; Himanshu et al., 2011; Binswanger-Mkhize, 2013). All occupational categories were therefore expressed as proportions of total main workers at the district and regional levels.
4.2 Location Quotient (LQ) Analysis
Spatial specialization was assessed using the Location Quotient (LQ), a widely employed measure in regional science and economic geography for evaluating the relative concentration of economic activities within a region compared with a larger reference area (Isserman, 1977; Miller et al., 1991).
The methodological framework is anchored in the Location Quotient (LQ) technique, which measures the relative concentration of each occupational category in a district vis-à-vis the regional economy of Eastern Uttar Pradesh. The LQ for each district d in category i is computed as equation (1).
\(Q_{(i,d)}\) = Location Quotient of occupational category i in district d
\(E_{(i,d)}\) = Number of workers in occupational category i in district d
\(E_d\) = Total Main workers in district d
\(E_{(i,p)}\) = Workers in occupational category i in the region
\(E_p\) = Total Main workers in the region
An LQ value greater than 1 indicates occupational specialization, values close to 1 suggest proportional representation, and values below 1 indicate under-representation relative to the regional average. LQ values were computed separately for all occupational categories for 1991, 2001, and 2011.
4.3 Classification of LQ Values
To enhance analytical clarity across the 27 districts and ensure comparability over time, the study adopts a three-fold classification of LQ values: <0.75 (low concentration), 0.75-1.25 (regional parity), and >1.25 (high concentration). This classification follows established interpretations in regional specialization studies, where values within ±25 percent of unity are generally considered to represent average or balanced concentration, while departures beyond this range indicate meaningful under- or over-specialization (Miller et al., 1991; Billings and Johnson, 2012). The adoption of fixed thresholds across all census years ensures methodological consistency and facilitates direct comparison of spatial patterns over time without distortions arising from changing class intervals.
4.4 Treatment of Newly Created Districts
A methodological challenge arises from the creation of eight new districts e. g. Eight new districts created after 1991 include Balrampur (1997, from Gonda), Chandauli (1997, from Varanasi), Kaushambi (1997, from Allahabad/Prayagraj), Kushinagar (1994, from Deoria), Sant Ravidas Nagar/Bhadohi (1994, from Varanasi), Sant Kabir Nagar (1997, from Basti), Shravasti (1997, from Bahraich), and Ambedkar Nagar (1995, from Faizabad/Ayodhya). Government administrative records indicate that each of these districts was carved entirely from a single parent district. To maintain a consistent 27-district framework, the 1991 LQ values for these newly created districts were assigned from their respective parent districts for all occupational categories. For 2001 and 2011, actual district-level census data were used. This approach preserves spatial continuity and enables uniform temporal comparison across the study period.
4.5 Methodological Limitations
The assignment of parent-district LQ values to newly created districts for 1991 assumes that the occupational structure of the parent district adequately represented the area prior to bifurcation. While this approach ensures temporal completeness and avoids missing observations, it may obscure intra-district heterogeneity that existed before district reorganization. Consequently, the 1991 estimates for newly created districts should be interpreted as approximations rather than exact measures of local occupational specialization. Nevertheless, given the absence of officially published pre-formation district statistics, this remains the most practical and widely accepted approach for conducting longitudinal district-level analysis.
5 . RESULTS
5.1 Temporal trends of Occupational Categories of Main Workers
The spatial temporal analysis of occupational specialization across the twenty-seven districts of eastern Uttar Pradesh reveals clear regional patterns and substantial shifts over the three census decades 1991, 2001 and 2011. The temporal changes in the distribution of the four major occupational categories are summarized in Table 1. The Location Quotient (LQ) values for the four major occupational categories cultivators (CL), agricultural laborers (AL), household industry workers (HHI) and other workers (OTH) were mapped using ArcGIS 10.2, following the three-fold classification scheme (LQ > 1.25 indicate high specialization, 0.75-1.25 indicate moderate LQ while < 0.75 indicate low specialization). All datasets underwent cleaning and harmonization in MS Excel, including reconstruction of 1991 values for newly carved districts using parent-district substitution to maintain temporal comparability.
The aggregate occupational distribution for the region shows a major decline in cultivators from 52% (1991) to 34.59% (2011) accompanied by a rise in other workers (from 18.81% to 32.21%) and moderate changes in agricultural laborers and household industries. However, beneath this aggregated picture lie sharp inter-district contrasts and diverging trends, revealed through Location Quotient (LQ) based spatial mapping.
Table 1. Occupational Categories of Main Workers
Years
Cultivators
Agricultural Laborers
Household Industry workers
Other workers
1991
52.00
22.45
6.74
18.81
2001
49.23
18.00
7.41
25.36
2011
34.59
26.11
7.09
32.21
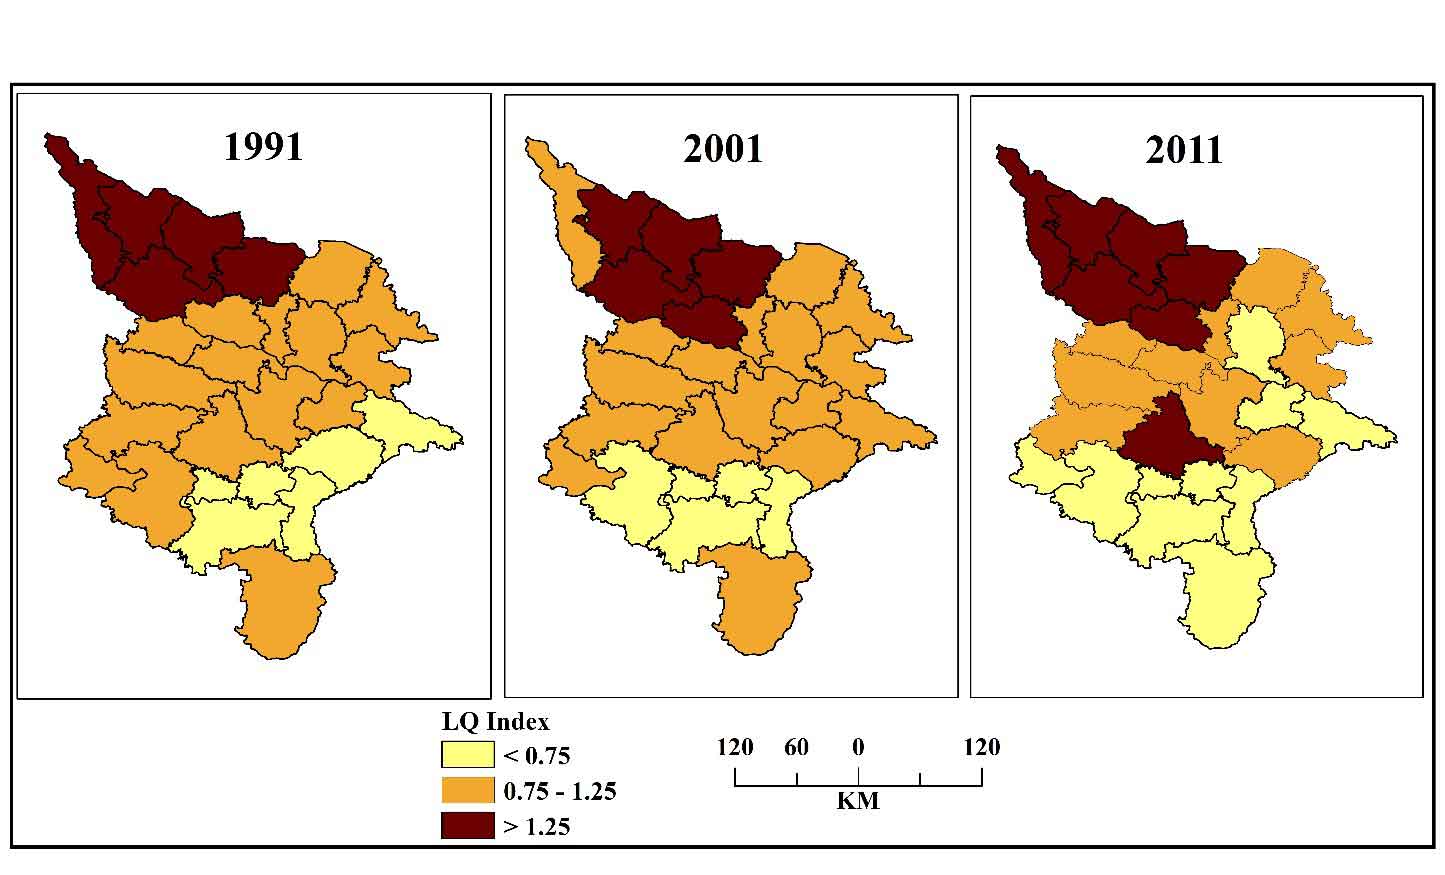
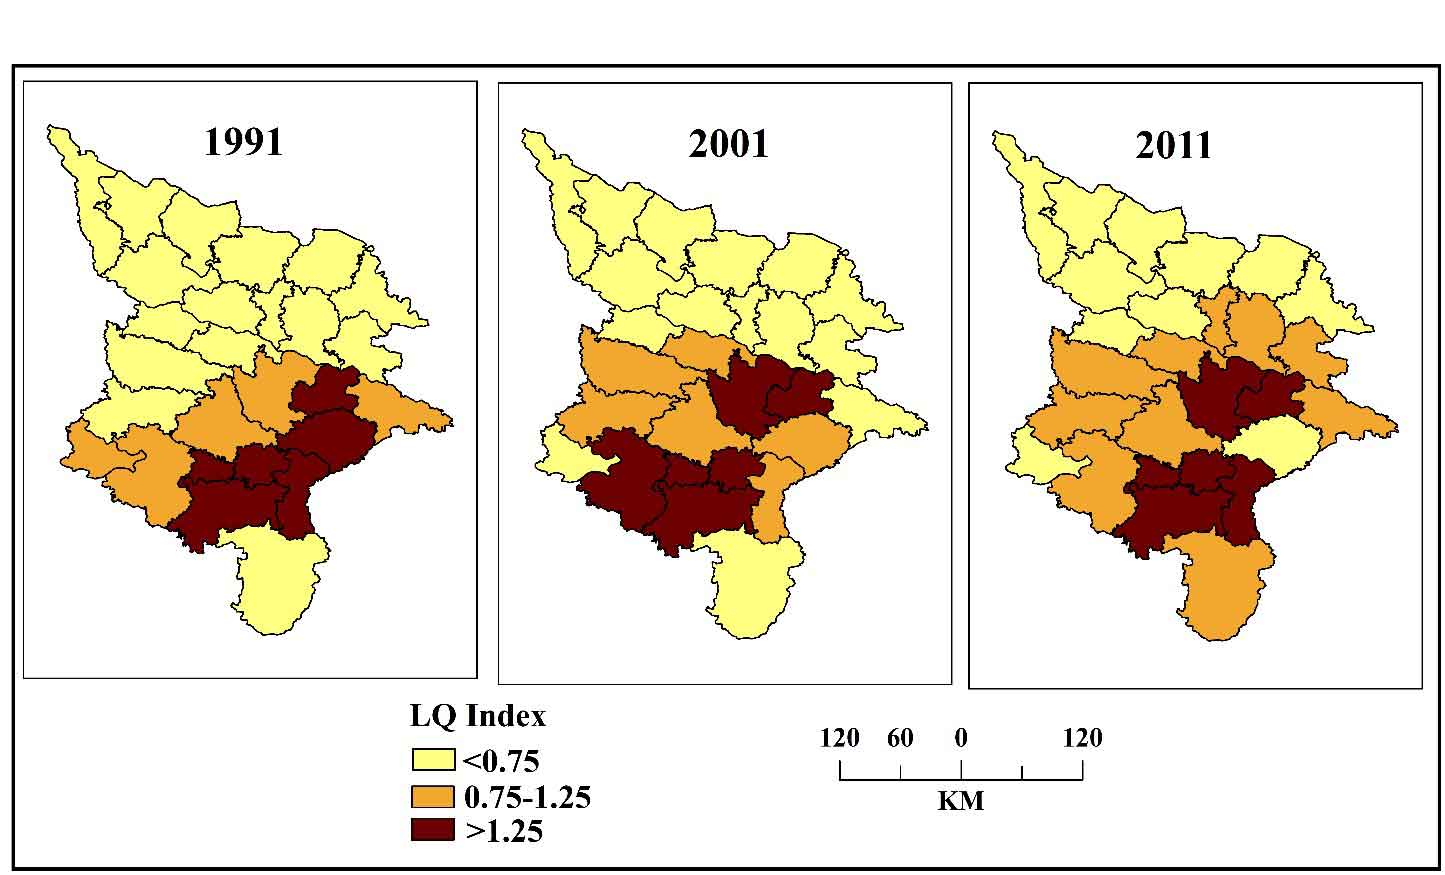
Figure 2. Location Quotient of cultivators
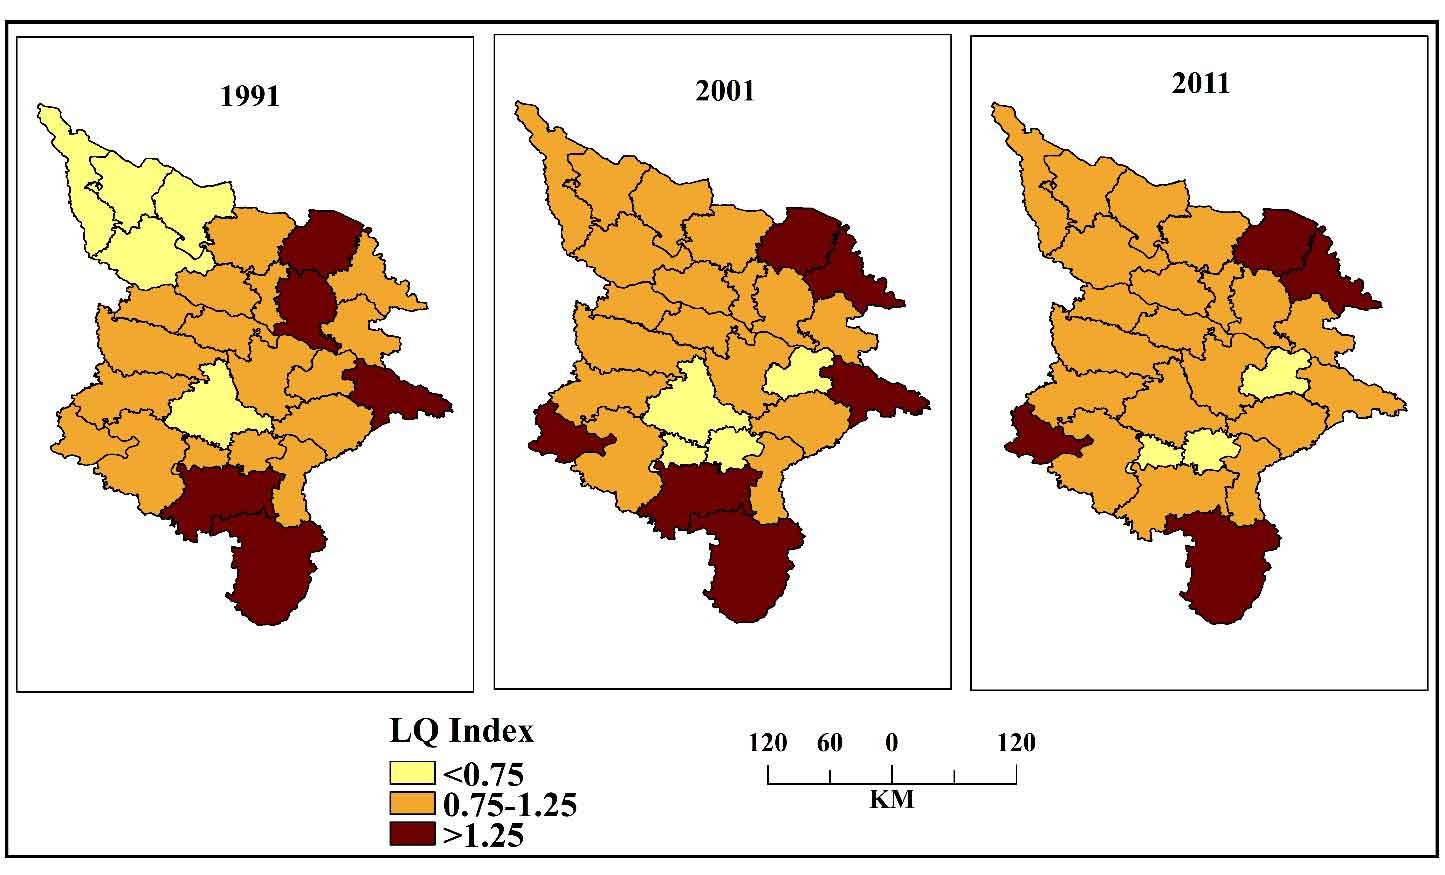
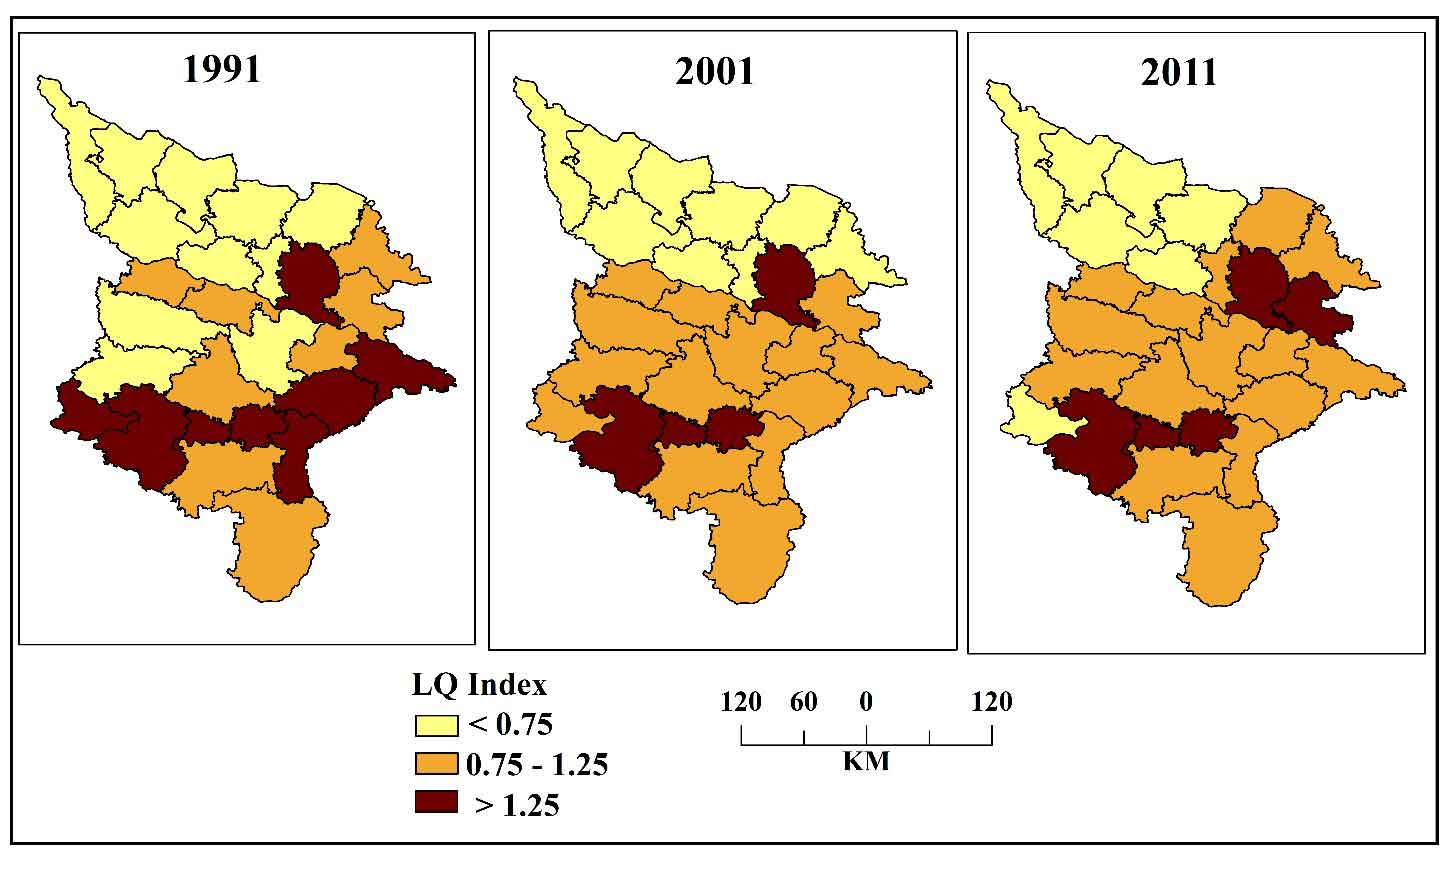
Figure 3. Location Quotient of agricultural laborers
Figure 4. Location Quotient of household industry workers
5.2 Spatial Patterns of Occupational Structure (1991-2011)
The spatial distribution of occupational categories across eastern Uttar Pradesh reveals marked inter-district variation and distinct temporal transitions over the three census decades. The percentage share of main workers presented in Table 2 provides the baseline for understanding these shifts, showing how districts differ in the relative importance of cultivators, agricultural laborers, household industry workers, and other workers. To examine the degree of specialization and regional divergence more rigorously, the study employs Location Quotient (LQ) values presented in Table 3, which form the analytical foundation for the spatial comparisons that follow. Together, these datasets highlight broader socio-economic processes such as land fragmentation, rural industrial activities, migration patterns, and gradual expansion of non-farm employment that have shaped the occupational landscape. The subsequent subsections analyze each occupational category individually to identify persistent clusters, emerging transitions, and the evolving trajectory of structural change in the region.
5.2.1 Cultivators
Across all three census years, the northern Terai border districts Balrampur, Bahraich, Gonda, Shrawasti and Siddharthnagar consistently exhibit high LQ values (> 1.25), identifying them as persistent agrarian strongholds. Their spatial clustering is clearly visible in Figure 2, where they form a contiguous group of high specialization along the Indo-Nepal border. These districts share several structural features like fertile alluvial soils, high water availability, extensive rural settlement patterns, minimal industrial presence, and low levels of urbanization. These characteristics maintain conditions favorable for a high share of cultivators.
Districts such as Ambedkar Nagar, Azamgarh, Faizabad, Jaunpur, Pratapgarh, Kushinagar, Mahrajganj and Sultanpur fall consistently within the moderate LQ range (0.75-1.25). They show a balanced occupational structure combining cultivation, agricultural wage labor and increasing non-farm activities. Spatially, these districts form a central corridor, stretching from west to east, representing a transitional zone between the northern agrarian belt and the southern diversified districts.
The low-specialization group (LQ < 0.75), consisting of Allahabad, Varanasi, Mirzapur, Sonbhadra, Bhadohi, Mau, Chandauli and Gorakhpur, represents districts where the cultivator share is significantly below the regional average. Urbanization, service-sector expansion, mining specially in Mirzapur, Sonbhadra and industrial activities in these districts contribute to reduced dependence on agriculture. The spatial pattern of low-LQ districts is concentrated in the southern and south-eastern arc, highlighting the shifting occupational base toward non-farm employment.
The temporal pattern demonstrates a marked divergence, wherein the northern districts consistently retain and, in several cases, intensify their specialization in cultivation. For example, Shrawasti exhibits a steady rise in its Location Quotient (LQ), increasing from 1.39 in 1991 to 1.50 in 2001 and further to 1.57 in 2011. In contrast, the predominantly urban and industrial districts continue to experience a pronounced decline in their proportion of cultivators.
5.2.2 Agricultural Laborers
Agricultural laborers exhibit a more varied and shifting pattern than cultivators. In 1991, Ballia, Kaushambi, Sonbhadra and Mirzapur already showed high specialization, and by 2011 districts like Mahrajganj, Kushinagar and Shrawasti also entered the high-LQ category. These districts share structural characteristics such as low landholding size, high rural poverty, and significant dependence on wage labor for agricultural work.
The Location Quotient maps (Figure 3) show that high LQ values for agricultural laborers do not cluster in strictly contiguous zones as cultivators. Instead, they appear in scattered pockets, especially in the east and south. This patchiness reflects localized agrarian conditions, including land inequality, tenancy, and labor intensity in specific crop regimes.
Nearly two-thirds of the districts in the region show moderate LQ. Districts such as Ambedkar Nagar, Azamgarh, Deoria, Basti, Faizabad, Gonda, Pratapgarh and Sant Kabir Nagar reflect mixed agrarian structures, where neither cultivators nor wage laborers dominate. This middle category remains relatively stable across all three decades.
Districts with low LQ values (< 0.75) in 1991 such as Bahraich, Balrampur, Siddharthnagar, Gonda and Basti transitioned into the moderate category by 2011, reflecting a gradual increase in agricultural labor engagement over time. In contrast, districts like Varanasi, Jaunpur, Mau and Sant Ravidas Nagar (Bhadohi) continued to exhibit low levels of agricultural worker specialization. These districts either maintain more cultivator-oriented agrarian systems, particularly in the northern zone, or possess increasingly diversified non-farm economies in the southern belt, both of which reduce dependence on agricultural wage labor. Spatially, the low-LQ districts remain concentrated in the northwestern and the more urbanized parts of the region, underscoring the influence of urban growth and structural transformation on labor patterns.
Temporal comparison shows that agricultural labor specialization increases notably in the eastern belt (Ballia-Mau-Ghazipur-Kushinagar) between 2001 and 2011, suggesting rising landlessness and unstable agrarian employment patterns, consistent with regional demographic pressures.
Table 2. Main Workers (%) by Occupational
DISTRICT
Cultivators
Agricultural Laborers
Household Industries
Other Services
1991
2001
2011
1991
2001
2011
1991
2001
2011
1991
2001
2011
Allahabad
42.86
35.92
26.25
25.65
15.14
19.73
6.69
9.85
8.74
24.81
39.09
45.28
Ambedkar Nagar
57.12
50.98
36.26
22.60
18.65
26.24
4.56
6.79
7.97
15.72
23.59
29.53
Azamgarh
59.82
53.00
39.56
19.93
14.65
20.74
6.36
9.94
9.09
13.90
22.41
30.61
Bahraich
72.44
60.56
48.45
15.35
21.33
30.84
1.75
2.19
2.66
10.46
15.91
18.06
Ballia
32.75
40.31
27.02
35.41
26.68
30.65
7.06
5.38
6.82
24.78
27.62
35.51
Balrampur
70.82
63.47
47.95
16.68
22.17
32.03
1.90
2.20
3.40
10.60
12.16
16.62
Basti
62.63
63.52
49.25
20.53
15.54
22.20
4.28
3.54
4.51
12.55
17.40
24.05
Chandauli
33.15
36.77
26.93
18.99
22.49
25.75
17.21
9.22
9.35
30.64
31.52
37.97
Deoria
58.25
49.85
33.15
24.38
15.77
20.36
2.70
4.32
5.72
14.67
30.06
40.77
Faizabad
57.12
55.19
38.69
22.60
16.50
22.54
4.56
3.74
4.94
15.72
24.57
33.84
Ghazipur
33.15
50.92
35.86
18.99
17.72
30.01
17.21
6.09
5.03
30.64
25.27
29.10
Gonda
70.82
68.70
47.80
16.68
14.03
28.07
1.90
2.38
4.89
10.60
14.90
19.25
Gorakhpur
41.11
37.14
23.46
30.51
18.40
23.47
4.26
4.14
5.91
24.12
40.31
47.17
Jaunpur
61.71
55.59
43.15
14.46
11.87
23.70
5.23
8.04
5.81
18.60
24.51
27.34
Kaushambi
42.86
44.89
27.02
25.65
30.53
46.17
6.69
5.32
4.18
24.81
19.26
22.64
Kushinagar
58.25
49.85
33.65
24.38
28.53
35.19
2.70
4.08
4.93
14.67
17.54
26.23
Mahrajganj
60.16
54.80
34.61
28.94
24.96
36.35
1.81
3.33
4.35
9.09
16.91
24.69
Mau
47.33
39.54
25.52
20.38
13.04
18.13
15.32
20.83
22.04
16.97
26.59
34.31
Mirzapur
35.69
35.23
26.47
30.96
23.02
29.84
10.12
12.66
9.56
23.23
29.10
34.13
Pratapgarh
61.14
57.01
37.41
21.65
16.17
24.65
3.60
5.85
6.30
13.61
20.96
31.64
Sant Kabir Nagar
62.63
56.36
39.11
20.53
20.83
28.81
4.28
4.05
5.77
12.55
18.75
26.31
Sant Ravidas Nagar
33.15
28.26
23.42
18.99
6.96
14.12
17.21
26.74
13.46
30.64
38.04
49.00
Shrawasti
72.44
73.63
54.14
15.35
14.94
29.96
1.75
2.10
3.84
10.46
9.33
12.07
Siddharthnagar
70.42
63.54
46.27
20.09
21.21
30.69
2.01
2.43
3.96
7.47
12.82
19.09
Sonbhadra
47.76
41.61
25.57
29.14
25.44
38.30
1.83
4.65
5.76
21.27
28.30
30.36
Sultanpur
57.69
51.20
36.08
25.90
19.59
28.68
3.18
6.85
6.79
13.23
22.36
28.45
Varanasi
33.15
21.02
16.49
18.99
6.05
12.04
17.21
23.37
14.25
30.64
49.56
57.21
5.2.3 Workers in Household Industries
Household industry workers display the most clearly defined spatial cluster among all occupation groups. The districts of Varanasi, Bhadohi (Sant Ravidas Nagar), Chandauli, Mau and Ghazipur Mirzapur consistently show high LQ values (> 1.25) across all three census years, with some values reaching exceptionally high levels (LQ 2.7-3.6). This cluster corresponds to the well-known textile, handloom, carpet-weaving and artisanal belts of eastern Uttar Pradesh.
The household industry cluster forms a compact zone in the southeastern region, centered on Varanasi-Bhadohi-Mau belt. These districts hold deep artisanal traditions, specialized skill bases, and strong market networks. These are the factors that maintain long-term occupational specialization of this belt.
Districts like Faizabad, Jaunpur, Basti, Pratapgarh, Sant Kabir Nagar and Sultanpur represent moderate LQ, revealing that these districts have small-scale rural household industries that supplement agriculture but do not dominate the workforce.
Lower Specialization (<0.75) appear most strongly in the northern agrarian belt such as Gonda, Balrampur, Bahraich, Siddharthnagar where agriculture remains the primary source of employment, and industrial craft activities are limited (Figure 4). Spatially, these districts form an inverted mirror image of the artisanal southeast, reinforcing the region’s dual economic structure.
Temporal analysis shows relative stability in the household industry cluster, with minor expansions in some districts as Mau and Bhadohi deepening specialization. The persistence of this artisanal zone indicates its resilience despite wider structural changes in the region.
5.2.4 Other Workers
The other workers category which includes services, trade, transport, administration and miscellaneous non-farm activities (NIC activities, Census of India) shows the fastest growth across the region. In 1991 eight districts exhibited high LQ values. By 2011, the service-based specialization had expanded, along with urbanized belts showing pronounced diversification.
Table 3. Location Quotient Values of Occupational Categories Across Districts of Eastern Uttar Pradesh (1991-2011)
DISTRICT
Cultivators
Agricultural Laborers
Household Industries
Other Services
1991
2001
2011
1991
2001
2011
1991
2001
2011
1991
2001
2011
Allahabad
0.82
0.73
0.76
1.14
0.84
0.76
0.99
1.33
1.23
1.32
1.54
1.41
Ambedkar Nagar
1.10
1.04
1.05
1.01
1.04
1.01
0.68
0.92
1.12
0.84
0.93
0.92
Azamgarh
1.15
1.08
1.14
0.89
0.81
0.79
0.94
1.34
1.28
0.74
0.88
0.95
Bahraich
1.39
1.23
1.40
0.68
1.19
1.18
0.26
0.30
0.37
0.56
0.63
0.56
Ballia
0.63
0.82
0.78
1.58
1.48
1.17
1.05
0.73
0.96
1.32
1.09
1.10
Balrampur
1.36
1.29
1.39
0.74
1.23
1.23
0.28
0.30
0.48
0.56
0.48
0.52
Basti
1.20
1.29
1.42
0.91
0.86
0.85
0.64
0.48
0.64
0.67
0.69
0.75
Chandauli
0.64
0.75
0.78
0.85
1.25
0.99
2.55
1.24
1.32
1.63
1.24
1.18
Deoria
1.12
1.01
0.96
1.09
0.88
0.78
0.40
0.58
0.81
0.78
1.19
1.27
Faizabad
1.10
1.12
1.12
1.01
0.92
0.86
0.68
0.50
0.70
0.84
0.97
1.05
Ghazipur
0.64
1.03
1.04
0.85
0.98
1.15
2.55
0.82
0.71
1.63
1.00
0.90
Gonda
1.36
1.40
1.38
0.74
0.78
1.07
0.28
0.32
0.69
0.56
0.59
0.60
Gorakhpur
0.79
0.75
0.68
1.36
1.02
0.90
0.63
0.56
0.83
1.28
1.59
1.46
Jaunpur
1.19
1.13
1.25
0.64
0.66
0.91
0.78
1.08
0.82
0.99
0.97
0.85
Kaushambi
0.82
0.91
0.78
1.14
1.70
1.77
0.99
0.72
0.59
1.32
0.76
0.70
Kushinagar
1.12
1.01
0.97
1.09
1.59
1.35
0.40
0.55
0.70
0.78
0.69
0.81
Mahrajganj
1.16
1.11
1.00
1.29
1.39
1.39
0.27
0.45
0.61
0.48
0.67
0.77
Mau
0.91
0.80
0.74
0.91
0.72
0.69
2.27
2.81
3.11
0.90
1.05
1.07
Mirzapur
0.69
0.72
0.77
1.38
1.28
1.14
1.50
1.71
1.35
1.24
1.15
1.06
Pratapgarh
1.18
1.16
1.08
0.96
0.90
0.94
0.53
0.79
0.89
0.72
0.83
0.98
Sant Kabir Nagar
1.20
1.14
1.13
0.91
1.16
1.10
0.64
0.55
0.81
0.67
0.74
0.82
Sant Ravidas Nagar
0.64
0.57
0.68
0.85
0.39
0.54
2.55
3.61
1.90
1.63
1.50
1.52
Shrawasti
1.39
1.50
1.57
0.68
0.83
1.15
0.26
0.28
0.54
0.56
0.37
0.37
Siddharthnagar
1.35
1.29
1.34
0.89
1.18
1.18
0.30
0.33
0.56
0.40
0.51
0.59
Sonbhadra
0.92
0.85
0.74
1.30
1.41
1.47
0.27
0.63
0.81
1.13
1.12
0.94
Sultanpur
1.11
1.04
1.04
1.15
1.09
1.10
0.47
0.92
0.96
0.70
0.88
0.88
Varanasi
0.64
0.43
0.48
0.85
0.34
0.46
2.55
3.15
2.01
1.63
1.95
1.78
The spatial distribution (Figure 5) highlights a clear urban corridor stretching from Allahabad to Varanasi, representing a region increasingly dependent on administrative, educational and trade-related employment.
Moderate-LQ districts are widely spread and show a gradual upward shift over time, reflecting the slow but steady penetration of services into rural areas. Low-LQ districts continue to cluster in the northern agrarian belt, where agricultural specialization suppresses other sectors.
Temporal trajectories show that between 1991 and 2011, the share of other workers increased from 18.81% to 32.21%, showing significant occupational diversification. The spatial maps reinforce this shift, with many districts transitioning from low or moderate specialization to moderate or high specialization by 2011.
The spatial structure of occupational specialization across the districts of eastern Uttar Pradesh reveals a clear clustering rooted in historical agrarian systems, landholding patterns, and traditional craft artisans. Districts such as Gonda, Balrampur, Bahraich, Shrawasti, and Siddharthnagar exhibit persistently high LQ values for cultivators and comparatively low values in services and non-farm sectors. This pattern reflects a legacy of subsistence agriculture, medium-low urbanization levels, and slower diversification, all characteristic of the mid-Gangetic plains (Singh R.L, 1971). In contrast, Ballia, Kaushambi, Kushinagar, and Maharajganj show high specialization in agricultural laborers, a pattern linked to historical land fragmentation, tenancy, and high rural poverty leading to wage-based dependence (Rao and Mitra, 2018). Districts including Varanasi, Bhadohi, Mau, Chandauli, and Ghazipur form a distinct artisanal-industrial belt where strong specialization in household industries corresponds to long-standing weaving, carpet-making, and craft traditions supported by caste-based artisanal systems and globalized value chains (Mehrotra, 2020).
Meanwhile, Varanasi, Mirzapur, Prayagraj (Allahabad), and Sonbhadra represent urban and industrial growth centers, marked by high LQ in services, mining, energy, and manufacturing, driven by transport accessibility and public-private industrial investments (Census of India, 2011). A final set of districts—Azamgarh, Faizabad, Ambedkar Nagar, Jaunpur, and Sultanpur—fall into an intermediate category where moderate LQ values across occupations reflect mixed agrarian and non-farm economies under gradual transition. Together, these clusters illustrate a mosaic of labor specialization shaped by region specific socio-economic histories, urban hierarchies, and resource bases, providing evidence of differentiated structural change within the broader rural workforce (Rao and Mitra, 2018; Mehrotra, 2020). This spatial diversity highlights the importance of district-level LQ analysis in tracing how agricultural dependence, non-farm expansion, and industrial growth converge to produce uneven pathways of workforce transformation across the region.
Figure 5. Location Quotient of other workers
6 . DISCUSSIONS
The occupational restructuring observed across Eastern Uttar Pradesh reflects broader processes of structural transformation occurring in India, but with significant regional divergence. At the aggregate level, the decline in cultivators from 52.0 percent in 1991 to 34.6 percent in 2011 mirrors the national trend, where the share of cultivators in the workforce declined substantially alongside the expansion of non-farm employment (Census of India, 2011; Himanshu et al., 2011). However, the LQ analysis demonstrates that this transition has been spatially uneven. While urban and economically diversified districts increasingly shifted towards non-farm occupations, the northern Terai districts retained strong specialization in cultivation, indicating the persistence of an agrarian economy despite broader structural change.
The continued concentration of cultivators in districts such as Bahraich, Balrampur, Shravasti, Gonda and Siddharthnagar suggests that favorable agro-ecological conditions, including fertile alluvial soils and irrigation availability, continue to support cultivation as the dominant livelihood strategy. Unlike many parts of western and southern India, where agricultural employment has declined rapidly due to industrialization and urbanization, these districts exhibit characteristics of a delayed structural transition. Similar observations have been reported for the eastern Indo-Gangetic Plain, where demographic pressure and limited industrial development have slowed labor reallocation from agriculture to secondary and tertiary sectors (Binswanger-Mkhize, 2013; Rao and Mitra, 2018).
In contrast, the growing specialization of agricultural laborers in districts such as Ballia, Kaushambi, Kushinagar and Maharajganj points to a different dimension of agrarian transformation. Rather than indicating agricultural prosperity, high agricultural-labor LQ values often reflect increasing land fragmentation, declining farm viability, and rising dependence on wage labor. This pattern is consistent with national evidence showing that the proportion of agricultural laborers has increased even as the share of cultivators declined, reflecting a process of proletarianization within the rural economy (Himanshu et al., 2011). The concentration of agricultural labor in eastern districts therefore suggests that workforce transition is occurring under conditions of agrarian stress rather than through successful industrial absorption.
The persistence of the Varanasi-Bhadohi-Mau-Chandauli household industry cluster highlights another distinctive pathway of regional transformation. While household industries account for a relatively small share of employment nationally, these districts continue to exhibit exceptionally high specialization because of long-established handloom, carpet-weaving and artisanal production systems. The durability of this cluster indicates that traditional industries remain embedded within local labor markets through inherited skills, caste-based occupational networks, and integration into national and global value chains (Mehrotra, 2020). Rather than disappearing during modernization, these activities have adapted and coexisted with expanding service-sector employment, demonstrating that structural transformation in Eastern Uttar Pradesh is not simply a shift from agriculture to modern industry but also involves the persistence of traditional production systems.
The most significant transformation is evident in the rapid growth of the “other workers” category. Between 1991 and 2011, its share increased from 18.8 percent to 32.2 percent, closely reflecting the service-led growth trajectory observed at both the Uttar Pradesh and national levels. Districts such as Prayagraj, Varanasi, Mirzapur and Sonbhadra emerged as important centers of non-farm employment due to their administrative functions, educational institutions, transport connectivity, mining activities and expanding commercial sectors. This pattern supports the argument that urban centers act as regional growth poles, generating employment opportunities that gradually diffuse into surrounding rural areas (Myrdal, 1957; Mitchell, 2004).
Taken together, the findings reveal that Eastern Uttar Pradesh is characterized by multiple and simultaneous pathways of structural change. The northern Terai belt remains predominantly cultivation-oriented, the eastern districts exhibit growing dependence on agricultural wage labor, the south-eastern corridor sustains a resilient artisanal economy, and urban-industrial centers increasingly specialize in services and diversified non-farm employment. These contrasting trajectories indicate that workforce transformation in the region is neither linear nor uniform. Instead, it reflects the interaction of agro-ecological conditions, historical occupational systems, urbanization processes, and unequal access to economic opportunities.
The findings therefore reinforce broader arguments in regional development literature that structural transformation is inherently spatially uneven. While aggregate statistics suggest a gradual shift away from agriculture, district-level analysis reveals substantial differences in the pace and nature of occupational change. Such disparities imply that a uniform development strategy is unlikely to be effective. Agrarian districts require diversification through agro-processing, irrigation modernization and rural non-farm employment generation, whereas urbanizing districts require investments in infrastructure, skills development and service-sector expansion to sustain emerging growth trajectories.
7 . LIMITATIONS
The study’s methodological approach using harmonized district-level data, reconstructed values for newly carved districts (1991), and standardized LQ classification ensures temporal comparability. LQ captures relative specialization, not absolute employment levels. District-level averages may obscure intra-district variation. Finally, missing variables such as migration flows, household income or caste-landholding linkages restrict causal interpretation. Nevertheless, the results clearly demonstrate that occupational structures in the region have undergone significant spatial reorganization. The combination of agrarian persistence, artisanal clustering and service-sector expansion has produced a diversified yet uneven economic landscape. Understanding these patterns is essential for future development planning aimed at balanced regional growth.
8 . CONCLUSION
This study analyzed the spatial and temporal patterns of occupational specialization across the 27 districts of Eastern Uttar Pradesh using Location Quotient (LQ) analysis based on Census data for 1991, 2001, and 2011. By examining four major occupational categories—cultivators, agricultural laborers, household industry workers, and other workers—the study provides a district-level perspective on workforce transformation in a predominantly agrarian region. The findings reveal that occupational change in Eastern Uttar Pradesh has been gradual but spatially uneven. Although the share of cultivators declined substantially during the study period, cultivation remained highly concentrated in the northern Terai districts, indicating the continued importance of agriculture in regional livelihoods. Simultaneously, increasing specialization in agricultural labor in several eastern districts points to processes of land fragmentation and growing dependence on wage-based rural employment. In contrast, the Varanasi-Bhadohi-Mau-Chandauli belt maintained strong specialization in household industries, reflecting the resilience of traditional artisanal and craft-based economies. The most notable shift was the expansion of the “other workers” category in urban and industrial centers such as Prayagraj, Varanasi, Mirzapur, and Sonbhadra, highlighting the gradual growth of non-farm and service-sector employment.
These patterns suggest that structural transformation in Eastern Uttar Pradesh is neither linear nor uniform. Rather than a simple transition from agriculture to industry and services, the region exhibits multiple pathways of change shaped by agro-ecological conditions, historical occupational traditions, urbanization, and unequal access to economic opportunities. The coexistence of persistent agrarian specialization, artisanal concentration, and emerging service-sector growth underscores the region’s differentiated development trajectory and highlights the importance of district-level analysis in understanding workforce restructuring. The findings carry important policy implications. Agrarian districts require interventions focused on agricultural modernization, irrigation expansion, agro-processing, and rural non-farm employment generation. Districts characterized by household-industry specialization need support through technological upgrading, skill development, market integration, and cluster-based development strategies. Meanwhile, urban and service-oriented districts require continued investment in infrastructure, human capital, and employment-intensive economic activities. Such place-based strategies are essential for reducing regional disparities and promoting balanced and inclusive development across Eastern Uttar Pradesh.
Future research may extend the analysis to sub-district levels and examine the relationship between occupational specialization and socio-economic variables such as migration, literacy, poverty, landholding patterns, and urban connectivity to better understand the drivers of regional workforce transformation.
Tables
Figures
Conflict of Interest
The authors declare no conflict of Interest.
Acknowledgements
The authors would like to thank Census of India committee for making the data available for this research in the public domain.
References
1.
Abraham, V., 2013. Missing labour or consistent de-feminisation? Economic and Political Weekly, 48(31), 99-108.
2.
Bhalla, G. S. and Singh, G., 2010. Growth of Indian agriculture: A district level study. Planning Commission, Government of India.
Kumar, A., Mishra, V. and Singh, R., 2016. Changes in occupational structure of rural population: A study of Jaunpur District (Uttar Pradesh). Uttar Bharat Bhoogol Patrika, 46(2), 17-25.
Singh, R. L., 1971. India: A regional geography. National Geographical Society of India.
33.
Tanwar, R., Yadav, S. and Chauhan, R., 2016. Regional disparities in socio-economic development: A district-level analysis of Uttar Pradesh. Journal of Social and Economic Studies, 24(1), 55-70.
34.
Tewari, M., 2022. Spatial concentration of manufacturing in India: A location quotient analysis. Journal of Industrial and Regional Economics, 15(2), 134-152.
35.
Tian, Z., 2013. Measuring agglomeration using location quotient and spatial autocorrelation techniques. Regional Studies Review, 45(3), 221-238.
36.
Tiwari, P. and Sharma, V. N., 2020. Regional development patterns in Uttar Pradesh: An empirical appraisal. Uttar Pradesh Journal of Social Sciences, 26(1), 23-40.



 ,
Nitin Kumar Mishra 2
,
Nitin Kumar Mishra 2