

Article Title :
Flood Frequency Analysis of the Mahi Basin by Using Log Pearson Type III Probability Distribution 

2 (2018)
102-112
Annual Maximum Series , return period , peak discharge , Log Pearson Type III , Flood frequency analysis


Flood frequency analysis is one of the techniques of examination of peak stream flow frequency and magnitude in the field of flood hydrology, flood geomorphology and hydraulic engineering. In the present study, Log Pearson Type III (LP-III) probability distribution has applied for flood series data of four sites on the Mahi River namely Mataji, Paderdi Badi, Wanakbori and Khanpur and of three sites on its tributaries such as Anas at Chakaliya, Som at Rangeli and Jakham at Dhariawad. The annual maximum series data for the record length of 26-51 years have been used for the present study. The time series plots of the data indicate that two largest ever recorded floods were observed in the year 1973 and 2006 on the Mahi River. The estimated discharges of 100 year return period range between 3676 m3/s and 47632 m3/s. The return period of the largest ever recorded flood on the Mahi River at Wankbori (40663 m3/s) is 127-yr. The recurrence interval of mean annual discharges (Qm) is between 2.73-yr and 3.95-yr, whereas, the return period of large floods (Qlf) range from 6.24-yr to 9.33-yr. The magnitude-frequency analysis curves represent the reliable estimates of the high floods. The fitted lines are fairly close to the most of the data points. Therefore, it can be reliably and conveniently used to read the recurrence intervals for a given magnitude and vice versa.
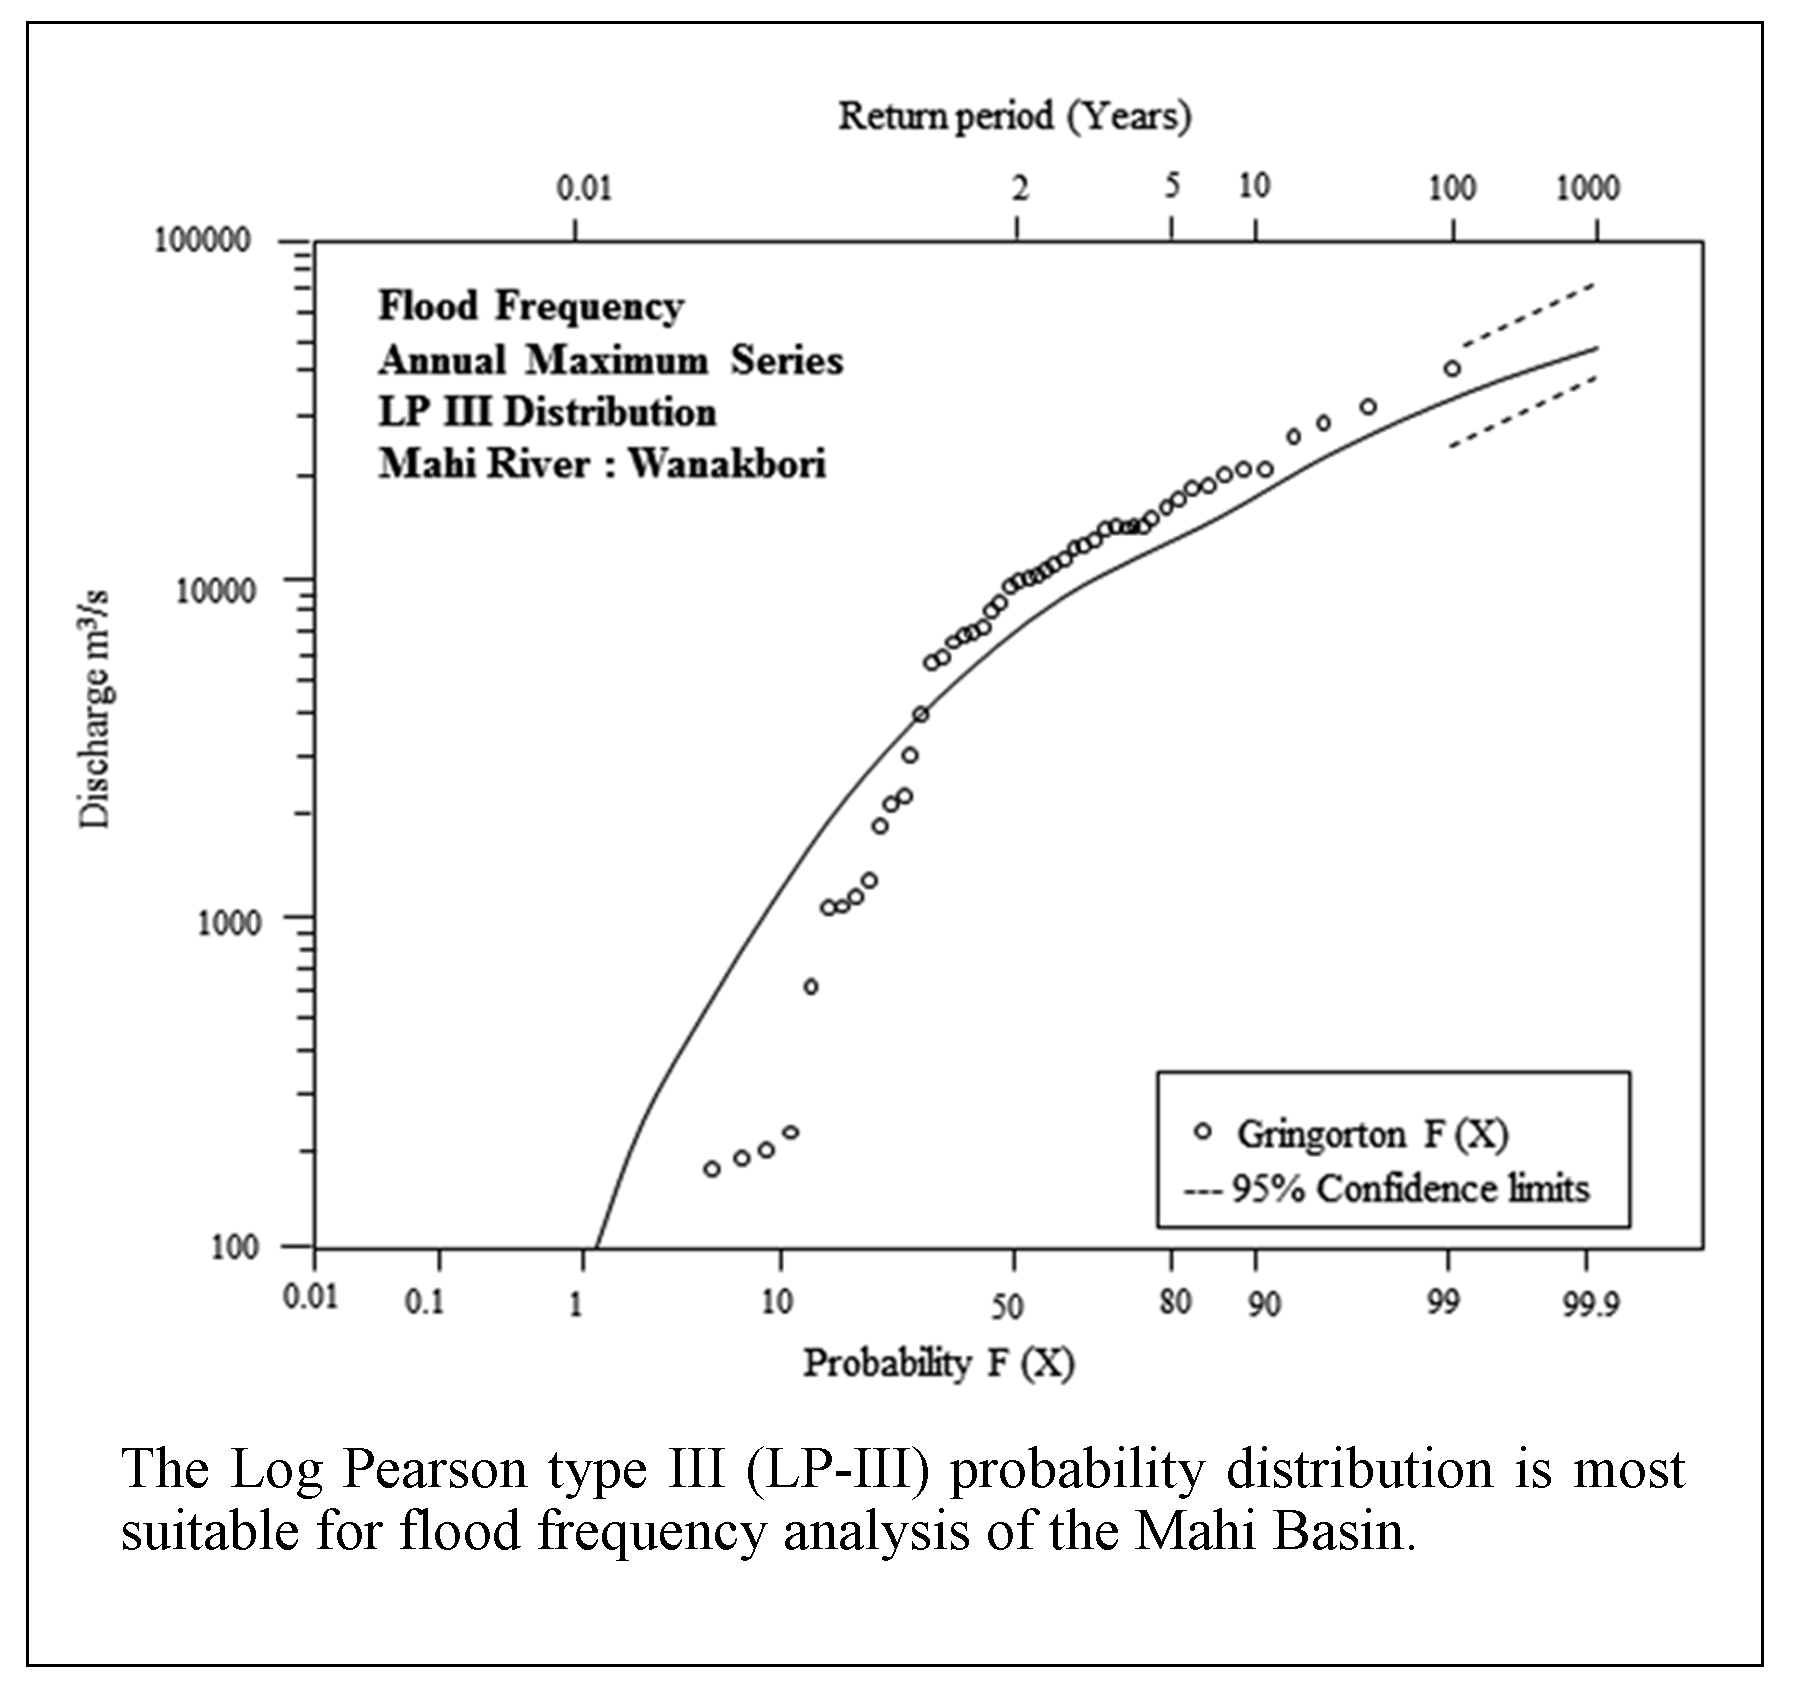
The Log Pearson type III (LP-III) probability distribution is most suitable for flood frequency analysis of the Mahi Basin.
The magnitude frequency analysis shows that the fitted lines are fairly close to the most of the data points.
The return period of the Qm, Qlf and Qmax seems to be very reliable.
The estimation of the discharges for the 100-yr flood is close to the observed Qmax discharge.
Bedient, P. B. and Huber, W.C., 1989. Hydrology and Floodplain Analysis. Addison Wesley Publication Company, New York.
Beard, L. R., 1975. Generalized evaluation of flash-flood potential. Technical Report - University of Texas. Austin, Central Research Water Resource. CRWR-124, 1-27.
Chow, V. T., Maidment, D. R. and Mays, L.W., 1988. Applied Hydrology, McGraw Hill, New York.
Cunnane, C., 1989. Statistical distributions for flood-frequency analysis, World Meteorological Organization, Operational Hydrology Report No. 33 Secretariat of the World Meteorological Organization–No. 718, 61 p. plus appendixes.
Foster, H. A., 1924. Theoretical frequency curves and their application to engineering problems. Trans American Society of Civil Engineers, 87 (1), 142-173.
Jha, V. C. and Bairagya, H., 2011. Environmental impact of flood and their sustainable management in deltaic region of West Bengal, India. Caminhos de Geografia, 12 (39), 283-296.
Millington, N., Das, S. and Simonovic, S. P., 2011. The Comparison of GEV, Log-Pearson Type 3 and Gumbel Distributions in the Upper Thames River Watershed under Global Climate Models. Water Resources Research Report, 077, 10-19.
More, D. K., 1986. Flood Control Operation of Kadana Reservoir. Master of Engineering in Hydrology, University of Roorkee, Roorkee (India).
Kottegoda, N. T. and Rosso, R., 1997. Statistics, Probability, and Reliability for Civil and Environmental Engineers, McGraw Hill, New York.
Pilgrim, D. H. (Ed.), 1987. Australia Rainfall and Runoff. The Institution of Engineers Australia, Barton, ACT.
Raghunath, H. M., 2006. Hydrology: principles, analysis and design. Second revised edition.
Sakthivadivel, R. and Raghupathy, A., 1978. Frequency analysis of floods in some Indian rivers. Hydrology Review, 4, 57-67.
Shaw, E. M., 1994. Hydrology in Practice. Taylor & Francis e-Library, 2005.
Shen, H. W., Brvson, M. C. and Ochoa, I. D., 1980. Effect of tail behavior assumptions on flood predictions. Water Resource Research, 16, 361-364.
Singo, L. R., Kundu, P. M., Odiyo, J. O., Mathivha, F. I. and Nkuna, T.R., 2013. Flood frequency analysis of annual maximum stream flows for Luvuvhu river catchment, Limpopo province, South Africa. University of Venda, Department of Hydrology and Water Resources, Thohoyandou, South Africa, 1-9.
Srikanthan, R. and McMahon, T. A., 1981. Log Pearson III distribution -an empirically derived plotting position. Journal of Hydrology, 52,161-163.
Viessman, W., Lewis, G. L. and Knapp, J. W., 1989. Introduction to Hydrology. Happer and Row Publishers, Singapore.
Ward, R., 1978. Floods. A Geographical Perspective. The MacMillan Press Ltd., London.

