1 . INTRODUCTION
In freshwater, groundwater is very important source on the earth (Brindha et al., 2011) and it is major source for drinking in the rural parts of the developing nations (Brindha et al., 2010; Wagh et al., 2016). The chemistry of groundwater modifies by natural and anthropogenic activities (Wagh et al., 2018). Rock weathering and its dissolution is the most important mechanism that modifies the chemistry of groundwater (Weijden and Pacheco, 2006; Pawar and Nikumbh, 2007). Along with it, interaction of water with aquifer minerals along the flow path in the sub-surface and evaporation and precipitation of surface waters also modifies its chemistry (Domenico, 1972; Wallick and Toth, 1976; Adimalla et al., 2018; Kadam et al., 2020; Mukate et al., 2020; Kumari and Rai, 2020). Geochemical scatter plots give important clues about the sources of ions and pollution in groundwater (Pawar et al., 2008; Wagh et al., 2018; Wagh et al., 2019; Gaikwad et al., 2020).
Due to rapid rise in and growth of agricultural and industrial sectors and demand of groundwater has increased in many folds (Brindha and Elango, 2014; Adimalla et al., 2018; Wagh et al., 2020). Due to this development, pollution of water bodies has been increasing (Brindha and Elango, 2014; Adimalla et al., 2018). If groundwater contains dissolved ions more than standard limit, then it is harmful and unsuitable for use (Pawar et al., 2008; Brindha et al., 2011; Wagh et al., 2019a; Wagh et al., 2020; Kadam et al., 2020; Mukate et al., 2020). So the quality of groundwater for drinking as well as for irrigation purpose also can be studied comparing it with WHO standards and using different parameters like Sodium Absorption Ratio (SAR), Soluble Sodium Percentage (SSP) and Kelly Ratio (KR), respectively.
In absence of any scientific work in the area under investigation except some government organizations like CGWB (2013) and GSDA (2003) and Gaikwad et al., (2018), it is necessary to find out sources and pathways of migration of these ions in the groundwater.
The objectives of this study are to understand the spatial-temporal distribution of major ion in groundwater as well as to identify the geogenic as well as anthropogenic pollution sources in it and to investigate the groundwater quality for drinking and irrigation purposes.
3 . MATERIALS AND METHODS
3.1 Geology
The study area is a part of the Deccan Volcanic Provinces (DVP). The DVP covers an area of more than 500,000 km2, in central and western India (Powar, 1987). The many workers have studied DVP from chemostratigraphy, mineralogy and geochemistry point of view including Beane et al. (1986), Mitchell and Widowson, (1991), Subbarao et al. (1988), Subbarao et al. (1994), Sethna et al. (1996) and Melluso et al. (1999), etc.
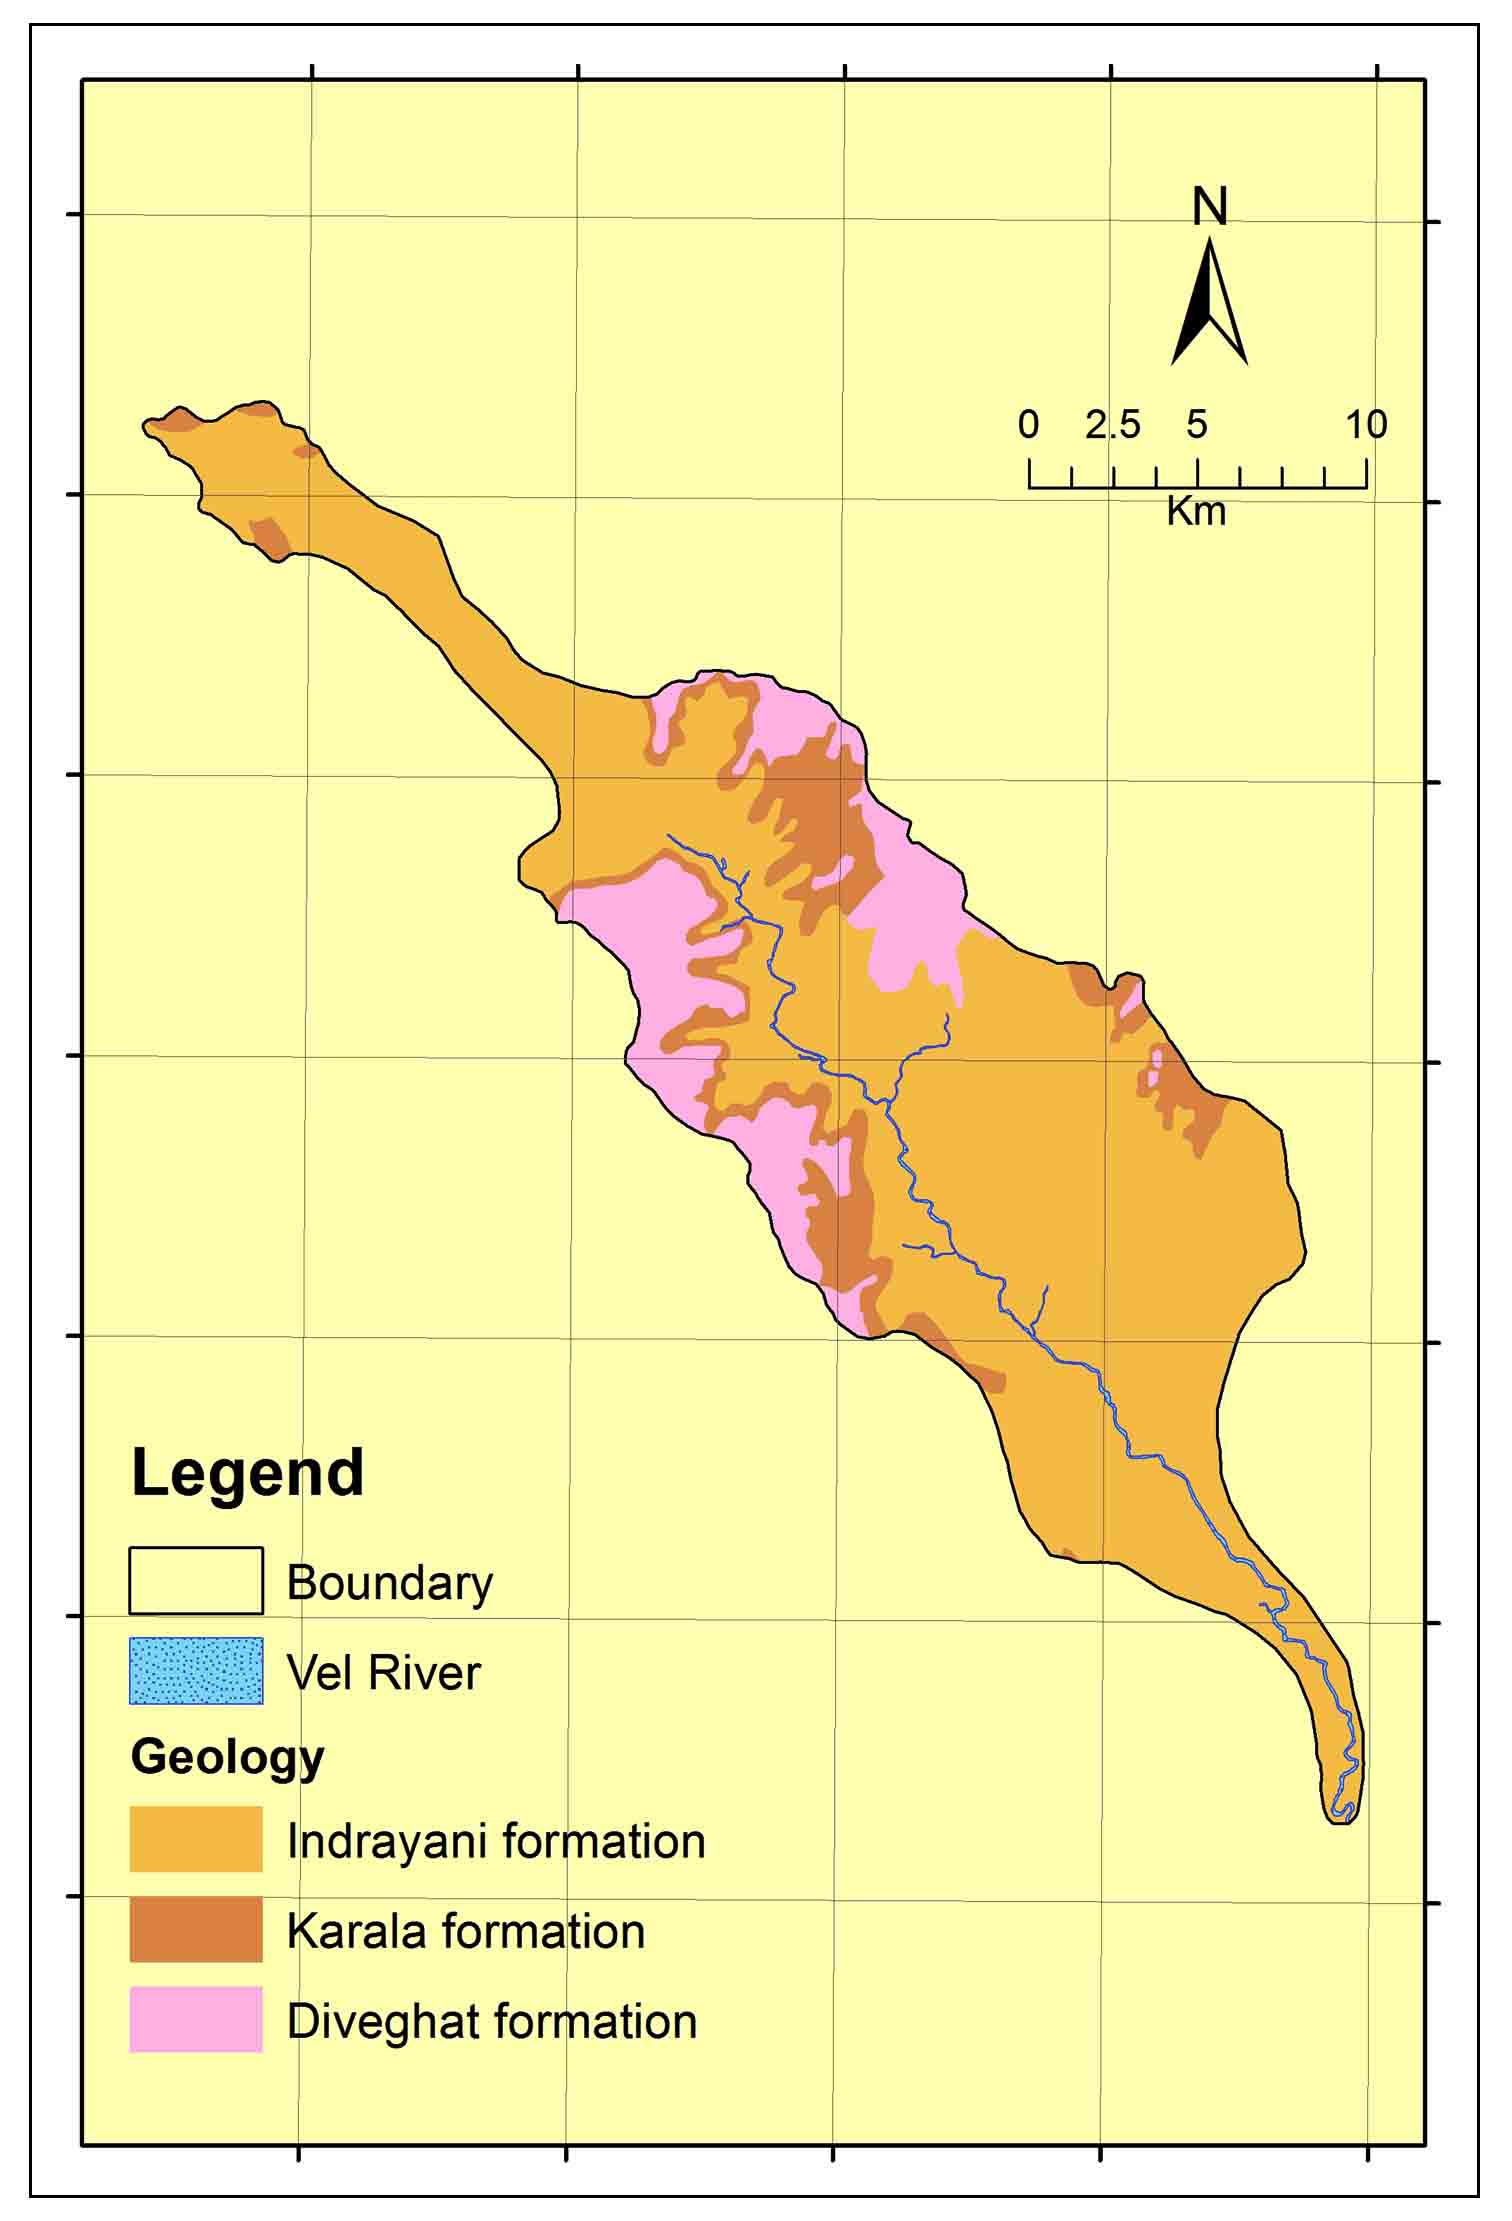
The major lithologies exposed in the Vel basin of Lonavala and Diveghat Subgroup of Deccan Trap Supergroup (Figure 2).
The Indrayani and Karla Formation are part of Lonavala Subgroup while Diveghat Formation is from Diveghat Subgroup (GSI, 2001). Diveghat Formation overlies the Karla Formation. It is exposed in the western and north-eastern regions of the study area. Outcrops of this formation are witnessed on the hills and along the hill slopes above 700 m AMSL (Supekar, 2011). It comprises mainly aphyric simple flows of AA type (GSI, 2001). Lava flows of this formation are characterized by presence of vesicular, plagioclase basalt with medium grained groundmass. It is parted from the upper formation by a geomorphic break (Godbole et al., 1996). The Karla Formation occurs mostly in the central part of basin and overlying the Indrayani Formation. It essentially comprises of compound lava flows revealing pahoehoe characters (GSI, 2001). The Indrayani Formation is exposed in throughout the study area comprising of simple flows covering more than 80% of the total area.
3.2 Water Samples and Chemical Analysis
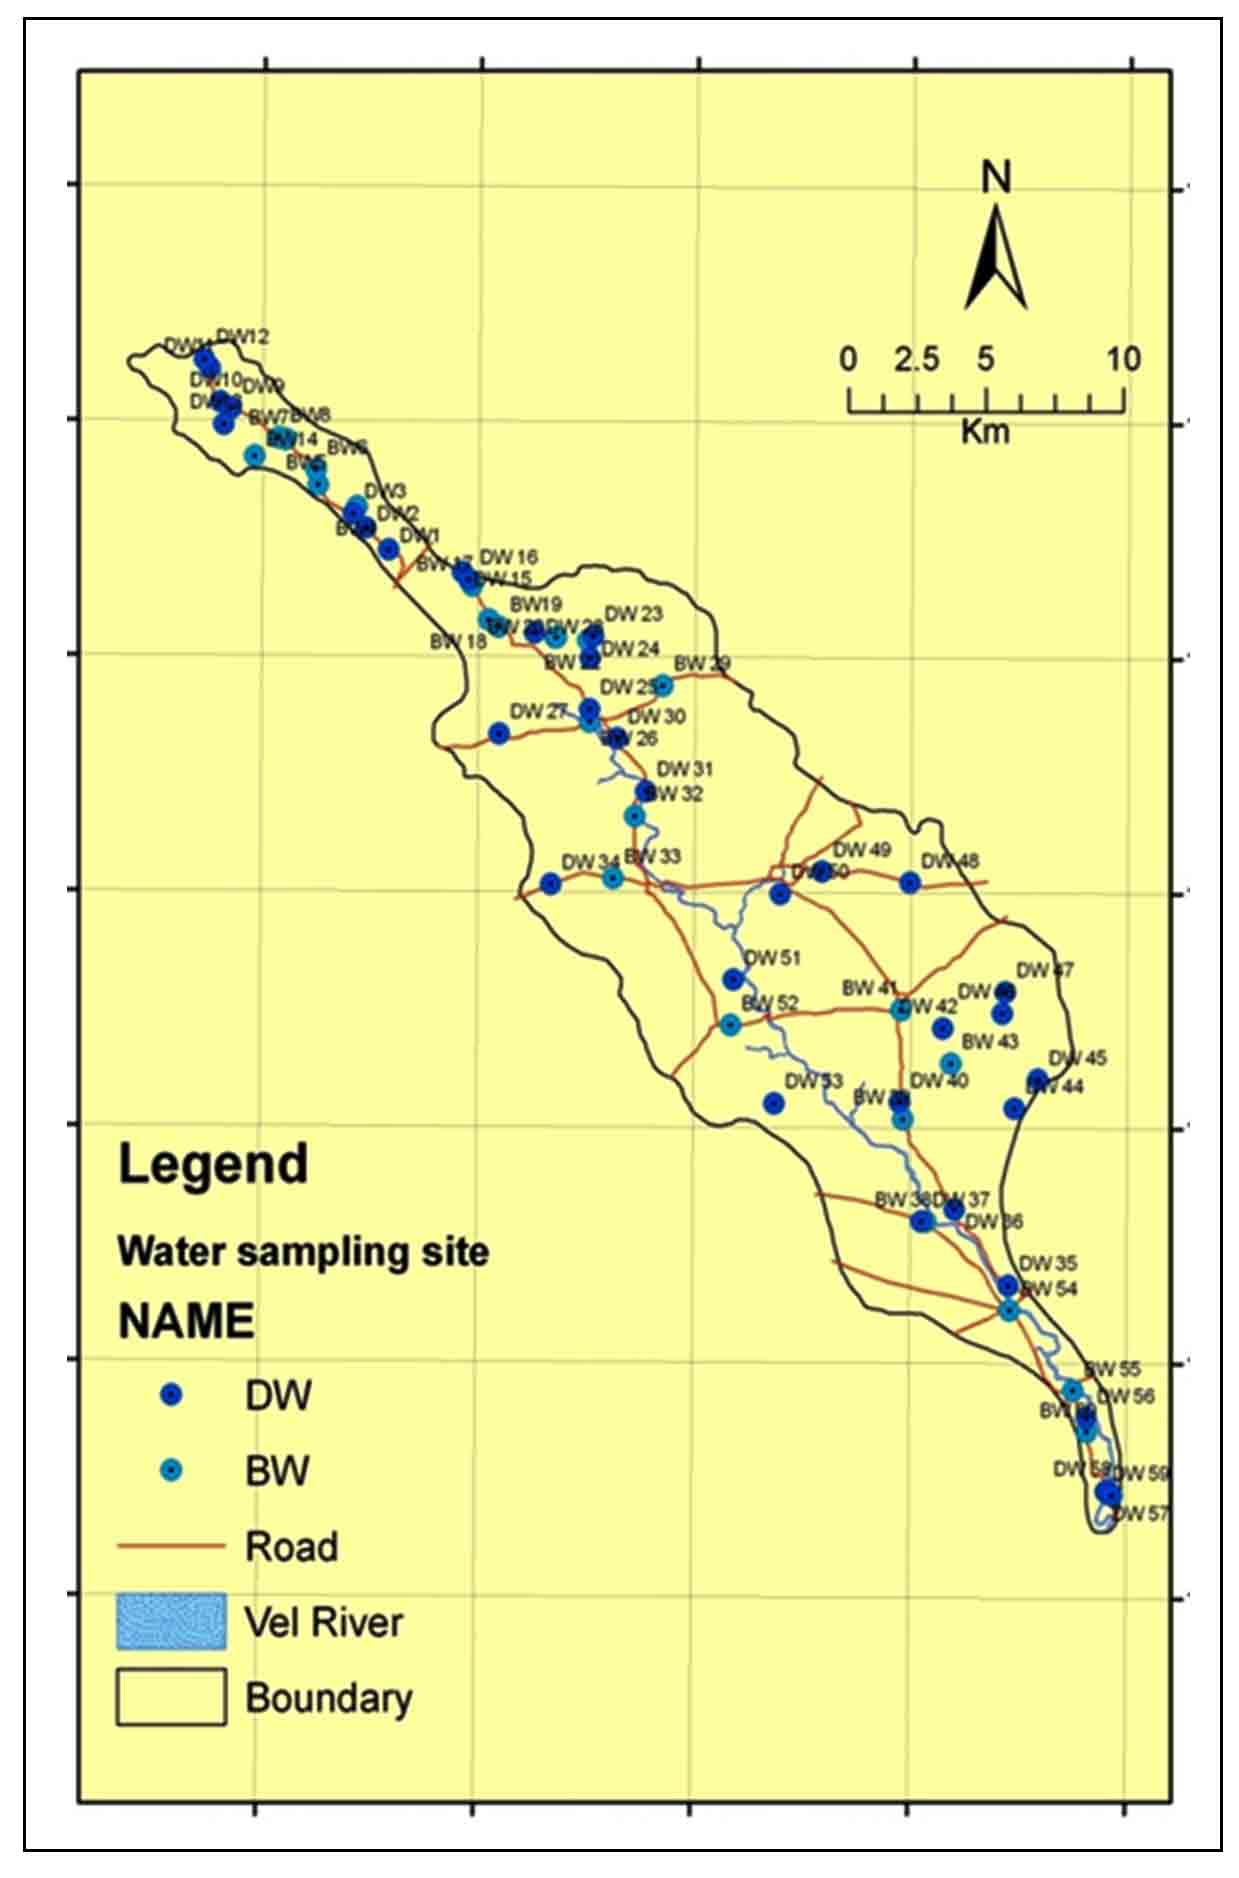
The sampling sites were selected to cover accessible part of the Vel River basin. Sixty (60) groundwater samples of wells and bore wells in different formations were collected using standard procedure for major ions analysis (APHA, 2005; CGWB, 2012; Wagh et al., 2016; Gaikwad et al., 2018; Gaikwad et al., 2020a). The location of water sampling stations in Vel River basin is shown in Figure 3.
Volumetric method was employed for analysis of total alkalinity, total hardness and chloride of water samples from study area are analyzed using the standard methods given by APHA (2005). For the determination of total alkalinity of groundwater samples, acidic-base titration method was used. While for determination of chloride, precipitation argent metric method of titration was used. The complex metric method of titration with EDTA (disodium salt) was used for the analysis of total hardness of groundwater. Sodium (Na+), Potassium (K+) and Calcium (Ca2+) were analyzed on the Photometer (Systronics, Make in India) in the Geochemistry Lab, in the Geology Department of Savitribai Phule Pune University (India). While Magnesium (Mg2+) analyzed by gravimetric analysis with the standard methods (APHA, 2005). Anions (Cl-, HCO3- and SO42- were analyzed on High Performance Ion Chromatography (HPIC) using standard Method (Gaikwad et al., 2020b). The physico-chemical analysis of water sample is shown in the Table 1.
Table 1. Physicochemical analysis of groundwater samples
|
Sr. No
|
Ele.(m)
|
latitude
|
longitude
|
pH
|
EC
|
TDS
|
HCO3-
|
Na+
|
K+
|
Ca2+
|
Mg2+
|
Cl-
|
SO42-
|
TH
|
CBC%
|
SSP
|
Kelly ratio
|
SAR
|
|
DW1
|
779
|
18°56.028'
|
73°55.134'
|
8
|
715
|
458
|
305
|
62.7
|
0.3
|
39.1
|
35.1
|
72.4
|
13.1
|
242.29
|
1.76
|
36.02
|
0.56
|
1.75
|
|
DW2
|
795
|
18°56.450'
|
73°54.653'
|
7.6
|
925
|
592
|
350
|
67
|
0.04
|
56.2
|
32.4
|
79.5
|
11.5
|
273
|
1.01
|
34.89
|
0.54
|
1.76
|
|
DW3
|
803
|
18°56.720'
|
73°54.394'
|
7.5
|
847
|
542
|
330
|
60.2
|
0.08
|
48.3
|
38.4
|
76.7
|
12.3
|
278.66
|
2.25
|
31.99
|
0.47
|
1.56
|
|
BW4
|
801
|
18°56.852'
|
73°54.474'
|
7.2
|
1198
|
767
|
380
|
97.6
|
1.56
|
65.3
|
51.4
|
122
|
12.6
|
374.82
|
4.6
|
36.09
|
0.56
|
2.19
|
|
BW5
|
816
|
18°57.267'
|
73°53.662'
|
7.2
|
955
|
611
|
420
|
68.4
|
0.07
|
72.2
|
45.4
|
82.4
|
11.5
|
367
|
4.44
|
30.58
|
0.44
|
1.55
|
|
BW6
|
822
|
18°57.555'
|
73°53.614'
|
7.1
|
1017
|
651
|
490
|
75.5
|
0.03
|
58.6
|
62.3
|
85
|
13.4
|
402.87
|
2.85
|
29.01
|
0.41
|
1.64
|
|
BW7
|
840
|
18°58.130'
|
73°52.993'
|
7.2
|
1752
|
1121
|
575
|
170
|
0.15
|
85.5
|
48.5
|
210
|
13.9
|
413.35
|
0.07
|
47.25
|
0.90
|
3.64
|
|
DW8
|
840
|
18°58.171'
|
73°52.832'
|
7.2
|
1004
|
643
|
375
|
55.8
|
0.11
|
78.3
|
45.3
|
72
|
11.9
|
4.6
|
3.69
|
24.85
|
0.33
|
1.26
|
|
DW9
|
859
|
18°58.720'
|
73°51.850'
|
7.2
|
838
|
536
|
330
|
68.3
|
0.01
|
53.7
|
50.6
|
72.4
|
12.3
|
342.39
|
4.9
|
30.28
|
0.43
|
1.61
|
|
DW10
|
857
|
18°58.843'
|
73°51.625'
|
7.3
|
695
|
445
|
375
|
93.9
|
0.17
|
46.6
|
41.5
|
59.4
|
12
|
287.2
|
3.9
|
41.55
|
0.71
|
2.41
|
|
DW11
|
867
|
18°59.496'
|
73°51.399'
|
8.1
|
726
|
465
|
400
|
64
|
0.05
|
81.5
|
35.9
|
72.4
|
11.5
|
366.21
|
4.8
|
27.55
|
0.38
|
1.45
|
|
DW12
|
850
|
18°59.665'
|
73°51.287'
|
7.5
|
655
|
419
|
350
|
65.5
|
0.01
|
45.6
|
41.4
|
56.5
|
11.2
|
284
|
5
|
33.45
|
0.50
|
1.69
|
|
DW13
|
841
|
18°58.421'
|
73°51.689'
|
7.3
|
670
|
429
|
325
|
60.4
|
0.03
|
48.2
|
39.6
|
54
|
11.7
|
294
|
4.2
|
31.72
|
0.46
|
1.56
|
|
BW14
|
845
|
18°57.812'
|
73°52.339'
|
7.7
|
894
|
572
|
370
|
59.3
|
0.3
|
50.1
|
45.5
|
80.9
|
11.3
|
312.64
|
1.44
|
29.25
|
0.41
|
1.46
|
|
DW15
|
785
|
18°'55.798'
|
73°56.540'
|
7.3
|
657
|
420
|
325
|
62.8
|
0.07
|
50.2
|
39.5
|
56.8
|
11.1
|
297.64
|
1.8
|
30.43
|
0.44
|
1.56
|
|
DW16
|
785
|
18°55.600'
|
73°56.704'
|
7.8
|
884
|
566
|
325
|
67.1
|
0.3
|
42.8
|
35.3
|
62.5
|
10.9
|
299.6
|
4.1
|
35.26
|
0.54
|
1.46
|
|
BW17
|
782
|
18°55.349'
|
73°56.873'
|
7.3
|
1088
|
696
|
275
|
72.1
|
0.07
|
55.4
|
35.3
|
98
|
11.4
|
283.6
|
4.3
|
35.64
|
0.55
|
1.86
|
|
BW18
|
770
|
18°54.698'
|
73°57.218'
|
7.9
|
853
|
546
|
220
|
78.3
|
0.24
|
35.5
|
30.4
|
118
|
11.3
|
213.24
|
3.42
|
44.46
|
0.80
|
2.33
|
|
BW19
|
763
|
18°54.566'
|
73°57.424'
|
7.3
|
839
|
537
|
520
|
92.3
|
1.75
|
40.1
|
50.5
|
79.5
|
11.3
|
308.05
|
-3.71
|
39.43
|
0.65
|
2.29
|
|
BW20
|
765
|
18°54.365'
|
73°58.596'
|
7.7
|
698
|
447
|
420
|
85.6
|
0.07
|
30.3
|
41.4
|
49.7
|
10.7
|
245.94
|
0.75
|
43.11
|
0.76
|
2.38
|
|
BW21
|
765
|
18°54.365'
|
73°58.625'
|
7.5
|
656
|
420
|
400
|
78.8
|
0.03
|
33.3
|
42.3
|
93.7
|
11.3
|
257.58
|
-4.78
|
40.02
|
0.67
|
2.14
|
|
BW22
|
760
|
18°54.312'
|
73°59.281'
|
7.6
|
928
|
594
|
450
|
95.1
|
0.86
|
45.6
|
40.5
|
61.1
|
11.5
|
280.61
|
2.23
|
42.51
|
0.74
|
2.47
|
|
DW23
|
750
|
18°54.398'
|
73°59.396'
|
7.3
|
1249
|
799
|
460
|
78.7
|
3.23
|
58.8
|
61.2
|
85.2
|
11.5
|
398.89
|
4.61
|
30.03
|
0.43
|
1.71
|
|
DW24
|
742
|
18°53.971'
|
73°59.321'
|
7.9
|
825
|
528
|
355
|
85.7
|
0.32
|
35.5
|
35.2
|
44
|
10.9
|
233.44
|
4.12
|
44.54
|
0.80
|
2.42
|
|
DW25
|
726
|
18°52.997'
|
73°59.313'
|
8
|
832
|
532
|
390
|
84.7
|
0.18
|
48.8
|
53
|
107
|
10.9
|
340.29
|
4.29
|
35.11
|
0.54
|
2.00
|
|
BW26
|
714
|
18°52.760'
|
73°59.317'
|
7.4
|
1126
|
721
|
425
|
93.4
|
0.62
|
53.4
|
42.5
|
92.3
|
11.2
|
308.33
|
2.77
|
39.73
|
0.66
|
2.31
|
|
DW27
|
742
|
18°52.521'
|
73°57.450'
|
7.3
|
1095
|
701
|
520
|
100
|
2.36
|
65.2
|
53.5
|
120
|
11.1
|
382.9
|
-0.34
|
36.36
|
0.57
|
2.23
|
|
BW28
|
801
|
18°54.454'
|
73°58.171'
|
7.7
|
1447
|
926
|
425
|
111
|
0.02
|
62.2
|
52.4
|
207
|
12.2
|
370.95
|
-3.31
|
39.41
|
0.65
|
2.50
|
|
BW29
|
756
|
18°53.453'
|
74°00.832'
|
7.9
|
752
|
481
|
360
|
62.3
|
0.03
|
34.4
|
40.4
|
45.4
|
11.2
|
255.14
|
2.67
|
34.74
|
0.53
|
1.70
|
|
DW30
|
709
|
18°52.455'
|
73°59.886'
|
7.8
|
979
|
627
|
315
|
75.5
|
0.17
|
45.6
|
39
|
82.4
|
11.7
|
274.29
|
4.3
|
37.44
|
0.60
|
1.98
|
|
DW31
|
690
|
18°51.427'
|
74°00.480'
|
7.2
|
1247
|
798
|
375
|
82.2
|
7.02
|
52.6
|
41.3
|
108
|
12.7
|
301.24
|
1.65
|
37.27
|
0.59
|
2.06
|
|
BW32
|
686
|
18°50.954'
|
74°00.273'
|
7.3
|
806
|
516
|
350
|
76.4
|
0.03
|
51.2
|
36.3
|
71
|
11.8
|
277.61
|
4.2
|
37.47
|
0.60
|
2.00
|
|
BW33
|
687
|
18°49.764'
|
73°59..823'
|
7.3
|
616
|
394
|
375
|
68.6
|
0.02
|
38.1
|
45.1
|
51.1
|
11.8
|
280.84
|
4.65
|
34.77
|
0.53
|
1.78
|
|
DW34
|
708
|
18°49.642'
|
73°58.522'
|
7.1
|
885
|
566
|
500
|
91
|
0.05
|
50.1
|
60.2
|
76.6
|
11.4
|
373.2
|
3.26
|
34.71
|
0.53
|
2.05
|
|
DW35
|
581
|
18°41.998'
|
74°08.056'
|
7.4
|
1870
|
1197
|
425
|
120
|
0.19
|
96.4
|
56.3
|
29.6
|
12
|
472.22
|
2.67
|
39.72
|
0.66
|
2.40
|
|
DW36
|
592
|
18°43.445'
|
74°06.935'
|
7.4
|
1081
|
692
|
455
|
95.6
|
0.5
|
62.4
|
45.5
|
112
|
11.9
|
343.2
|
0.73
|
37.78
|
0.61
|
2.25
|
|
DW37
|
591
|
18°43.215'
|
74°06.245'
|
7.2
|
936
|
599
|
470
|
99
|
1.64
|
42.1
|
52
|
80.9
|
11.1
|
319.37
|
2.43
|
40.26
|
0.67
|
2.41
|
|
BW38
|
617
|
18°43.215'
|
74°06.345'
|
7.6
|
796
|
509
|
395
|
81.5
|
0.2
|
41
|
48.1
|
76.2
|
11
|
300.58
|
3.75
|
37.13
|
0.59
|
2.05
|
|
BW39
|
611
|
18°45.175'
|
74°05.861'
|
7.7
|
980
|
627
|
495
|
110
|
0.03
|
58.4
|
52.5
|
93.7
|
12.2
|
361
|
4.45
|
39.95
|
0.67
|
2.53
|
|
DW40
|
620
|
18°45.494'
|
74°05.786'
|
7.5
|
932
|
596
|
455
|
110
|
0.01
|
42.1
|
56.1
|
90.9
|
12.1
|
311.31
|
3.51
|
43.51
|
0.77
|
2.72
|
|
BW41
|
642
|
18°47.262'
|
74°05.807'
|
7.4
|
1395
|
893
|
470
|
143
|
1.56
|
41.3
|
52.7
|
139
|
11.4
|
319.98
|
3.15
|
49.33
|
0.97
|
3.48
|
|
DW42
|
641
|
18°46.917'
|
74°06.679'
|
7.5
|
860
|
550
|
470
|
78.9
|
0.02
|
38.7
|
51.2
|
55.4
|
11.9
|
307.62
|
0.37
|
22.03
|
0.28
|
1.96
|
|
BW43
|
625
|
18°46.240'
|
74°06.846'
|
7.2
|
1880
|
1203
|
475
|
180
|
2.69
|
78.3
|
48.5
|
78.5
|
12.2
|
395.2
|
-0.9
|
49.81
|
0.99
|
3.95
|
|
DW44
|
610
|
18°45.389'
|
74°08.172'
|
7.5
|
1670
|
1069
|
530
|
136
|
0.63
|
46
|
86
|
170
|
17.3
|
467
|
4.8
|
38.73
|
0.63
|
2.73
|
|
DW45
|
623
|
18°45.940'
|
74°08.652'
|
7.8
|
854
|
547
|
745
|
195
|
0
|
52.1
|
74.6
|
200
|
11.1
|
437
|
-2.59
|
49.16
|
0.97
|
4.04
|
|
DW46
|
635
|
18°47.208'
|
74°07.905'
|
7.4
|
1135
|
726
|
515
|
95.2
|
0.12
|
68.6
|
70.4
|
121
|
11
|
461
|
4.8
|
31.01
|
0.45
|
1.93
|
|
DW47
|
631
|
18°47.613'
|
74°07.970'
|
7.3
|
1277
|
817
|
610
|
146
|
0.13
|
56.9
|
61.5
|
116
|
11.8
|
395.56
|
2.58
|
44.52
|
0.80
|
3.19
|
|
DW48
|
673
|
18°49.701'
|
74°05.991'
|
7.5
|
1350
|
864
|
625
|
98.6
|
0.04
|
73
|
80.9
|
95.1
|
12.7
|
515.39
|
4.03
|
29.40
|
0.42
|
1.89
|
|
DW49
|
688
|
18°49.909'
|
74°04.159'
|
7.6
|
638
|
408
|
320
|
45.6
|
0.02
|
38.1
|
41.3
|
48.3
|
11.8
|
265.09
|
3.01
|
27.24
|
0.37
|
1.22
|
|
DW50
|
666
|
18°49.477'
|
74°03.295'
|
7.4
|
821
|
525
|
425
|
59.8
|
0.02
|
50.2
|
42.5
|
63.9
|
11.3
|
300.33
|
-2.27
|
30.23
|
0.43
|
1.50
|
|
DW51
|
649
|
18°47.827'
|
74°02.331'
|
7.3
|
884
|
566
|
355
|
52.6
|
0.02
|
65
|
48.9
|
88
|
11.9
|
363.08
|
4.57
|
23.95
|
0.31
|
1.20
|
|
BW52
|
648
|
18°46.957'
|
74°02.269'
|
7
|
4850
|
3104
|
790
|
201
|
10.2
|
10.4
|
75.5
|
272
|
13.5
|
570.66
|
-1.12
|
43.51
|
0.77
|
3.68
|
|
DW53
|
635
|
18°45.466'
|
74°03.187'
|
7.8
|
1450
|
928
|
405
|
69.4
|
0.4
|
43.3
|
46
|
63.9
|
13.1
|
297.6
|
1.46
|
25.25
|
0.34
|
1.70
|
|
BW54
|
585
|
18°41.516'
|
74°08.082'
|
7.1
|
1748
|
1119
|
470
|
181
|
0.12
|
95.6
|
66.5
|
278
|
12.9
|
512.71
|
4.74
|
43.43
|
0.77
|
3.47
|
|
BW55
|
557
|
18°39.987'
|
74°09.403'
|
7.1
|
9160
|
5862
|
675
|
402
|
8.5
|
201
|
110
|
888
|
12.7
|
956.6
|
0.63
|
47.79
|
0.92
|
5.66
|
|
DW56
|
558
|
18°39.464'
|
74°09.680'
|
7.3
|
5580
|
3571
|
460
|
425
|
0.69
|
110
|
56.5
|
610
|
12.4
|
508.15
|
4.48
|
64.64
|
1.83
|
8.22
|
|
DW57
|
572
|
18°38.057'
|
74°10.093'
|
7.2
|
7690
|
4922
|
575
|
450
|
2.81
|
140
|
64.5
|
827
|
11.8
|
616.36
|
-1.61
|
61.39
|
1.59
|
7.89
|
|
DW58
|
546
|
18°38.058'
|
74°10.092'
|
7.3
|
4800
|
3072
|
710
|
259
|
1.03
|
56.1
|
96.3
|
301
|
11.9
|
536.96
|
3.91
|
51.25
|
1.05
|
4.84
|
|
DW59
|
549
|
18°37.980'
|
74°10.222'
|
7.6
|
5800
|
3712
|
740
|
302
|
0.68
|
86.2
|
71.5
|
397
|
12.4
|
509.72
|
-0.57
|
56.33
|
1.29
|
5.82
|
|
BW60
|
570
|
18°39.196'
|
74°09.698'
|
7.5
|
4940
|
3162
|
580
|
296
|
0.13
|
46.3
|
100
|
372
|
12.3
|
654.16
|
4.34
|
49.63
|
0.99
|
5.04
|
| |
|
|
Max.
|
8.1
|
9160
|
5862
|
790
|
450
|
10.2
|
201
|
110
|
888
|
17.3
|
956.6
|
5
|
64.64
|
1.83
|
8.22
|
| |
|
|
Min.
|
7
|
616
|
394
|
220
|
45.6
|
0
|
10.4
|
30.4
|
29.6
|
10.7
|
4.6
|
-4.78
|
22.03
|
0.28
|
1.2
|
| |
|
|
Average
|
7.41
|
2641
|
1690
|
528
|
176
|
1.44
|
67.2
|
64.4
|
235
|
12.3
|
442.91
|
2.354
|
38.23167
|
0.657
|
2.5755
|
4 . RESULTS AND DISCUSSIONS
4.1 Spatial Variation in pH and EC
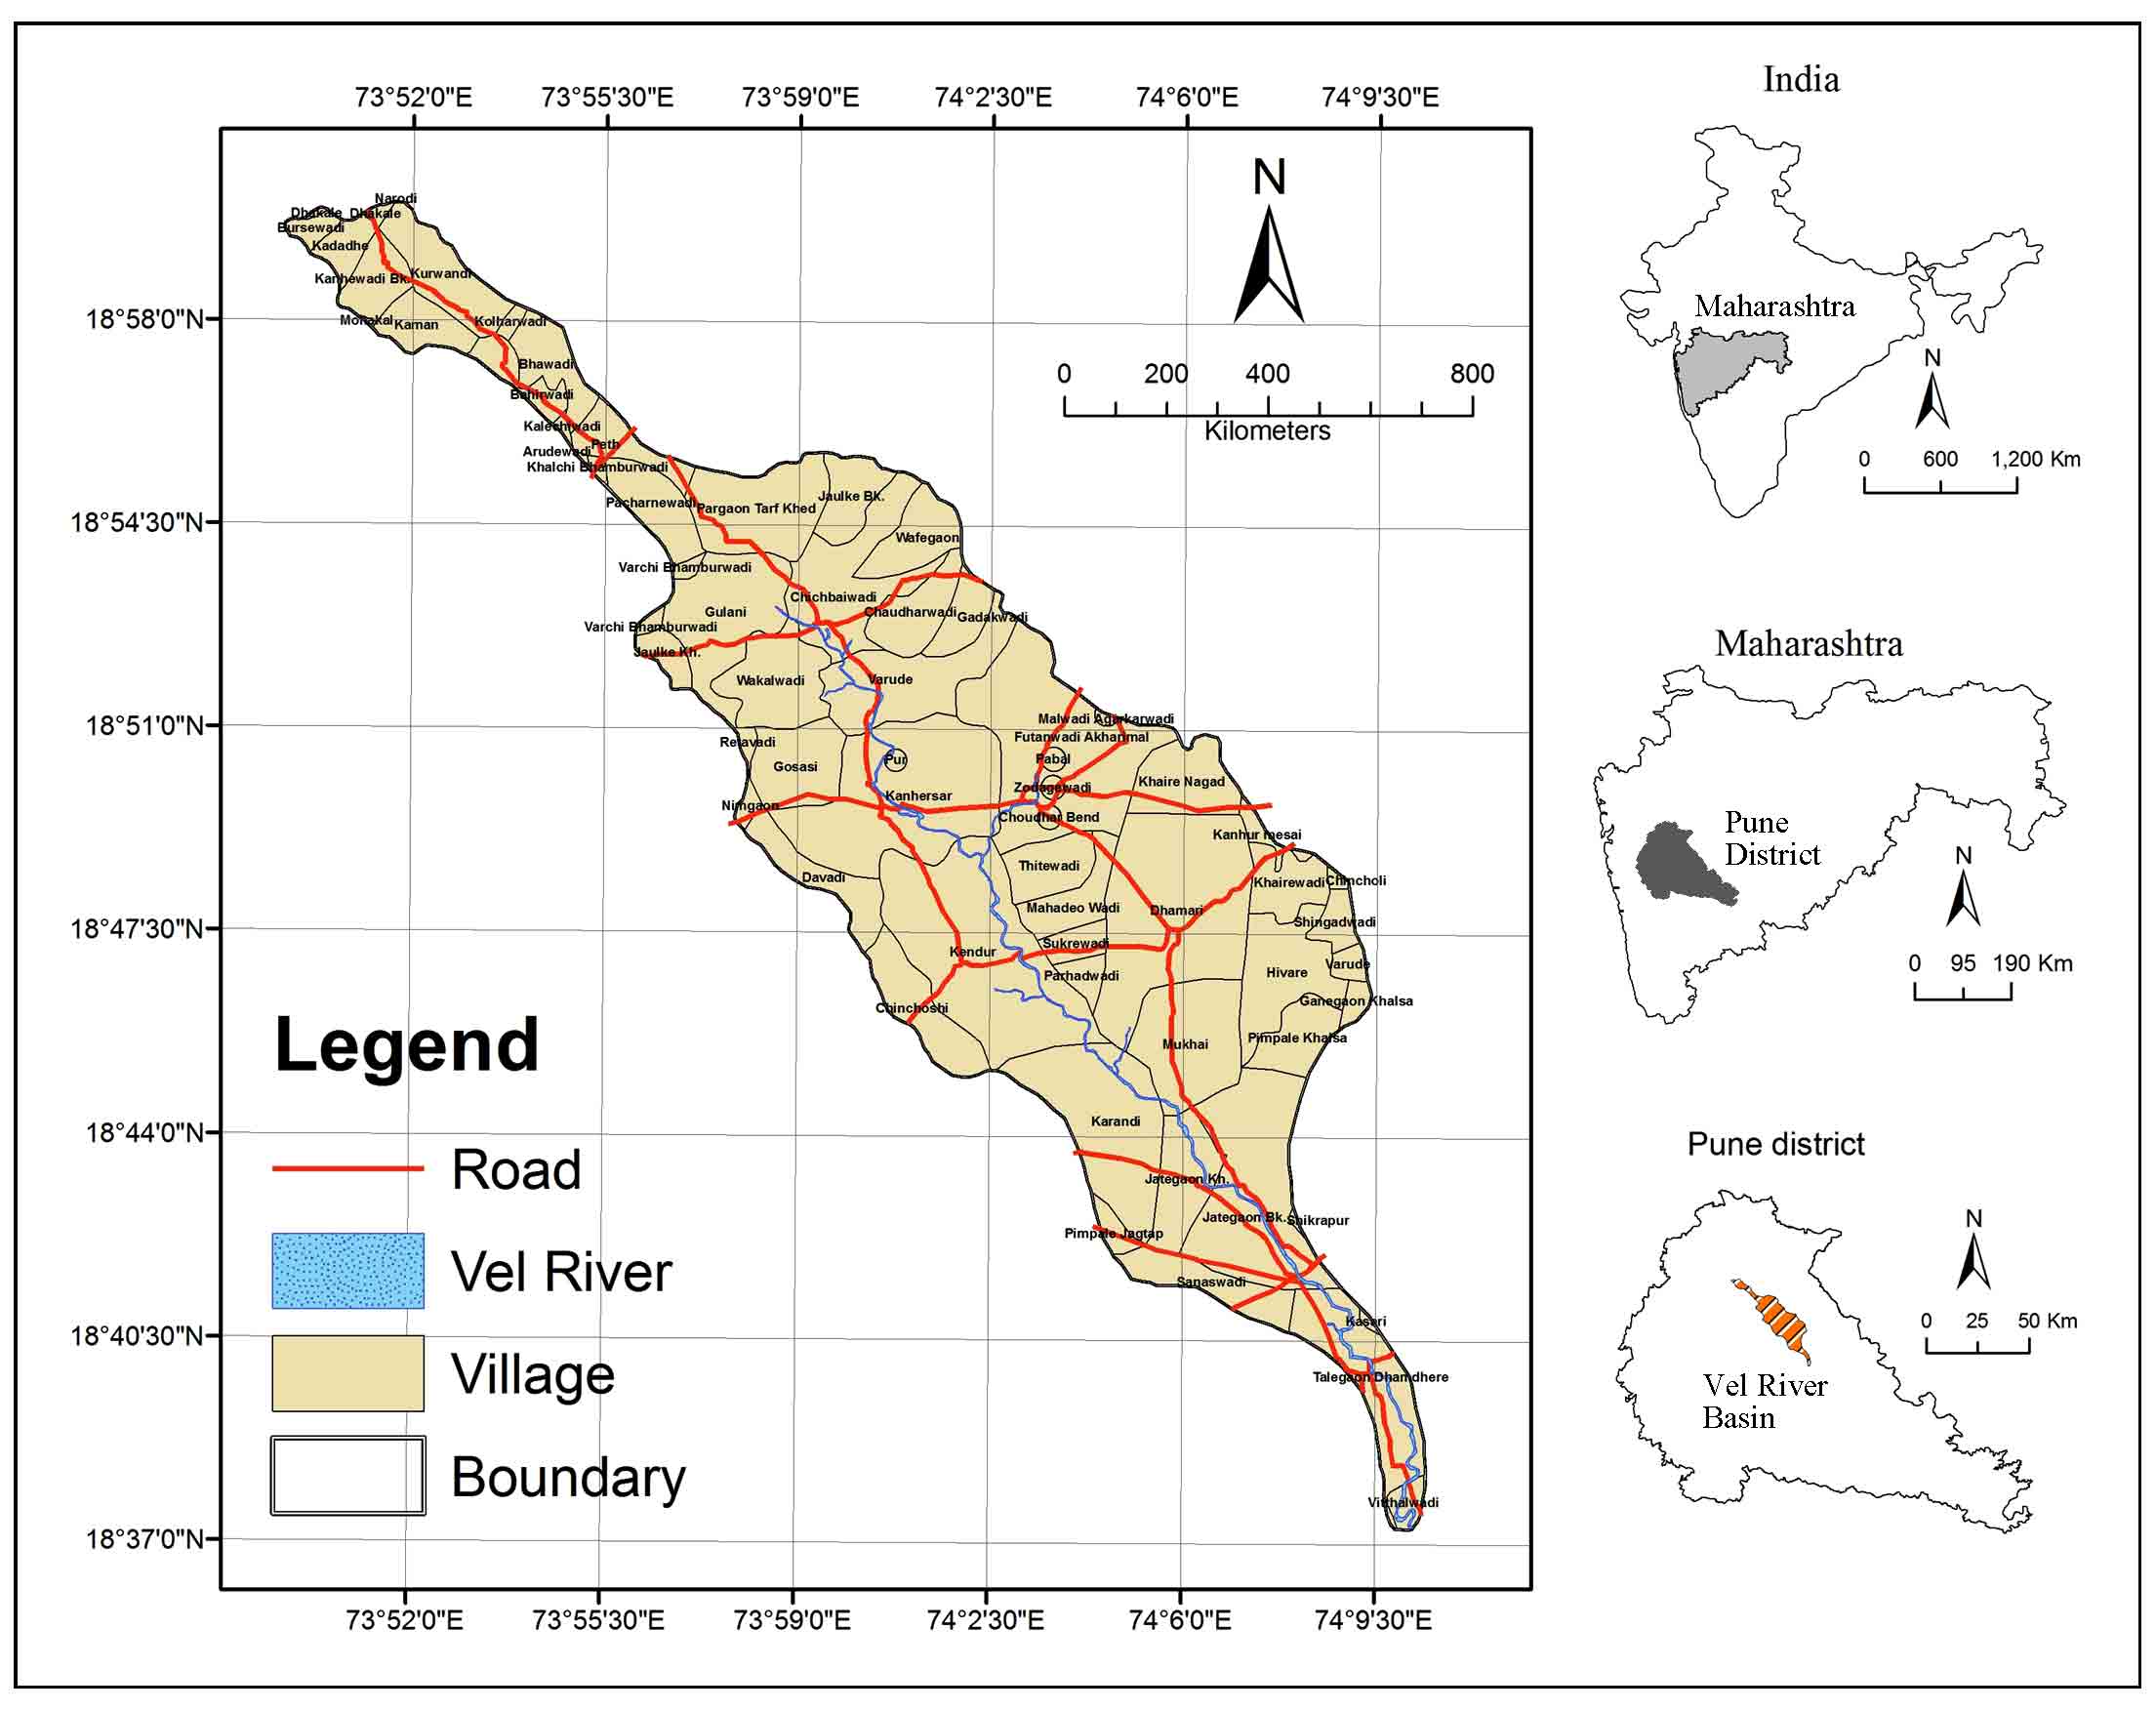
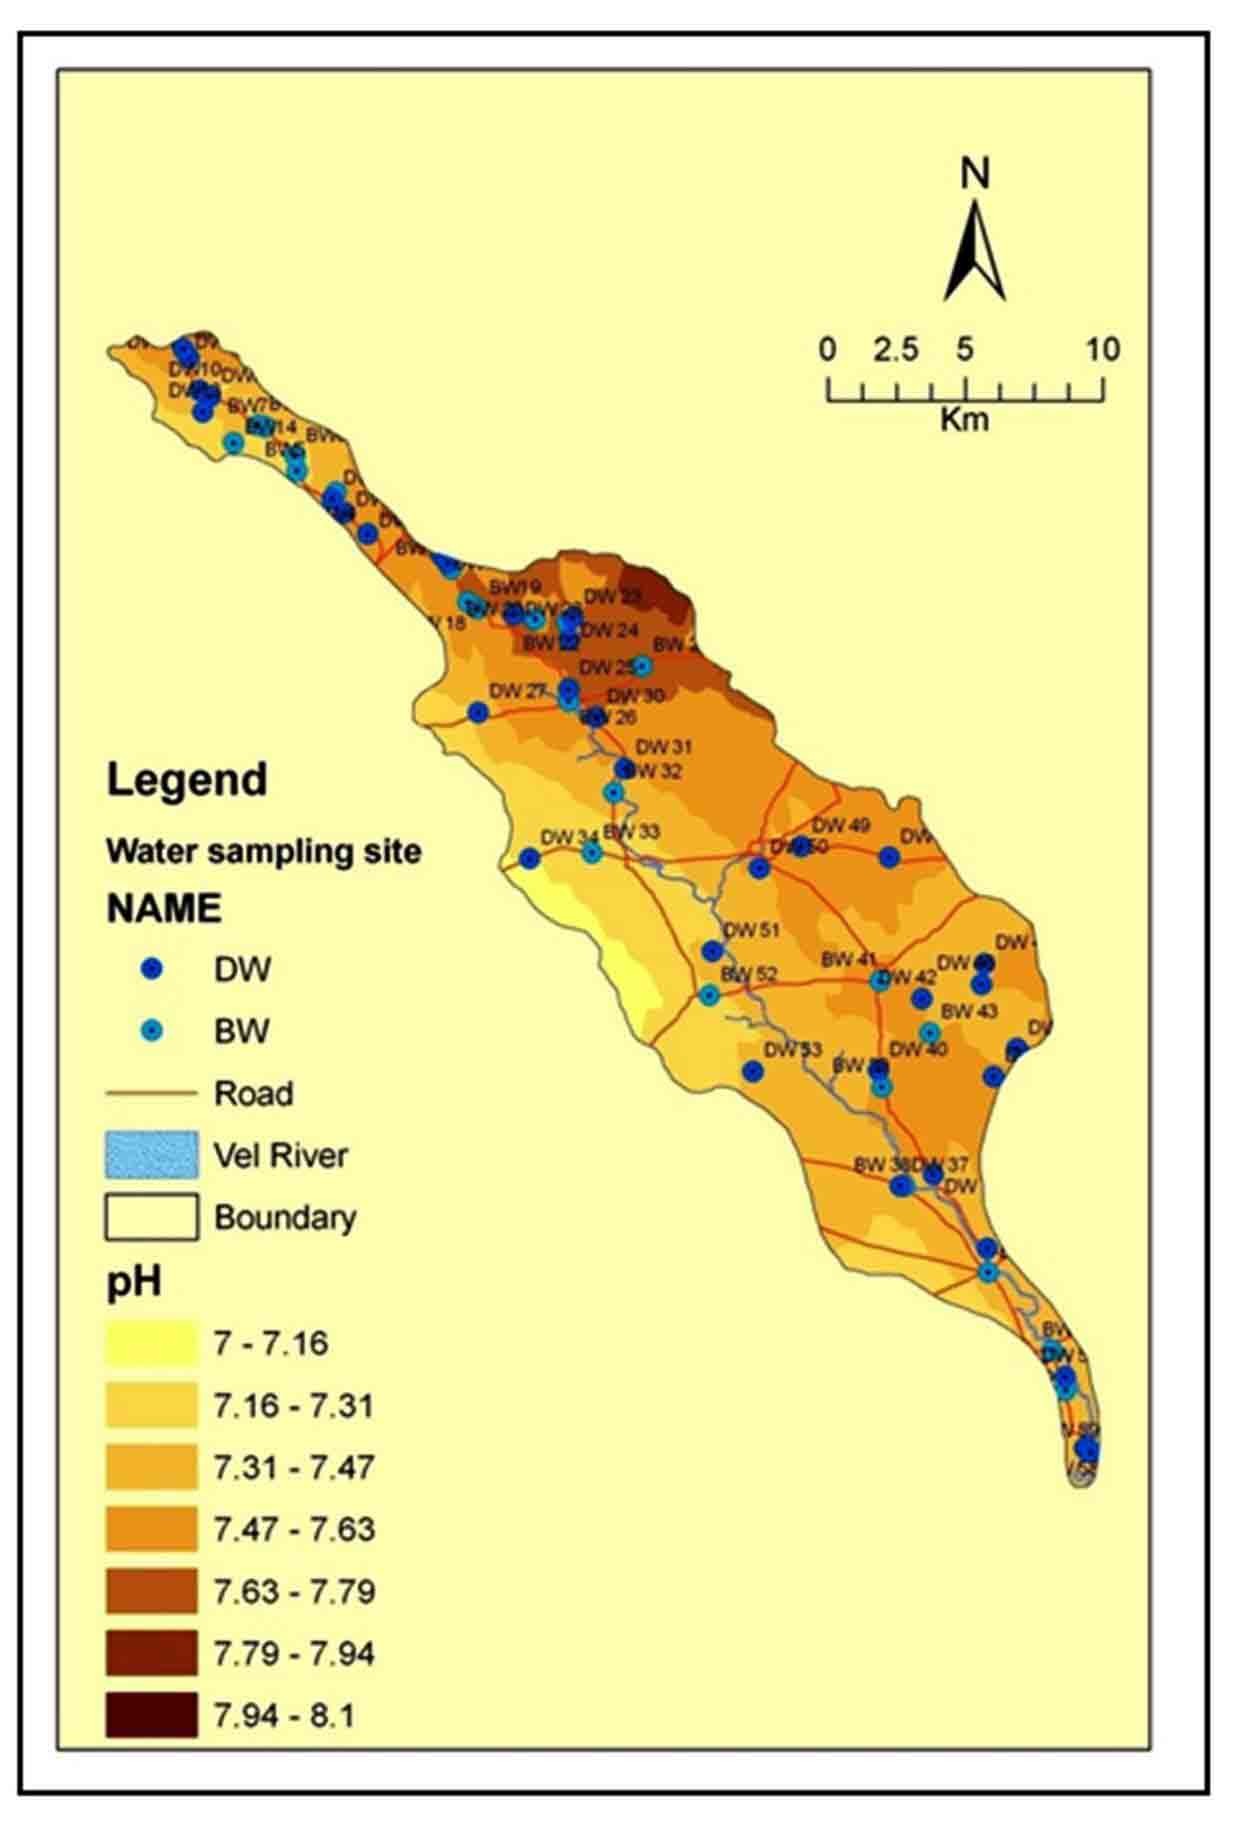
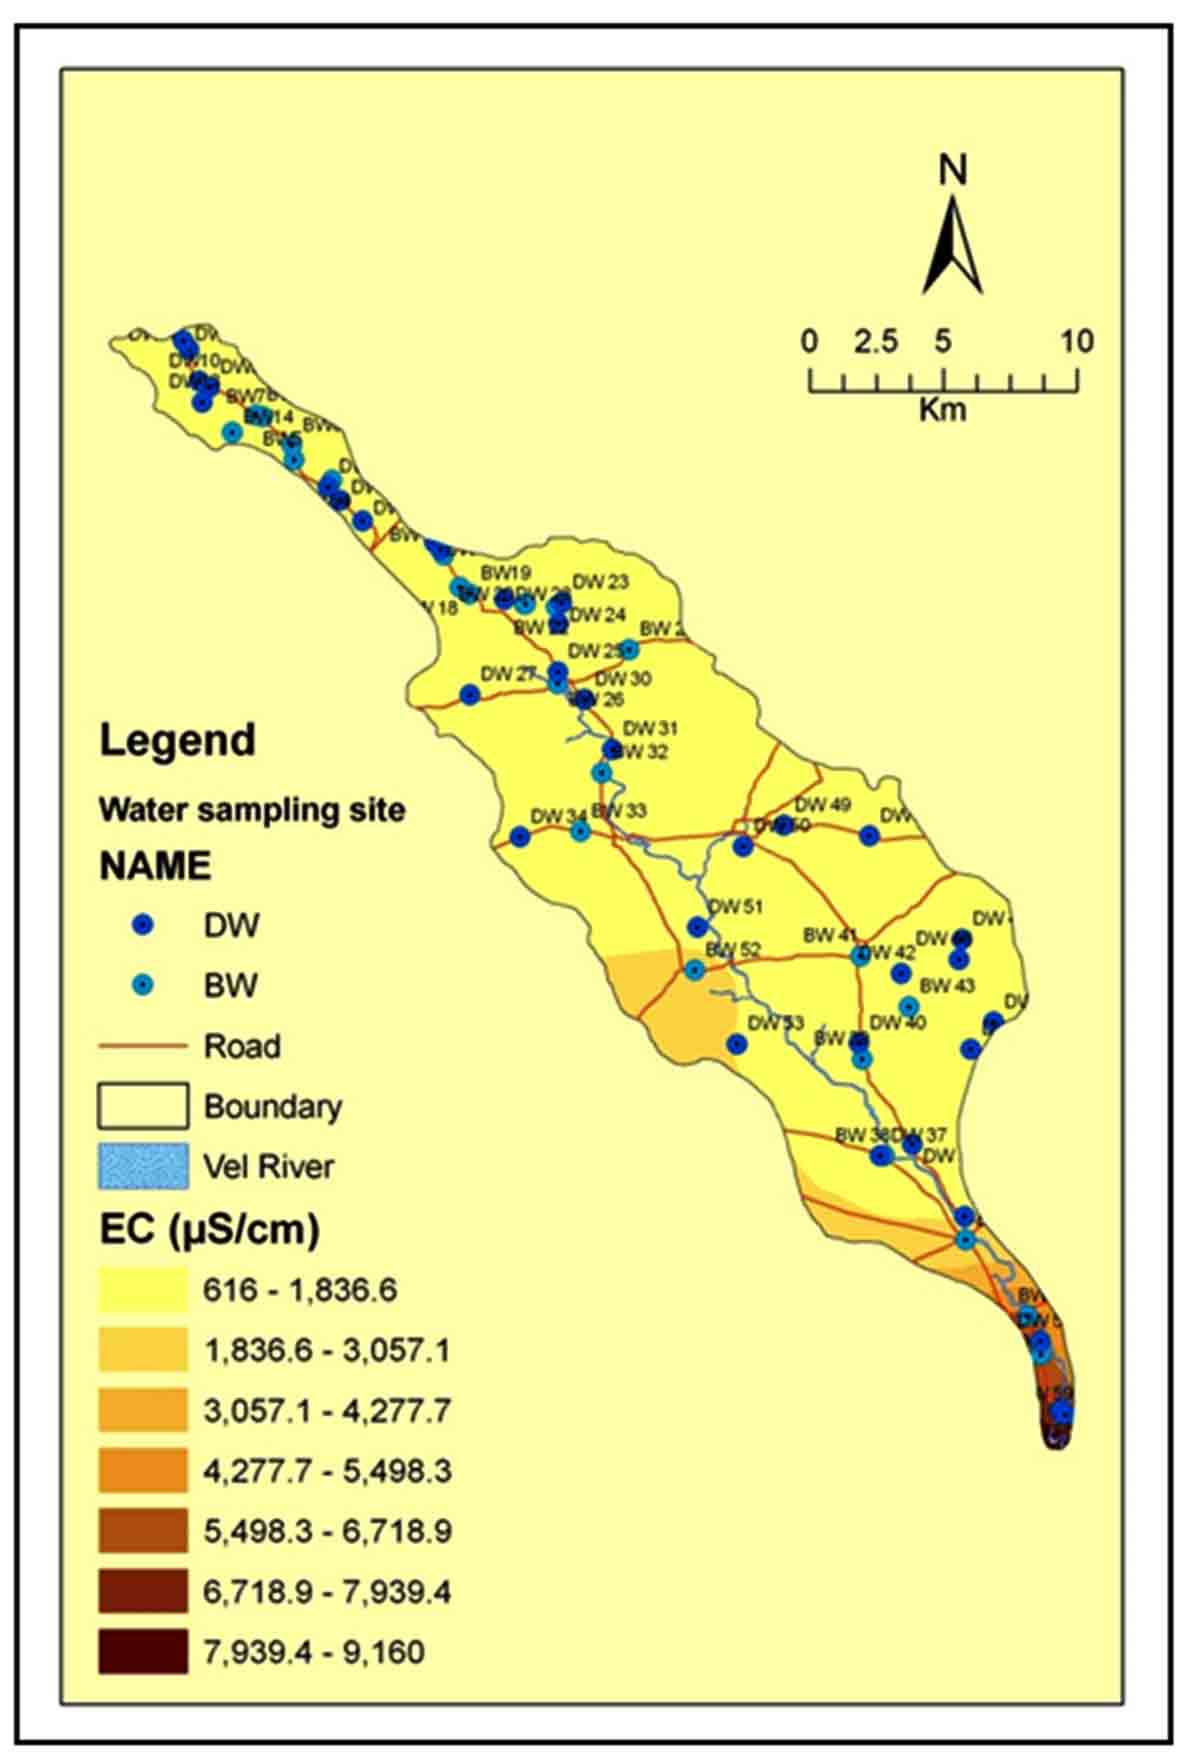
The high pH reported in the eastern and northern part of the basin while low is in the central parts (Figure 4). The pH is slightly alkaline (range: pH 7.0-8.1) which is due to loss of CO2 and mineral salts precipitation. High EC (9160 µS/cm) is observed towards lower part in the basin, while low EC value (616 µS/cm) is reported in BW-33 in middle part of the basin (Figure 5). So, an average values of EC (2641 µS/cm) is indicating high mineralization of groundwater (Pawar et al., 2008; Gaikwad et al., 2020a).
4.2 Spatial Variation in Cations
Calcium (Ca2+), Magnesium (Mg2+), Sodium (Na+) and Potassium (K+) are the main four cationic constituents in all types of waters (Pawar et al., 2008; Wagh et al., 2016; Gaikwad et al., 2020b).
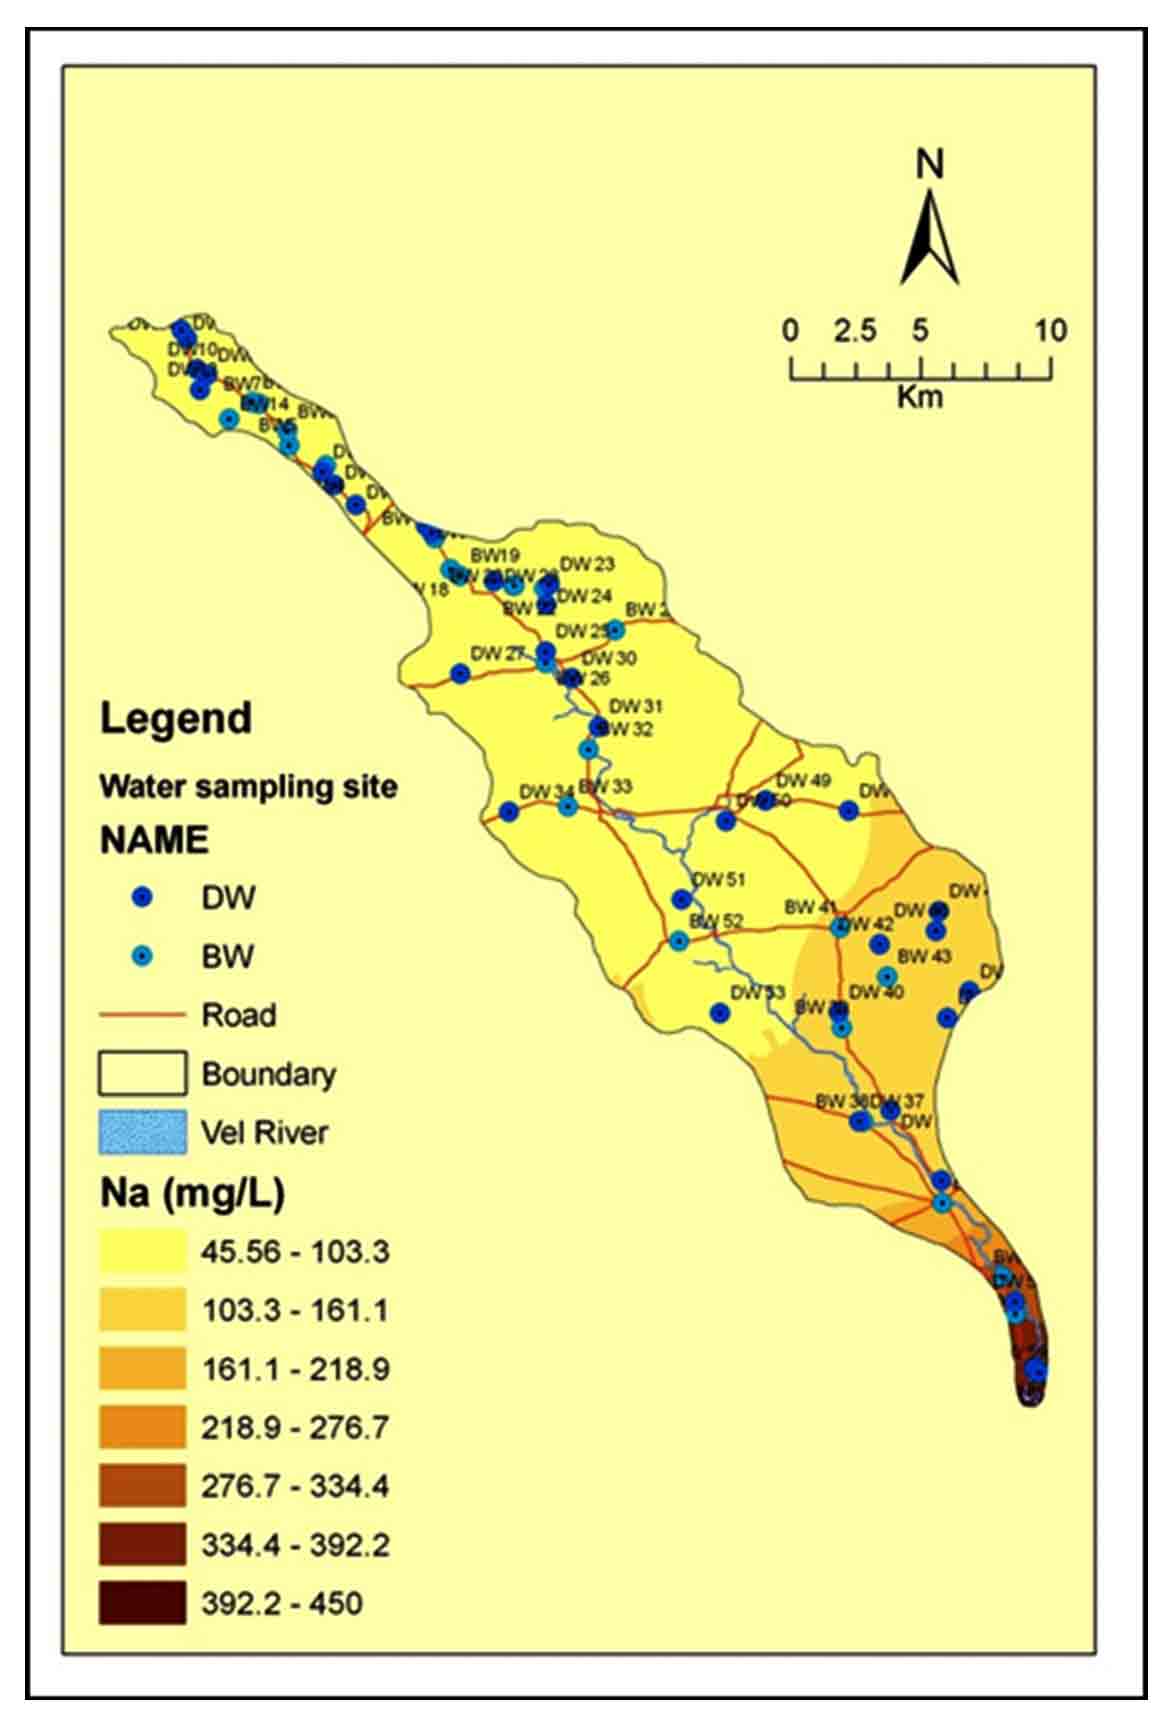
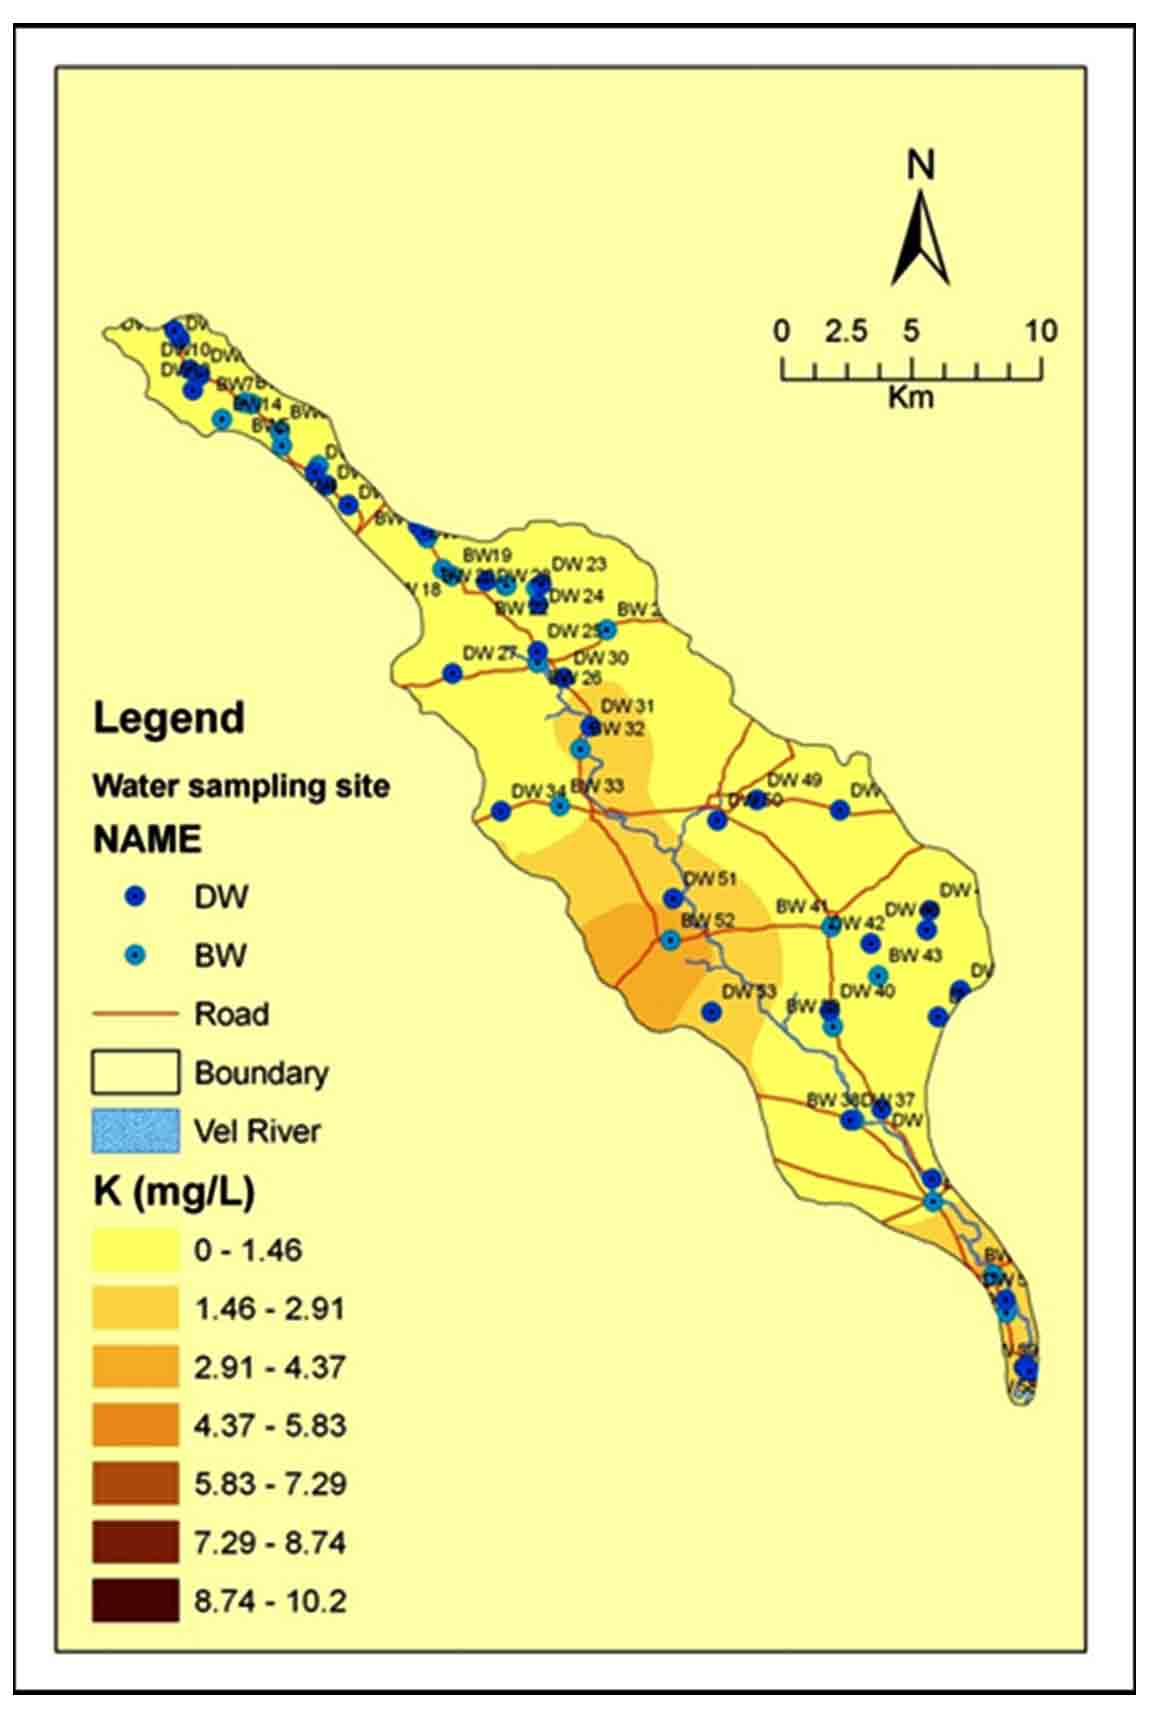
Increase in Na+ concentration from northwest to southeast due to hydro-geomorphological conditions (e.g., slope) (Figure 6). Low K+ (in Figure 7) concentration in groundwater observed due to non-appearance of K-bearing minerals (Subbarao et al. 1994; Pawar et al., 2008; Gaikwad et al., 2020a); excluding quiet increase in central part (BW-52) is excessive use of fertilizers (Pawar et al., 2008). Concentration of Mg2+ in groundwater ranges from 30.4 to 110.0 mg/L (Figure 9). In lower part of basin, high Mg2+ observed due to high salinity zone (Gaikwad et al., 2018).
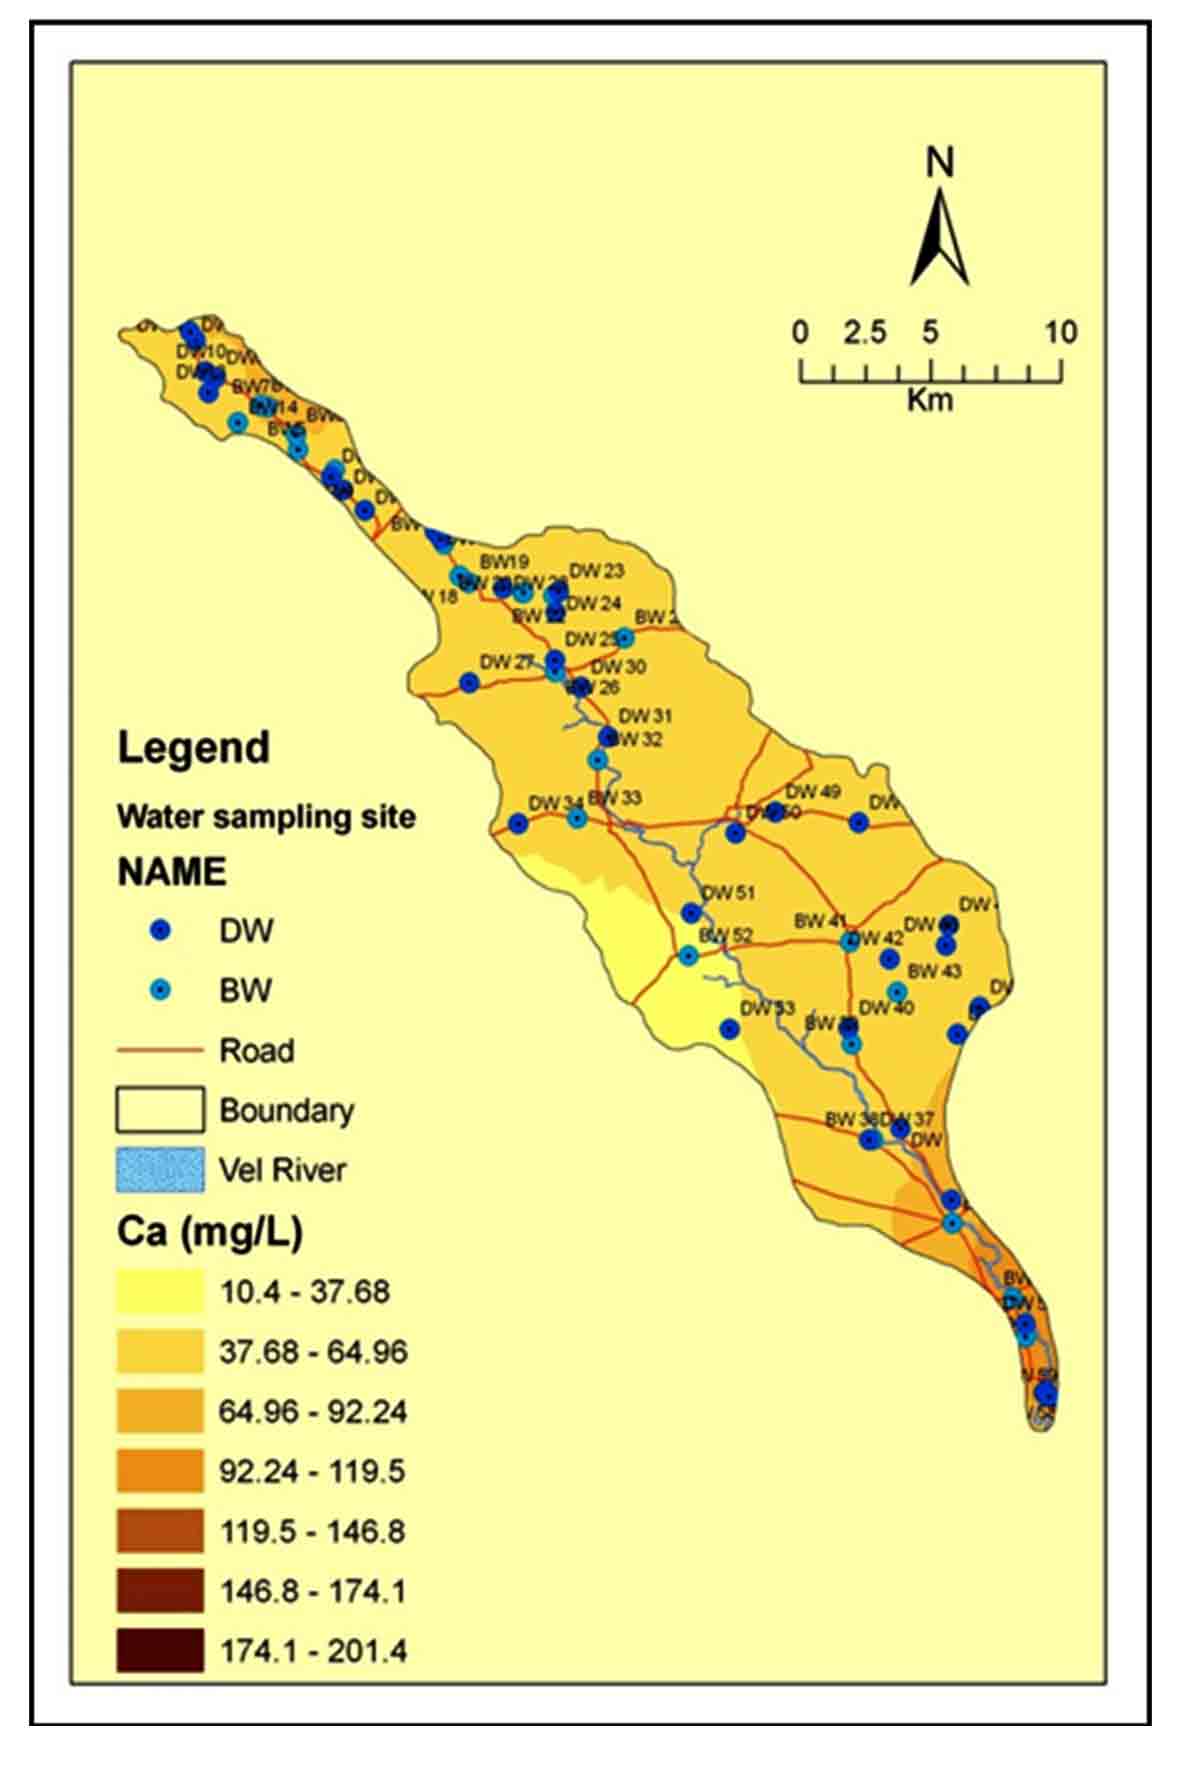
Elevated Ca2+ values are found in lower part of the basin (Figure 8). The average, Na+ + Ca2+ representing 75.4 % of total cations signify weathering of felsic minerals such as plagioclase feldspar is major supply from lithologies (Pawar et al., 2008; Wagh et al., 2018; Gaikwad et al., 2020a). While, Ca2+ + Mg2+ values accounts for 51.5 % (range: 28-69%) of the total cations indicating its supply is from olivine and pyroxene (Gaikwad et al., 2020b).
4.3 Spatial Variation in Anions
In anions, Bicarbonate (HCO3-) is the principal anion followed by, Chloride (Cl-) and Sulphate (SO42-).
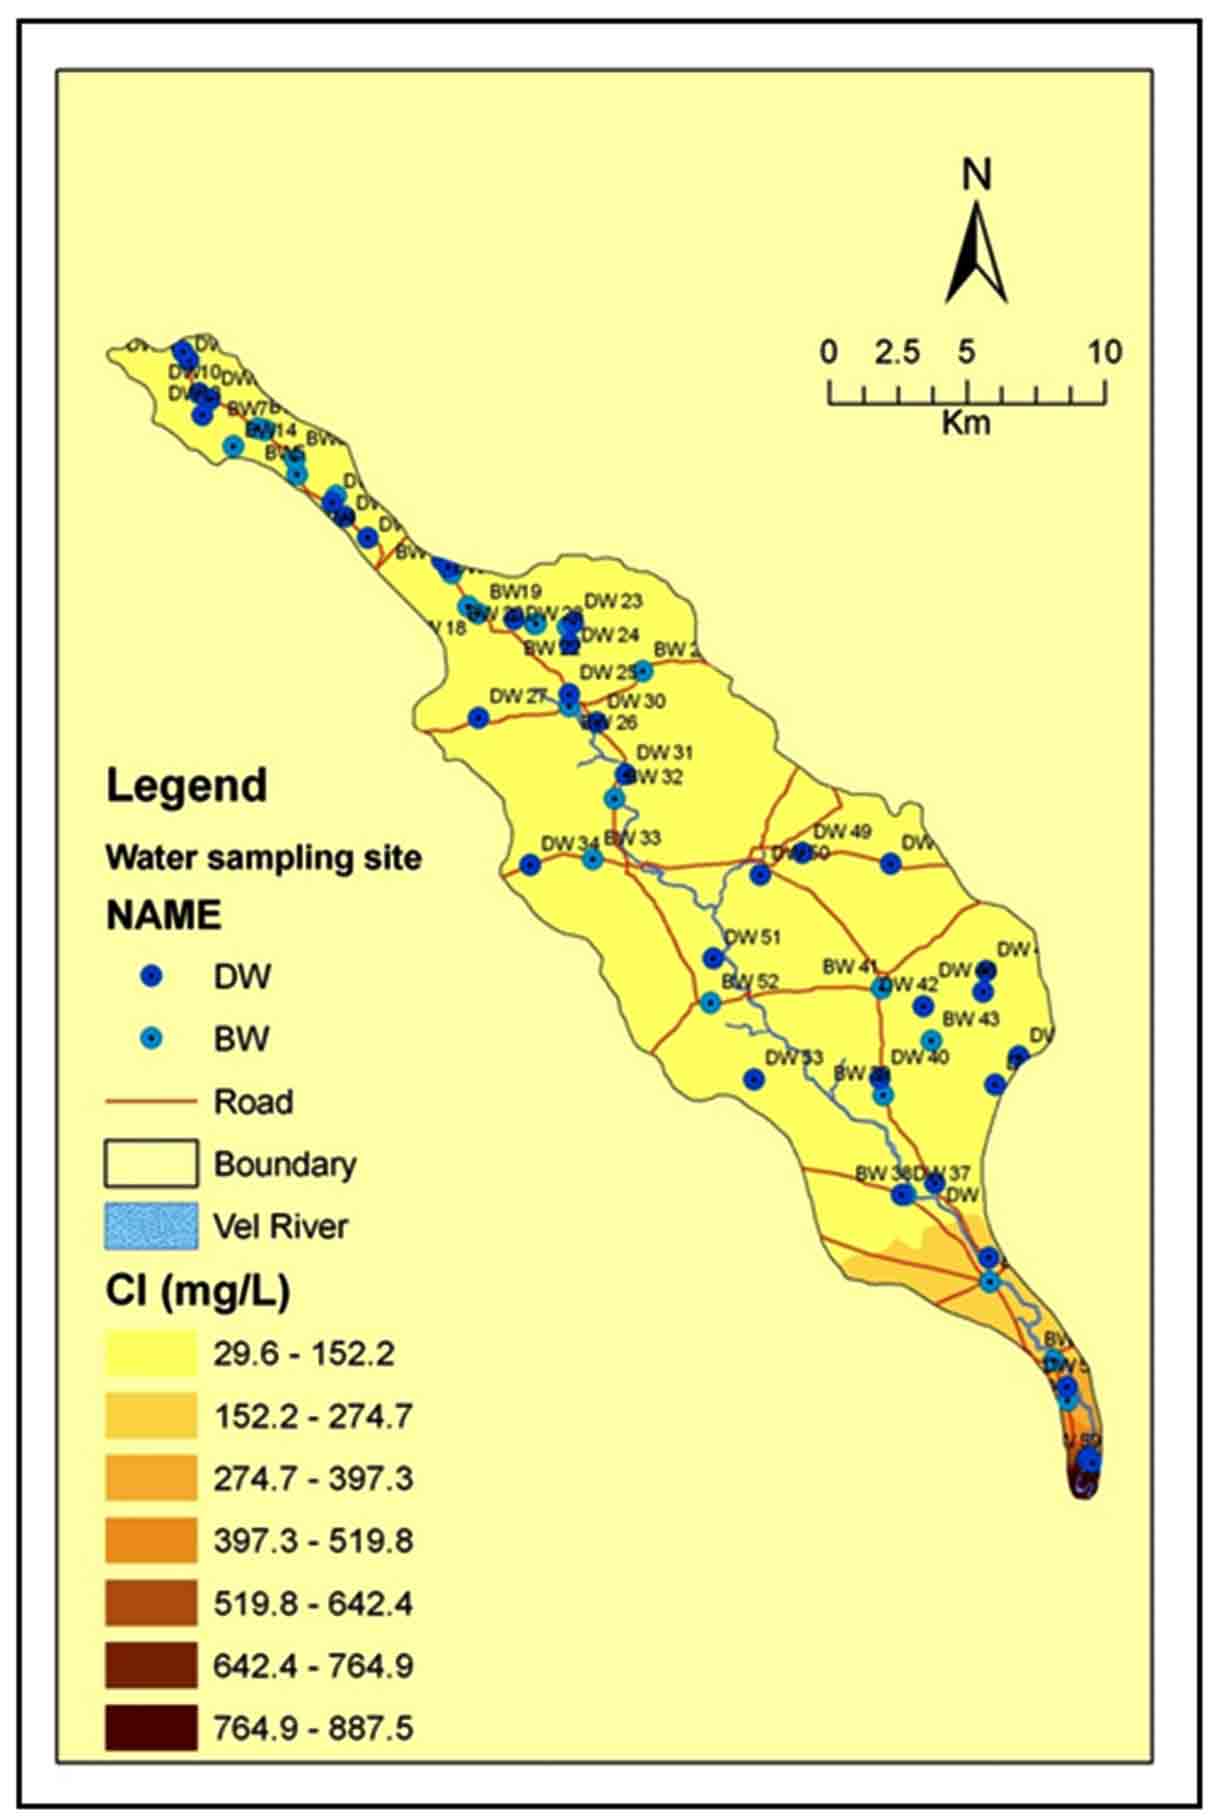
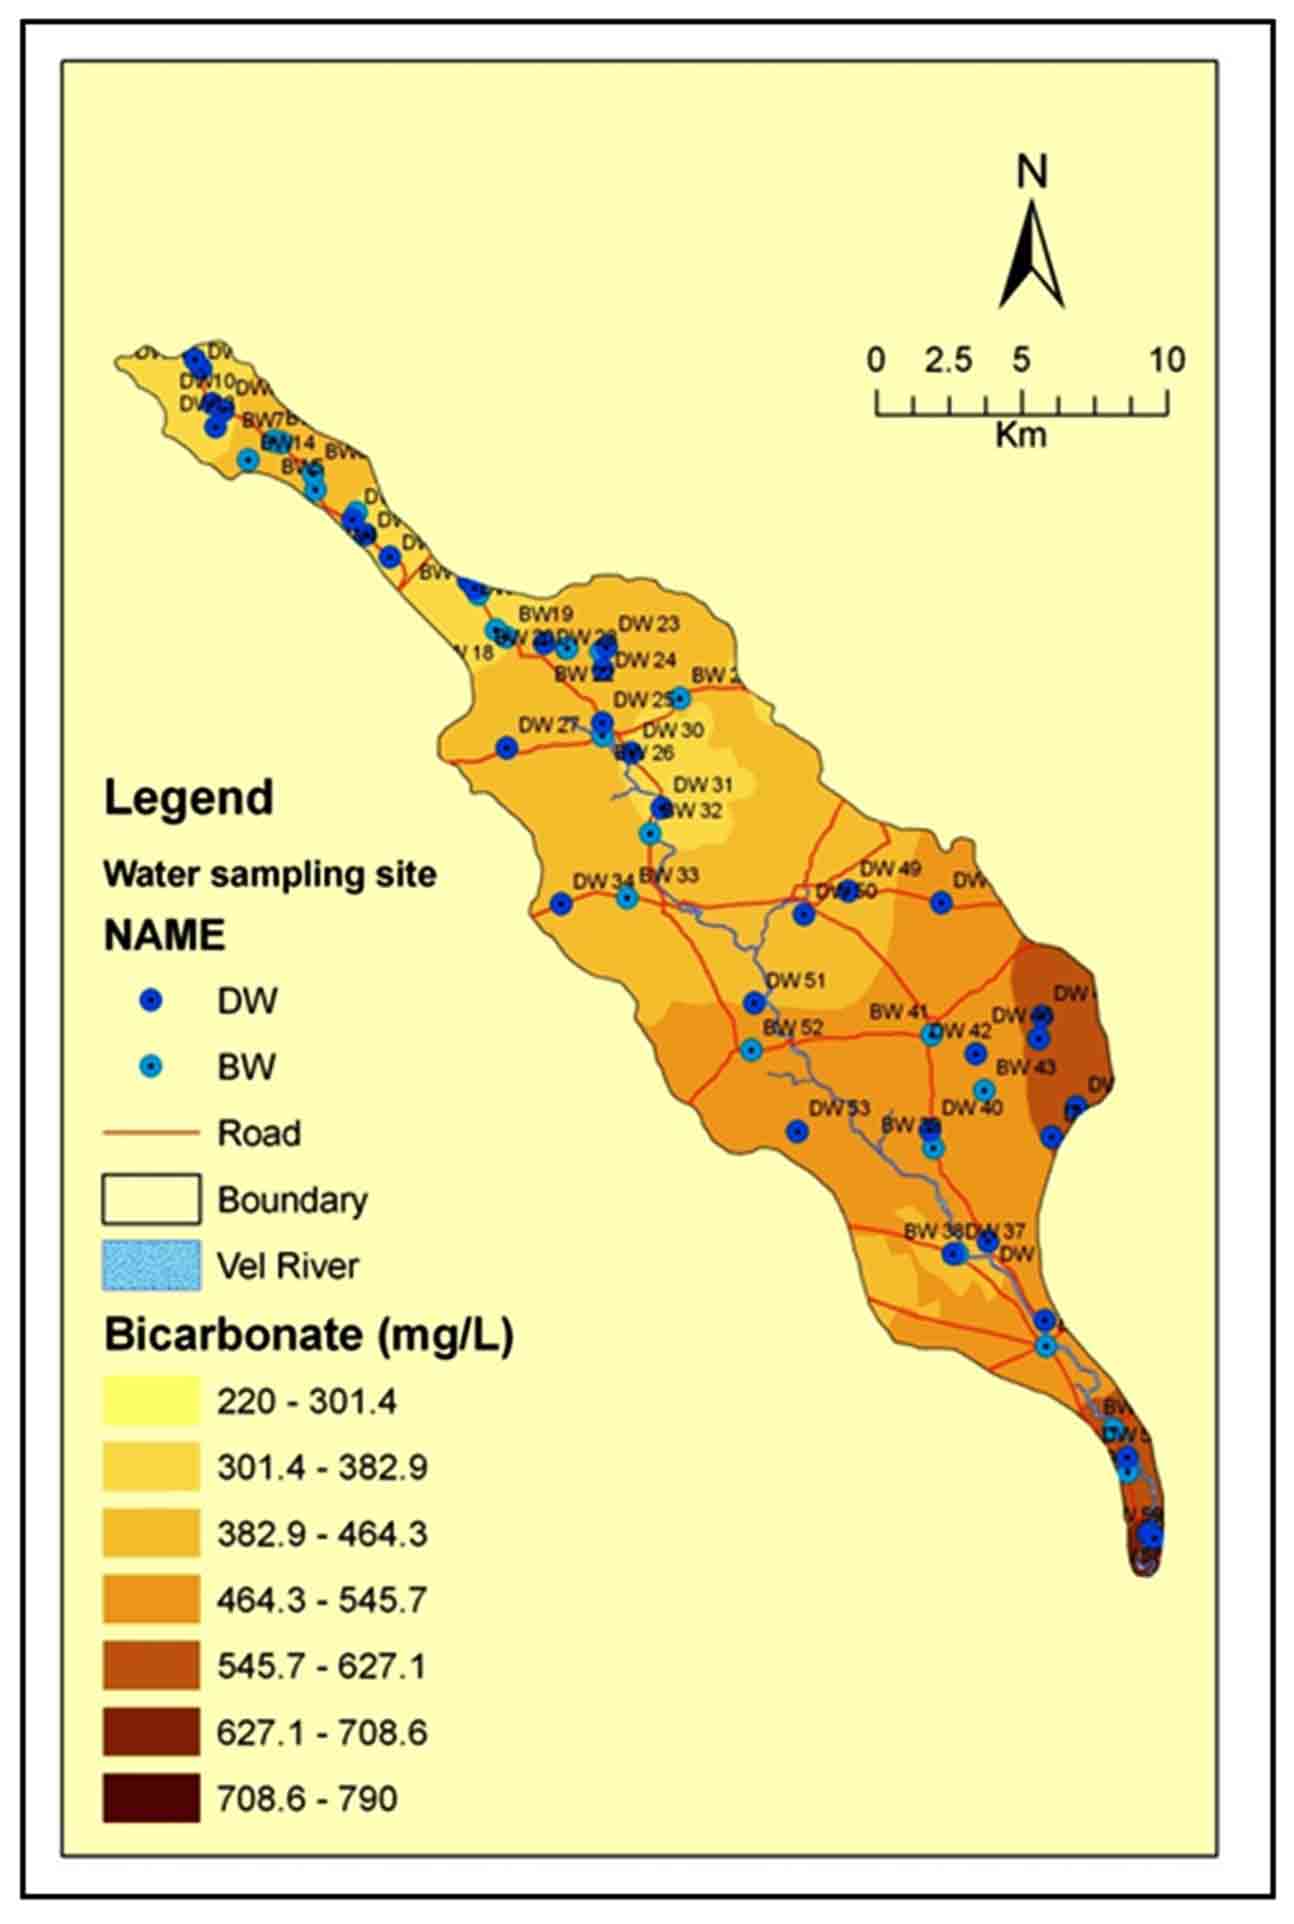
High values of Bicarbonate (HCO3-) are observed in central and upper parts of the study area while low in the southern side. High values of HCO3- in groundwater (Figure 11) entail abundant supply of CO2 by rainwater recharge and availability of larger surface area for rock-water interaction and vice-versa (Matthess and Harvey, 1982; Drever, 1982; Pawar et al., 2008). Chloride ranges from 29.6 to 888 mg/l with average of 235 mg/L. High concentrations of chloride is observed in the lower part of the basin (Figure 10). Thus, lower and high concentrations of Cl- corresponding with recharge and discharge zones, respectively (Gaikwad et al., 2020b).
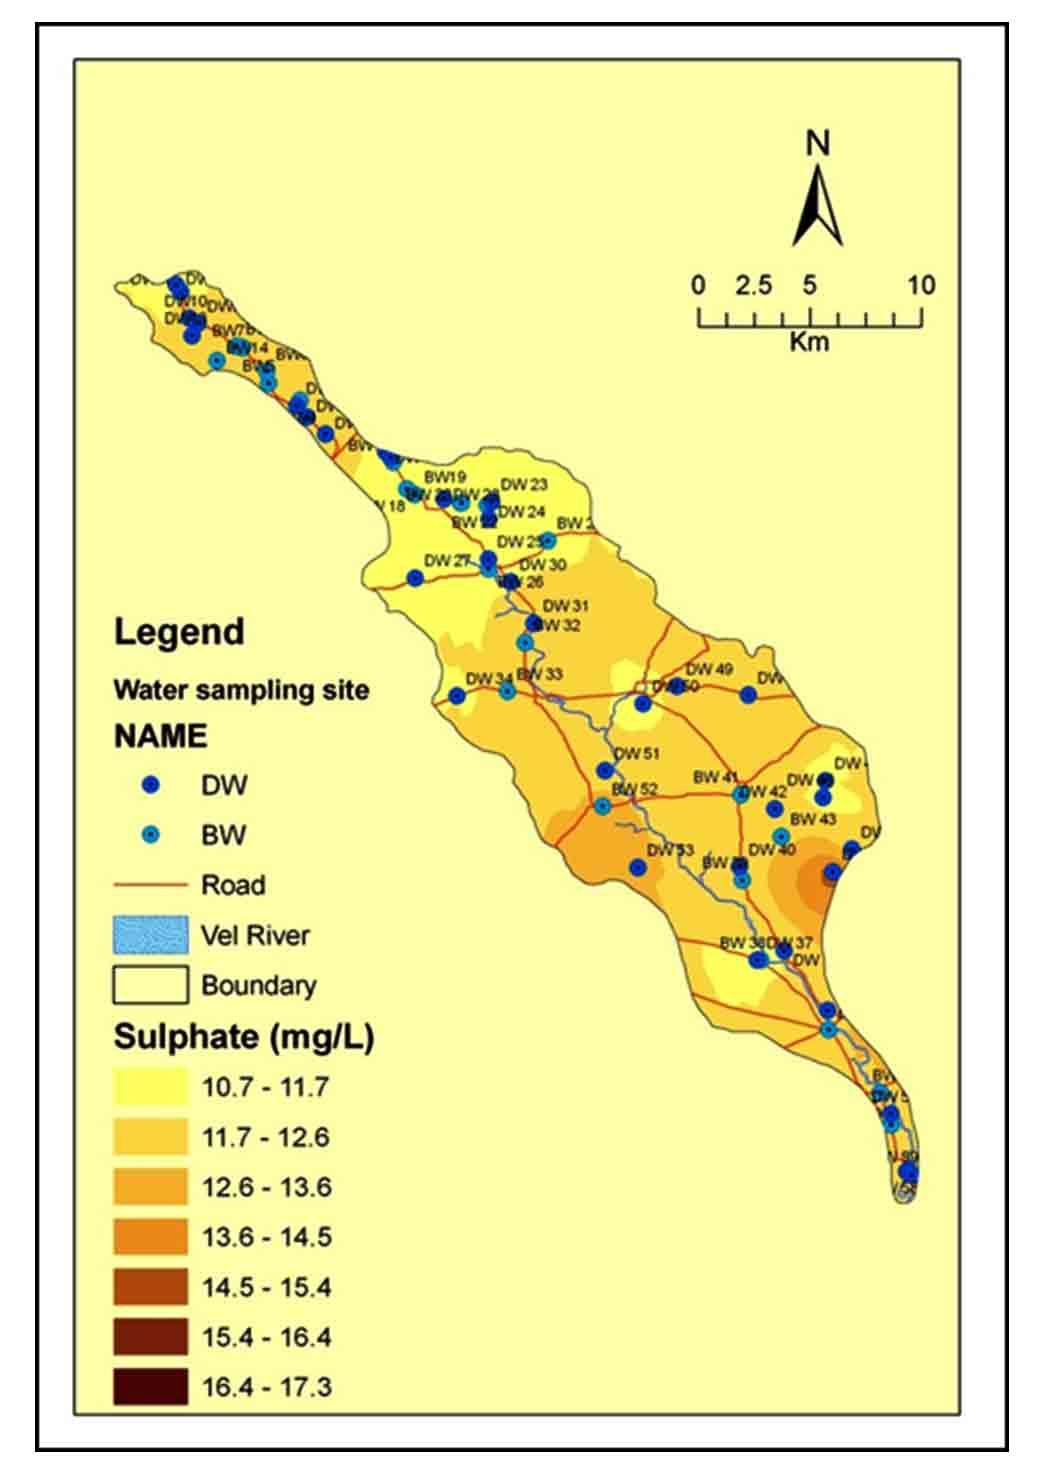
High concentration of chloride (888 mg/L in BW-55), is due to the combination of high evaporation, deeper source and use of fertilizers (Figure 10). High concentrations of SO42- are reported in lower part i.e. south central part, while low concentration is in upper part of the basin (Figure 12). But high concentration in central part may be due to the use of excess fertilizers and agricultural runoff (Pawar et al., 2008; Wagh et al., 2018).
4.4 Geochemical Plots
In study of hydrochemical evolution it is imperative to know geological inputs, agricultural activities, precipitation and climatic condition, that are influencing the chemistry of groundwater (Wagh et al., 2018).
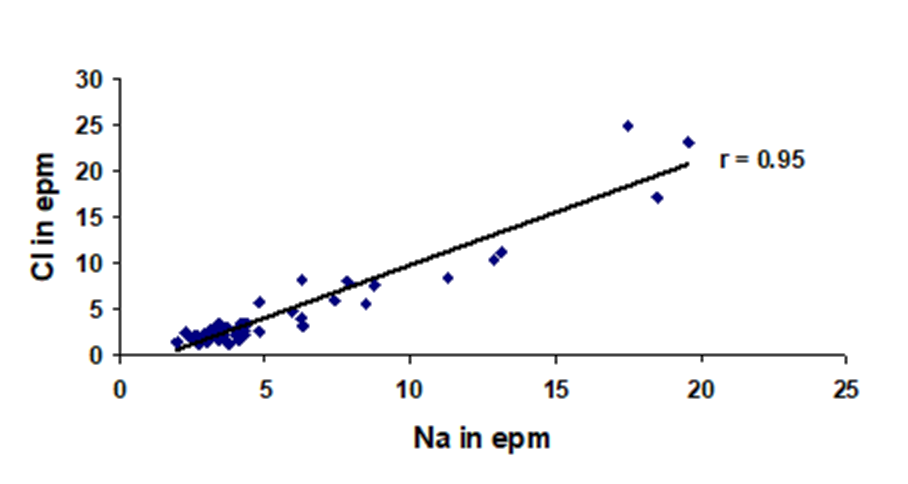
The Na+ vs. Cl- scatter diagram (Figure 13) shows positive correlation (r = 0.95) in post monsoon season indicating combined influence of anthropogenic activities and ion exchange (Gaikwad and Pawar, 2008; Tiwari and Singh, 2014; Wagh et al., 2018; Gaikwad et al., 2020).
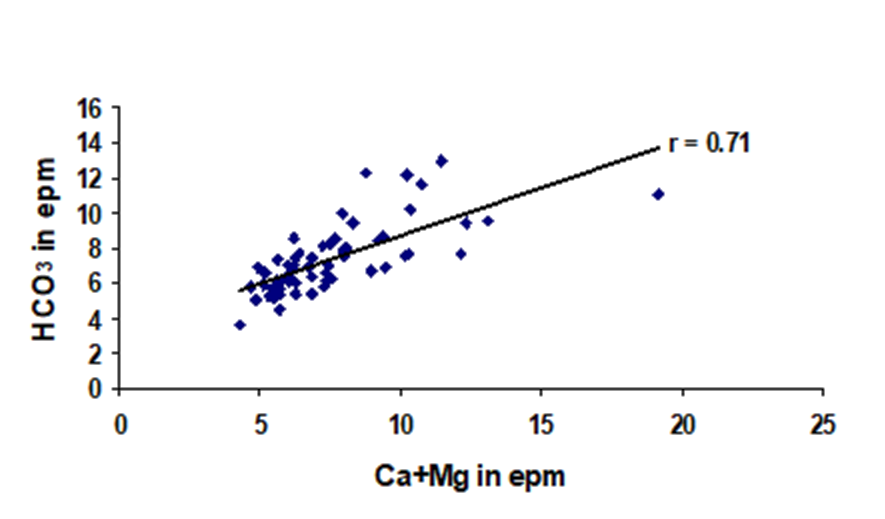
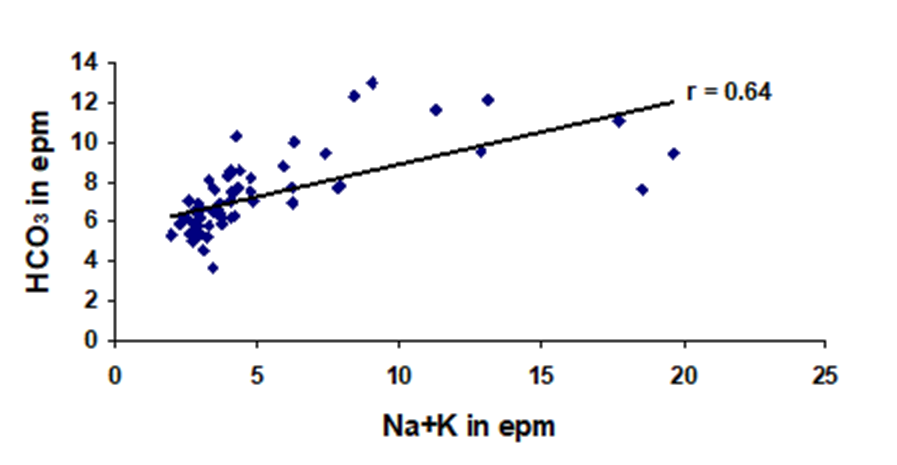
Similarly the cross plot of Ca2++Mg2+ vs. HCO3- (Figure 14) depicts a positive correlation (r = 0.71), indicating influence of mafic minerals on groundwater geochemistry (Sami, 1992; Pawar et al., 2008; Wagh et al., 2018; Gaikwad et al., 2020a). The cross plot Na++K+ vs. HCO3- plots also shows positive correlation (r = 0.64), suggesting that there is a contribution of ions from felsic lithologies in the area (Figure 17) (Pawar et al., 2008; Gaikwad et al., 2020a).
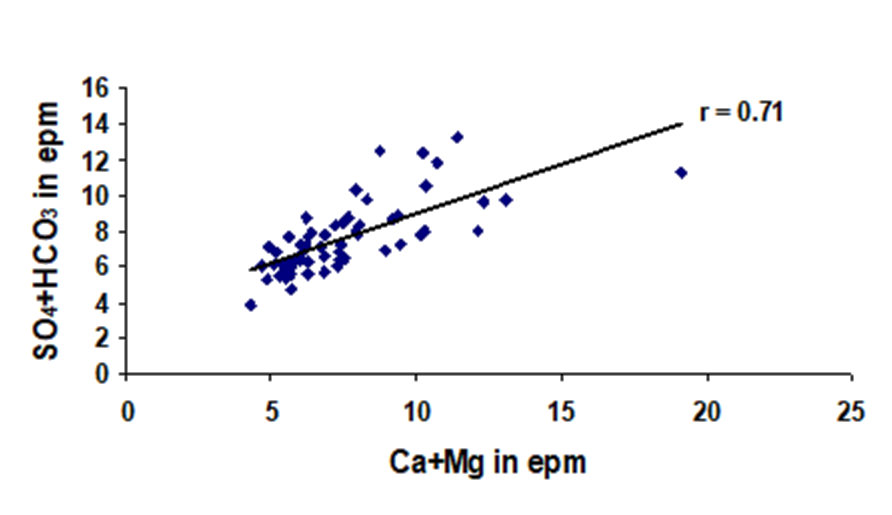
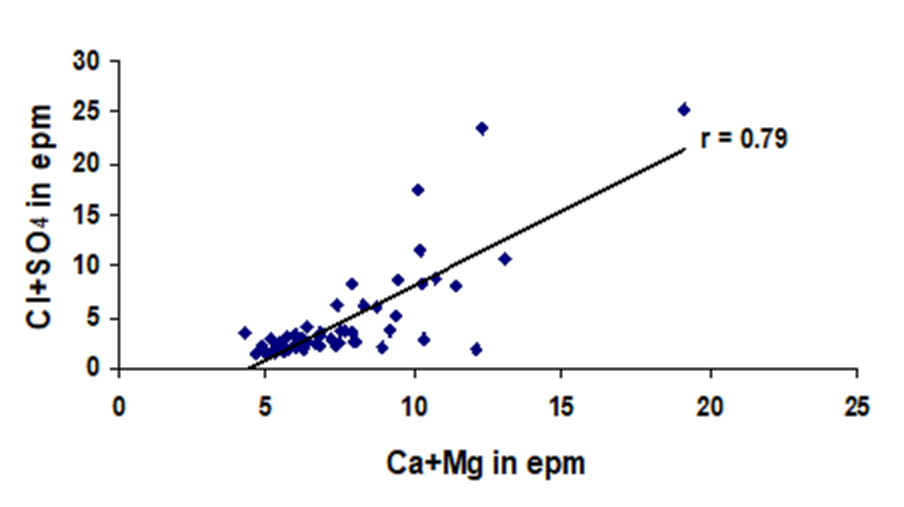
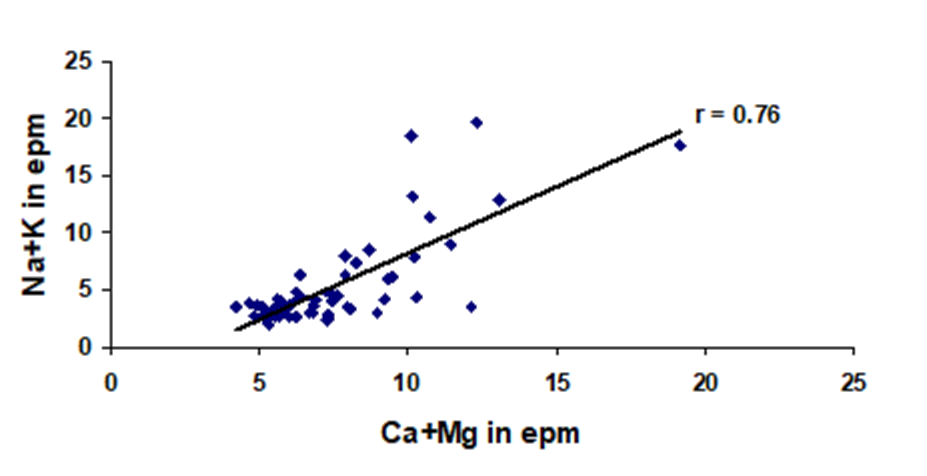
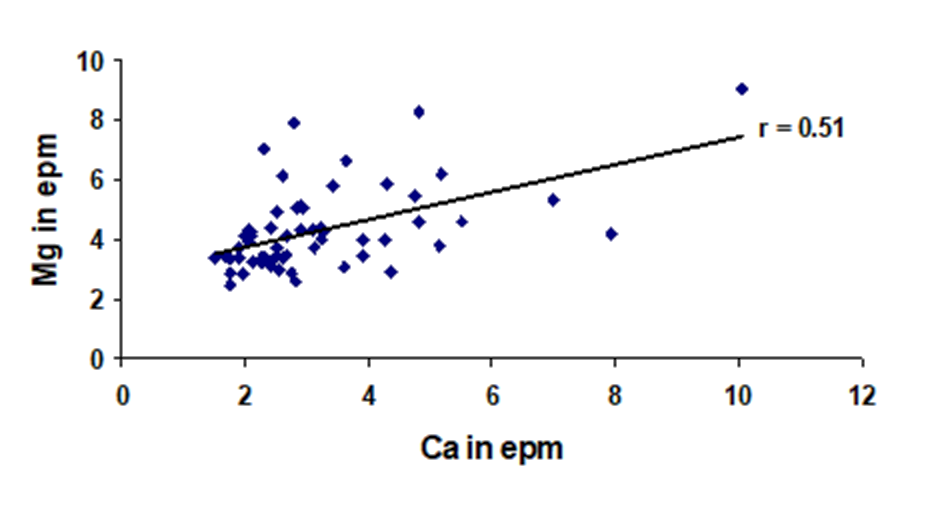
The plots of Ca2+ + Mg2+ vs. Cl- + SO42- (Figure 16) and Ca2+ + Mg2+ vs. SO42- + HCO3- (Figure 15) also show positive correlation (r=0.79 and 0.71, respectively), indicating that these are preferred ion pairs from silicate and carbonate lithologies (Pawar et al., 2008; Wagh et al., 2018; Gaikwad et al., 2020). The correlation between Ca2+ + Mg2+ vs. Na+ + K+ is also positive (r = 0.76), suggesting additions of ion from weathering of silicate rocks in the area (Figure 18) (Pawar et al., 2008; Gaikwad et al., 2020a). The positive correlation coefficients between Ca2+ and Mg2+ (r = 0.51), further confirm this reflecting role of Fe-Mg bearing silicates as their source (Figure 19).
In the (Ca2+ + Mg2+) vs. (HCO3- + SO42-) (Figure 15) scatter diagram, the ionic concentrations in meq/L are falling both the side of equiline indicating both carbonate and silicate weathering. Such a plot also shows that Ca2+ +Mg2+ are in excess of HCO3- possibly pointing to the process of ion exchange reaction (Rajmohan and Elango, 2004; Wagh et al., 2018).
4.5 Hydrochemical Facies
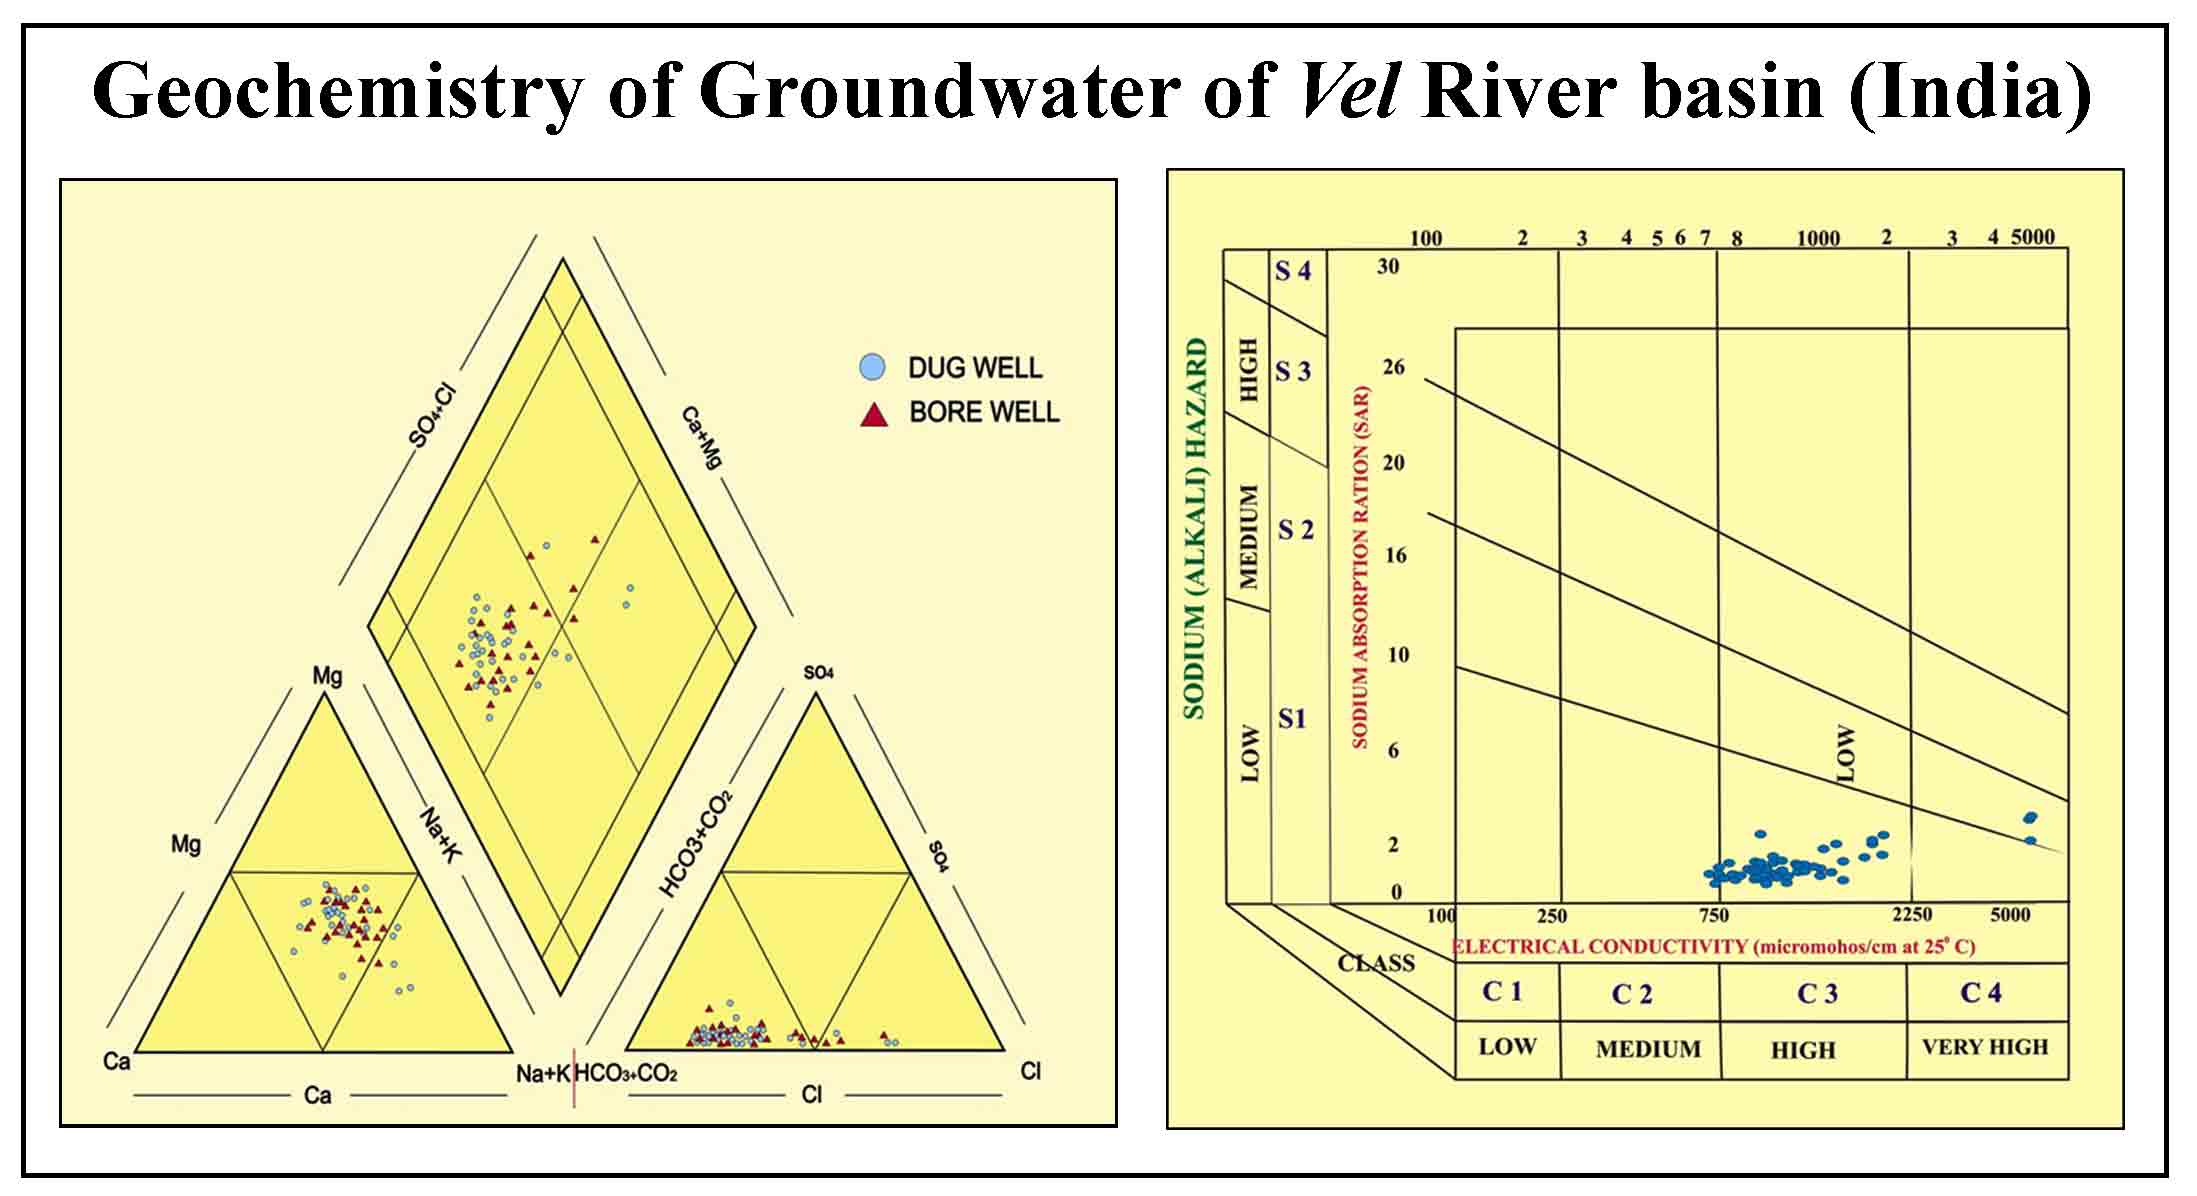
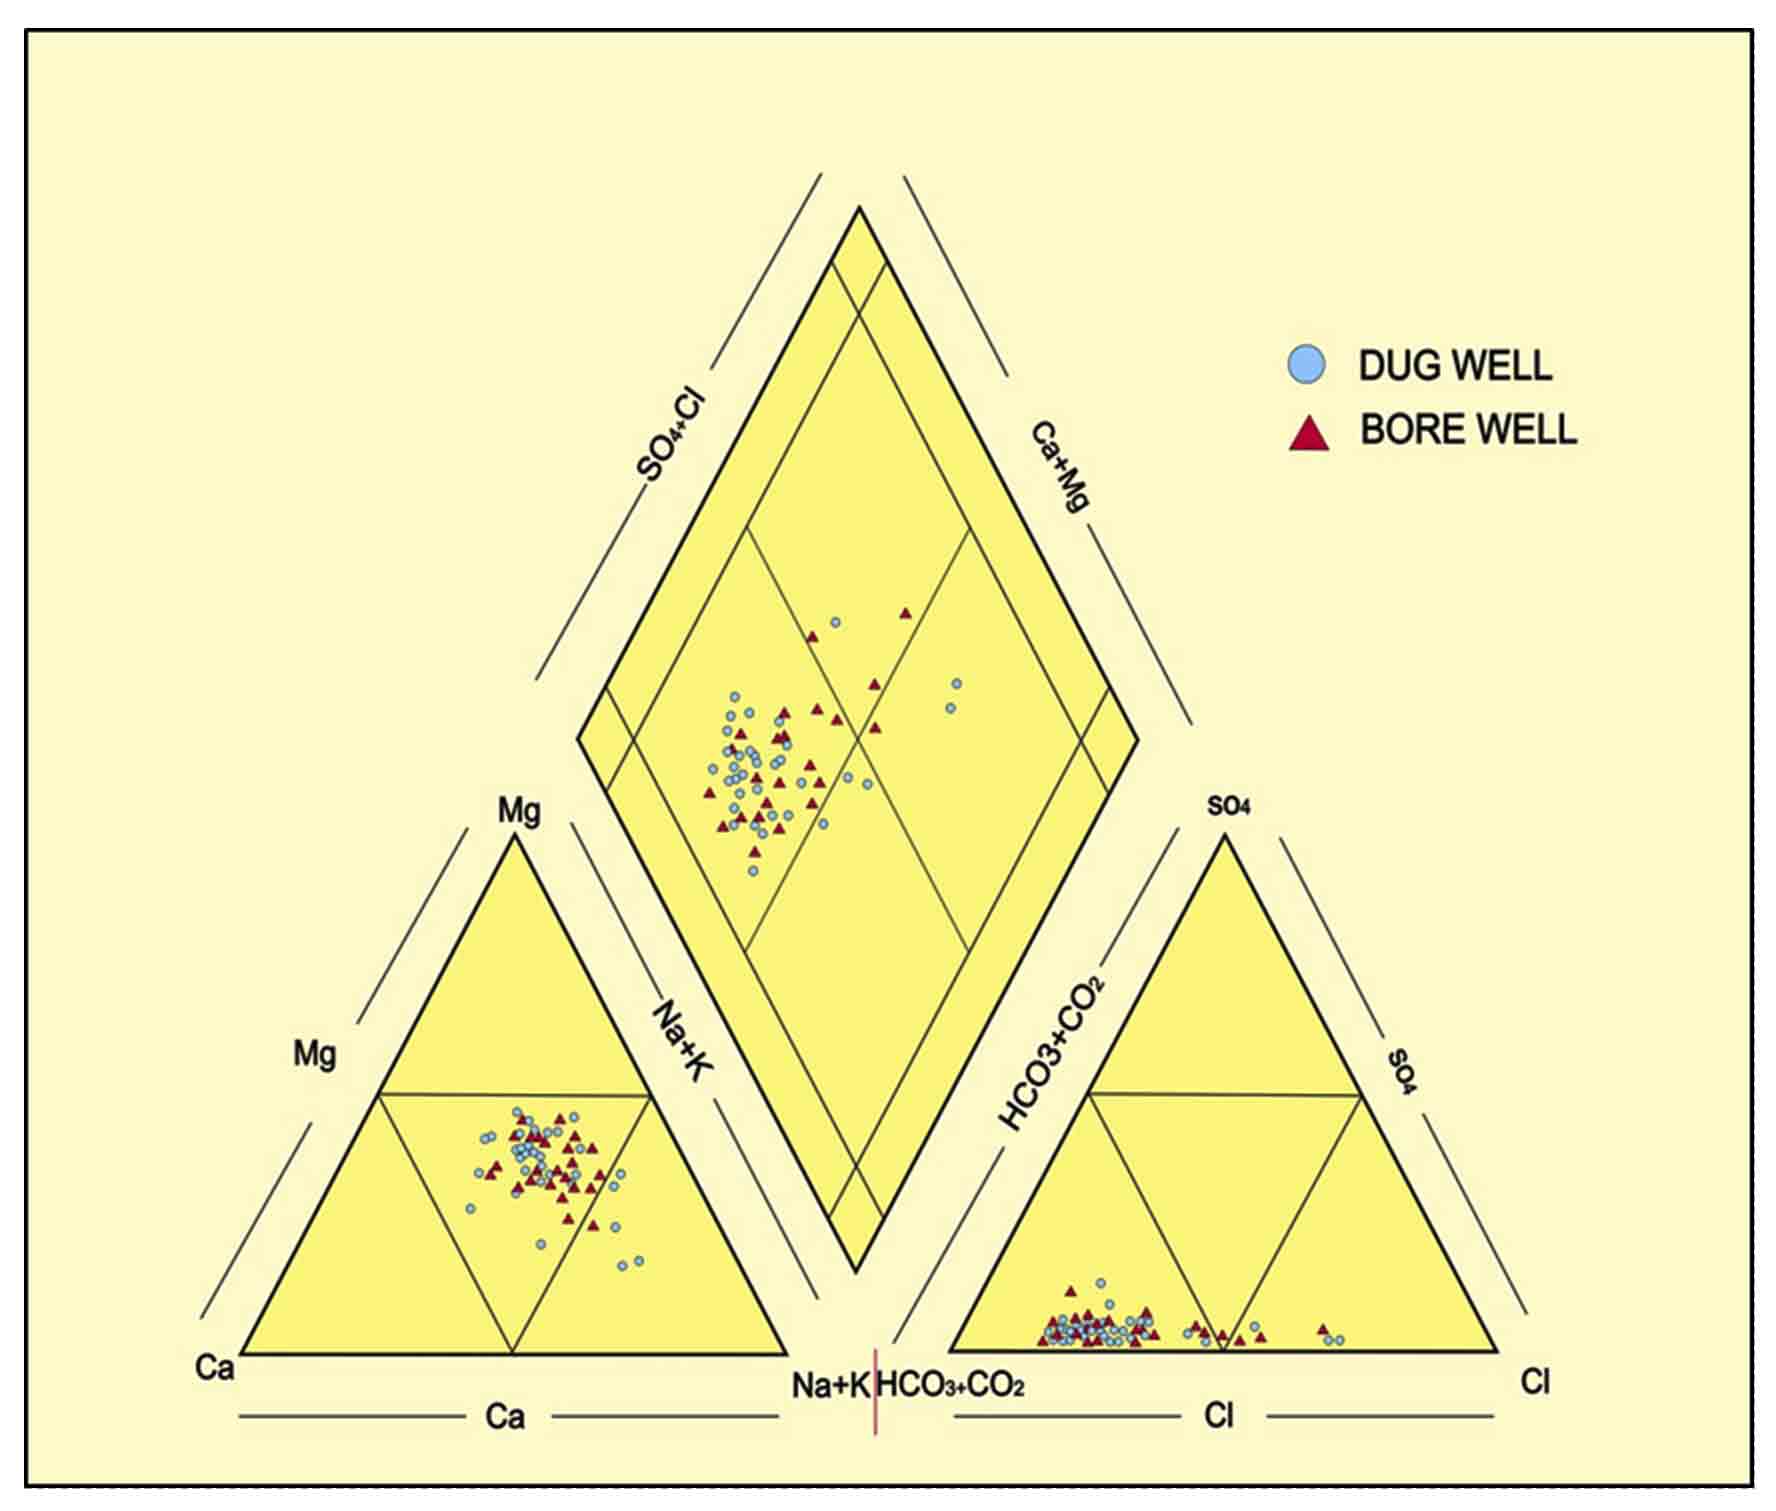
Physiochemical data of groundwater plotted on Piper Trilinear diagram to know its facies (Piper, 1944). The details are shown on figure 20 and given in table 2. The dominant hydrochemical facies Ca2+ + Mg2+, Na+ + K+; Cl- + SO42- HCO3- facies, found in 83.3 % samples indicating the alkaline earth is exceeding the alkalis and the strong acids exceeds the weak acids (Table 2).
Table 2. Source wise hydro-chemical facies of groundwater
|
Hydrochemical Facies
|
Sample No.
|
Total
|
|
Ca2++Mg2+, Na++K+, HCO3-, Cl-+SO42-
|
DW-1, 2 ,3,8 ,9,10, 11, 12, 13, 15, 16, 23, 24,25, 27, 30, 31, 34, 36, 37,40,42,44,46,47,48,49,50,51,53
BW- 4, 5, 6,7,14,17,18,19,20,21,22,26,28, 29, 32, 33, 38, 39, 41, 52
|
DW-30,
BW-20
|
|
Na++K+, Ca2++Mg2+, HCO3-, Cl-+ SO42-
|
DW-58.59,55
|
DW-3
|
|
Ca2++Mg2+, Na++K+, Cl-+ SO42-, HCO3-
|
DW-35
BW-54,55,60
|
DW-1,
BW-3
|
|
Na++K+, Ca2++Mg2+, Cl-+ SO42-, HCO3-
|
DW-56,57
BW-43
|
DW-2,
BW-1
|
4.6 Quality of Groundwater
The quality of water is very important to the mankind, because it has a direct link with human health and welfare. As the study area is falls in the zone of low rainfall, high temperature, and drastic evaporation, which modifies the quality naturally with anthropogenic activities and its pollution (Wagh et al., 2020; Gaikwad et al., 2018).
4.7 Groundwater Quality for Drinking Purposes
The water to be used for drinking purposes should be pure from physical, chemical and biological point of view (Nikumbh, 1997). The data compared with World Health Organization standards found that pH, Total Hardness (TH) and Magnesium (Mg2+) of the samples are more % of samples falling above Desirable limit. Otherwise the quality of groundwater is good for drinking (Table 3).
Table 3. Groundwater qualities for drinking purposes (WHO, 1997)
|
Parameter
|
Permissible limits
|
Samples above limit (%)
|
|
pH
|
6.9 - 8.5
|
100 %
|
|
EC
|
1500 µmhos/cm
|
18.3%
|
|
TH
|
100-500 mg/l
|
98.3 %
|
|
Na+
|
200-600 mg/l
|
31.6 %
|
|
K+
|
30 mg/l
|
0 %
|
|
Ca2+
|
75 - 200 mg/l
|
15 %
|
|
Mg2+
|
50-150 mg/l
|
46.6 %
|
|
Cl-
|
200- 600 mg/l
|
16.6 %
|
|
SO42-
|
200- 400 mg/l
|
0 %
|
|
HCO3-
|
----
|
----
|
4.8 Groundwater Quality for Irrigation
Total dissolved solids (TDS), proportion of Na+, HCO3- with Ca2+ and Mg2+ and toxic substances present in water are major factors for irrigation quality point of view (Alamary, 2005). Along with these, soil properties, water table depth, slope, climatic condition and crop pattern also affect it. Different parameters like Sodium Absorption Ratio (SAR), Soluble Sodium Percentage (SSP) and Kelly ratio (KR) have been calculated to analyze the quality of water for irrigation. The details of it have been given in Table 1 and 4. It is found that according to the SAR parameters all samples are excellent to good for irrigation. In SSP, 33.3 % samples are permissible, while 66.6% samples are doubtful for irrigation purpose. In KR, almost all samples (excluding 04 samples in lower side of basin) are suitable for irrigation.
Table 4. Irrigation quality parameters
|
Irrigation Quality Parameters (meq/L)
|
Range
|
Classification
|
Number of Samples (%)
|
|
Sodium Absorption Ratio (SAR) ()
\(SAR = {Na^+ \over {\sqrt{Ca^{2+}+ Ma^{2+}} \over 2}}\)
|
< 10
10-18
18-26
>26
|
Excellent
Good
Doubtful
Unsuitable
|
100 %
----
----
----
|
|
Soluble Sodium Percentage (SSP) (Eaton, 1950)
\(SSP = (Na^+) \times 100 / Ca^{2+} + Mg^{2+}+ Na^++K^+\)
|
< 20
20 - 40
40 - 80
> 80
|
Good
Permissible
Doubtful
Unsuitable
|
----
33.3 %
66.6 %
|
|
Kelley’s Ratio (KR) (Kelly, 1951)
\(KR= Na^+ / (Ca^{2+} + Mg^{2+})\)
|
<1
>1
|
Suitable
Unsuitable
|
93.3 %
6.6 %
|
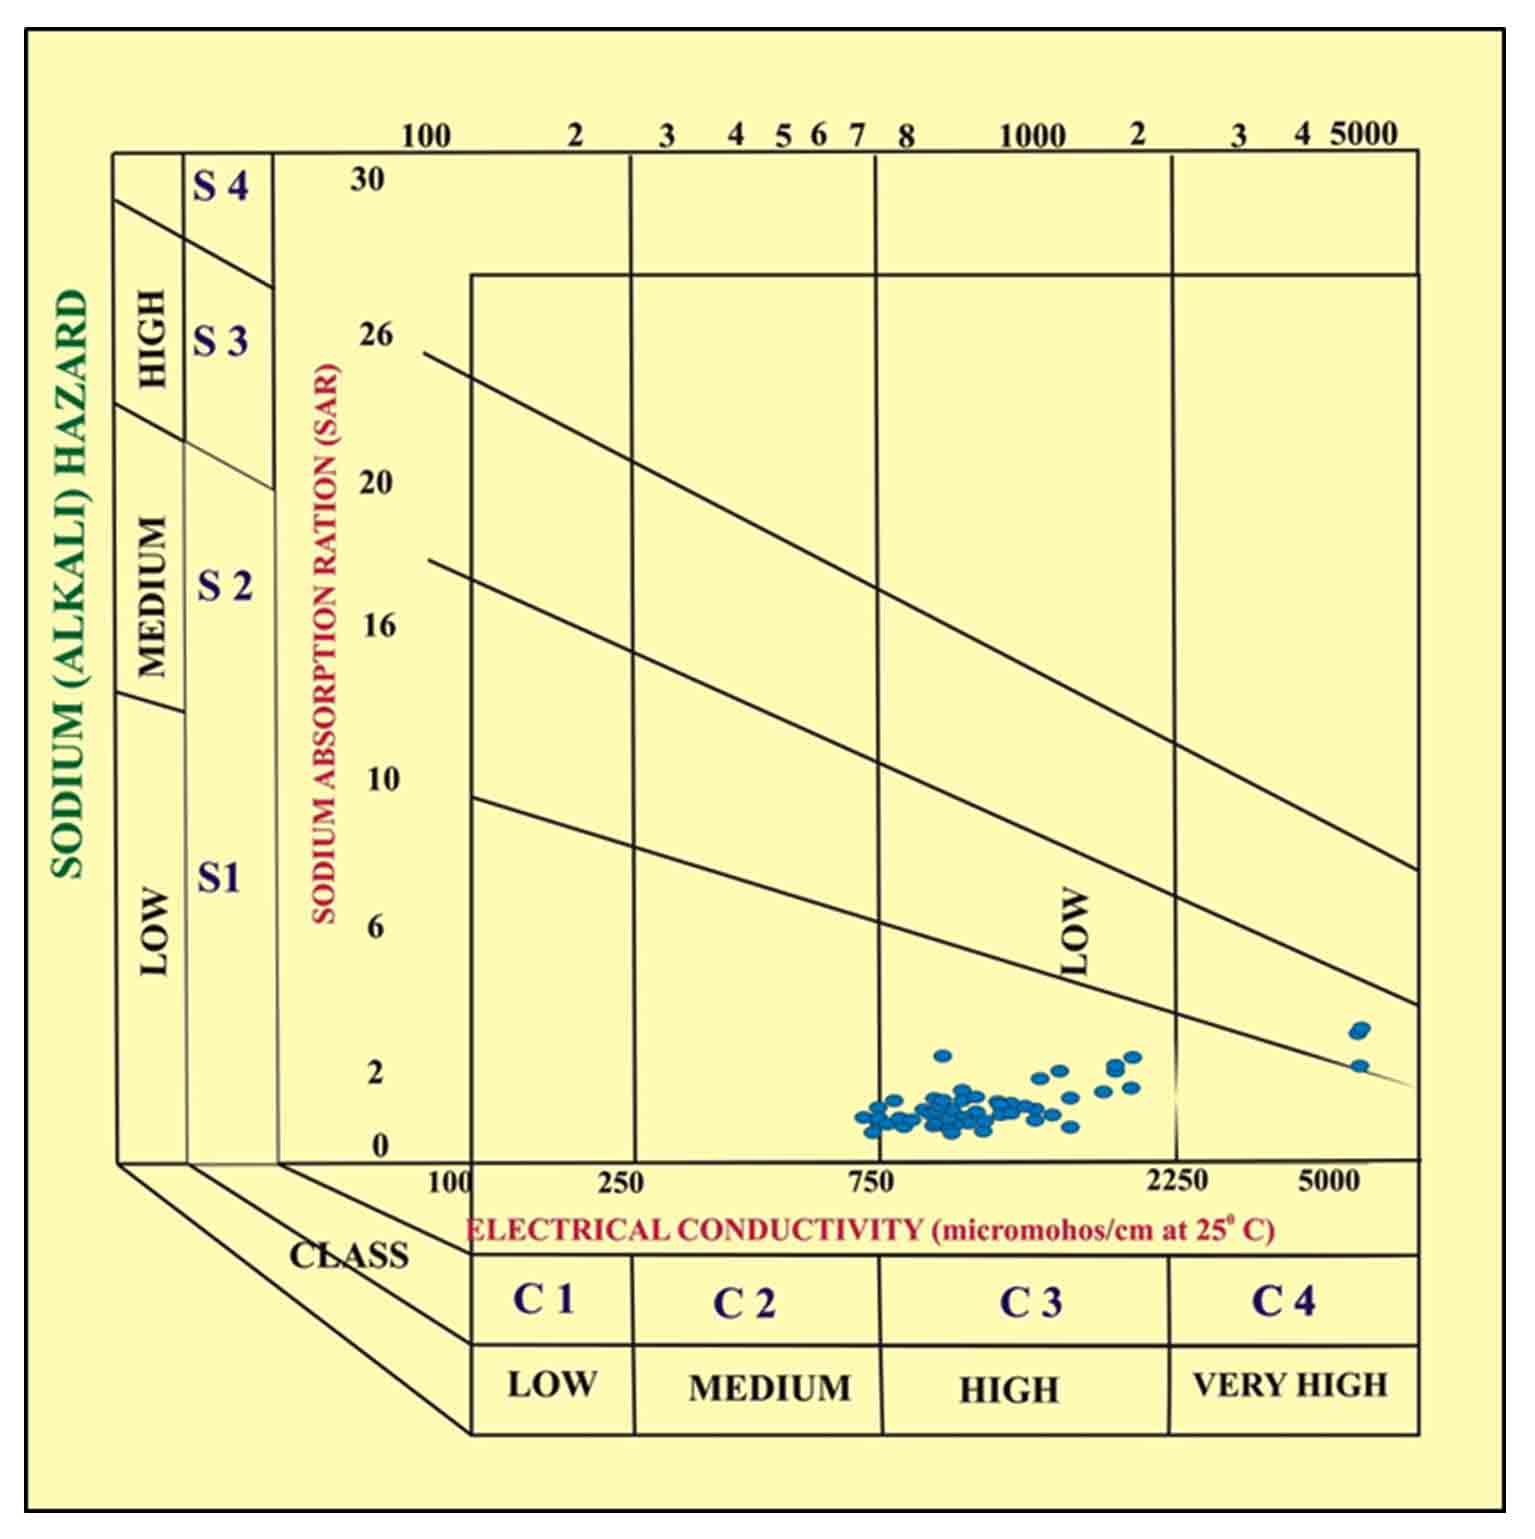
The US Salinity Laboratory Staff diagram (USSL, 1954) is used to study water quality for irrigation (Figure 21). About 8.3 % samples classified in C2-S1 category indicating low salinity and sodium hazard, while 85.06 % of samples falling in C3-S1 category indicating low salinity hazard but medium sodium hazards. Remaining 6.6 % samples of the lower reaches of the river are falling in C4-S1 zone indicating very high salinity hazard and low sodium hazard. According to Adimalla and Venkatayogi (2018a) high salinity affects the growth of crops and can create nutritional disorders.


 ,
Nasir Pathan 1
,
Nasir Pathan 1
 ,
Tejas Naik 1
,
Tejas Naik 1