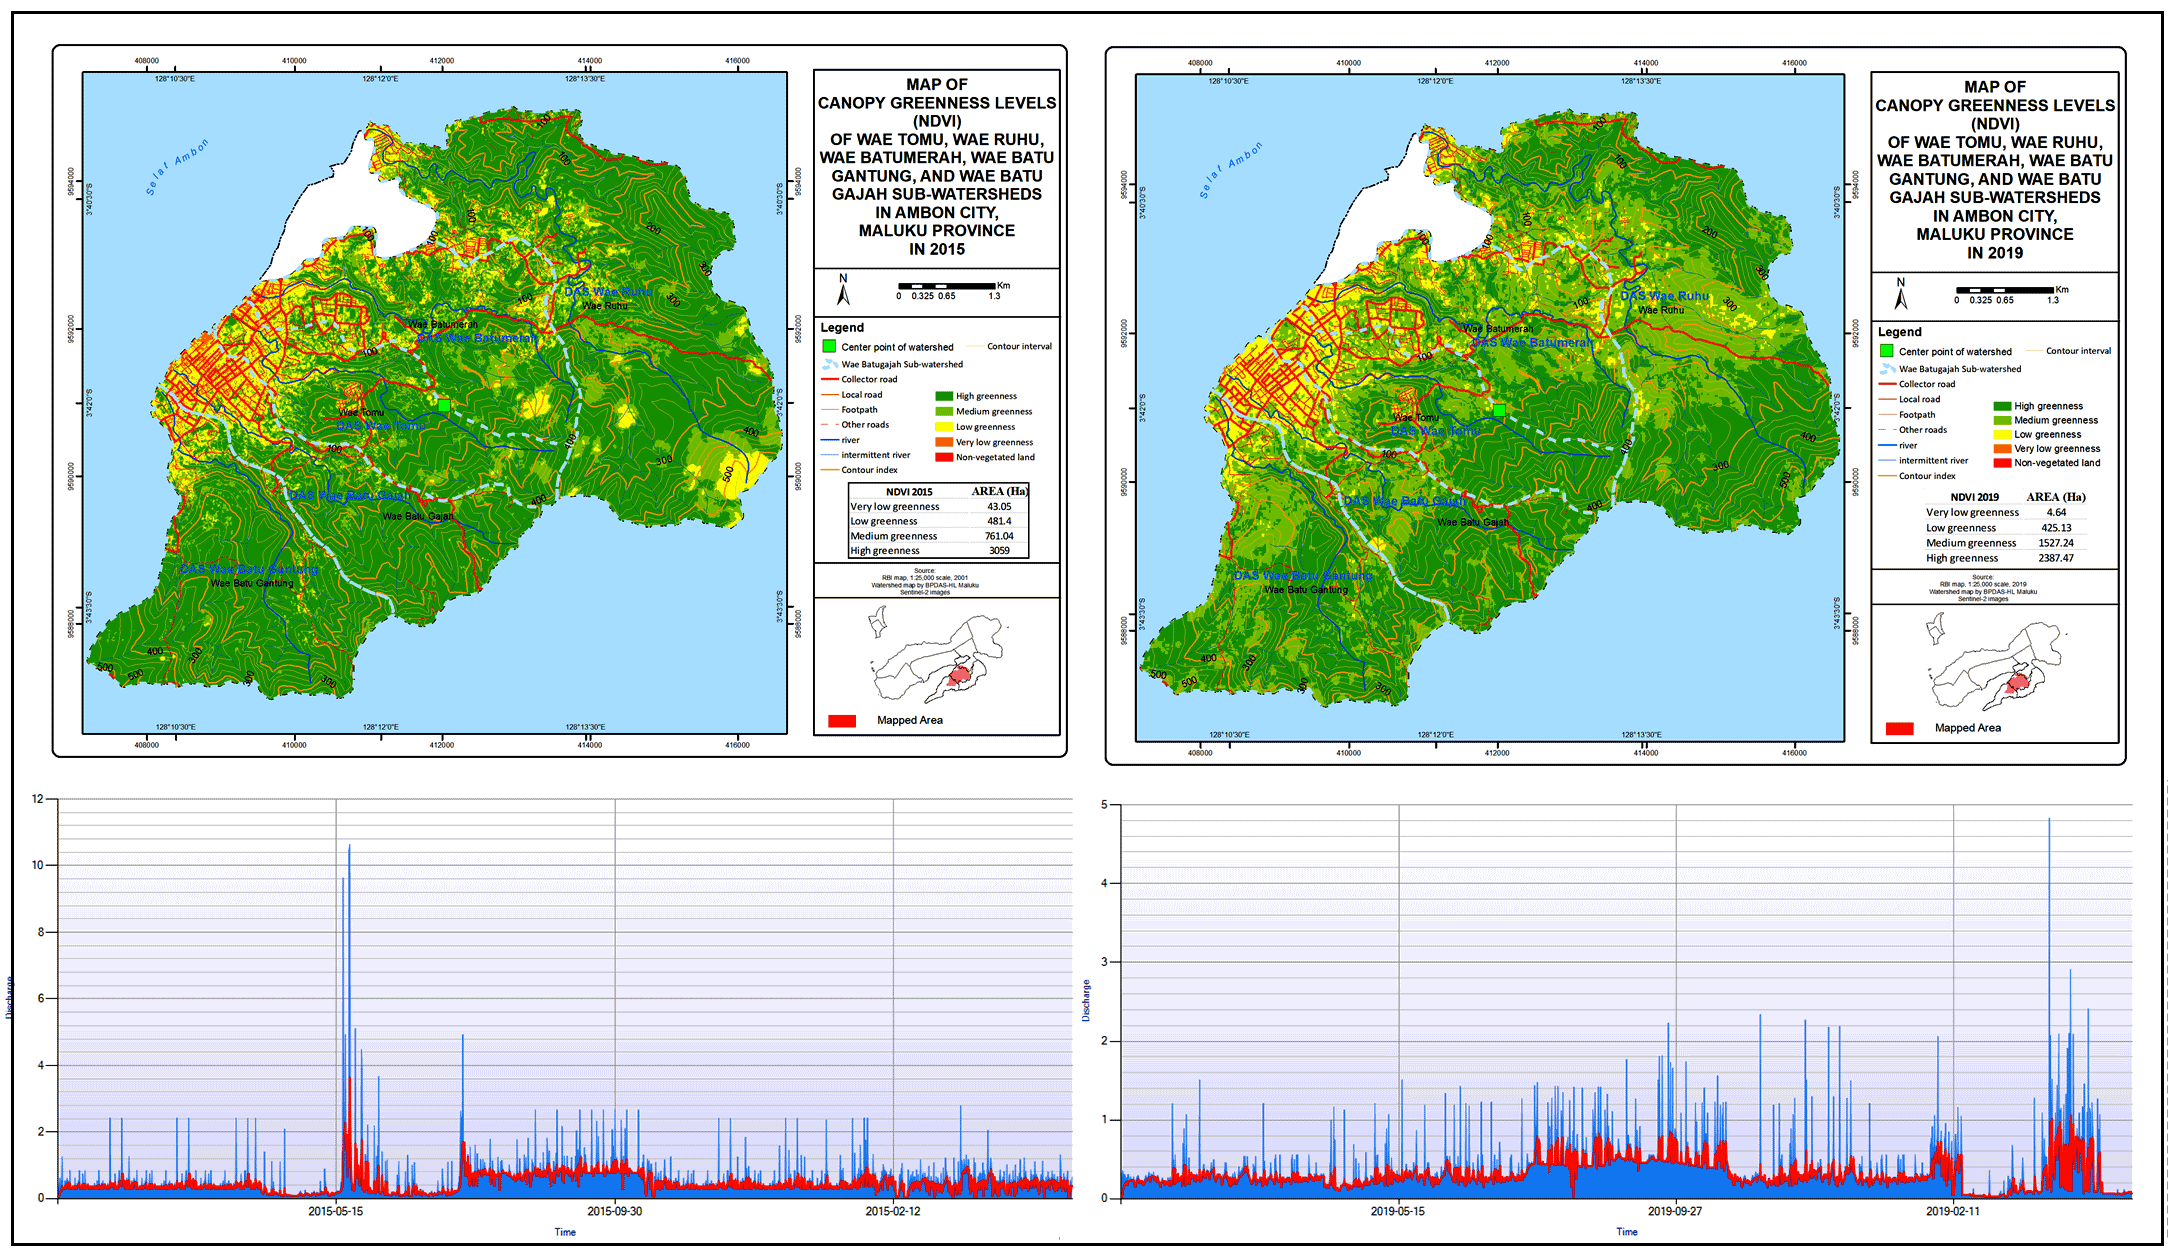
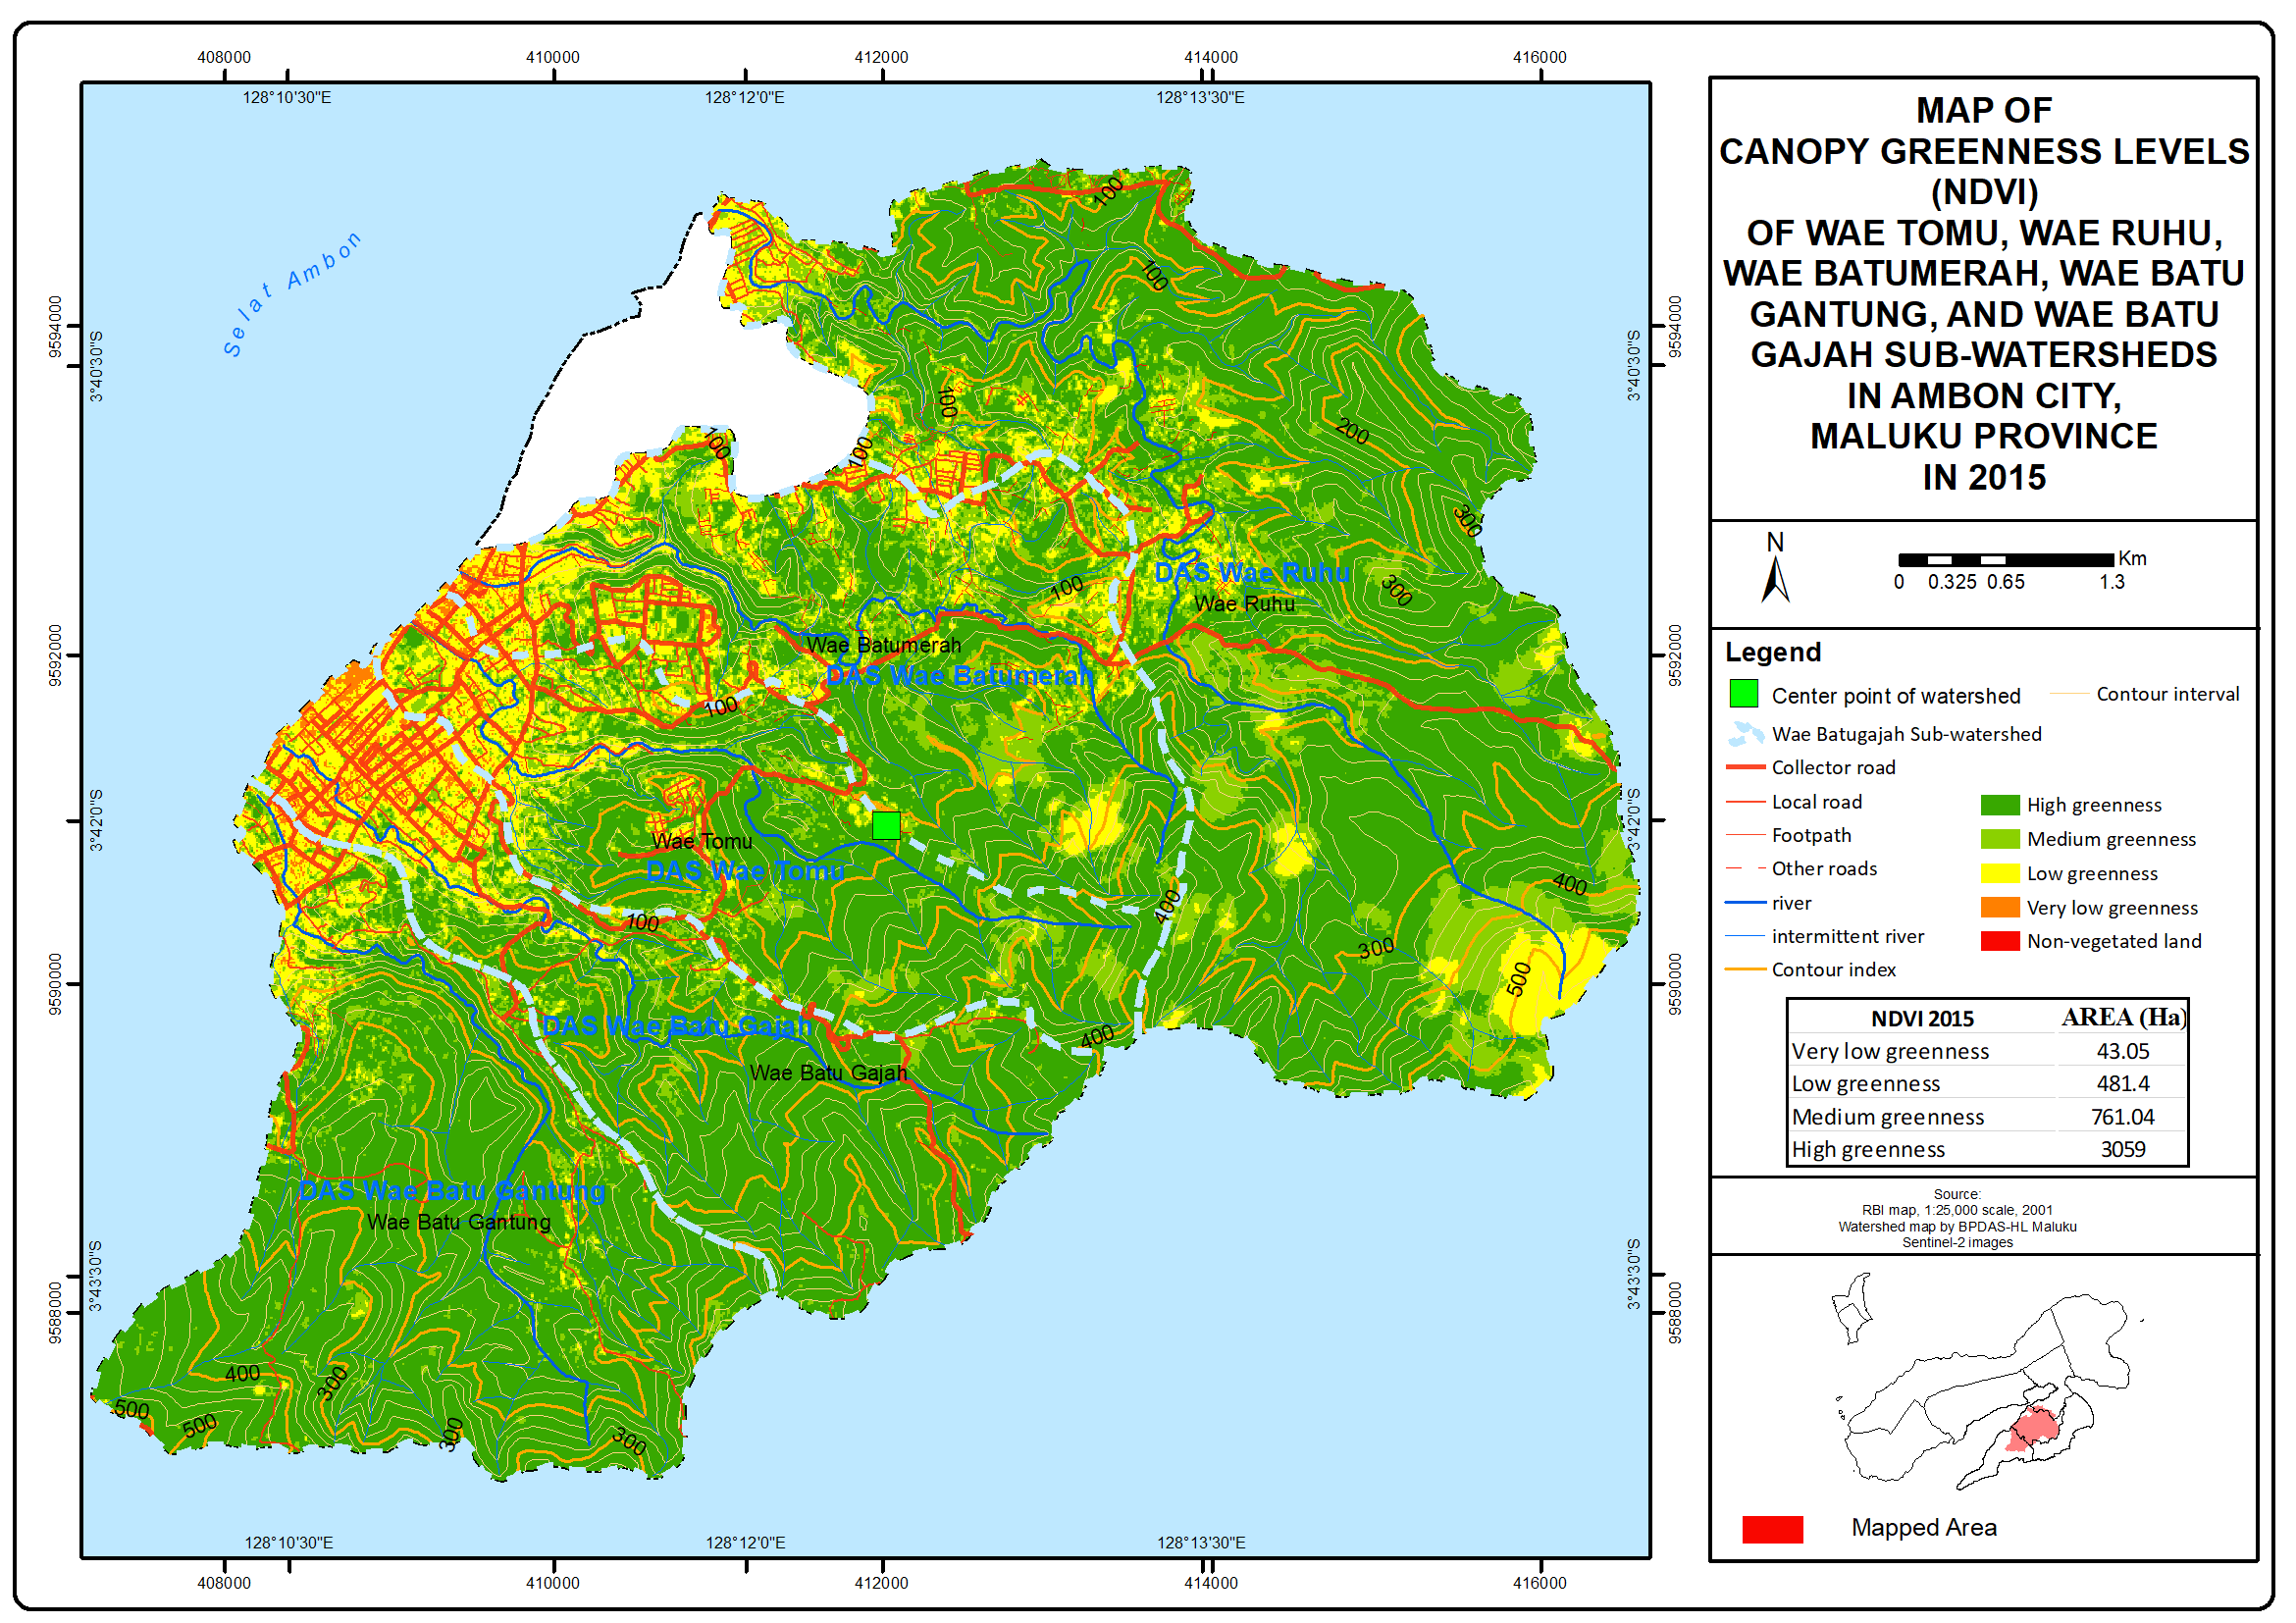
The analysis of two Sentinel images recorded in 2015 and 2019 produced details on canopy greenness variation. In 2015, the image showed that the four classes of NDVI in the five selected watersheds had a relatively uniform trend of variation and area of coverage. Wae Ruhu, Wae Batu Gajah, and Wae Batu Gantung Watersheds had a high canopy greenness level, followed by Wae Batu Merah and Wae Tomu. The first three watersheds also had the most extensive area for the medium, low, and very low canopy greenness levels. Overall, high and medium NDVI values dominated the canopy greenness of the watersheds observed in 2015, as summarized in table 4 and figure 1.
In 2015, the spatial pattern revealed that the high greenness class still dominated areas with steep topography. Meanwhile, non-vegetation objects, such as settlements and other types of buildings, tended to form a cluster along the coastal area, which is the center of government and economic activities in Ambon City (capital of Maluku Province). Figure 1 shows that the spatial pattern in 2015 was composed of physical development concentrated in coastal areas i.e, the river mouths of five watersheds observed.
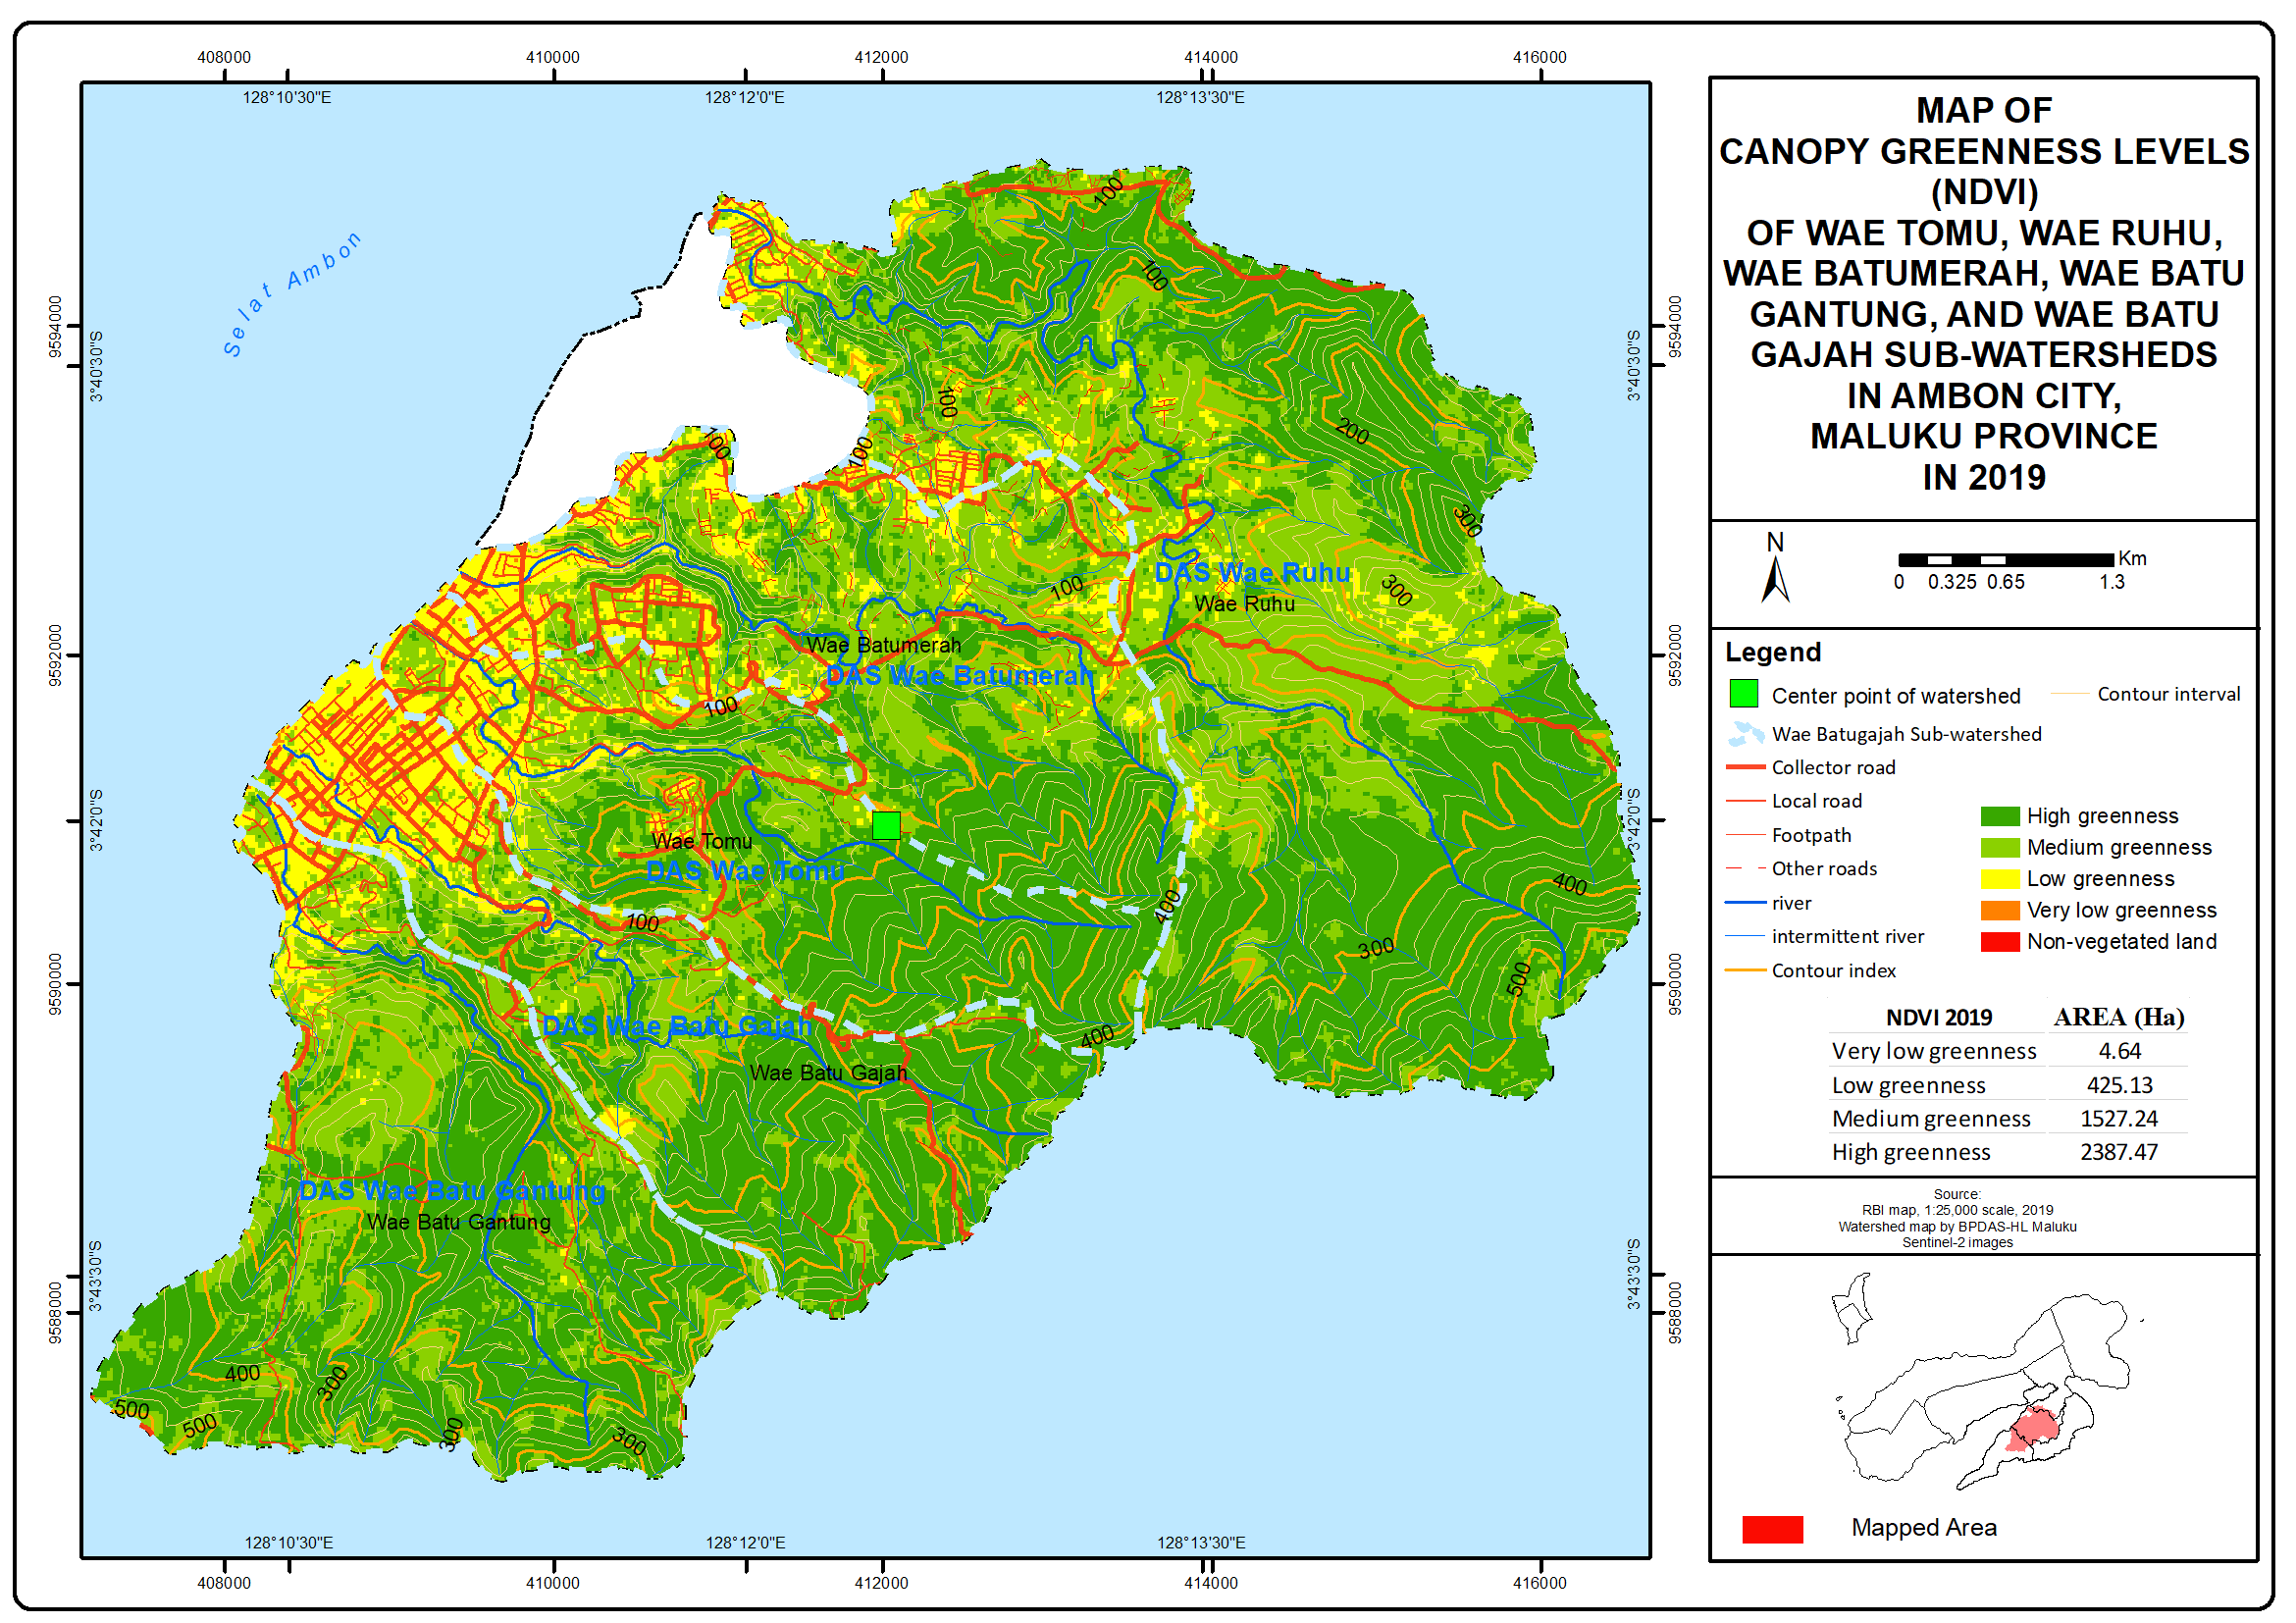
Like the 2015 pattern, the four classes of NDVI values in 2019 had a relatively uniform trend of variation and coverage area. However, the 2019 data showed a decreasing trend in the area of coverage in all researched watersheds. Nevertheless, Wae Ruhu, Wae Batu Gajah, and Wae Batu Gantung still had a generally high canopy greenness, followed by Wae Batu Merah and Wae Tomu. The first three watersheds also had the most extensive area for the medium, low, and very low canopy greenness levels. Overall, high and medium canopy greenness levels were dominant in the watersheds observed in 2019, as presented in table 5 and figure 2.
Based on the calculation results, differences in canopy greenness level between the 2015 and 2019 data indicated a trend of change in all classes of NDVI for all researched watersheds. The most significant change was found in the high greenness class, followed by low and very low classes, while the medium class in all watersheds experienced an increasing trend. These results can be traced to the changes in the direction of non-vegetated land growth, especially settlements that had started to sprawl into the mountainous areas in the east. Due to population growth and regional development in Ambon City, changes in the spatial pattern of canopy greenness have become categorically significant.
Analysis of GeoEye image with a 30m resolution using the 5m zone buffering from the river identified the spatial pattern of built-up land, which was dominant along the riparian zones on either side of the river in the five watersheds observed. The riparian zones, especially in the middle part and estuary of these watersheds, were occupied by settlements, government buildings, and centers of trade and economic activities, with high to very high building density. Their existence, therefore, disrupts the function of a riparian zone, which supposedly protects against floods and droughts.
3.2 Morphometric and Hydrological Characteristics
3.2.1 Morphometric Properties
Analyses of satellite images and topographic maps (Rupa Bumi Indonesia) found that the small island watersheds in Ambon city, Maluku province, were mainly characterized by the narrow and short mainstream. They also had a unique hydrological system that was responsive to existing climate change mitigation and adaptation strategies or generally similar to the ecosystem of other small island watersheds. The results of these analyses are summarized in table 6.
Table 6. Canopy greenness levels derived from NDVI in 2019
|
Canopy Greenness Levels
|
Wae Batu Merah (%)
|
Wae Ruhu
(%)
|
Wae Batu Gajah (%)
|
Wae Gantung (%)
|
Wae Tomu
(%)
|
|
Very low
|
0.13
|
0.09
|
0.11
|
0.11
|
0.10
|
|
Low
|
14.50
|
8.08
|
8.17
|
9.69
|
9.71
|
|
Medium
|
39.10
|
34.82
|
34.94
|
31.28
|
36.35
|
|
High
|
46.26
|
57.01
|
56.78
|
58.92
|
53.84
|
|
Total
|
100
|
100
|
100
|
100
|
100
|
Table 6 shows that all watersheds had relatively small areas, with the most extensive and smallest areas identified in Wae Ruhu and Wae Tomu, respectively. Wae Ruhu had the highest average slope (12.34 m), while Wae Batu Gajah had the lowest (0.49 m). The longest main river (11.87 m) was found in Wae Ruhu, whereas the shortest (5.64 m) was in Wae Batu Gantung. Both Wae Batu Merah and Wae Batu Gajah had the highest circularity ratio, i.e., 12.56. Furthermore, the five watersheds’ morphometric characteristics included stream gradients ranging between 300 m and 500 m, drainage density of 2-3 km/km2, bifurcation ratio of averagely 0.9, and pinnate drainage pattern.
Drainage density (Dd) is a morphometric parameter indicating the effects of hydrological systems of a watershed on flood susceptibility and base flow/groundwater drainage. The five watersheds had excellent drainage density, with Dd varying from more than 1 to 5. The bifurcation ratio was more and less than 1, meaning that the watersheds are not expected as they experience a very high flood peak and have a short recession time. Moreover, they tend to have high surface runoff but low permeability and infiltration, precursors of high flood susceptibility. The bifurcation ratio of the five watersheds was 0.9. In other words, they have a round shape with very high peak discharge (Qp) and relatively short rising and recession times, all of which contribute to increased susceptibility to flooding.
3.2.2 Hydrological Characteristics
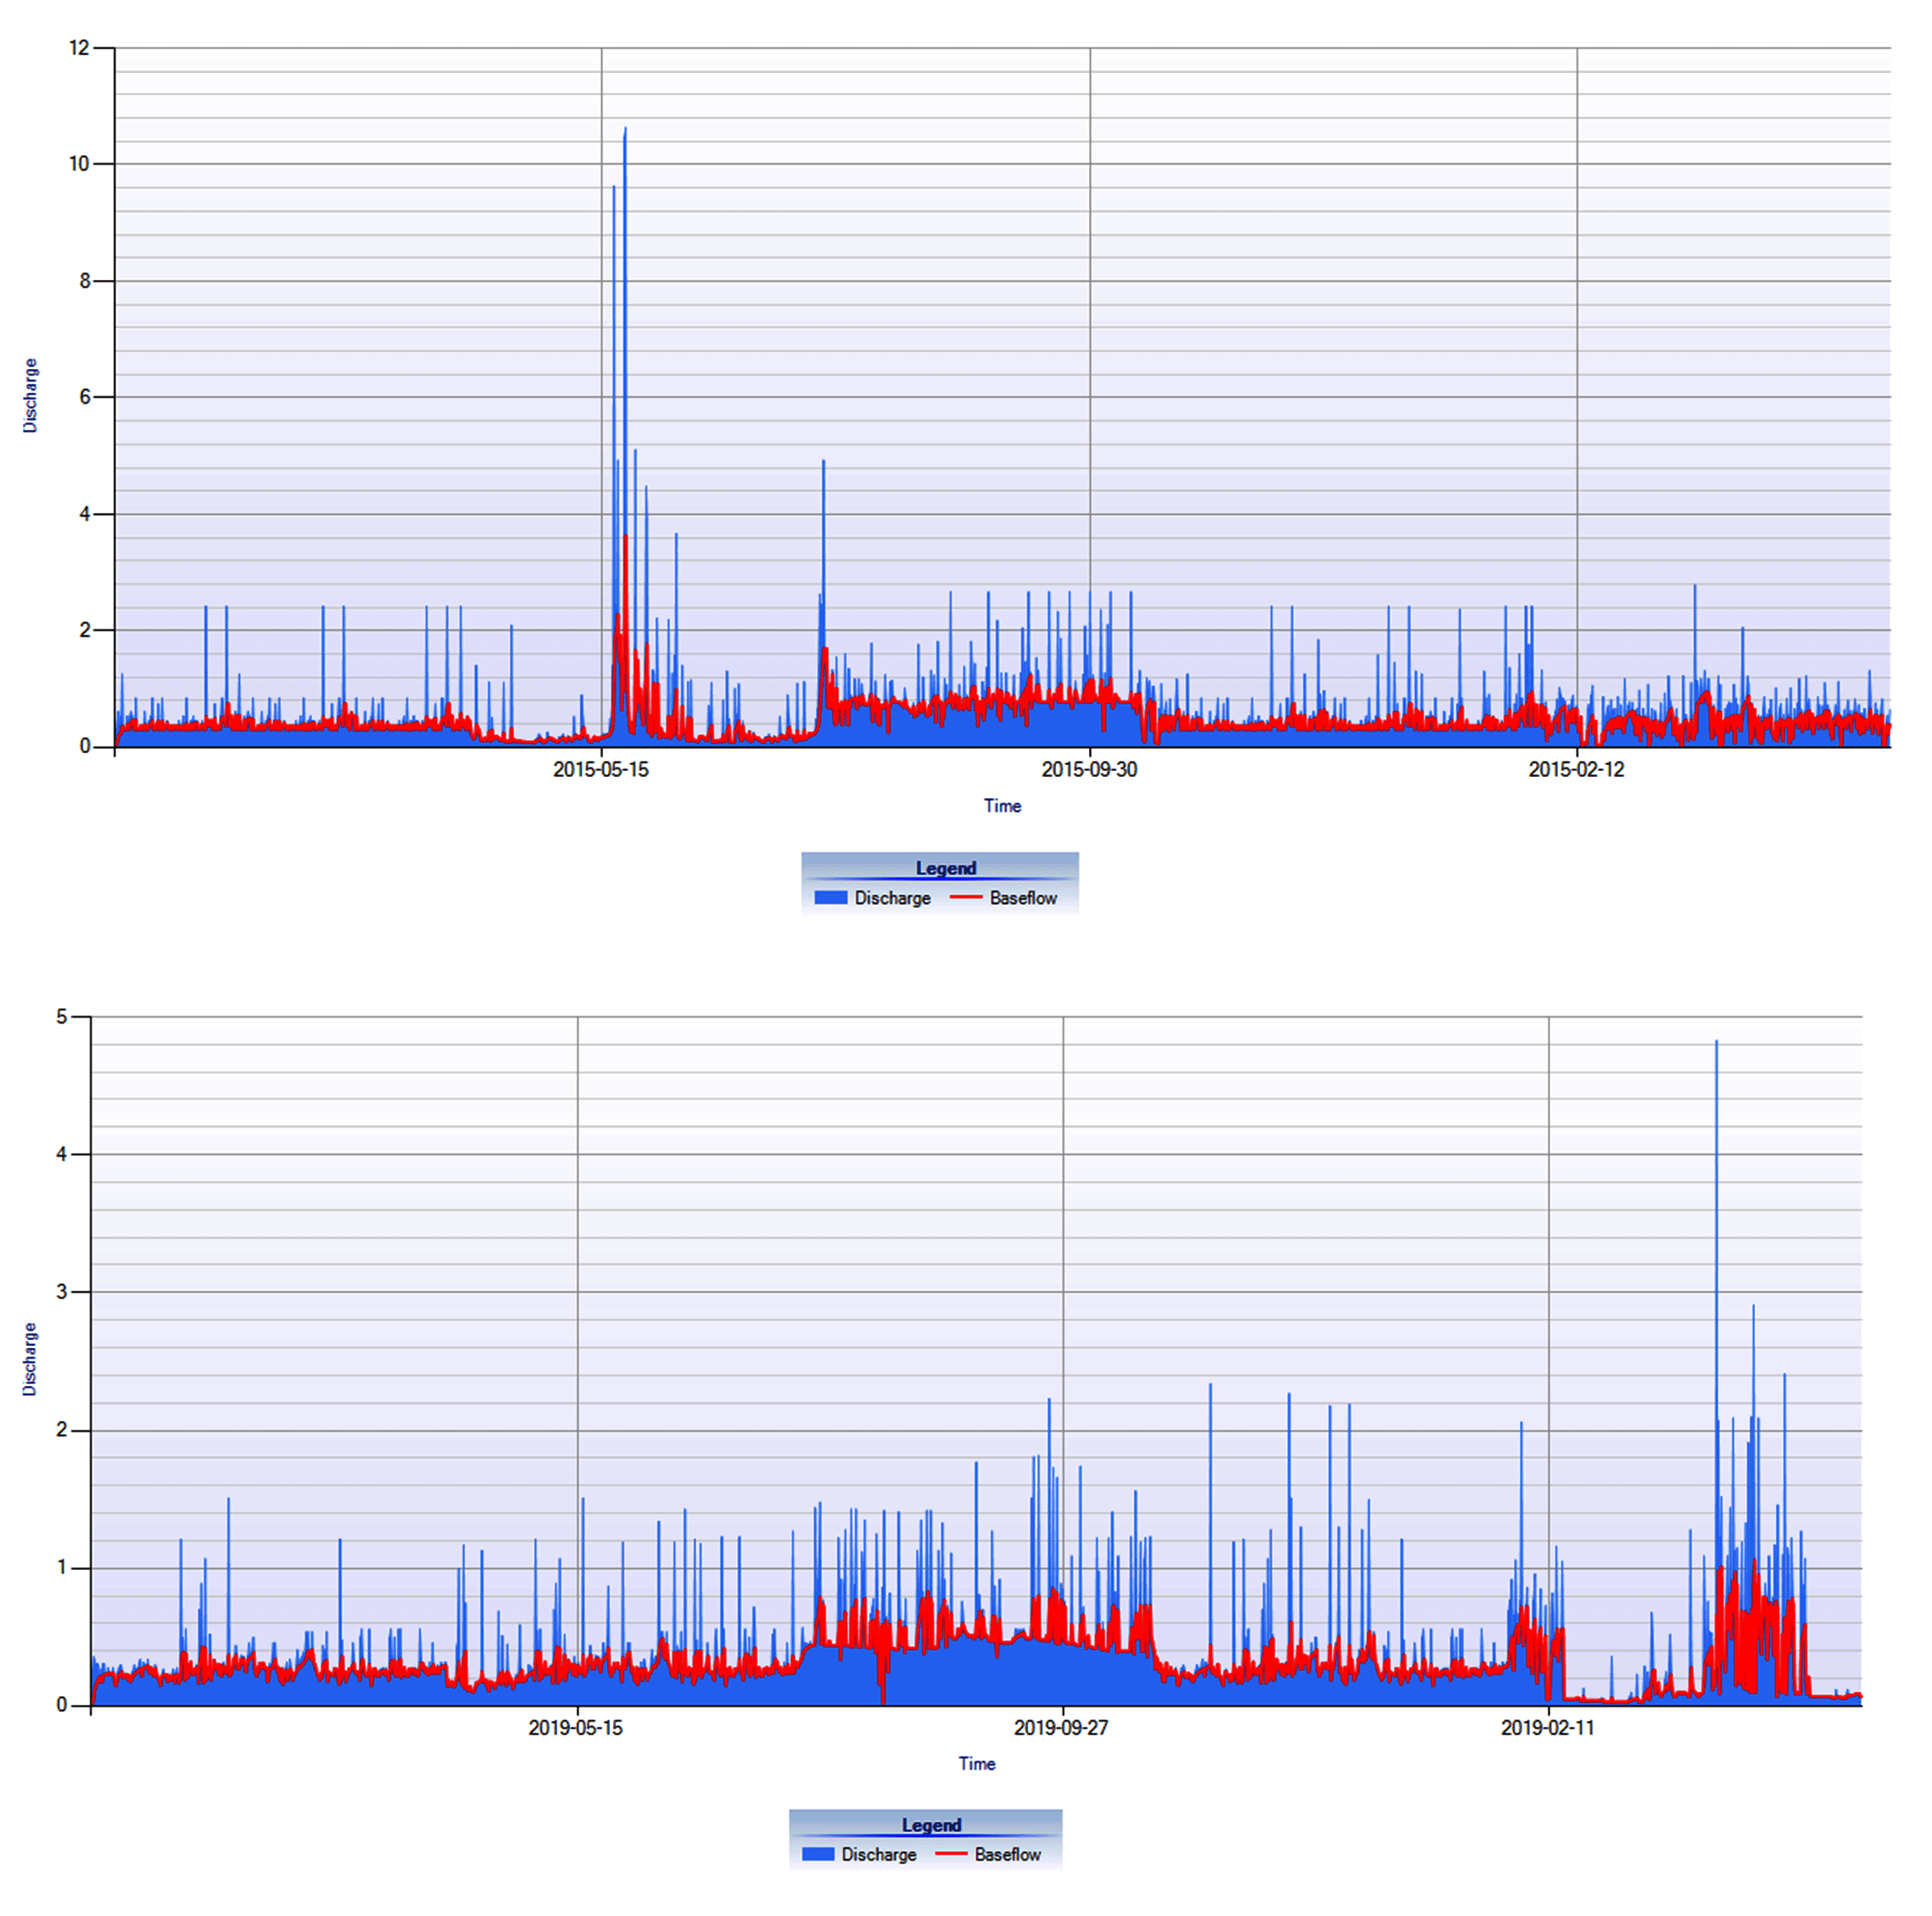
Based on the stream discharge and base flow calculations were performed using the BFLOW filter module of the Hydro-office 12.0 program (with α 0.85). The results of the analysis of the average monthly discharge, base flow, and base flow index for 2015 for the five watersheds show an average discharge of 0.51 m3/sec - 0.57 m3/sec; base flow 0.51 m3/sec - 0.57 m3/sec, and a BFI index of 0.52-0.59. The calculation results of the average monthly discharge, base flow, and base flow index for the 2019 period for the five watersheds are an average discharge of 0,51 m3/sec - 0,57 m3/sec; base flow 0.51 m3/sec - 0,57 m3/sec, and a BFI index of 0.52 - 0,59. The stream and base flow rates of the five watersheds during the research period are visualized in table 7 and figure 3.
Table 7. Morphometric characteristics of small island watersheds in Ambon City, Maluku Province
|
Watersheds
|
Area (km²)
|
Mean Slope Gradient (m)
|
Stream Gradient (m)
|
Length of Main Stream (km)
|
Drainage density (km/km²)
|
Circularity Ratio (CR)
|
Bifurcation Ratio (BR)
|
Drainage Pattern
|
|
Wae Batu Merah
|
7.04
|
5.15
|
359.70
|
6.83
|
3.28
|
12.56
|
0.95
|
Pinnate
|
|
Wae Ruhu
|
15.80
|
12.34
|
524.98
|
11.87
|
3.03
|
9.04
|
0.98
|
Pinnate
|
|
Wae Batu Gajah
|
6.35
|
0.49
|
324.98
|
6.58
|
2.91
|
12.56
|
0.95
|
Pinnate
|
|
Wae Batu Gantung
|
8.63
|
5.84
|
264.17
|
5.64
|
2.93
|
7.51
|
0.95
|
Pinnate
|
|
Wae Tomu
|
5.62
|
4.89
|
349.98
|
6.14
|
3.16
|
5.47
|
0.93
|
Pinnate
|
As seen in figure 3, the watersheds observed were characterized by the stream, and base flow rates significantly changed in the 2015-2019 period. In 2015, these flow components showed fluctuating rates from April until June and an increasing trend from July until September but then tended to hover around 1 m3/s throughout November and December. Meanwhile, in 2019, they were steady from January until June and had a similar increasing trend until October but tended to fluctuate with a relatively decreasing trend in November, before soaring up to 9.63 m3/s (discharge) and 2.28 m3/s (baseflow) in December.
In small island watersheds, the visualization of hydrological characteristics in 2015 and 2019 is primarily determined by the ecosystem’s land-use dynamics. Morphometric properties are the locus of small island watersheds that are highly vulnerable to global environmental changes according to the hydro-morphometric perspective. The same case applies to hydro-morphometric conditions that affect small island watersheds, hydrological systems, especially concerning flood susceptibility and base flow/groundwater drainage.
Drainage density is a primary determinant of flood susceptibility and groundwater drainage. Likewise, the bifurcation ratio determines the shape of a watershed, which reflects flood peak discharge (high or low), time to peak (fast or slow), and recession time (short or long). The combination of high flood peak, quick time to peak, and short recession time induce high surface flow rates but low permeability and infiltration, causing small island watersheds to be highly susceptible to floods.
3.3 Relationship Between Canopy Greenness and Hydrological Characteristics
The spatial pattern of canopy greenness, as derived from NDVI, showed a trend of change during the study period. Land-use change is a dynamic factor that significantly influences the hydrological characteristics of small island watersheds. These results are also apparent in the visualization of the hydrological characteristics of the five watersheds.
The relationship between the spatial pattern of canopy greenness (NDVI) and the hydrological characteristics of a watershed, including stream and base flow discharge, is marked by the coefficient of determination (R2). In the summary model, the adjusted R2 value was 0.382, and the hydrological characteristics could be explained by the model (38.8%), as seen in table 8. Also, with the Durbin-Watson value of 1.271, the model assumes that independence is met. The smaller the SEE, the closer the regression model to predicting the dependent variable accurately.
Table 8. Characteristics of average monthly discharge, base flow, and BFlow index for the period 2015 and 2019
|
Name of watershed
|
2015
|
2019
|
|
Discharge
|
Base flow
|
BF index
|
Discharge
|
Base flow
|
BF index
|
|
Wae Batu Merah
|
0.51
|
0.53
|
0.52
|
0.51
|
0.53
|
0.52
|
|
Wae Ruhu
|
0.53
|
0.55
|
0.55
|
0.53
|
0.55
|
0.55
|
|
Wae Batu Gajah
|
0.57
|
0.57
|
0.59
|
0.57
|
0.57
|
0.59
|
|
Wae Batu Gantung
|
0.52
|
0.51
|
0.53
|
0.52
|
0.51
|
0.53
|
|
Wae Tomu
|
0.52
|
0.52
|
0.53
|
0.52
|
0.52
|
0.53
|
The ANOVA yielded a simultaneous correlation value, namely F-count= 4.234, which was higher than F-table= 2.367 at a significance of 0.001<0.05. This figure indicates that the canopy greenness levels derived from NDVI affect the hydrological characteristics (stream and base flow discharge) significantly in the five selected watersheds.
Table 9. The regression model correlating the spatial pattern of canopy greenness with hydrological characteristics
|
Model
|
R
|
R Square
|
Adjusted R Square
|
Standard Error of the Estimate
|
Durbin-Watson
|
|
1
|
0.645a
|
0.416
|
0.382
|
0.103
|
1.271
|
Notes: predictors: (constant), NDVI algorithm, watershed area (km2), stream gradient (m), elevation (m asl), drainage density (km/km²); dependent variable: stream and baseflow discharge (m3/s)


 ,
Moda Talaohu 1
,
Moda Talaohu 1