5 (2021), 1, 24-33

Hydrospatial Analysis

2582-2969

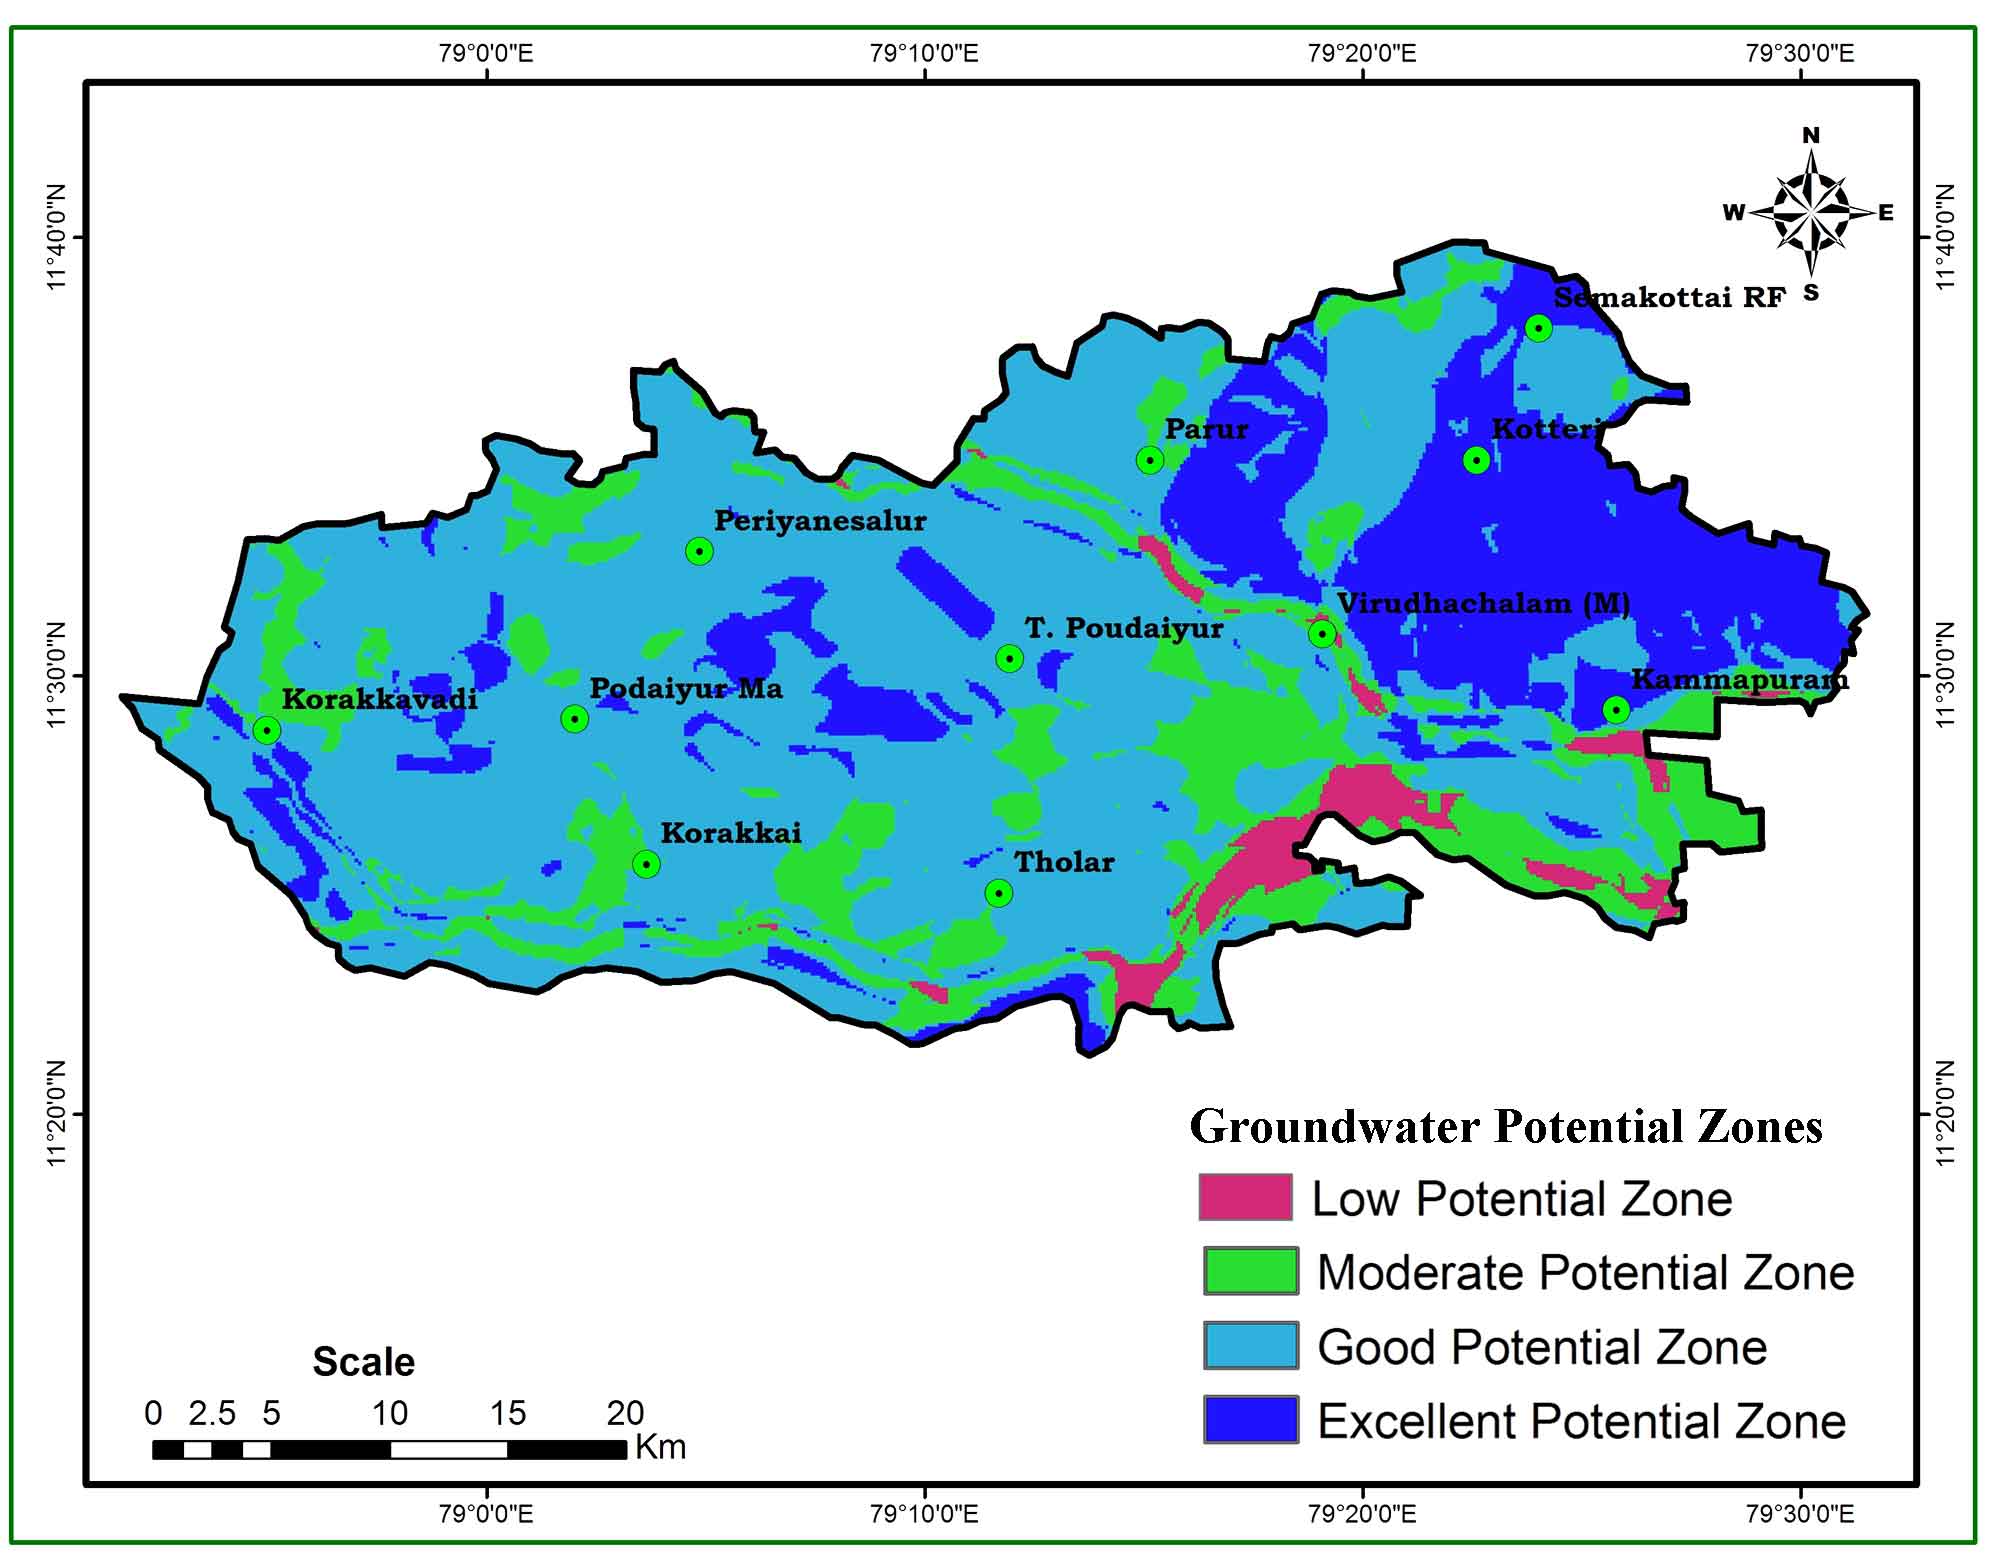
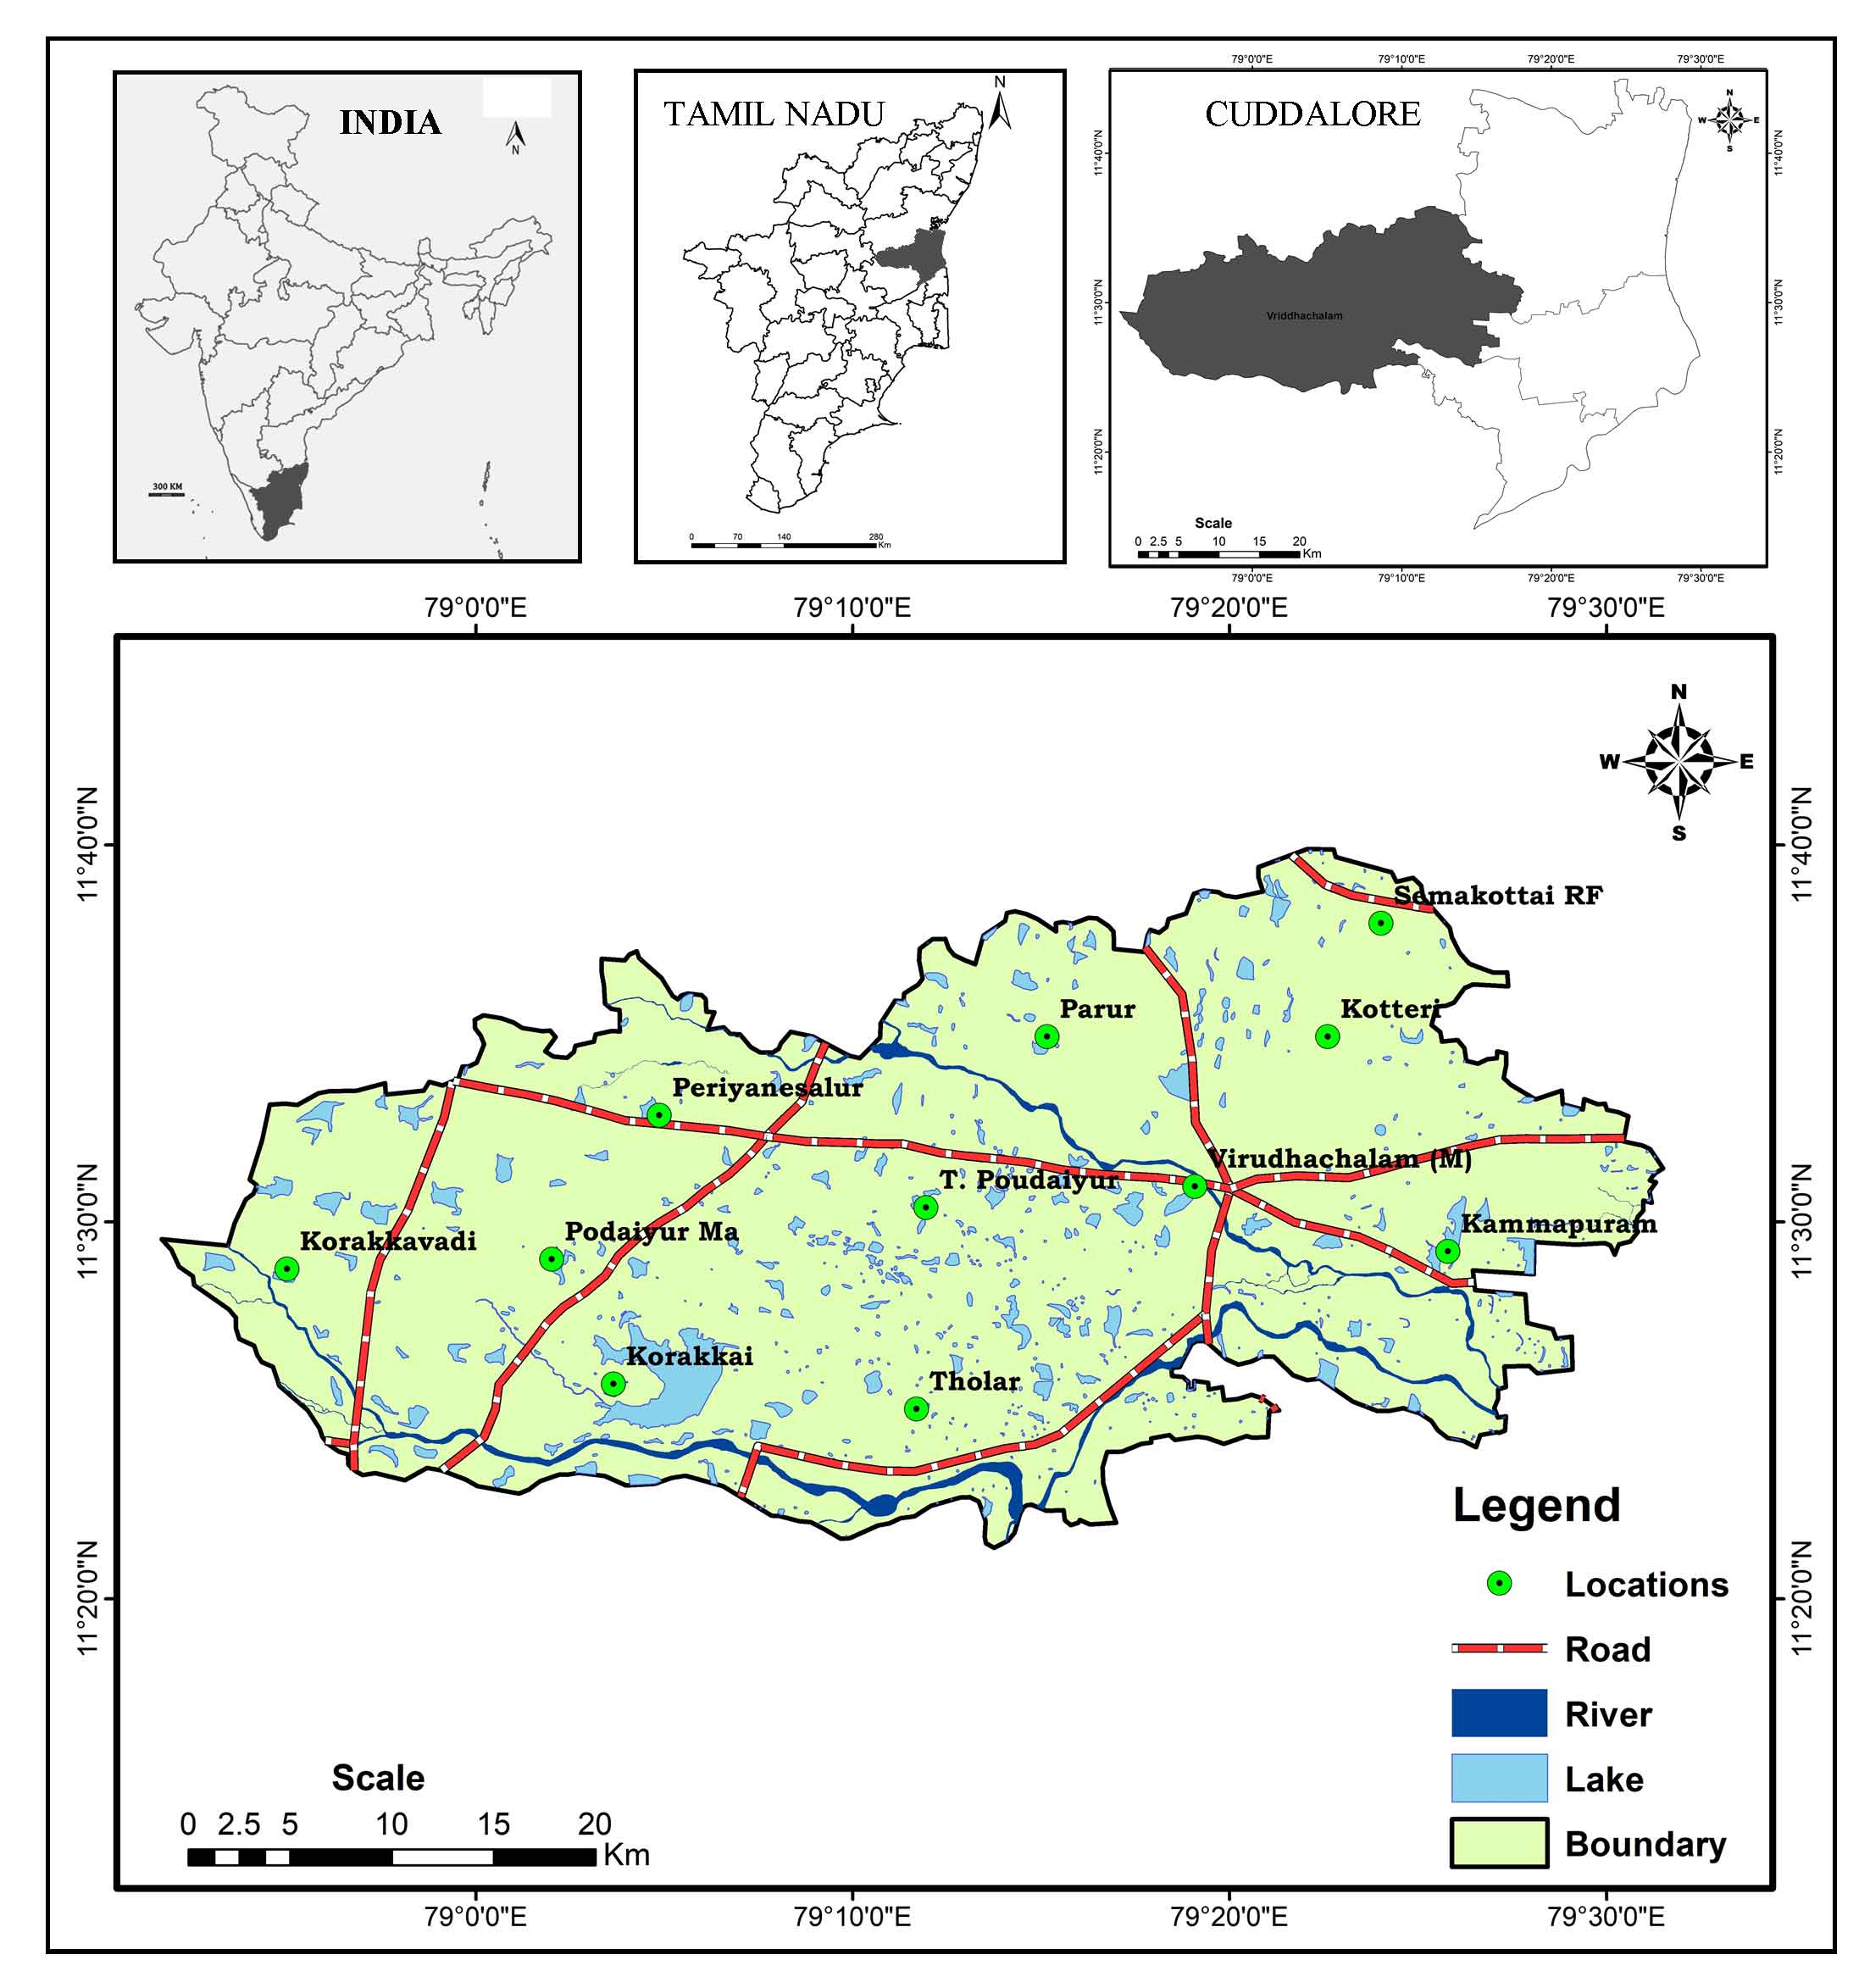
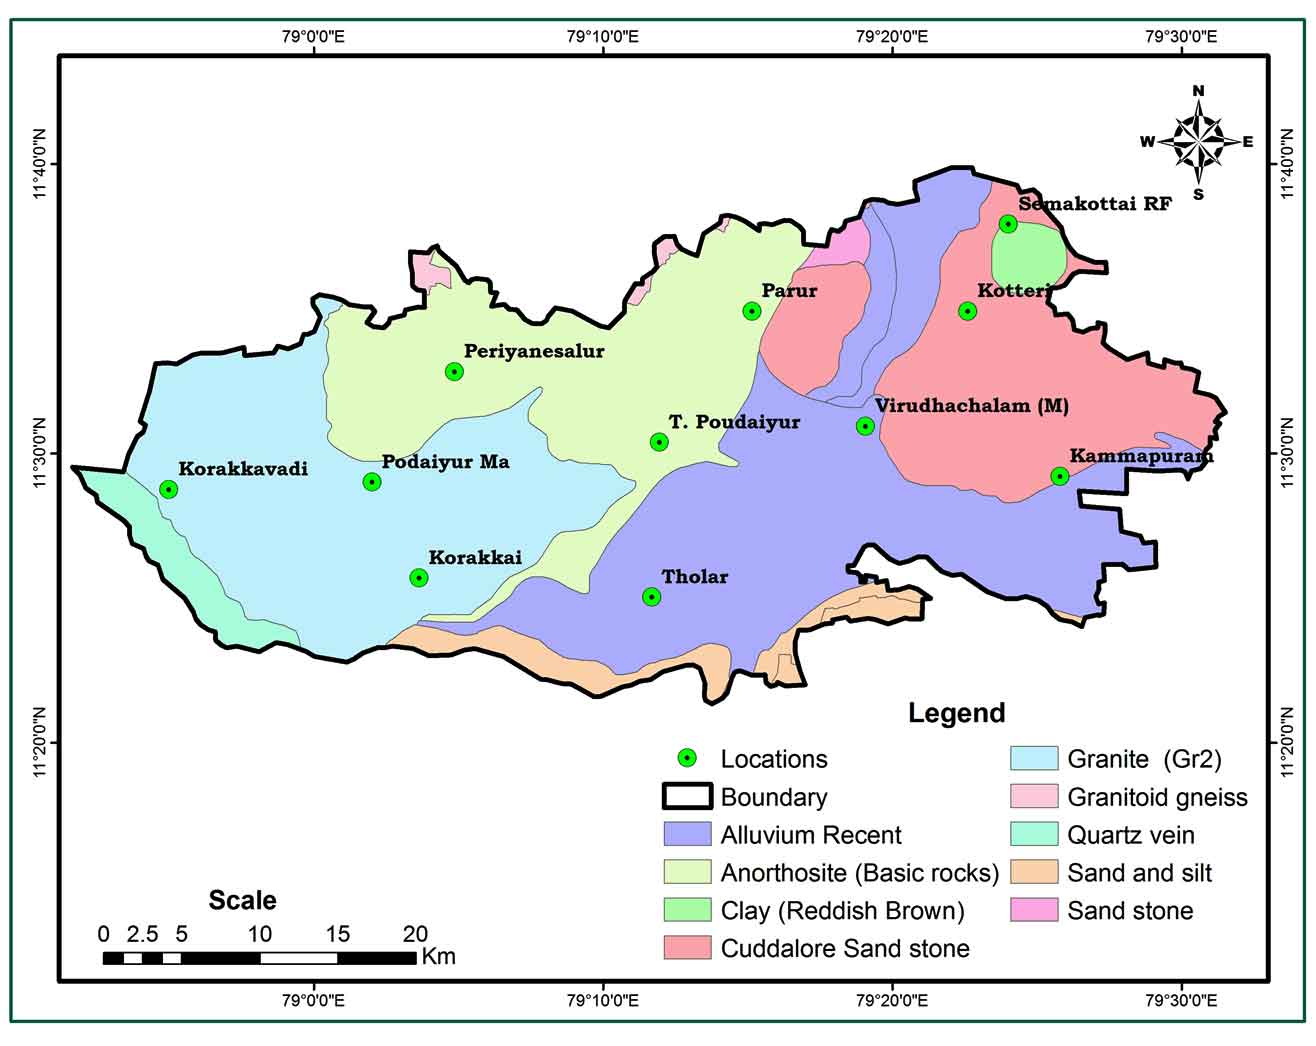
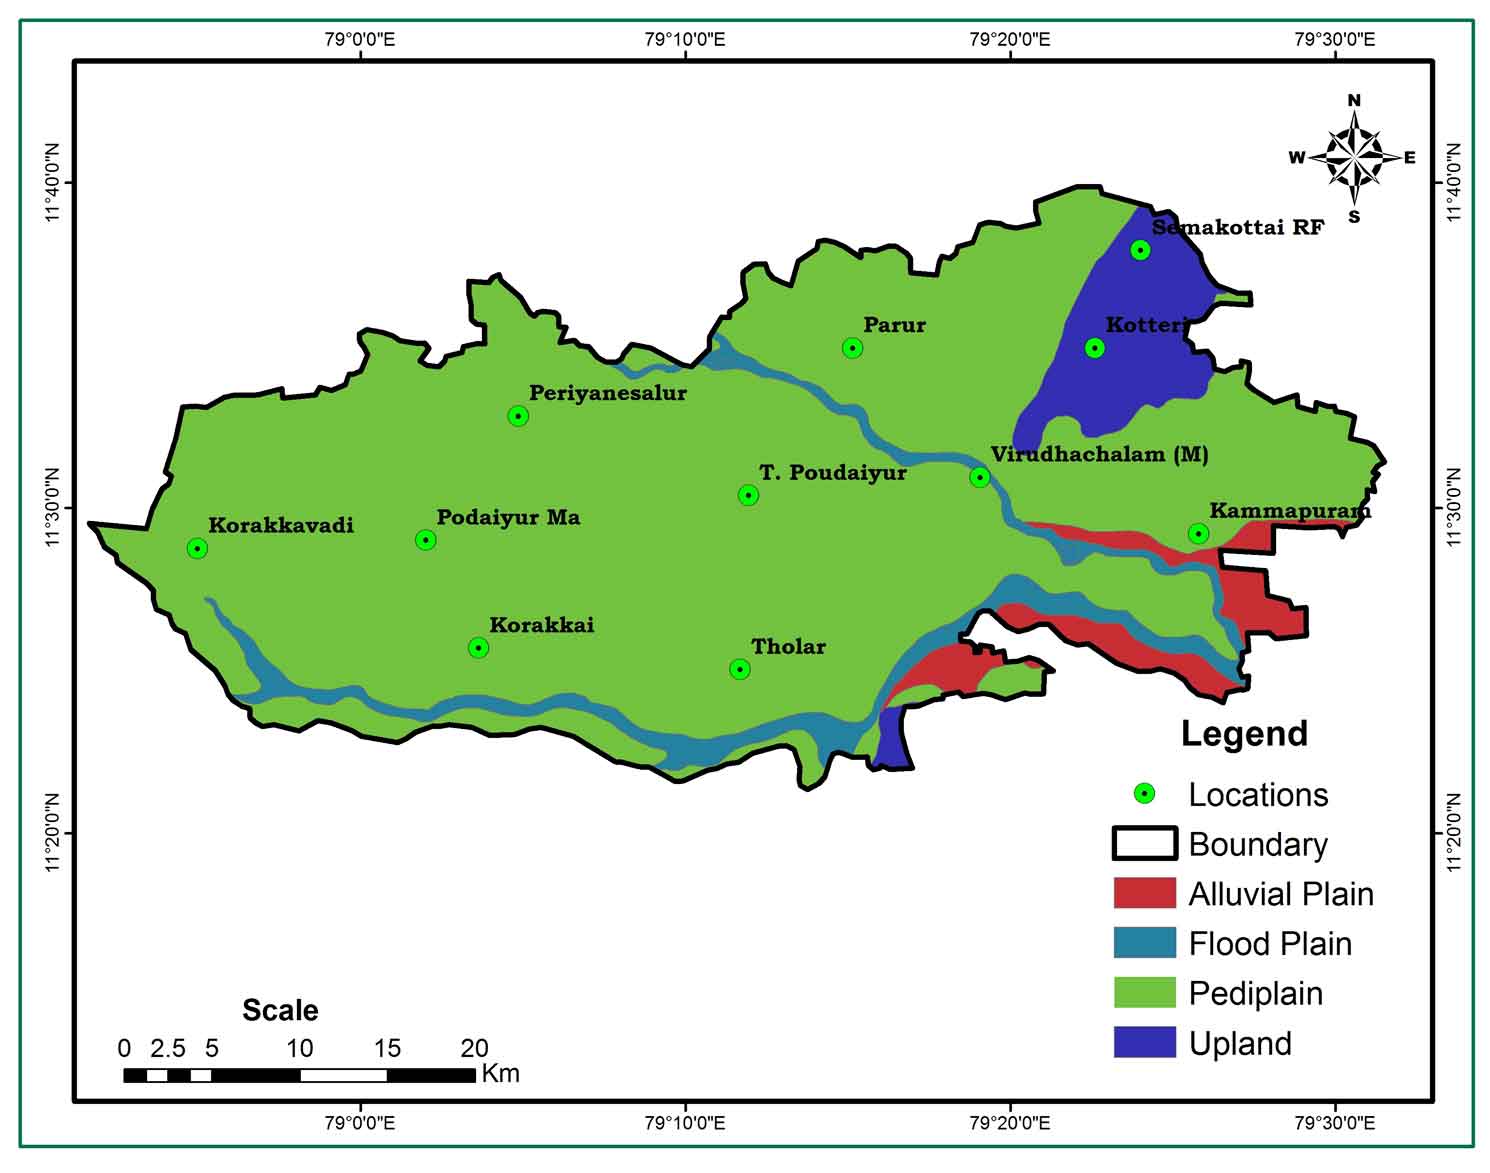
Groundwater Potentiality Mapping in Viruthachalam Taluk, Tamil Nadu, India: AHP and GIS Approaches

Murugesan Bagyaraj 1 , Mukesh M 2 , Zubairul Islam 3 , Daniel Tekley Gebremedhin 4 , Grmay Kassa Brhane 4

1.Department of Geology, College of Natural and Computational Sciences, Debre Berhan University, Debre Berhan, Ethiopia.

2.Department of Earth Sciences, Annamalai University, Annamalainagar - 608 002, India

3.Department of Geography and Environmental Sciences, CSSH, Adigrat University, Ethiopia.

4.Department of Geology, College of Natural and Computational Sciences, Adigrat University, Ethiopia.

Dr.Murugesan Bagyaraj*

*.Department of Geology, College of Natural and Computational Sciences, Debre Berhan University, Debre Berhan, Ethiopia.

Dr.Pramodkumar Hire 1

1.Department of Geography, HPT Arts and RYK Science College, Nashik - 422 005.

20-06-2021
07-05-2021
18-06-2021
19-06-2021

Graphical Abstract

Highlights

  1. GIS and Remote sensing technology with AHP approach was used to locate a prospective groundwater areas.
  2. Inverse Distance Weightage (IDW) technique was used to determine the groundwater potential precinct.
  3. An excellent possible groundwater zone for patches in the northern and central sections of Kotteri and Kammapuram in Virudhachalam Taluk.
  4. The mechanism is suggesting groundwater potential zones for expansion and groundwater control.

Abstract

Groundwater is the most valuable treasury commodity in the world, yet it is depleted on a daily basis. Hand arrangement is crucial in assembly for delineating a potential groundwater zones. Geographic Information System (GIS) and Remote Sensing (RS) data with Analytical Hierarchy Process (AHP) approach have proven critical for micro level analysis of groundwater potentials. This exploration was authorized in order to locate a prospective groundwater area in the Virutachalam Taluk of Southern India. The Inverse Distance Weightage (IDW) technique was used to determine the groundwater potential precinct by thematic layers of drainage, drainage density, geology, lineament, lineament density, geomorphology, soil, and slopes. Overall, the prospective groundwater zone in the study area was classified as excellent (20.66 %), good (60.29 %), moderate (16.38 %) and poor (2.73 %). This optional analysis offers an excellent possible groundwater zone for patches in the northern and central sections of Kotteri and Kammapuram in Virudhachalam Taluk. The survey revealed that the approach of inverse distance weighting provides an operating mechanism for suggesting groundwater potential zones for clear expansion and groundwater control in not the same hydro-geological settings.

Keywords

Remote Sensing , Potential Area , IDW , Groundwater , GIS , AHP

1 . INTRODUCTION

The scarcity and domination of water supply in India’s pastoral and urban regions have been impacted by fast industrial expansion, rehabilitation, and population increase. The discovery of the aquifer and the virtuous eminence of water demand an extraordinary priority for ground water numerical assessment (Oh et al., 2011). Conversely, the calculation of groundwater yield was not deliberate in hydrological education. The Geographic Information System (GIS) and Remote Sensing Strategies have an infinite number of applications in hydrological research in this sector. GIS is expressed as the greatest expertise in the arrangement of spatial data and the verdict of countless geographical, hydrological and eco-friendly sciences (Goodchild, 1993; Brunner et al., 2004; Chowdhury et al., 2009; Oh et al., 2011; Rahmati et al., 2014). This main strategy is a hasty and budget real method to manufacture bellowed data from a variety of geological strata that can be used in a cracking the groundwater possible zones. One of the most important parts of the gene is the relationship between slopes, land usage, land curves, and lineaments, which is represented by the Remote Sensing (RS) techniques. These stats can be given as a function in the GIS and overplayed with former statistics (Hinton, 1996; Jha et al., 2007). Several GIS and RS researchers are concentrating on the empathy of latent groundwater areas utilizing several thematic strata such as geology, geomorphology, drainage, drainage density, lineament, soil, and lithology (Gnanachandrasamy et al., 2018; Ganapuram et al., 2009; Magesh et al., 2012; Nagarajan et al., 2009; Chowdhury et al., 2009; Solomon and Quiel, 2006; Prasad et al., 2008; Saha et al., 2010; Kumar et al., 2016; Muralitharan et al., 2015Yeh et al., 2016). Currently, satellite data are commonly ignored in order to include baseline records of the groundwater potential region (Thomas et al., 1999; Chowdhury et al., 2010; Harinarayana et al., 2000). This modus operandi bounces through a wide range of almost ground-level clarifications (Murthy, 2000; Leblanc et al., 2003; Tweed et al., 2007).

The properties of groundwater are connected to those of the surface (e.g. surface water and soil water). Thus, by extracting important information on surface characteristics from remote sensing pictures, relevant information on groundwater may be obtained (Amineha et al., 2017; Rahmati et al., 2015). Geographic Information System, (GIS) technologies have been widely employed in water science due to its capacity to generate spatial information as well as their practicality in spatial data analysis and prediction (Kanagaraj et al., 2019; Jha et al., 2010). A variety of studies have been conducted to evaluate potential groundwater regions using GIS and Remote Sensing (Madani et al., 2015; Deepika et al., 2013). Experiment factor analysis was used extensively in many of the experiments, which combined several theme layers (e.g., topography, geomorphology, geology, ground cover / land use (LULC), hydrology, and vegetation) with GIS methods (Alfred et al., 2018). To produce the necessary theme layers, a range of remote sensing and image processing techniques were frequently employed in these investigations. To produce thematic layers, these investigations frequently employ a variety of imaging methods. In addition, thematic layers are created using field-collected material, databases, and current maps. Most academics rely on empiricist principles and reference papers in diverse articles on groundwater capacity to determine and assign weight values to thematic layers (Kumar and Krishna, 2016; Madani and Niyazi, 2015; Patra et al., 2018). However, in this study, a change in the research field might result in an incorrect classification and the classification number, as well as an incorrect weight distribution. Human factors might contribute to errors in the final result. To avoid this error, each subject layer has defined dimensions. At the same time, this study changes by Li et al. (2010) standards formula. In order to more intuitively observe the uniform layers.

Tomas Saaty created the AHP in 1980 as a useful method for dealing with complicated decision making in groundwater related disciplines. The technique is effective for breaking down complicated decisions into a series of pairwise comparisons and then synthesizing the outcomes. Furthermore, the AHP tool is an appropriate approach for analyzing the consistency of the outcome, therefore, eliminating bias in the decision-making process (Saaty, 1990). In the Southern, Western Ghats of India, a combination of geographical information system and analytical hierarchical process techniques (AHP) was recently employed. A total of 12 thematic layers was created and investigated for groundwater potential zone delineation, including geology, geomorphology, land use/land cover, lineament density, drainage density, rainfall, soil, slope, roughness, topographic wetness index, topographic position index, and curvature (Arulbalaji et al., 2019; Ahmadi et al., 2021).

A variety of reports have addressed the method for evaluating possible groundwater zones (Mohammadi-Behzad et al., 2019; Roy et al., 2019; Amineha et al., 2017). Among them, many researchers used the AHP approach in their papers and obtained strong results (Singh et al., 2018; Verma et al., 2020; Khashei-Siuki et al., 2020). Garden-fresh water holdings of India are mostly sprayed. Throughout the rainy season and varying physiological factors, elasticity rises to an uneven sharing of water. Owing to the inordinate period of time, population increase, sprawl and agronomic enlargement have exacerbated the location. Natural mistreatment of freshwater is a significant source of water starvation. Flat now, certain areas of the world are pebbledash of dire water calamity. Quite apart from the creature’s right vital quantity of the nation’s increase, the analysis of the water store was patchy. The key goal of this analysis is therefore to demarcate the future groundwater region in Viruthachalam Taluk from the southern part of India, which is an exhausting assimilation of the geographical information system and remote sensing with AHP approach.

2 . STUDY AREA

Viruthachalam Taluk, Thirumudhukundram was the town’s ancient name (Figure 1). It has a land size of 1,485.33 km2 and is located in the Indian state of Tamil Nadu. It is situated between 79° 0' and 79° 30' E longitude, 11°40' and 11°20' N latitude (Toposheet numbers 58M/10 and M58/14). Thirumanimutharu is the major river. The environment is hot and dry, with a low temperature of 19.5 °C and a maximum temperature of 39.8 °C in May and June. With an annual rainfall of 825.6 mm, rainfall peaks from November to December, underneath the Northeast monsoon. Deep red laterite soil and deep black cotton soil are the most common soil types. Hard rock terrain has red soil, limestone zones have black soil, while sandstone and Cuddalore sandstone have deep red laterite soil. The Viruthachalam Taluk is geomorphologically split by pediplains and uplands, pediplain with gentle slope lands. The  drainage density is typically moderate.

Figure 1. Location map: Viruthachalam Taluk, Tamil Nadu (India)

3 . MATERIALS AND METHODS

The foundation of a base map using Survey of India Toposheet completes the identification of a probable groundwater zone. Aiming to prepare a base map, Arc map 10.2 was utilized, together with spatial research tools from the IDW weightage approach. Furthermore, geology, drainage depth, geomorphology, slope, surface, and linear depth maps were created using various state surface and land use survey cradles, the Public Works Department (PWD), the Tamil Nadu Water Supply and Drainage Board (TWAD)-GIS section, satellite imagery (IRS-1C, LISS-III, and SRTM data, and ERDAS at a scale of 1:50,000. Third, every thematic stratum categorized into various sorts and meant as classes (Table 1). Each thematic layer was ranked on the basis of its essential association groundwater funds. Influences and weighting of veneration attributed to groundwater capacity. After that, the pair-wise valuation matrix was produced using a ranking approach for computing regulated inverse distance, weights (IDW) for all thematic layers and their geographies. To begin the potential groundwater area, all theme layers were layered. To calculate the groundwater potential index, the following equation was used to calculate the overall weights of distinct polygons in the combined layer (Rao and Briz-Kishore, 1991):

GWPI = ((GMw)(GMwi) + (GGw)(GGwi) + (DDw)(DDwi) + (LDw) (LDwi) + (SLw)(SLwi) + (STw)(STwi))

where GWPI denotes the groundwater potential index, GM denotes geomorphology, GG denotes geology, DD denotes drainage density, LD denotes line density, SL denotes slope, and ST denotes soil type, and the subscripts “w” and “wi” denote the normalized weights of layer and normalized weights in each thematic layer, respectively.

Table 1. Thematic layers with class influences and weighting

Parameters

Classes

Influences

Weightages

Geology

Alluvium Recent

10

1

Anorthosite (Basic rocks)

1

Clay (Reddish Brown)

1

Cuddalore Sand stone

3

Granite  (Gr2)

2

Granitoid gneiss

1

Quartz vein

1

Sand and silt

2

Sand stone

3

Geomorphology units

Alluvial Plain

20

1

Pediment

3

Flood Plain

1

Upland

2

Slope

Gentile slope

35

3

Moderate slope

2

Steep slope

1


Lineament density

Low

30

0

Moderate

1

High

2


Drainage density

Low

5

3

Moderate

2

High

1


Soils

Deep red and laterite soils

25

3

Young river alluvium soils

1

Moderately deep red, laterite and black soils

2

Red Soils

3

Black Soils

2

Deep black cotton soils

2


4 . RESULTS AND DISCUSSION

4.1 Geology  

The geological map (Figure 2) was created using Arc GIS tools and a substantial number of geological arrangements that were visible and plotted with appropriate symbols. The lithological sections are Alluvial recent S-E and sandstone, Cuddal sandstone-NE, Clay (reddish brown) S-W, sand, silt and mixed with Granitiod gneiss N-W, Anorthosite (basic rocks) and granite (gr2). At the start of their water holding assets, a separable geological layer is unglued and weighted. Sandstone with clay, Cuddalore sandstone with sand, silt and clay are regarded as probable water demeanors, and therefore the highest rating was provided. This rock kind is found in the largest section of the sample region.

Figure 2. Geology


4.2 Geomorphology

Using visual clarity techniques, a geomorphological map (Figure 3) of the research region LISS-III satellite data was created. It is split into four layers: pediplain, flood plain upland, alluvial plain, and alluvial plain. A major section of the sample region is made up of pediplains intersected by flood plains, highlands, and alluvial plains. Keeping capability rating is assigned to all strata based on land types and water.

Figure 3. Geomorphology

4.3 Drainage and Drainage Density

Drainage pattern in every territory shows the characteristics of both ground and underground formations. The underlying lithology recognizes this function, which provides an essential signal of the water purification rate (Shaban et al., 2006). The drainage pattern (Figure 4) is mostly dendritic, but the drainage density (Figure 5) is the sum of all tributaries that determine the distance per unit of drainage area (km / km2) and the canals’ contiguousness (Horton, 1932). The drainage density of the area is classified into three groups in the analysis, ranging from extremely low (1) to very high (> 6). The region with the lowest drainage density received the highest score, while places with the most drainage capacity received the lowest ranking. Mostly scattered across the research area of moderate density and partially filled, the higher drainage density at Kotteri, T. Poudaiyur, Periyanesalur, lower drainage density in the N-W portion of the study district.

Figure 4. Drainage system

Figure 5. Drainage density


4.4 Lineaments and Lineament Density

The presence of lineaments (Figure 6) usually indicates a porous zone, and a high lineament density (Figure 7) indicates a large groundwater capacity (Haridas et al., 1998; Ghosh et al., 2016; Magesh et al., 2012). Linear density is classified into three categories: high, medium, and low. With a high ranking of 2, the center of the study area, N-S-W, and the southern half of the research region have significant lineament density.

Figure 6. Lineaments

Figure 7. Lineament density

4.5 Soil

Soil (Figure 8) is also a significant factor in determining the potential groundwater region (Kumar et al., 2016). Black soils, deep black cotton soils, deep red and laterite soils, comparatively deep red laterite and black soils, red soils, and young river alluvium soils were the six types of soil described and graded. Each soil group is weighted on the basis of its characteristics correlated with groundwater. Deep red and laterite soils with a grade of 3 in the northeast and southwestern portions of the area are regarded to have a very excellent potential based on the quantity of intrusion and groundwater potential. Black soils, particularly deep black cotton soils, have a moderate to low potential (Malik et al., 2010) and have been classified as 2 and young river alluvium soils of poor potential and ranked 1.

Figure 8. Soils

4.6 Slope

Based on the gradation of the slope, the field is graded as gentle, moderately deep, moderate and steep (Figure 9). Slight slopes are considered to be strong prospects and the top rating 3 has been assigned. In the case of steep slopes with a high surface runoff, it is well-considered that weak groundwater capacity with the lowest rating 1 has been allocated.

Figure 9. Slopes


5 . DEMARCATION OF POTENTIAL GROUNDWATER ZONE

The groundwater potential zone map was created by using weighted overlay techniques in the IDW spatial analysis method to overlay the accumulative weight given to all thematic layers (geology, geomorphology, drainage density, lineament density, soil, and slope). Each theme layer was divided by grading and weighting in the weighted overlay discovery method based on its water hold. Appropriately, higher and lower weights have been assigned to higher and lower groundwater capacity. The rating and weighting of each stratum are further allocated and the quantity obtained in the future groundwater region. All layers have been rehabilitated and overlaid to the raster style. The research region was categorized into four groups based on weighted overlay analysis: Excellent Potential Zone (20.66%), Good Potential Zone (60.29%), Moderate Potential Zone (16.38%) and Low Potential Zone (2.73 %). Result reveals that the majority of the area classified as Excellent Potential Zone (306.89 km2), Good Potential Zone (894.54km2) followed by Moderate (243.32km2), and Low Potential Zone (40.58 km2). Excellent possible groundwater zone existed in patches in the northern and central parts of Kotteri, Vridhachalam, Kammapuram and Parur, owing to sandstone and cuddalore sandstone and the strong penetration of groundwater by the red laterite. Furthermore, by improving the quality and geographical resolution of the data, the conclusions of this study may be enhanced. The potential region of the groundwater map is depicted in figure 10.


Figure 10. Groundwater Potential Zones


Table 2. Groundwater Potential Zones

Zones

Area

km2

%

Low Potential Zone

040.58 km2

02.73

Moderate Potential Zone

243.32 km2

16.38

Good Potential Zone

894.54 km2

60.29

Excellent Potential Zone

306.89 km2

20.66

6 . CONCLUSION

The present study focused on a probabilistic approach that used both GIS and RS satellite imageries to find the potential groundwater zones in Viruthachalam taluk. Various thematic layers such as geomorphology, geology, irrigation, irrigation depth, lineaments, lineament density, slope and soil maps have been prepared from satellite data using GIS and ERDAS tools to identify the possible groundwater region of the city in order to identify the potential groundwater region. Based on the combined weighted thematic charts, the Virudhachalam Taluk groundwater potential region is classified as good (60.29%), moderate (16.38%), excellent (20.66%) and low (2.73%). These GIS and RS techniques have shown that there is a very good potential groundwater zone in the northern and central areas of Virdhachalam and Kotteri. While there was a good potential groundwater zone in the North, South and Northwest of the study area. This research is very useful for the public and government sectors to know the possible groundwater region for environmental protection and use of this Taluk.

Conflict of Interest

The authors declare that there are no conflicts of interest.

Acknowledgements

The authors would like to thank NRSC, Hyderabad and Public work department, Tamil Nadu for providing necessary data to conduct research work. We would like to thank the editor and anonymous reviewers for their critical and constructive comments of the manuscript.

Abbreviations

AHP: Analytical Hierarchical Process; DD: Drainage Density; ERDAS: Eastern Range Dispersion Assessment System; GG: Geology; GIS: Geographic Information System; GM: Geomorphology; GWPI: Ground Water Potential Index; IDW: Inverse Distance Weightage; LD: Lineament Density; LISS: Linear Imaging Self Scanning; LULC: Land Use Land Cover; NE: North East; NRSC: National Remote Sensing Centre; NW: North West; PWD: Public Works Department; RS: Remote Sensing; SL: Slope; SRTM: Shuttle Radar Topography Mission; ST: Soil Type; SW: South West; TWAD: Tamil Nadu Water Supply and Drainage Board.

References

13.

Goodchild, M. F., 1993. The state of GIS for environmental problem solving. In: Goodchild M. F., Parks B. O., Steyaert L. T. (Ed.) Environmental modeling with GIS. Oxford University Press, New York, 8-15.

14.

Haridas, V. R., Aravindan, S. and Girish, G., 1998. Remote sensing and its applications for groundwater favourable area identiûcation. Quart. Jour. GARC, 6, 18-22.

15.

Harinarayana, P., Gopalakrishna, G. S. and Balasubramanian, A., 2000. Remote sensing data for groundwater development and management in Keralapura watersheds of Cauvery basin, Karnataka, India. Indian Mineralogists, 34, 11-17.

17.

Horton, E., 1932. Drainage-basin characteristics. Eos, Transactions American Geophysical Union, 13(1), 350-361. 

25.

Leblanc, M., Leduc, C., Razack, M., Lemoalle, J., Dagorne, D. and Mofor, L., 2003.  Application of remote sensing and GIS for groundwater modeling of large semiarid areas: example of the Lake Chad Basin, Africa. In: Hydrology of Mediterranean and Semiarid Regions Conference, Montpieller, France. Red Books Series, 278. IAHS, Wallingford, 186192.

40.

Saaty, T. L., 1990. Decision making for leaders: The analytic hierarchy process for decisions in a complex world. RWS publications.

43.

Singh, A. K. and Prakash, S. R., 2003. An integrated approach of remote sensing, geophysics and GIS to evaluation of groundwater potentiality of Ojhala subwatershed, Mirzapur district, UP, India. Map India conference.

46.

Thomas, A., Sharma, P. K., Sharma, M. K and Sood A., 1999. Hydrogeomorphological mapping in assessing groundwater by using remote sensing datada case study in Lehra Gage Block, Sangrur district, Punjab. Jour. Indian Soc. Remote Sensing, 27, 31-42.