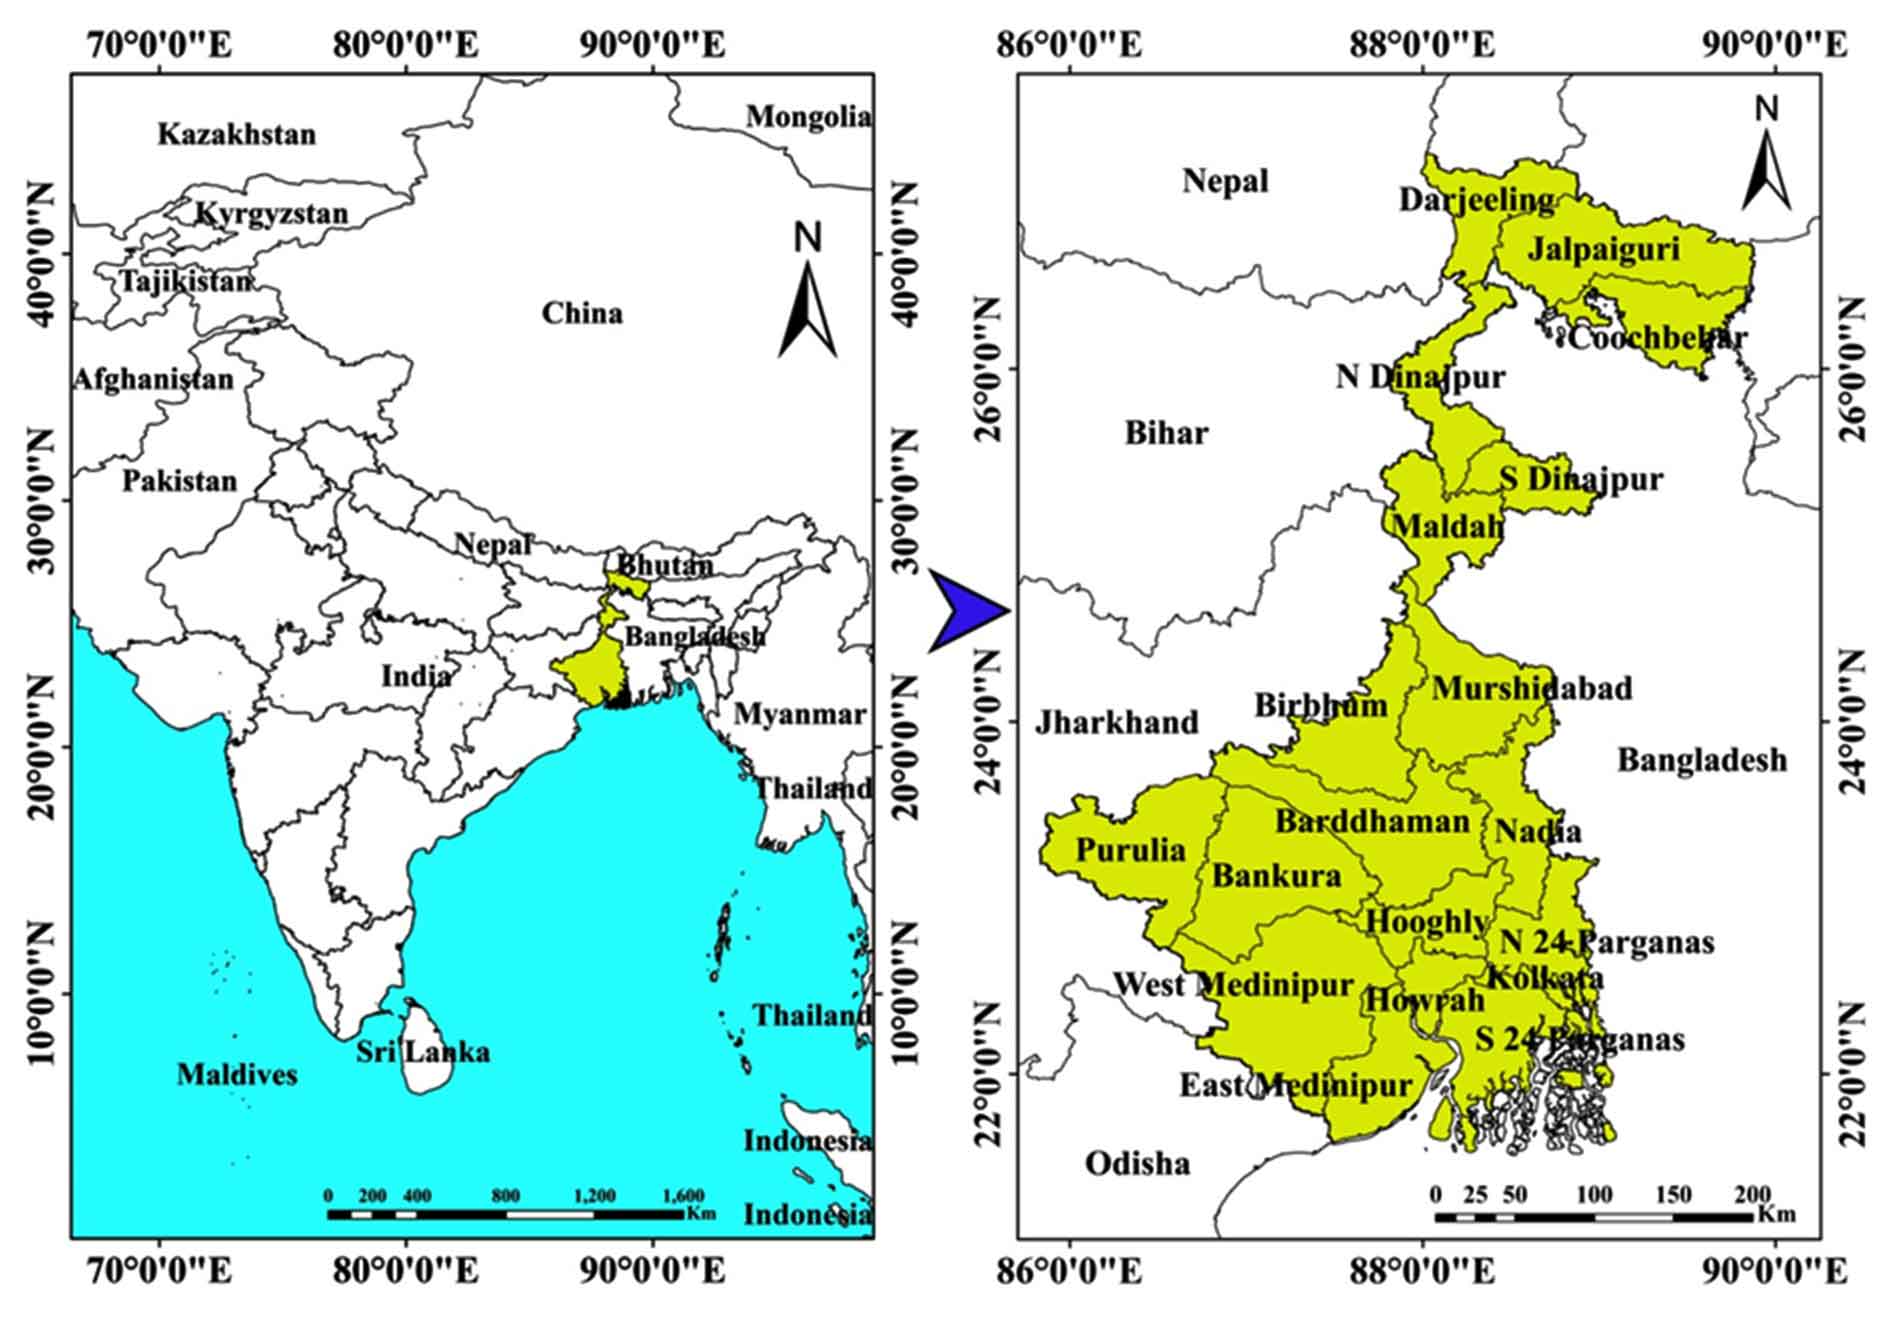
Being located in the eastern portions of India, West Bengal is India’s fourth populous state stretching from the Himalayas in the North, Bay of Bengal in the South, Bihar and Jharkhand in the West and Bangladesh in the East (Figure 1). According to the recent estimates of Census of India (2011), the population growth rate of West Bengal is 13.8%, and the total population is 91,276,115. The state is composed of 23 districts. West Bengal is brimmed with picturesque magnificence with broadened scenes and outstanding natural beauty (Shakeel, 2001). Traditionally, West Bengal is dominated by agriculture and as well as small and medium scale industries. Historically, the state is an architectural and natural heritage (Das, 2020). Several tourist attractions exist all over the state include Darjeeling (Darjeeling District), Morgan House (Kalimpong), Coochbehar Palace (Coochbehar District), Dooars, Jaladapara National Park (Alipurduar District), Gorumara National Park (Jalpaiguri District), Hazarduari Palace (Murshidabad District), Nizamat Imambara (Murshidabad District), Katra Mosque (Murshidabad District), Adina Deer Park (Maldah District), Shantiniketan (Birbhum), Birbhum Terracotta temples (Bankura), Acharya Jagadish Chandra Bose Indian Botanical Garden (Shibpur in Howrah), BBD Bagh (Kolkata), Dakshineswar Kali Temple (North 24 Parganas), Belur Math (Howrah), Victoria Memorial (Kolkata), Sundarban (Southern 24 Parganas District), Digha (Purba Medinipur District), Mandarmani (Purba Medinipur District), Mayapur (Nadia District), Kumortuli (North Kolkata) and Eden Gardens (Kolkata). The tourism of West Bengal is maintained by West Bengal Tourism Development Corporation Limited (WBTDCL), a government enterprise established on 29 April 1974 under the Companies Act, 1956 (www.wbtdcl.com).
2.2 Data
Relief, slope, aspect and drainage density are estimated from the Digital Elevation Model (DEM) obtained from Shuttle Radar Topographic Mission (SRTM), 2011 with 30-meter spatial resolution. Average annual rainfall data (2020) of every district is obtained from India Meteorological Department (IMD) Climate Research and Services Unit, Pune. Under the Social (S) category, population density and population growth rate are obtained from the Census of India (2011) website. Information on the total number of reserved forests, protected forests, unclassified forests are obtained from the Annual Report on Forest Cover of West Bengal, 2014-15. information on the average duration of stay, numbers of accommodation units and occupancy rates are obtained from the Annual Final Report of Tourism Survey for West Bengal (April 2014-April 2015). The information on roads is obtained from Mapcruzin. All spatial layers are prepared in ArcGIS 10.4.1 environment.
2.3 Analytic Hierarchy Process (AHP) Procedure
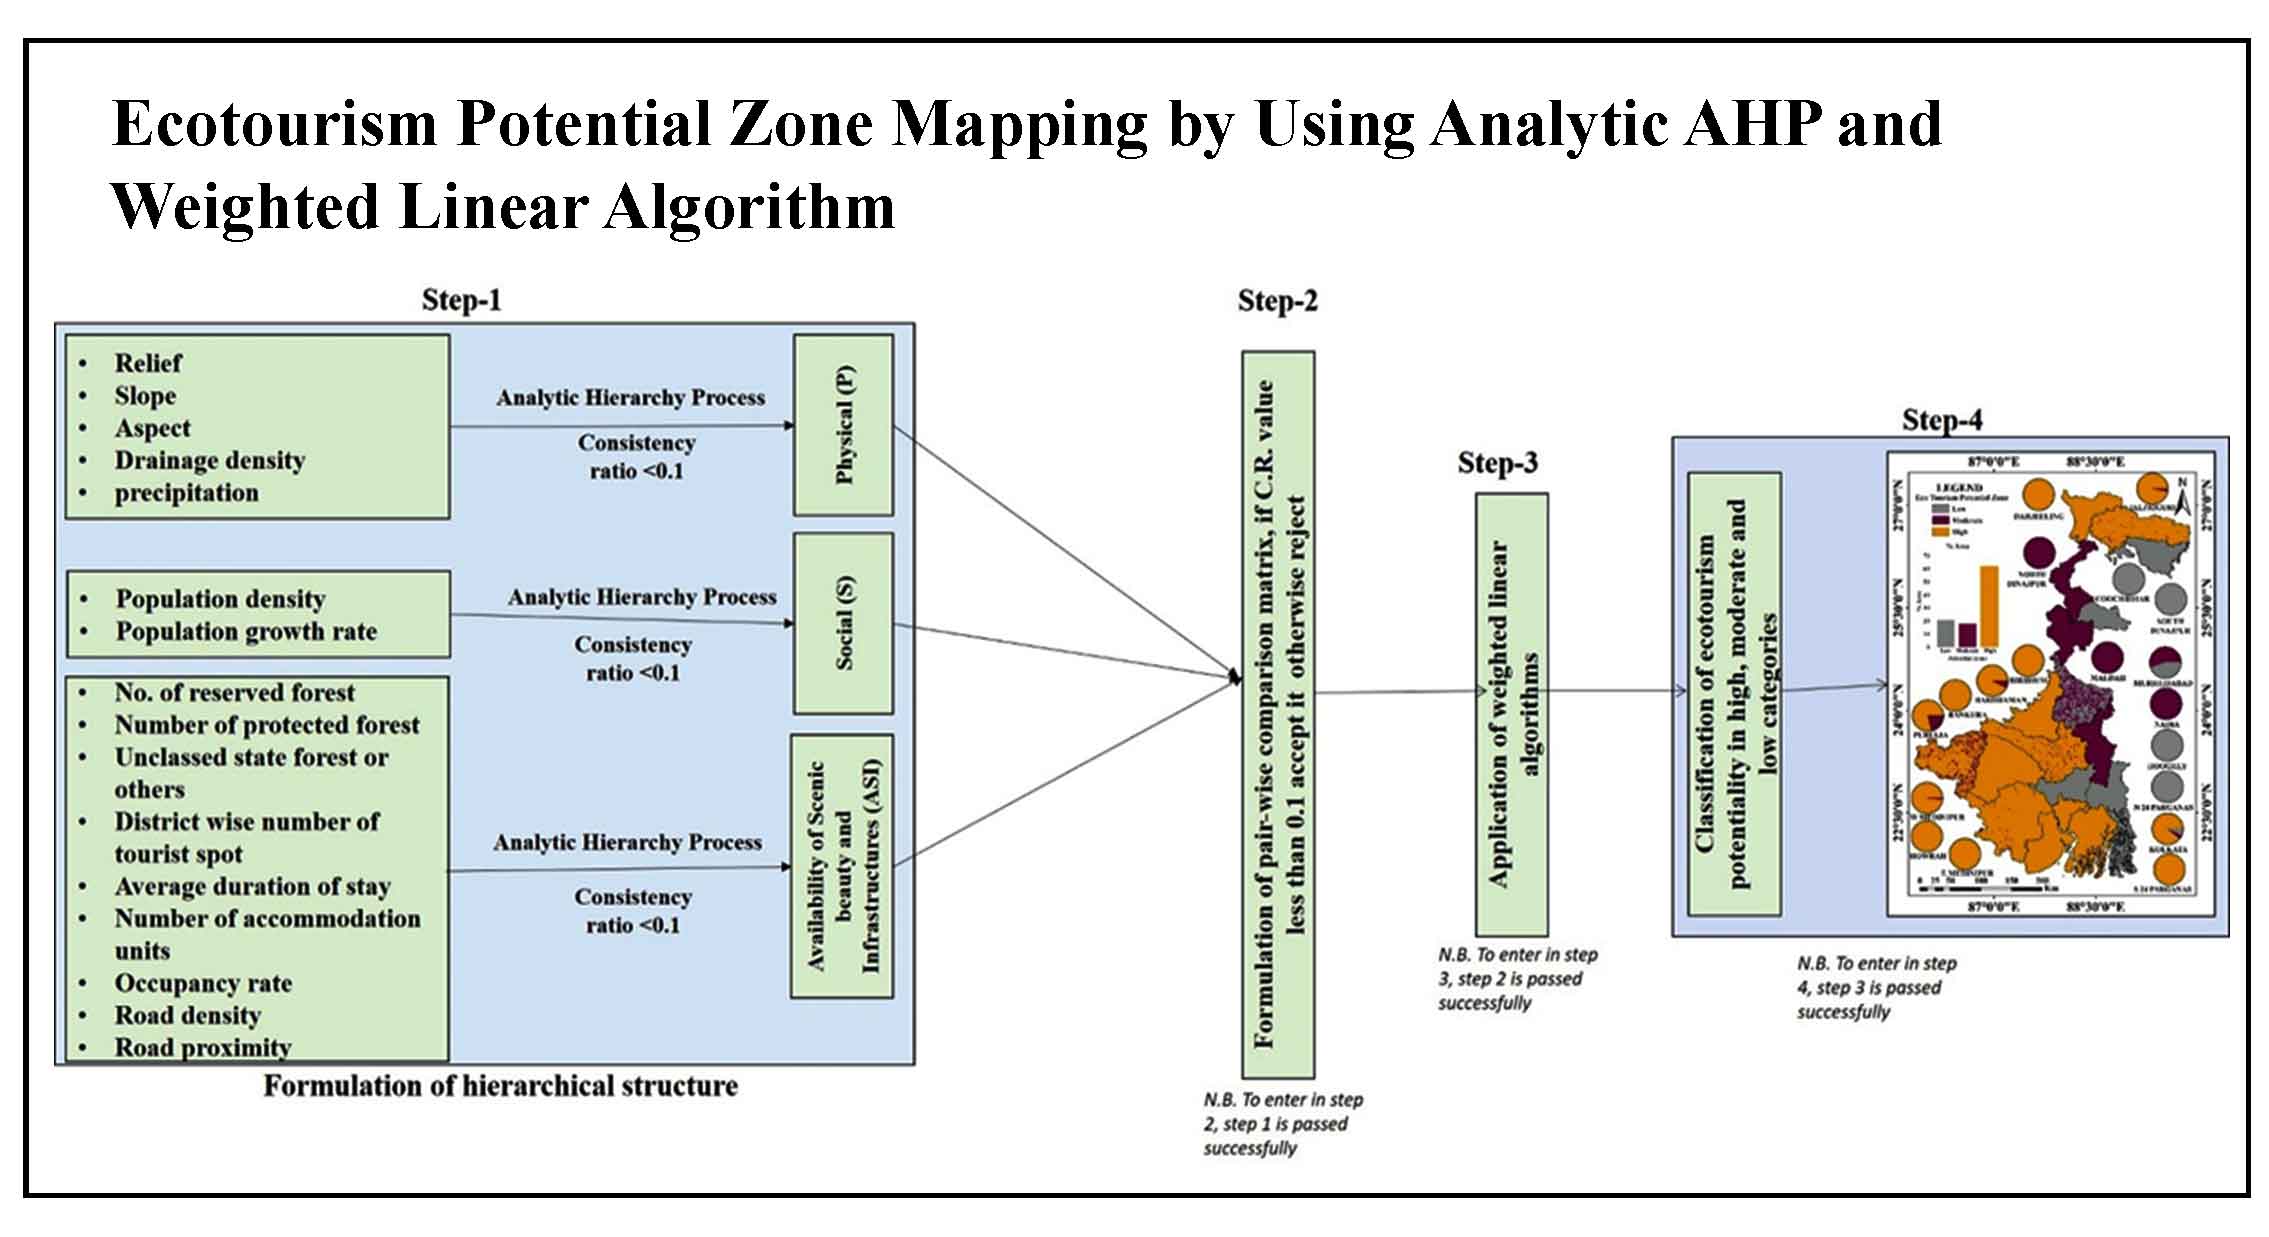
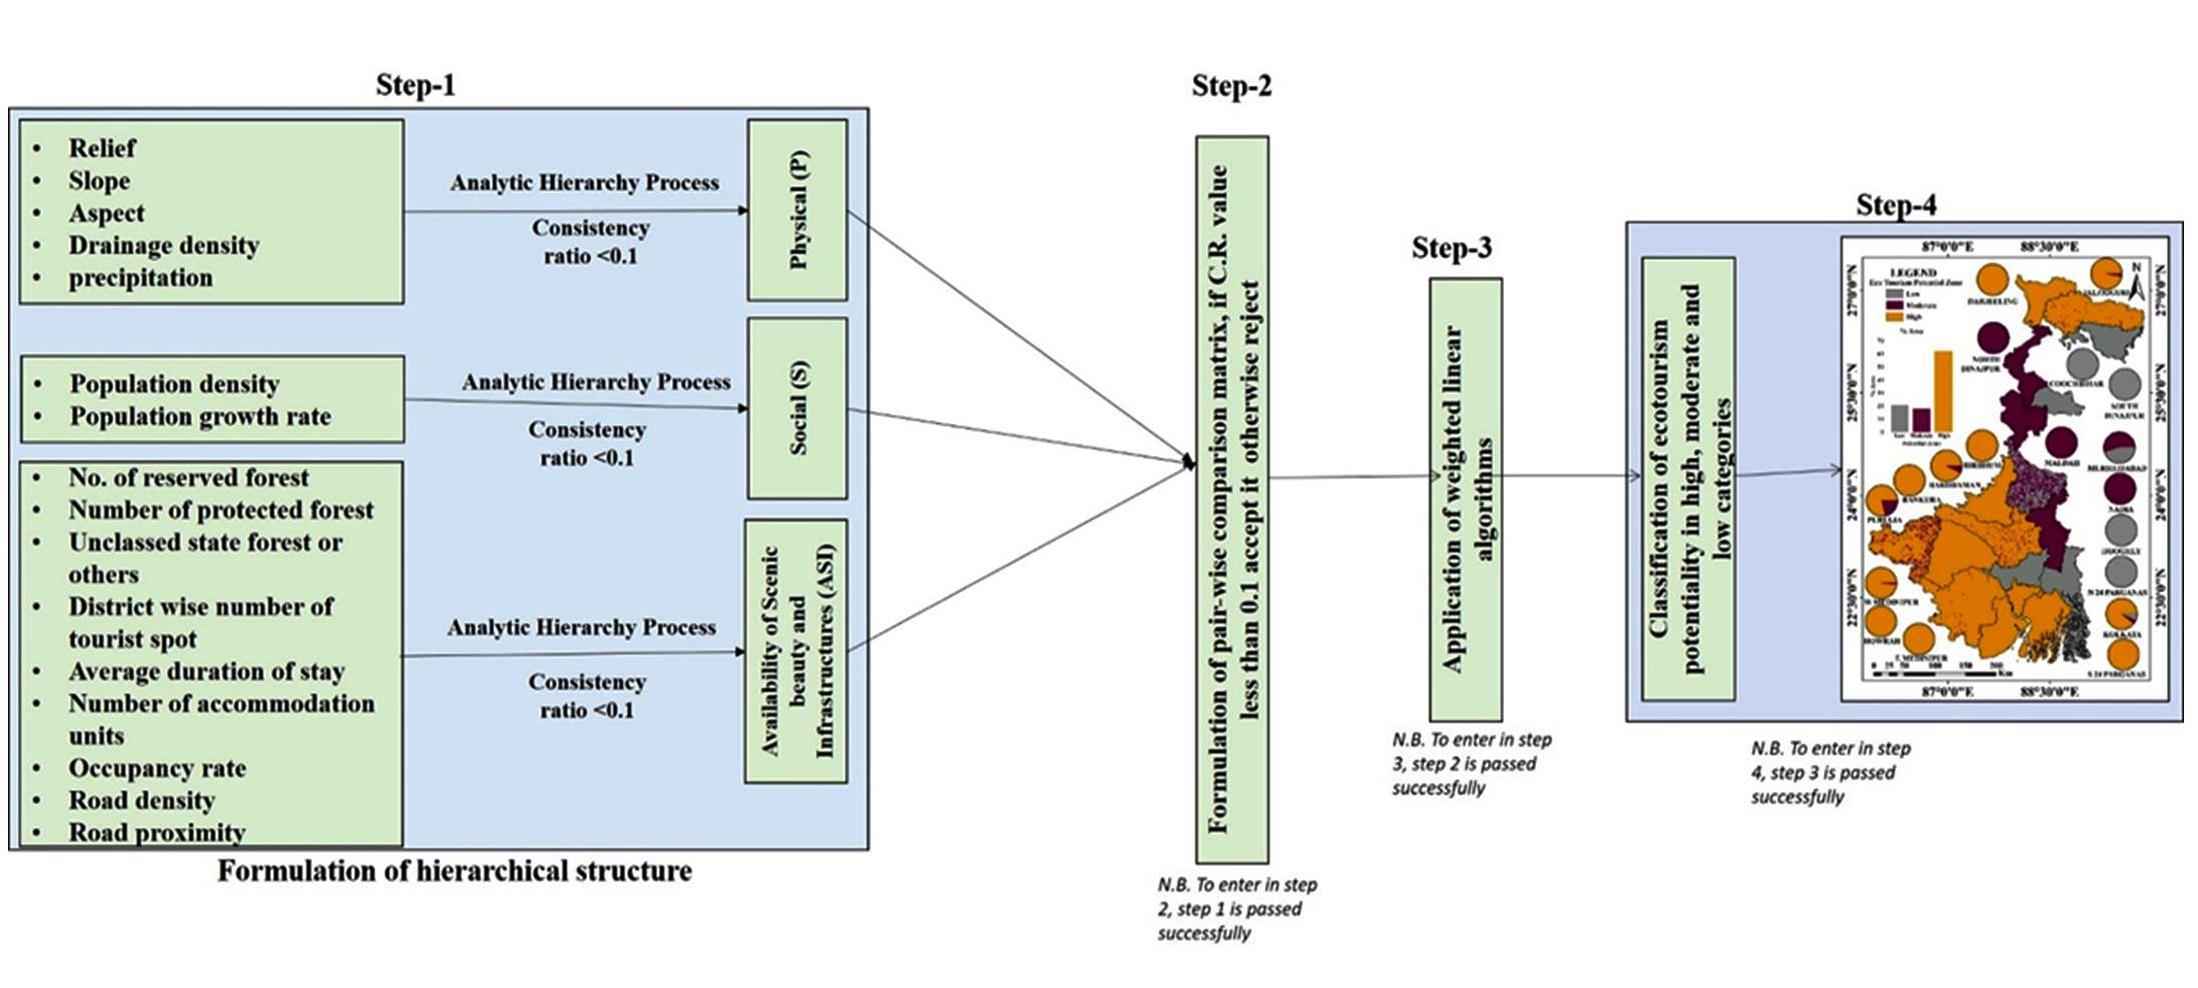
AHP is an MCDM procedure that relies on mathematics and human choice (Forman and Gass, 2001). It is developed by Saaty (1980) to find out one of the best solutions from the varieties of available options. It is an objective mathematical technique to express the pair-wise comparison between several parameters (Lin and Kou, 2015). AHP produces a consistency ratio at each step, making the method more reliable than other available techniques (Kumru and Kumru, 2014). Ishizaka and Lusti (2006) develop the AHP procedure by considering four individual steps (Figure 2).
2.3.1 Preparation of Hierarchical Methodological Framework
A schematic hierarchical structure has been outlined to carry out the research (Figure 2). 16 thematic layers are selected and grouped under 3 broad categories, which are physical (P), social (S) and availability of scenic beauty and infrastructures (ASI). Five parameters (i.e., slope, aspect, relief, drainage density, and rainfall) are included in physical (P); two parameters (i.e., population density and population growth rate) are included within social (S), and 9 parameters (i.e., reserved forest, protected forest, unclassified forests, district-wise numbers of the tourist spot, the average duration of stay, number of accommodation units, occupancy rate, road density and road proximity) are attached under availability of scenic beauty and infrastructures (ASI). Physical parameters express the local physical environment, creating an initial environmental setup for ecotourism (Stronza et al., 2019). Social (S) parameters are needed to specify the population structure of a particular tourist spot (Gavalas et al., 2014; Skibins et al., 2013). Ecotourism is generally flourished with a balanced population structure. According to the report published by the Forest Survey of India (2013), a reserved forest area is notified with a “full degree of protection” (IFA, 2027; Rahman, 2000). Generally, all human activities like hunting and gathering are prohibited in these portions. However, after taking proper permission, enjoying scenic beauty from a watchtower is permissible (Ghosh, 2014; IFA, 2027). On the contrary, the provisions applied for protected forests are flexible. “All types of human activities are permitted in this portion until it is prohibited” (Ghosh, 2014; IFA, 2027). Categories of forests that are not included in the above two categories are included in the unclassified forest category (IFA, 2027). District-wise numbers of the tourist spot, the average duration of stay, number of accommodation units, occupancy rate, road density and road proximity are selected in this research following the recommendations of United Nations World Tourism Organizations (Ferguson, 2007; Mohanty, 2008; Narasimmaraj, 2014; Wickramasinghe, 2013; Abraham and Rajasenan, 2015). All parameters under ASI are in a positive relationship with ecotourism potentiality (Boley and Green, 2016). If ASI value increases, ecotourism potentiality value increases and vice-versa.
2.3.2 Formulation of Pair-Wise Comparison Matrices
In the second step, pair-wise comparison matrices signify the relative importance of each criterion (Table 3, Table 4, Table 5 and Table 6). Here, each criterion is rated against the other with the help of a relative dominance scale 1 to 9 (Table 1, Saaty, 1980). By containing an equal number of rows and columns, the pair-wise comparison matrix expresses the relative importance of each criterion (Fabec and Zver, 2011). For example, in table 4 (first row), relief, drainage density and rainfall are more important than the aspect. So, the aspect is coded as 3 (Moderate importance), and the relief, drainage density and rainfall are coded as 8 (Very strong to extreme importance). Table 3 signifies the relative importance of 3 broad criteria: ASI, S and P. Here, ASI is observed with the highest priority (80.60% weightage). At its successive level, social (S) and physical (P) variables are noticed with 11.70% and 7.70% importance. Table 4 denotes the pair-wise comparison matrix of the physical (P) variable by 5 criteria. In this case, the slope is observed with the highest importance (55.00% weightage) followed by aspect (25.10% weightage), relief (8.80% weightage), drainage density (6.70% weightage) and rainfall (4.40% weightage). Table 5 is determined by two criteria which are population density and population growth rate. 50% weightage is assigned for each criterion. Table 6 denotes the pair-wise comparison matrix of ASI. Here, reserved forest achieves highest priority (33.00% weightage) followed by district-wise numbers of tourist spot (18.30% weightage), unclassified forests (12.00% weightage), protected forests (11.50% weightage), average duration of stay (8.40% weightage), the number of accommodation units (5.10% weightage), occupancy rate (4.90% weightage), road density (3.80% weightage) and road proximity (3.20% weightage). In each case, the consistency ratio is calculated to judge whether the matrices are consistent or not. If the C.R value is less than 0.1, the matrix is said to be consistent and vice-versa:
\(Consistency \ ratio = {Consistency Index \ (C.I.) \over Random \ Consistency \ Index \ (RI)}\) (1)
\(Consistency \ Index \ (CI) = (λ_{max}-n)/(n-1)\) (2)
where, λmax is the principal eigenvalue and n is the number of factors.
The random Consistency Index (Table 2) is derived from the randomly generated reciprocal matrices (Bunruamkaew and Murayam, 2011; Dashti et al., 2013). According to Saaty (1980), the matrix becomes consistent if the consistency ratio is below 0.1. In our study, consistency ratios are 0.07 (Table 3), 0.056 (Table 4), and 0.012 (Table 5). So, here all matrices are consistent, and the estimated criteria weights are utilized for tourism potentiality zone identification. The pair-wise comparison matrix for each subclass (for each raster layer) is also consistent.
Table 1. Description of scales for pair comparison for AHP (Saaty, 1980)
|
Scales
|
Degree of preferences
|
Descriptions
|
|
1
|
Equally important
|
The contributions of two factors are equally important
|
|
3
|
Moderate importance
|
Experiences and judgment slightly tend to certain factor
|
|
5
|
Strong importance
|
Experiences and judgment strongly tend to certain factor
|
|
7
|
Very strong importance
|
Experiences and judgment tend to certain factor with extreme strong
|
|
9
|
Extreme importance
|
There is sufficient evidence for absolutely tending to certain factor
|
|
2,4,6,8
|
Intermediate values
|
In between two judgments
|
Table 2. Random index value (Saaty, 1980)
|
Order of matrix
|
R.I.
|
|
1
|
0.0
|
|
2
|
0.0
|
|
3
|
0.58
|
|
4
|
0.90
|
|
5
|
1.12
|
|
6
|
1.24
|
|
7
|
1.32
|
|
8
|
1.41
|
|
9
|
1.45
|
|
10
|
1.49
|
|
11
|
1.51
|
|
12
|
1.48
|
Table 3. Pair-wise comparison matrix of 3 broad criterions
|
Criterions
|
Availability of forests and infrastructures (AFI)
|
Social (S)
|
Physical (P)
|
Priority
(%)
|
Rank
|
(+)
(%)
|
(-)
(%)
|
|
Availability of scenic beauty and infrastructures (ASI)
|
1
|
9
|
8
|
80.60
|
1
|
21.60
|
21.60
|
|
Social (S)
|
0.11
|
1
|
2
|
11.70
|
2
|
3.10
|
3.10
|
|
Physical (P)
|
0.12
|
0.5
|
1
|
7.70
|
3
|
2.10
|
2.10
|
Number of comparison 3, Principal Eigen value 3.074, Consistency Ratio 0.07.
Table 4. Pair-wise comparison matrix of physical (P) parameters
|
Criteria
|
Slope
|
Aspect
|
Relief
|
Drainage density
|
Precipitation
|
Priority (%)
|
Rank
|
(+)
(%)
|
(-)
(%)
|
|
Slope (SL)
|
1
|
3
|
8
|
8
|
8
|
55.00
|
1
|
15.20
|
15.20
|
|
Aspect (AS)
|
0.33
|
1
|
3
|
6
|
5
|
25.10
|
2
|
8.00
|
8.00
|
|
Relief (RL)
|
0.12
|
0.33
|
1
|
2
|
2
|
8.80
|
3
|
2.30
|
2.30
|
|
Drainage density (DD)
|
0.12
|
0.17
|
0.5
|
1
|
3
|
6.70
|
4
|
3.40
|
3.40
|
|
Precipitation (PR)
|
0.12
|
0.2
|
0.5
|
0.33
|
1
|
4.40
|
5
|
1.60
|
1.60
|
Number of comparisons 10, Principal Eigen value 5.253, Consistency Ratio 0.056.
Table 5. Pair-wise comparison matrix of social (S) parameters
|
Criteria
|
Slope
|
Aspect
|
Priority (%)
|
Rank
|
(+)
(%)
|
(-)
(%)
|
|
Population density (PD)
|
1
|
2
|
50.00
|
1
|
50.00
|
50.00
|
|
Population growth rate (PGR)
|
0.50
|
1
|
50.00
|
2
|
50.00
|
50.00
|
Number of comparisons 2, Principal Eigen value 1.253, Consistency Ratio 0.012.
Table 6. Pair-wise comparison matrix of availability of scenic beauty and infrastructure (ASI)
|
Criterions
|
Reserved forest
|
Protected forest
|
Unclassified forests (UCF)
|
District-wise number of tourist spot
|
Average duration of stay
|
Number of accommodation units
|
Occupancy rate
|
Road density
|
Road proximity
|
Priority (%)
|
|
Reserved forest (RF)
|
1
|
2
|
3
|
5
|
2
|
9
|
9
|
7
|
5
|
33.00
|
|
Protected forest (PF)
|
0.5
|
1
|
2
|
1
|
1
|
2
|
2
|
2
|
3
|
11.50
|
|
Unclassified forests (UCF)
|
0.33
|
0.5
|
1
|
1
|
2
|
5
|
1
|
3
|
5
|
12.00
|
|
District-wise number of tourist spots
|
0.2
|
1
|
1
|
1
|
3
|
9
|
9
|
3
|
3
|
18.30
|
|
Average duration of stay
|
0.5
|
1
|
0.5
|
0.33
|
1
|
1
|
2
|
3
|
3
|
8.40
|
|
Number of accommodation units
|
0.11
|
0.5
|
0.2
|
0.11
|
1
|
1
|
2
|
2
|
2
|
5.10
|
|
Occupancy rate (%)
|
0.11
|
0.5
|
1
|
0.11
|
0.5
|
0.5
|
1
|
2
|
2
|
4.90
|
|
Road density
|
0.14
|
0.5
|
0.33
|
0.33
|
0.33
|
0.5
|
0.5
|
1
|
2
|
3.80
|
|
Road proximity
|
0.2
|
0.33
|
0.2
|
0.33
|
0.33
|
0.5
|
0.5
|
0.5
|
1
|
3.20
|
Number of comparisons 36, Principal Eigen value 10.065, Consistency Ratio 0.093.
2.3.3 Application of Weighted Linear Algorithm
The weighted linear algorithm is applied to make the spatial assessment of each composite variable. The procedures are as follows (Gigović et al., 2016; Yang et al., 2015):
- At first, all input rasters are reclassified into the relative dominance scale.
- At the second step, all cell values of input rasters are multiplied by the weight of importance.
- At the third stage, the resulting cell values are added together to get the final raster.
Following the above methodology, all rasters of physical (P), social (S) and availability of scenic beauty and infrastructures (ASI) are estimated. So, the weighted linear algorithm strategy can be expressed as follows:
\(ETPZ=∑_{(w=1)}^m∑_{(r=1)}^n(T_w× T_r)\) (3)
where, ETPZ represents the ecotourism potential zone, \(T_w\) represents the normalized weight of w thematic layers. m signifies the total number of thematic layers, and n is the total number of the subclass of each thematic layer.
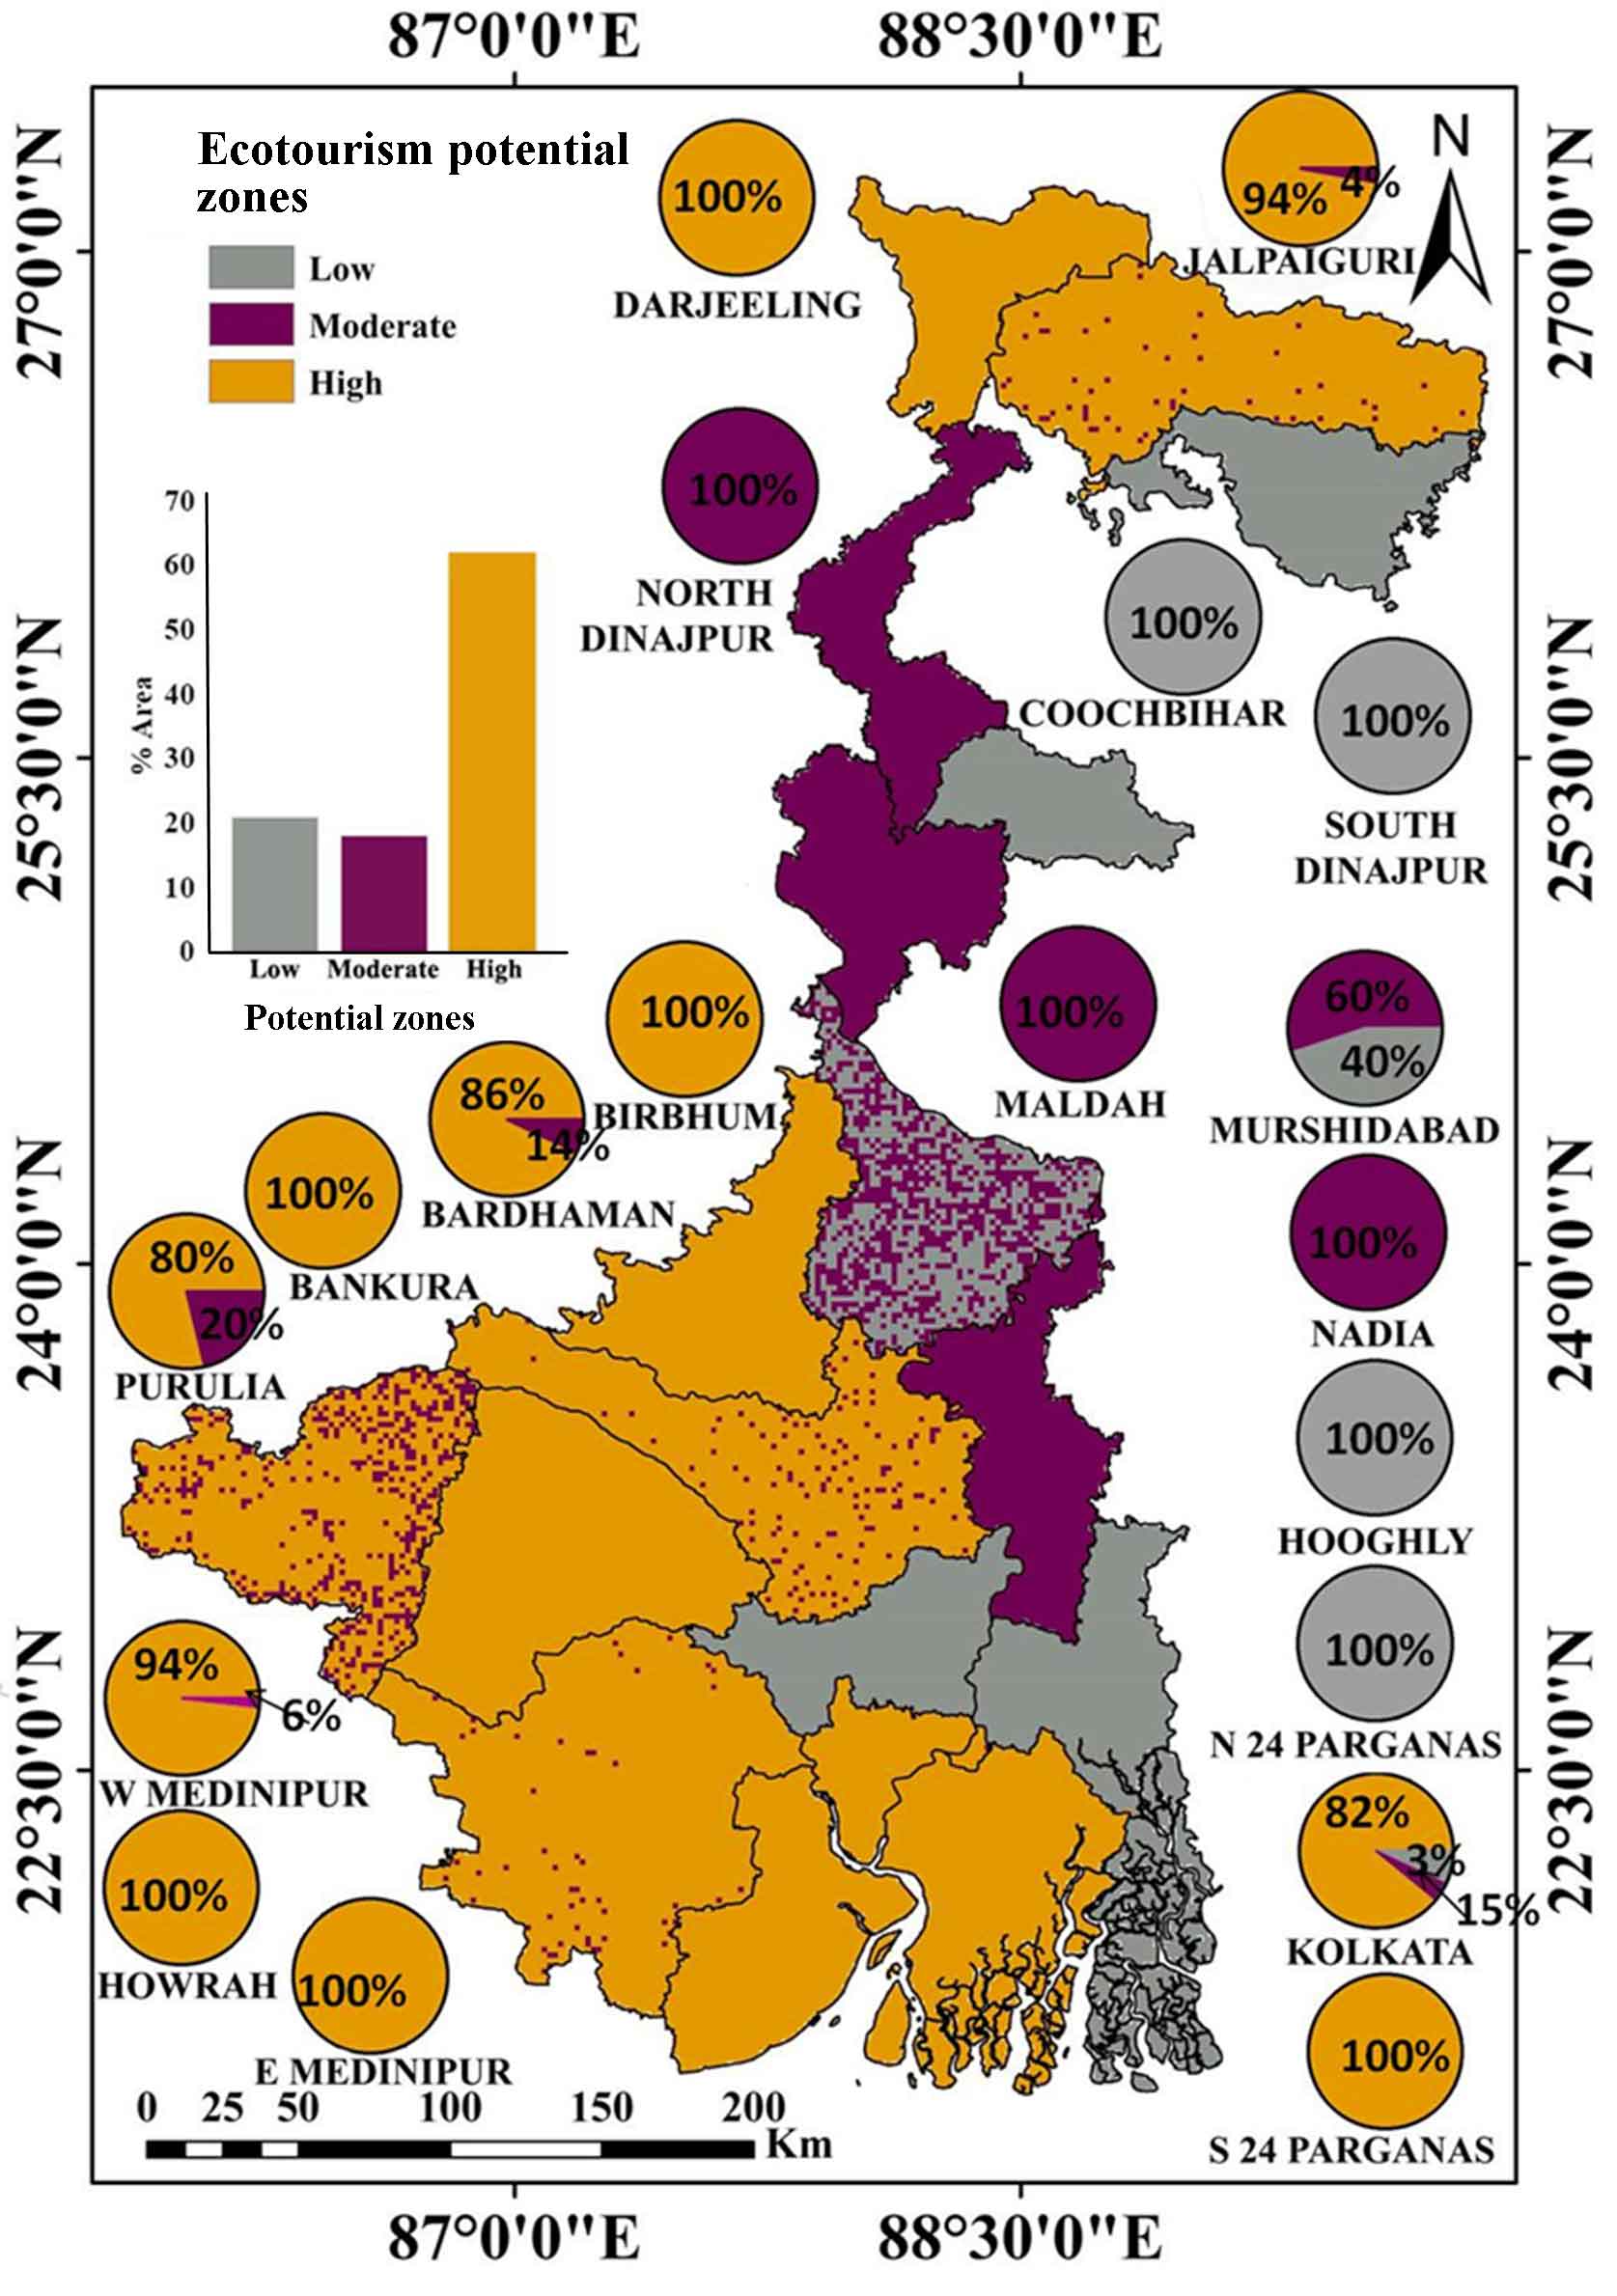
2.4 Classification of Ecotourism Potentiality Map
At the fourth stage, the ecotourism potentiality map has been classified into high, moderate and low categories by utilizing the Dominant and Distinctive Function:
\(≤(x ̅+L)/2\) is considered as low potentiality (4)
\((x ̅+L)/2≤ETZ≤x ̅\) is considered as moderate potentiality (5)
\(ETZ≥x ̅\) is considered as high potentiality (6)
where, L, \(x ̅\) and \(δ\) represent lower class boundary, the mean and standard deviation of ecotourism potentiality zone (ETPZ), respectively. All spatial assessments are done using ArcGIS-10.2, 10.4 and open access R-programming software.
2.5 Criterions
2.5.1 Physical Parameters
The physical (P) parameters include slope, aspect, relief, drainage density, and rainfall under the physical (P) parameter.
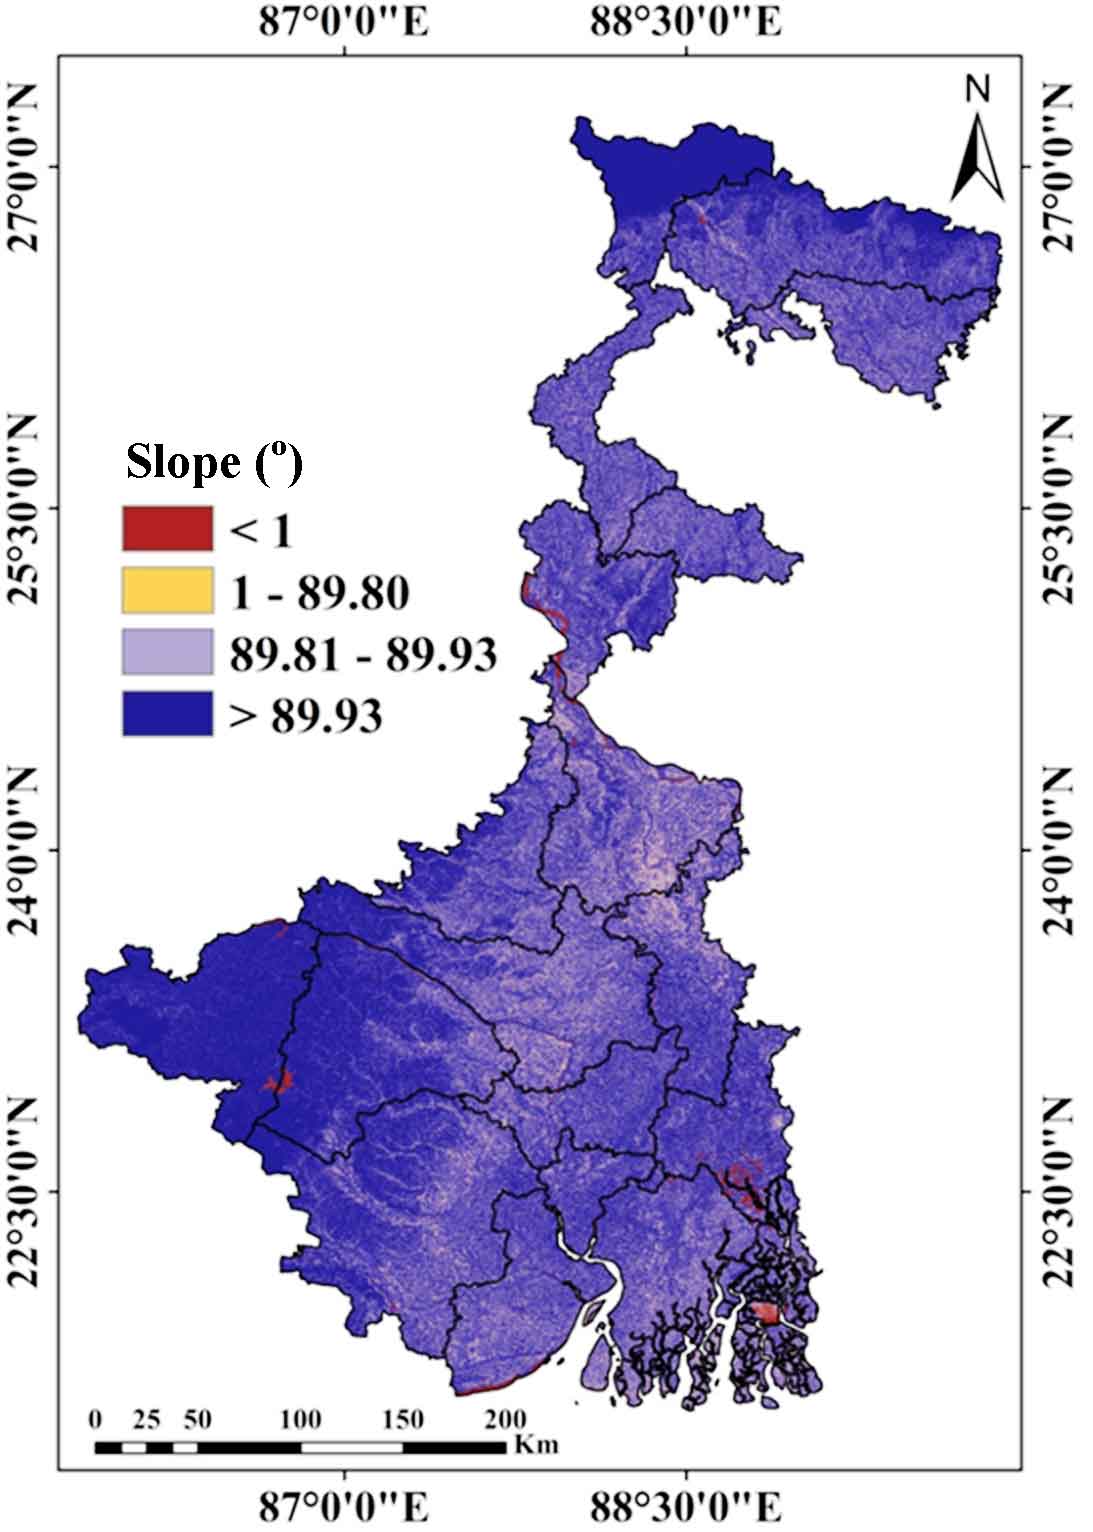
2.5.1.1 Slope
Within West Bengal, the slope varies from 0 degree to 90 degree. Overall, slope is classified to 4 groups i.e., <1 degree (about 1.65% area), 1 degree to 89.80 degree (about 5.80% area), 89.81 degree to 89.93 degree (about 26.09% area) and greater than 89.93 degree (about 66.45% area). Western and Northern parts of West Bengal are observed with moderate slope, and Southeast portions of West Bengal are noticed with flat terrain. So, overall, West Bengal is noticed with moderate to low slope value. According to their importance, the priorities are assigned to each class, where a moderate slope indicates better possibilities to develop potential ecotourism sites (Sahani, 2019a; Ambecha et al., 2020). Following this rule, the slope is reclassified and coded as 1,3, 5 and 7, respectively.
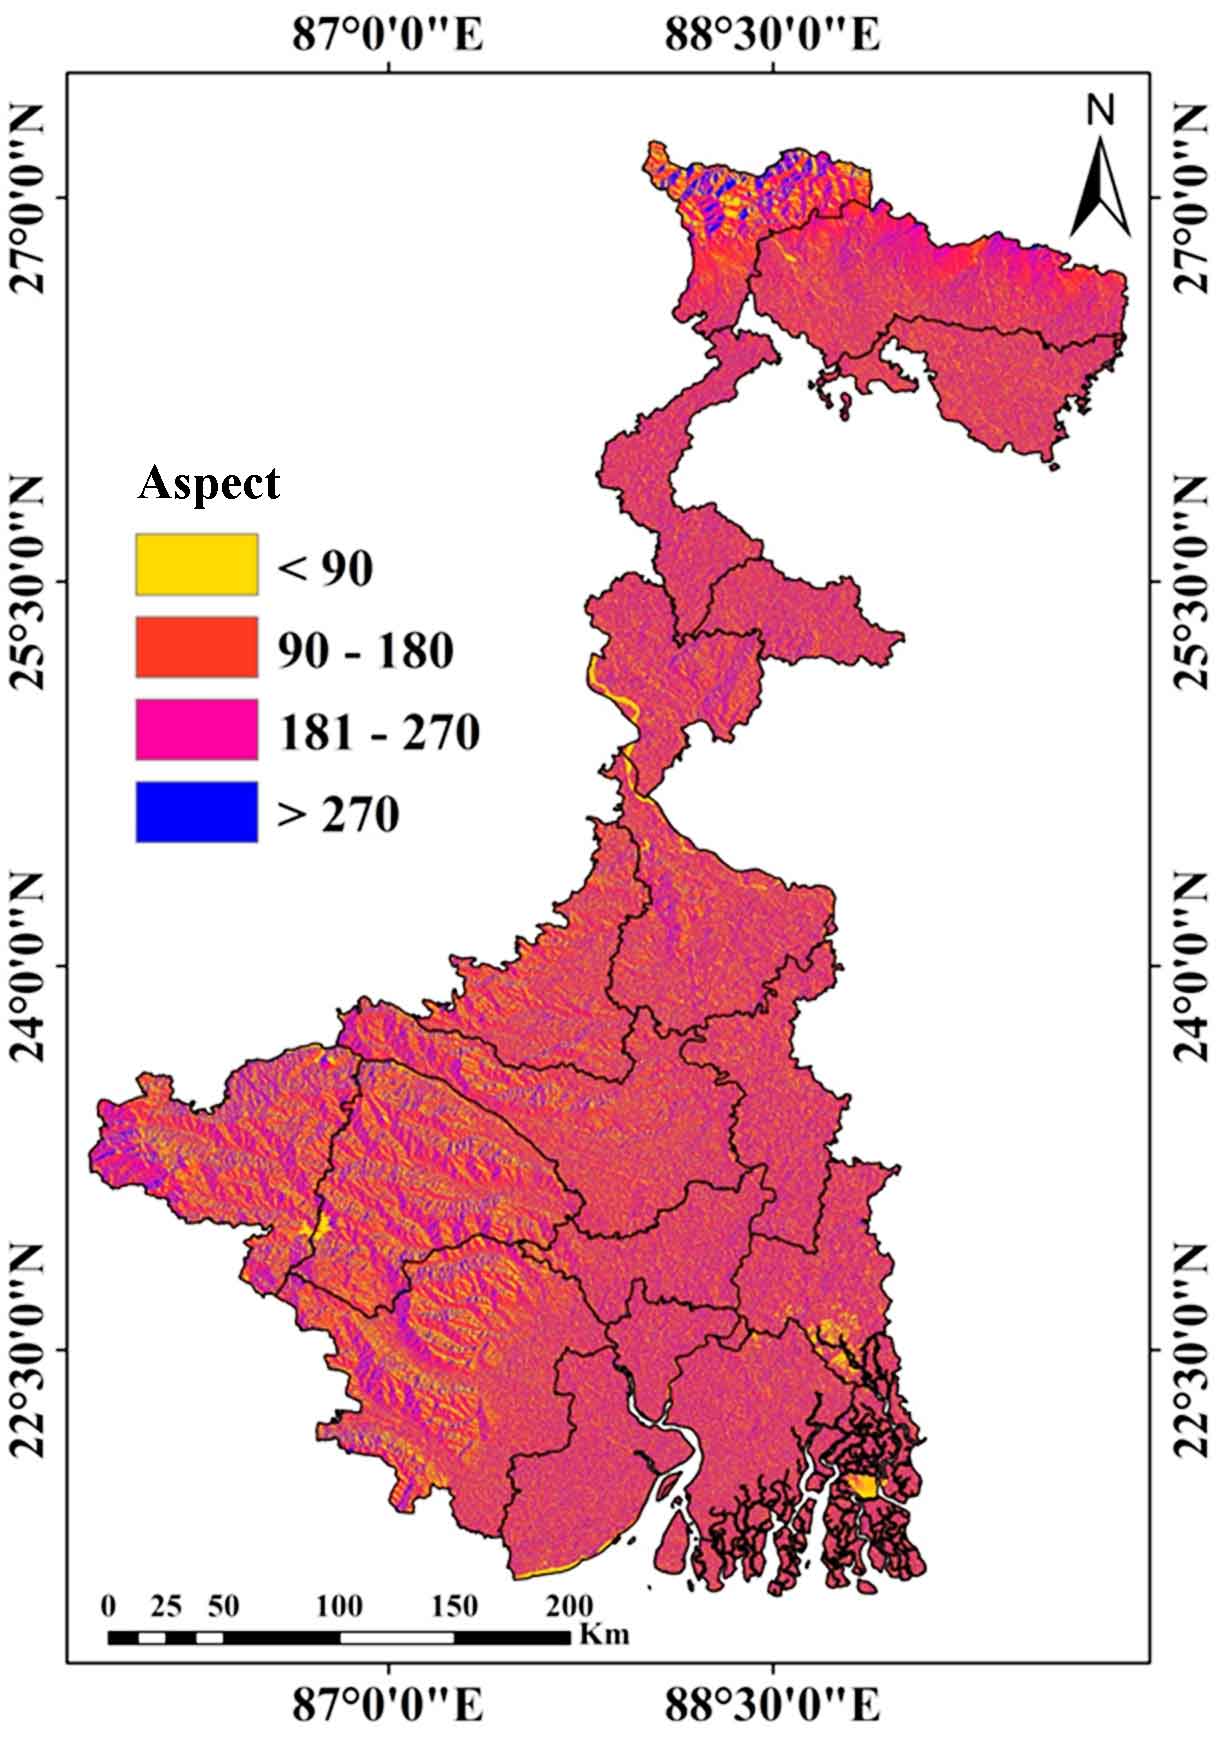
2.5.1.2 Aspect
Figure 4 represents the aspect map of the study area. Relatively high aspect (>181) is noticed at the northern and western portions of the study area. On the other hand, the eastern and southern parts of West Bengal achieve a relatively low aspect (<180) value. The aspect of West Bengal is classified into four individual classes, which are less than 90 (28.52% area), 90 to 180 (26.49% area), 181 to 270 (24.71% area) and greater than 270 (20.27% area). Preferences are selected for each class following the importance where the high aspect positively influences the ecotourism potentialities (Ryngnga, 2008; Karki et al., 2020). Here, the aspect is reclassified into 4 classes, and following the above principle, they are coded as 1,3, 5 and 7, respectively. As the aspect increases, ecotourism potentiality increases and vice-versa.
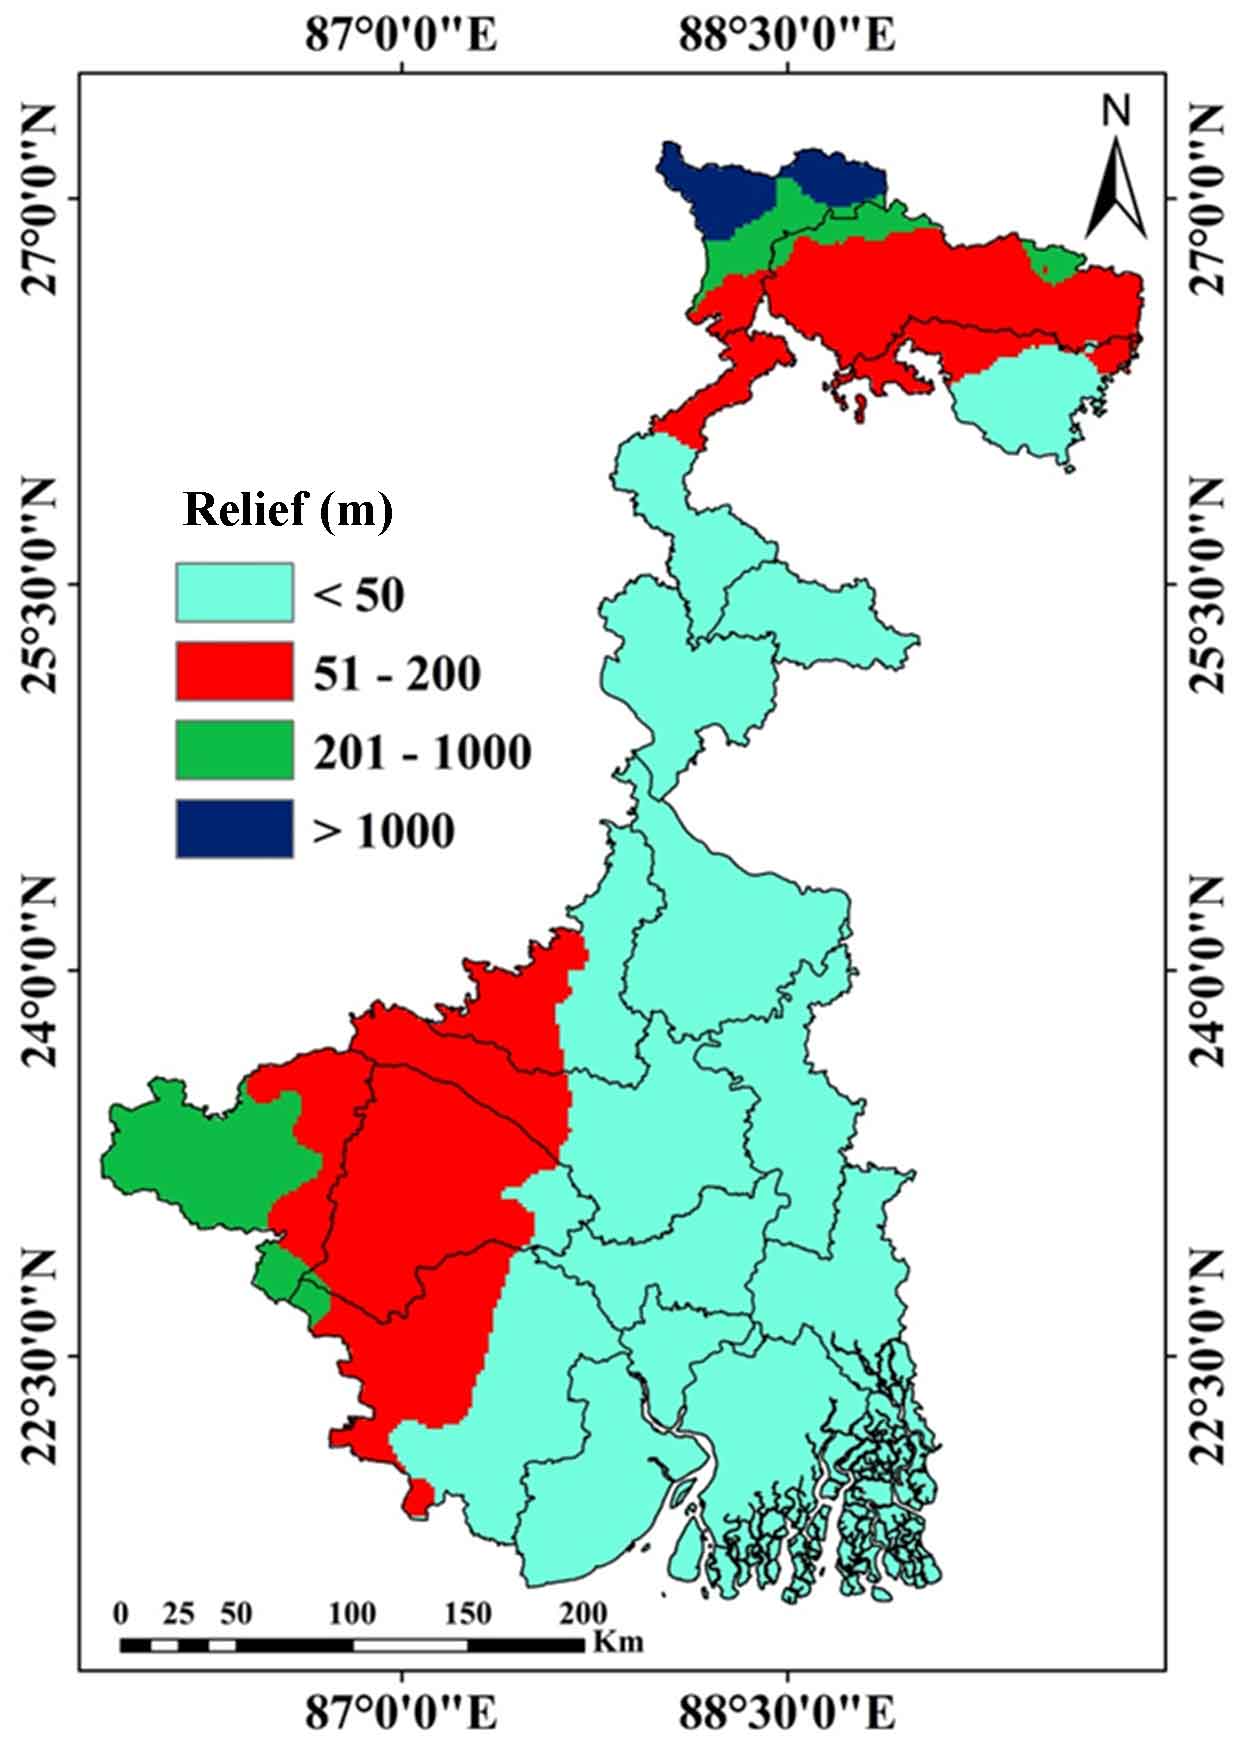
2.5.1.3 Relief
Overall, the relief (in meter) (Figure 5) of West Bengal fluctuates from 0 to 1456 meters. Here, relief is classified into 4 individual categories which are <50 meter (61.74% area), 51 meter to 200 meter (28.98% area), 201 meter to 1000 meter (8.05% area) and >1000 meter (1.22% area). The highest relief (>1000 meters) is concentrated in the north-western portions of the study region. The partial portions of Northern and Western parts of the study region are observed with relatively high relief (>201 meters). On the other hand, southern and eastern portions are observed with plain land (<50 meters). Overall, West Bengal is noticed with moderate to low relief. Ecotourism potentiality is positively correlated with moderate altitude (relief) (Kiper, 2013; Stronza et al., 2019). Keeping this fact in mind, the relief has been reclassified into 4 categories, and with increasing relief, they are recoded with 1,3, 5 and 7 priorities respectively. As relief increases (moderate to low), priority (weights) increases and vice-versa.
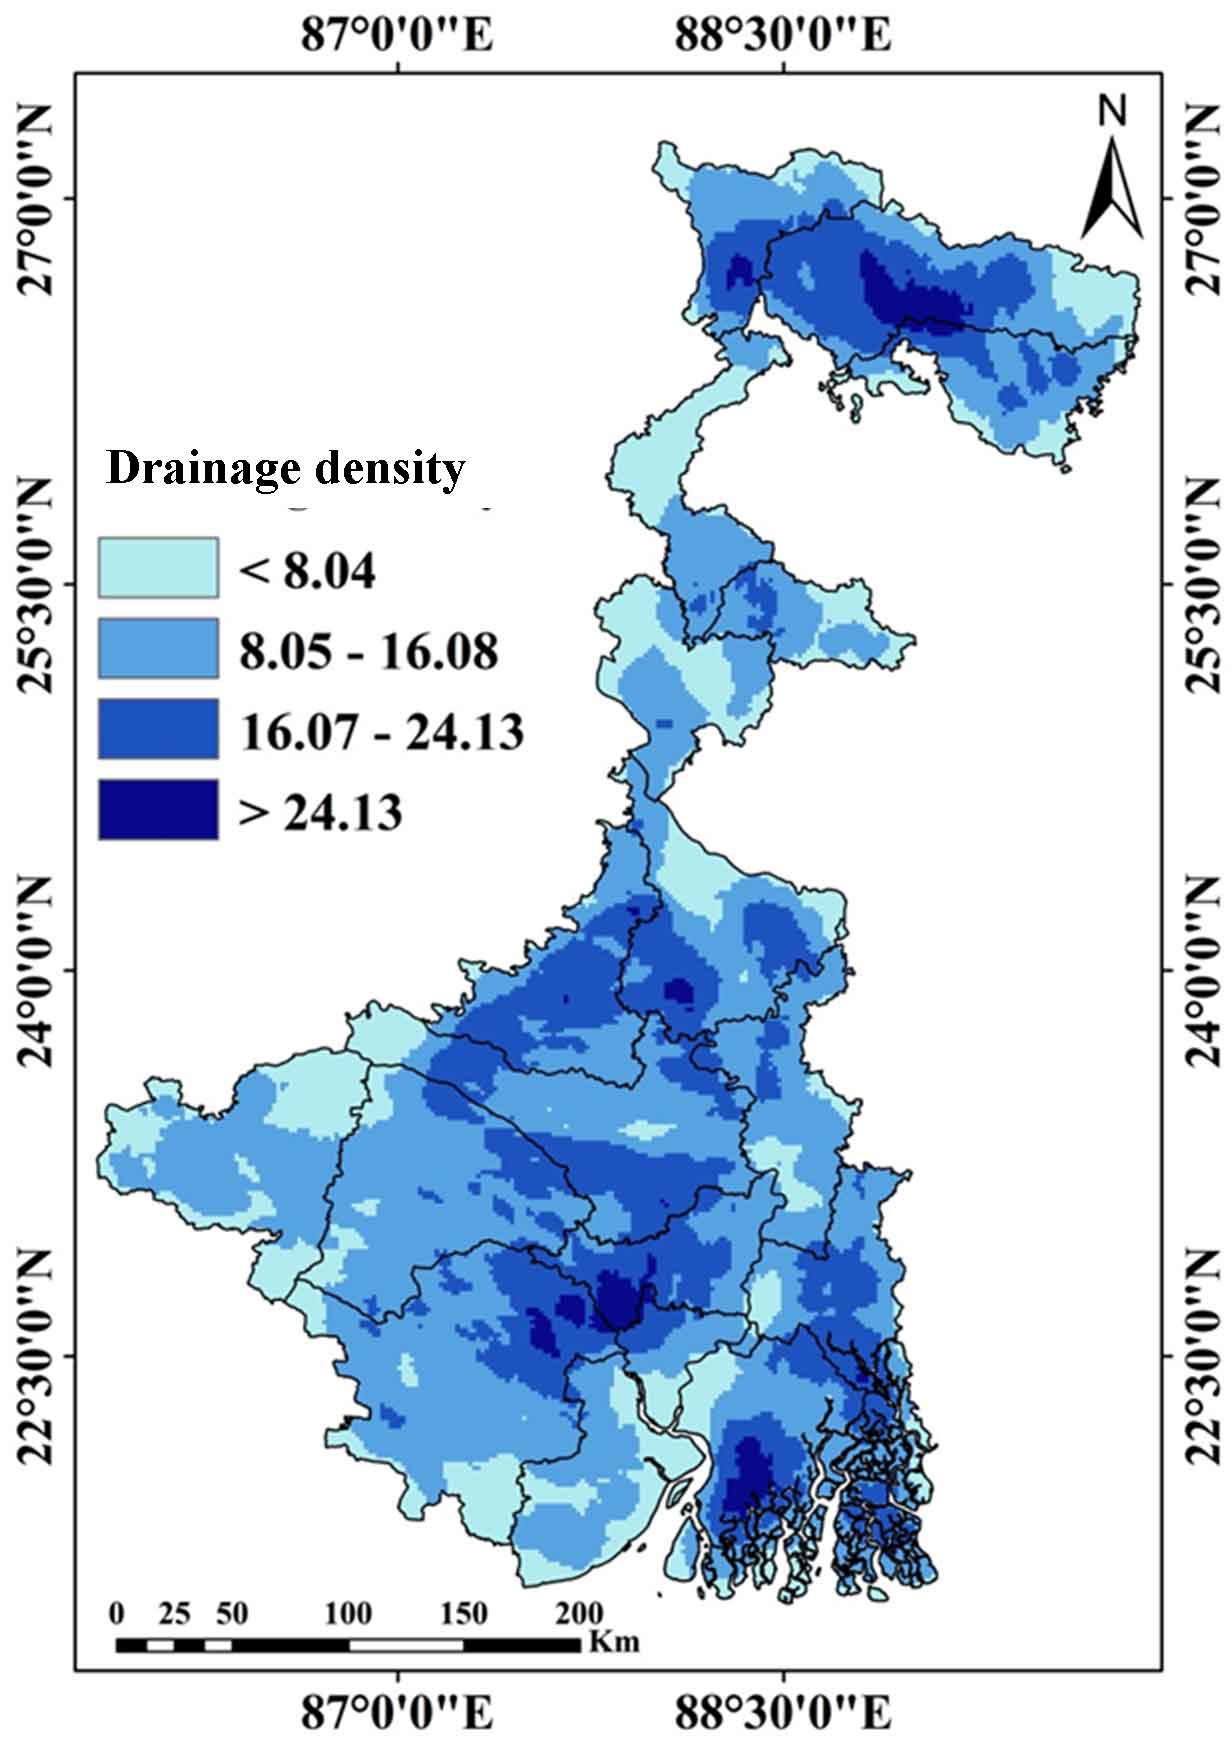
2.5.1.4 Drainage Density
Drainage density of the study region (Figure 6) varies from 0.01 km/ sq km. to 32.17 km/sq. km. Drainage densities of West Bengal are classified into 4 classes, i.e., <8.04 km./sq.km. (20.74% area), 8.05 km./sq.km. to 16.08 km/sq.km. (51.62% area), 16.08 km/sq.km. to 24.13 km./sq.km. (24.93% area) and greater than 24.13 km/sq.km. (2.71% area). Northern portions of West Bengal are observed with relatively dense drainage, and the western portions of the study area are noticed with relatively less drainage density. Drainage density enhances ecotourism potentiality (Zabihi et al., 2018; Ronizi et al., 2020; Fernando and Shariff, 2013). Here, drainage density is reclassified into 4 classes and considering the above rule, those classes are coded as 1, 3, 5 and 7.
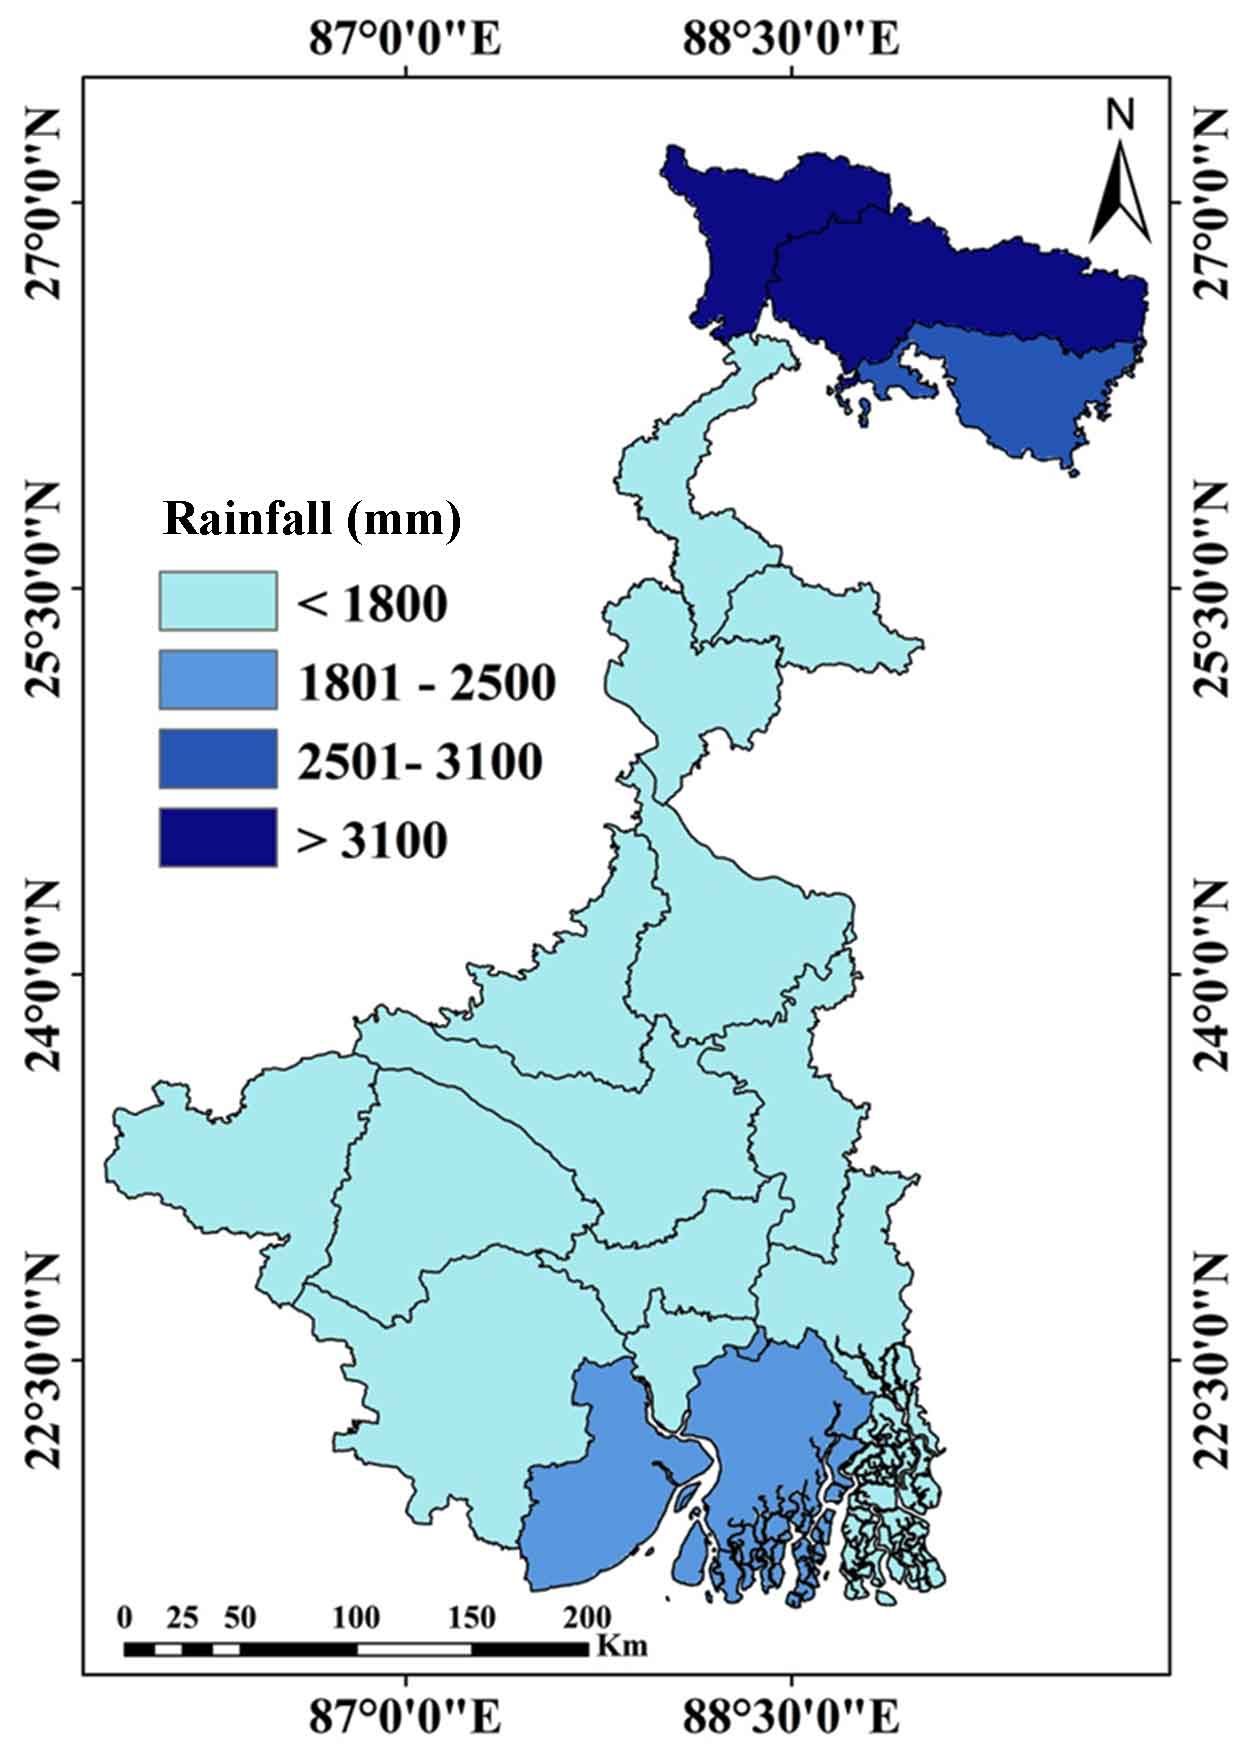
2.5.1.5 Rainfall
Rainfall of West Bengal (Figure 7) varies from <1800 mm to >3100 mm within the study area. The highest rainfall (>3100 mm) is concentrated in the study area’s northern and southern portions. Rest portions are noticed with less than 1800 mm. rainfall. The priorities are assigned to each class according to the importance where rainfall availability enhances ecotourism potentiality (Suddin, 2017; Rahman et al., 2013). Rainfall raster map is reclassified into 4 groups and they are coded as 2 (74% area), 4 (11% area), 6 (4% area) and 8 (11% area) respectively. As the rainfall increases, ecotourism potentiality also increases and vice-versa.
2.5.2 Social Parameters
Population density (Figure 8) and population growth rate (Figure 9) are considered under social (S), which can be explained as follows:
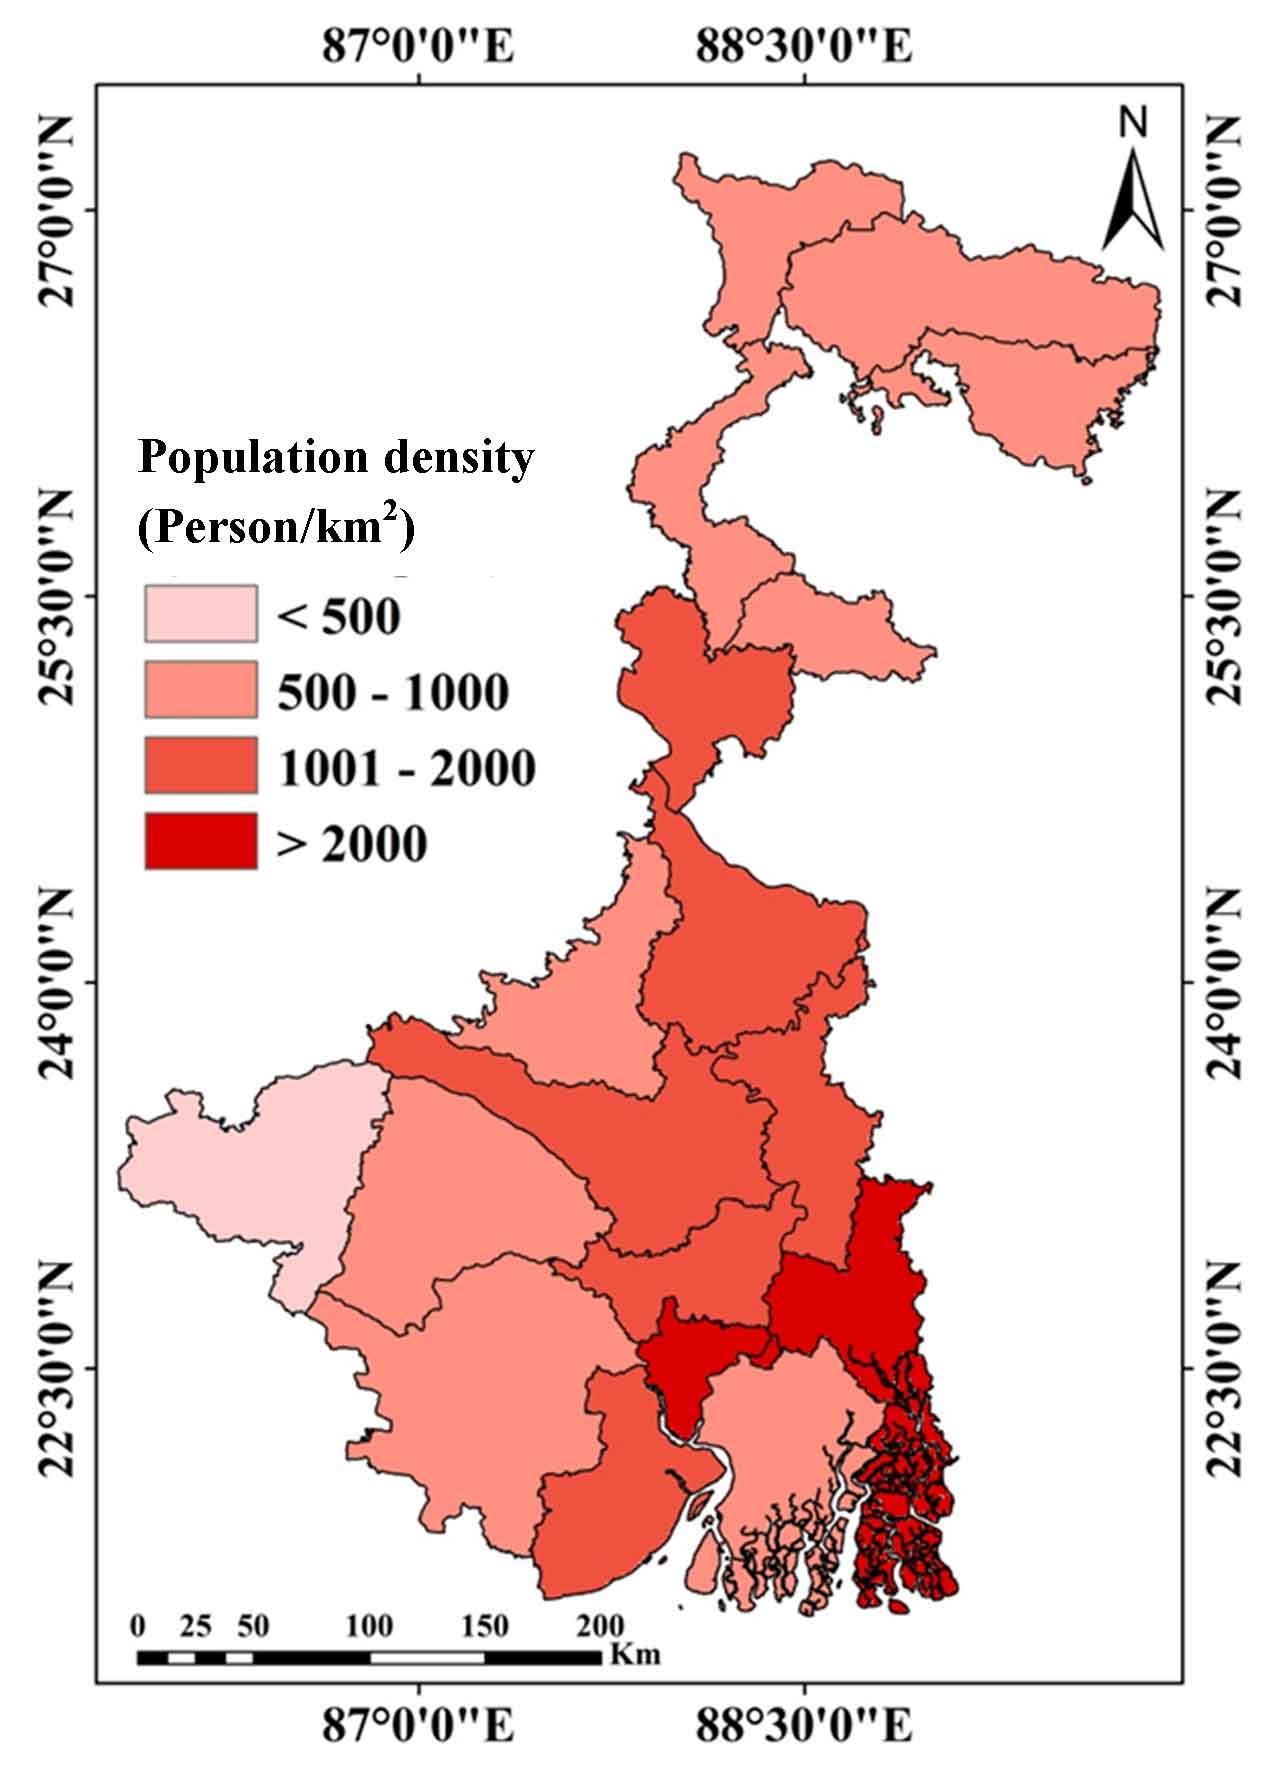
2.5.2.1 Population Density
Higher population densities (>2000 persons/square km.) are observed at Kolkata, North-24-Parganas and South-24-Parganas Districts. The lowest population density (<500 persons/sq km.) is noticed at Purulia District. Rest districts are noticed with 500 to 2000 persons/ km2. population densities. Overall, population density is classified into 4 classes i.e., <500 persons/sq km. (7.27% area), 500 to 1000 persons/sq km. (52.60% area), 1001 to 2000 persons/sq. km. (31.64% area) and >2000 persons/sq km. (8.49% area). Population densities are reclassified into 4 classes and are coded according to their priority. Generally, high population densities deteriorate ecotourism potentiality (Islam et al., 2011; Abdillah et al., 2020). Thus, here, high population densities (>200 persons/sq km) are assigned with low priority (Code 2), and low-population densities are allocated with high priority (Code 8).
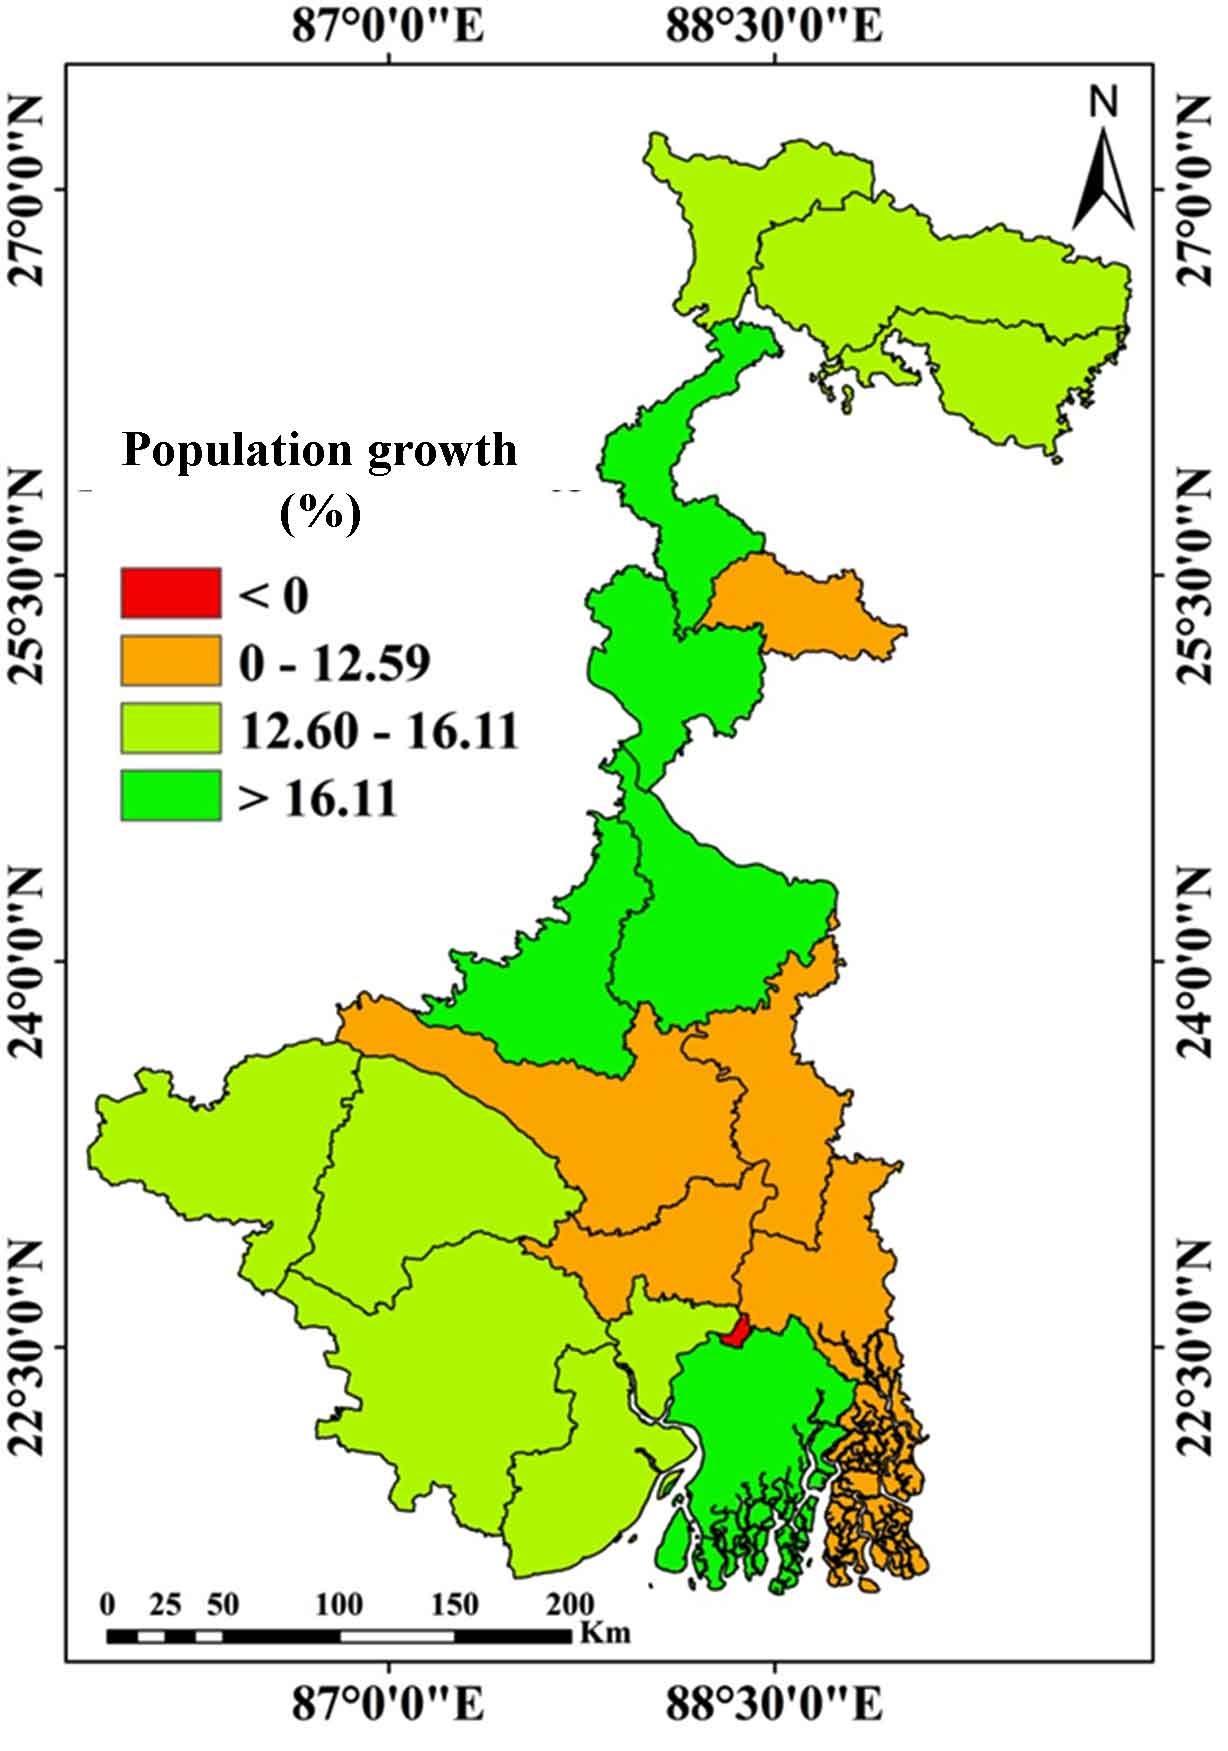
2.5.2.2 Population Growth
The population growth rate is denoted by figure 9. The lowest (negative) population growth rate is observed in Kolkata. A relatively high population growth rate (>16.11) is observed in North Dinajpur, Maldah, Birbhum, Murshidabad, and South-24 Pargana districts. Rest districts are noticed with 0% to 16.11% population growth rates. Population growth rate is classified into 4 classes i.e., <0% (1% area), 0% to 12.59% (25.73% area), 12.60% to 16.11% (48.00% area) and >16.11 % (26.17% area). The potentiality of ecotourism is hampered due to the increasing population growth rate, i.e., the population growth rate is negatively correlated with ecotourism potentiality (Torras, 2019). Here, the population growth rate is reclassified into 4 classes. Following the above rule, the lowest population growth rate is marked with the highest priority (Code 8), and the highest population growth rate is assigned with the lowest priority (Code 2).
2.5.3 Availability of Scenic Beauty and Infrastructures (ASI)
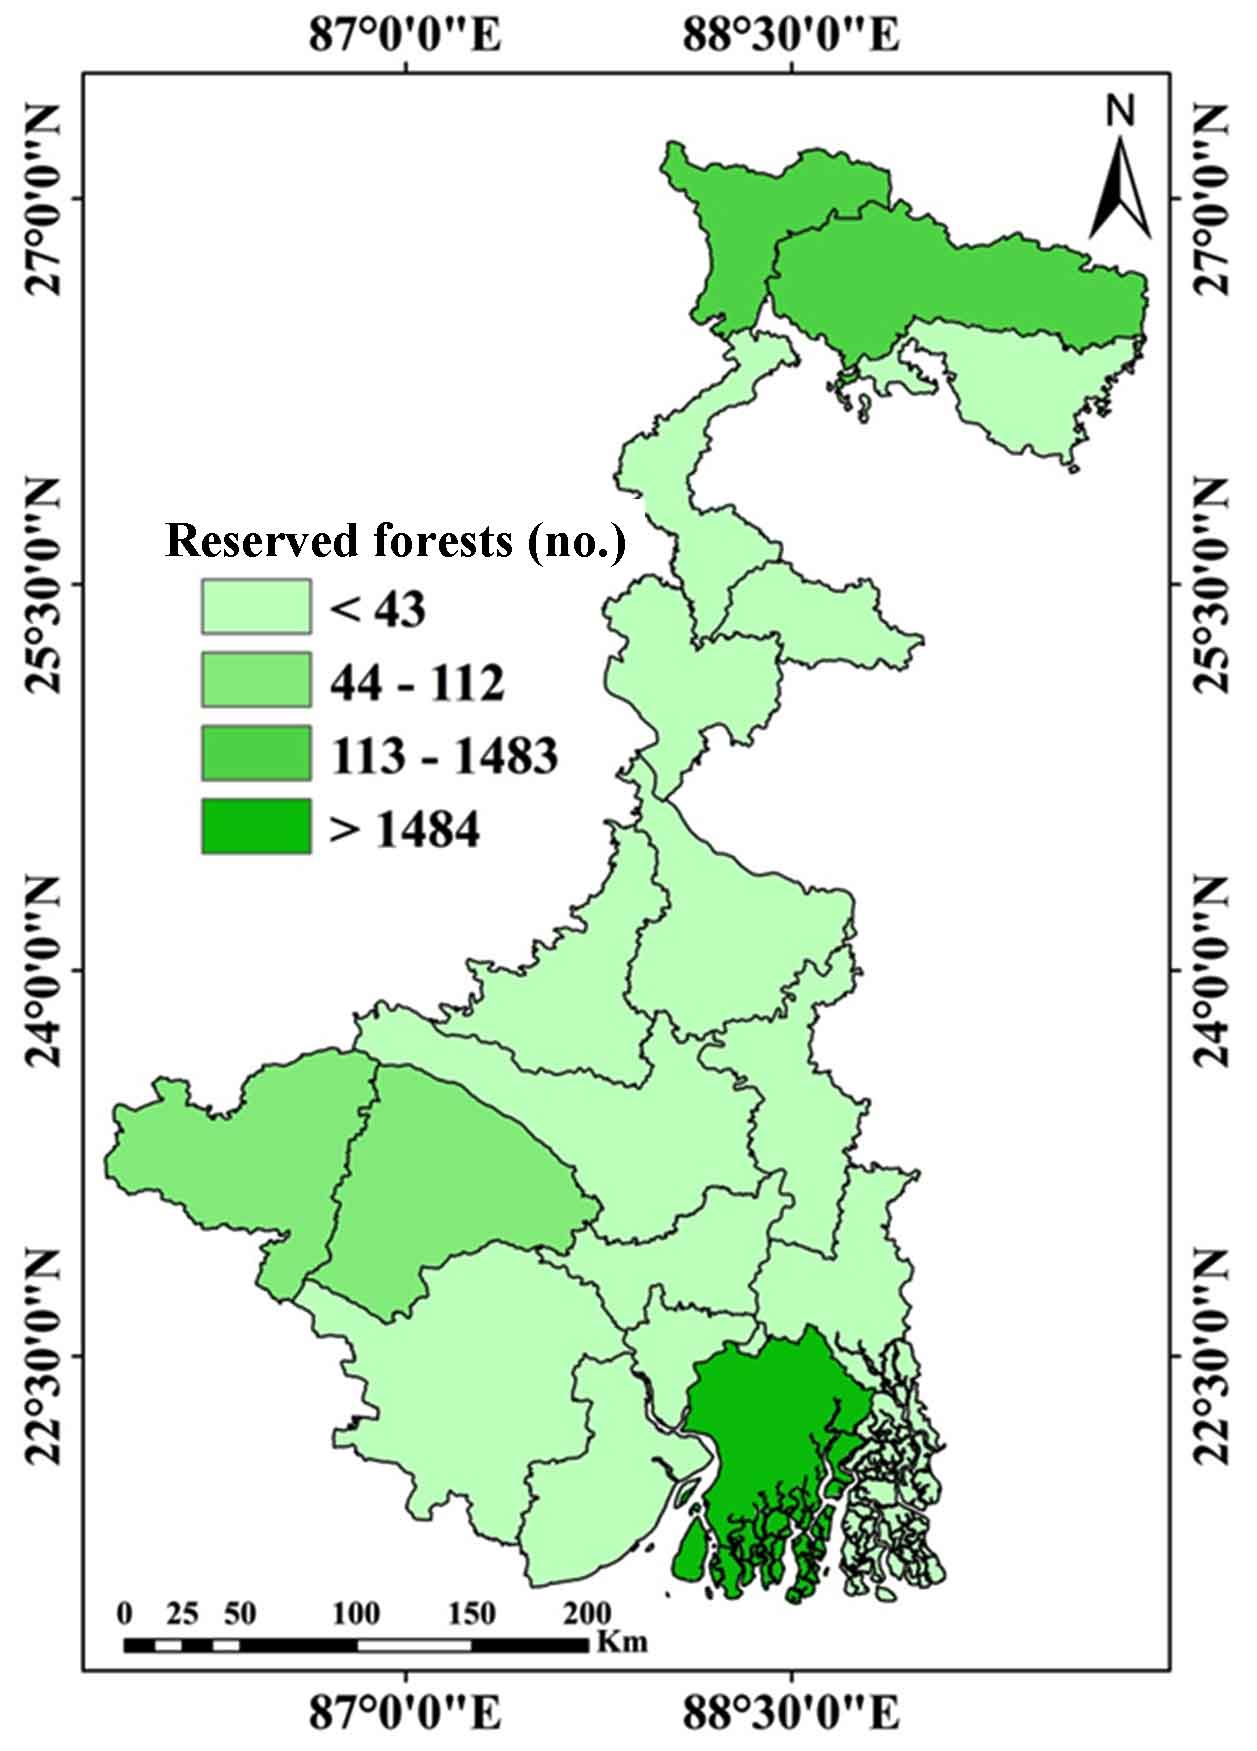
2.5.3.1 Reserved Forests
South-24 Parganas, Darjeeling, Jalpaiguri, Bankura and Purulia districts are noticed with a higher number of reserve forests (>113). Rest districts are noticed with a smaller number of reserved forests (Figure 10). Here, reserved forests (no.s) are classified into 4 classes i.e., <43 (66.91% area), 44 to 112 (15.34% area), 113 to 1483 (11.30% area) and >1484 (6.44% area). The number of reserved forests accelerates the value of ecotourism potentiality (Haque et al., 2016; Reza and Hasan, 2019). Here, the number of reserved forests is reclassified into 4 classes and following the above recommendations, the highest class (>1484) is prioritized with higher weightage (Code 8) and vice-versa.
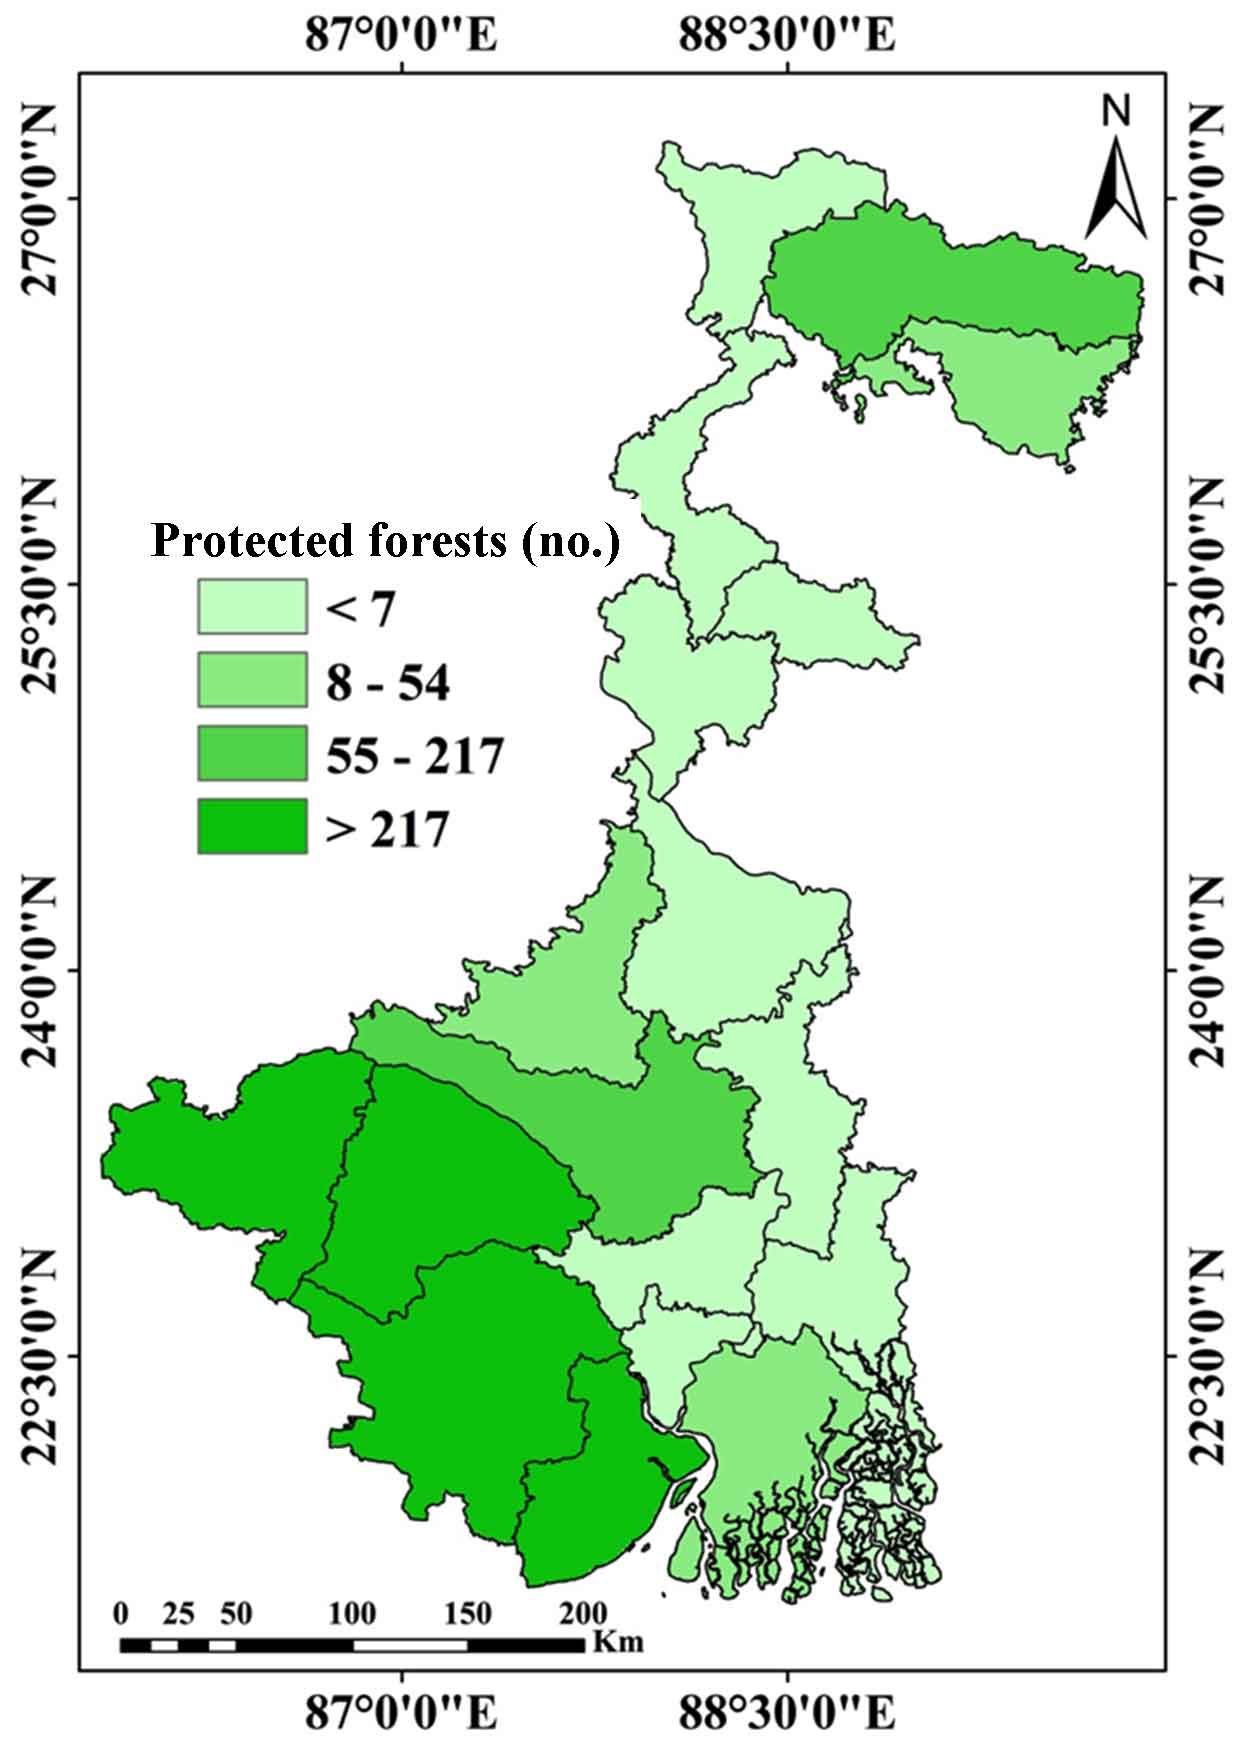
2.5.3.2 Protected Forests
Jalpaiguri, Barddhaman, Bankura, Purulia, West Dinajpur and East Dinajpur districts are noticed with many protected forests (>55). The number of protected forests in South-24-Parganas, Birbhum and Coochbehar districts varies between 8 to 54. Rest districts are identified with a relatively low number of protected forests (Figure 11). Here, the number of protected forests is classified into 4 classes, i.e., <7 (37.53% area), 8 to 54 (15.90% area), 55 to 217 (15.67% area) and >217 (30.91% area). The number of protected forests is positively correlated with ecotourism potentiality (Aryal et al., 2019; Hossain and Wadood, 2020). The number of protected forests is reclassified into 4 groups, and following the above recommendations, those classes are coded with 2, 4, 6 and 8. As the number of protected forests increases, ecotourism potentiality also increases and vice-versa.
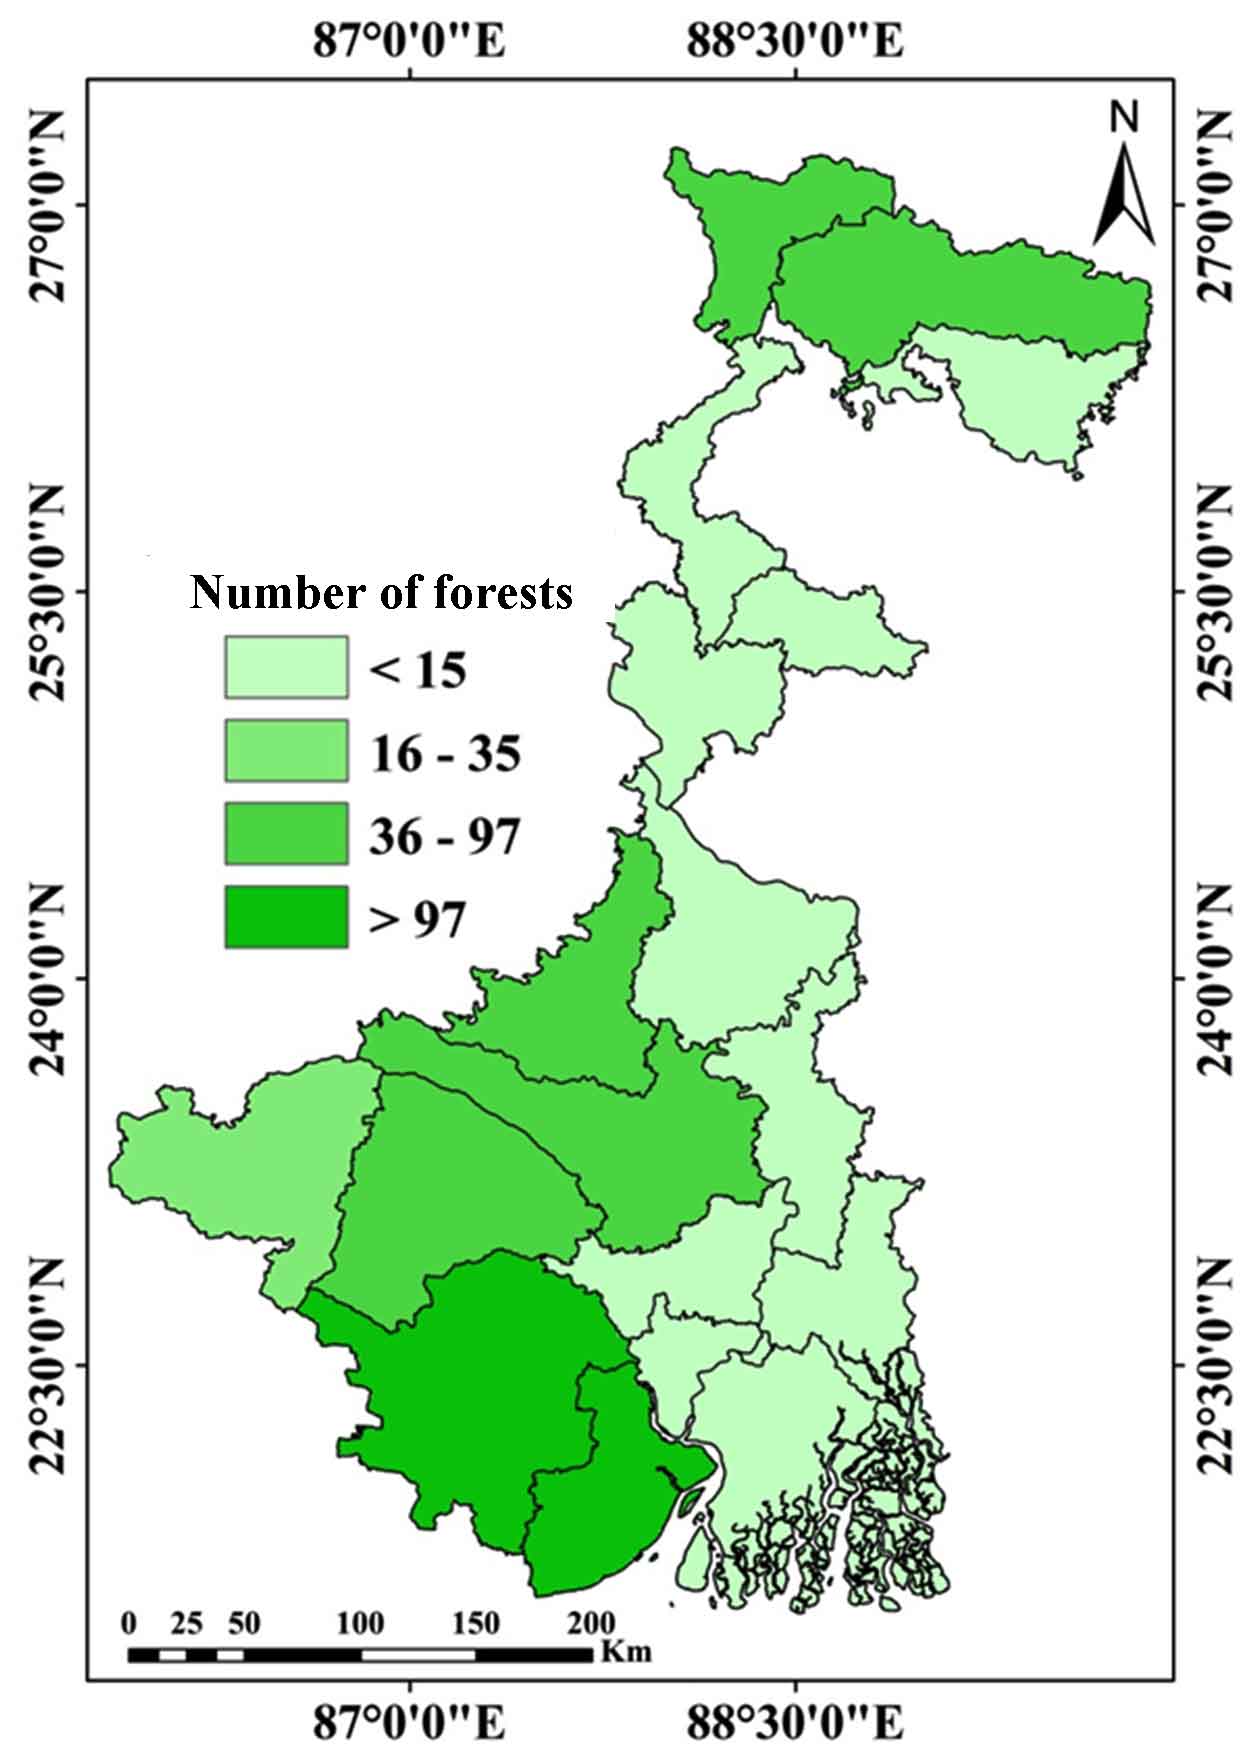
2.5.3.3 Unclassified Forests (UCF)
The number of unclassified forests dominates in Coochbehar, Jalpaiguri, Bankura, Barddhaman, Birbhum, West Medinipur and East Medinipur districts (>36). Rest districts are noticed with a smaller number of unclassified forests (Figure 12). Within West Bengal, the number of unclassed state forests varies from 11 to 100 and those are classified into 4 classes i.e., <15 (44.23% area), 16 to 35 (7.27% area), 36 to 97 (32.92% area), and >97 (15.57% area). The unclassified forests create positive vibrations to increase the value of the ecotourism potentiality (Endalew, 2017). Here, the unclassified forests are reclassified into 4 classes (i.e., 2, 4, 6 and 8, respectively). As the class value increases, priority also increases. As a result, tourism potentiality also gets positive vibes.
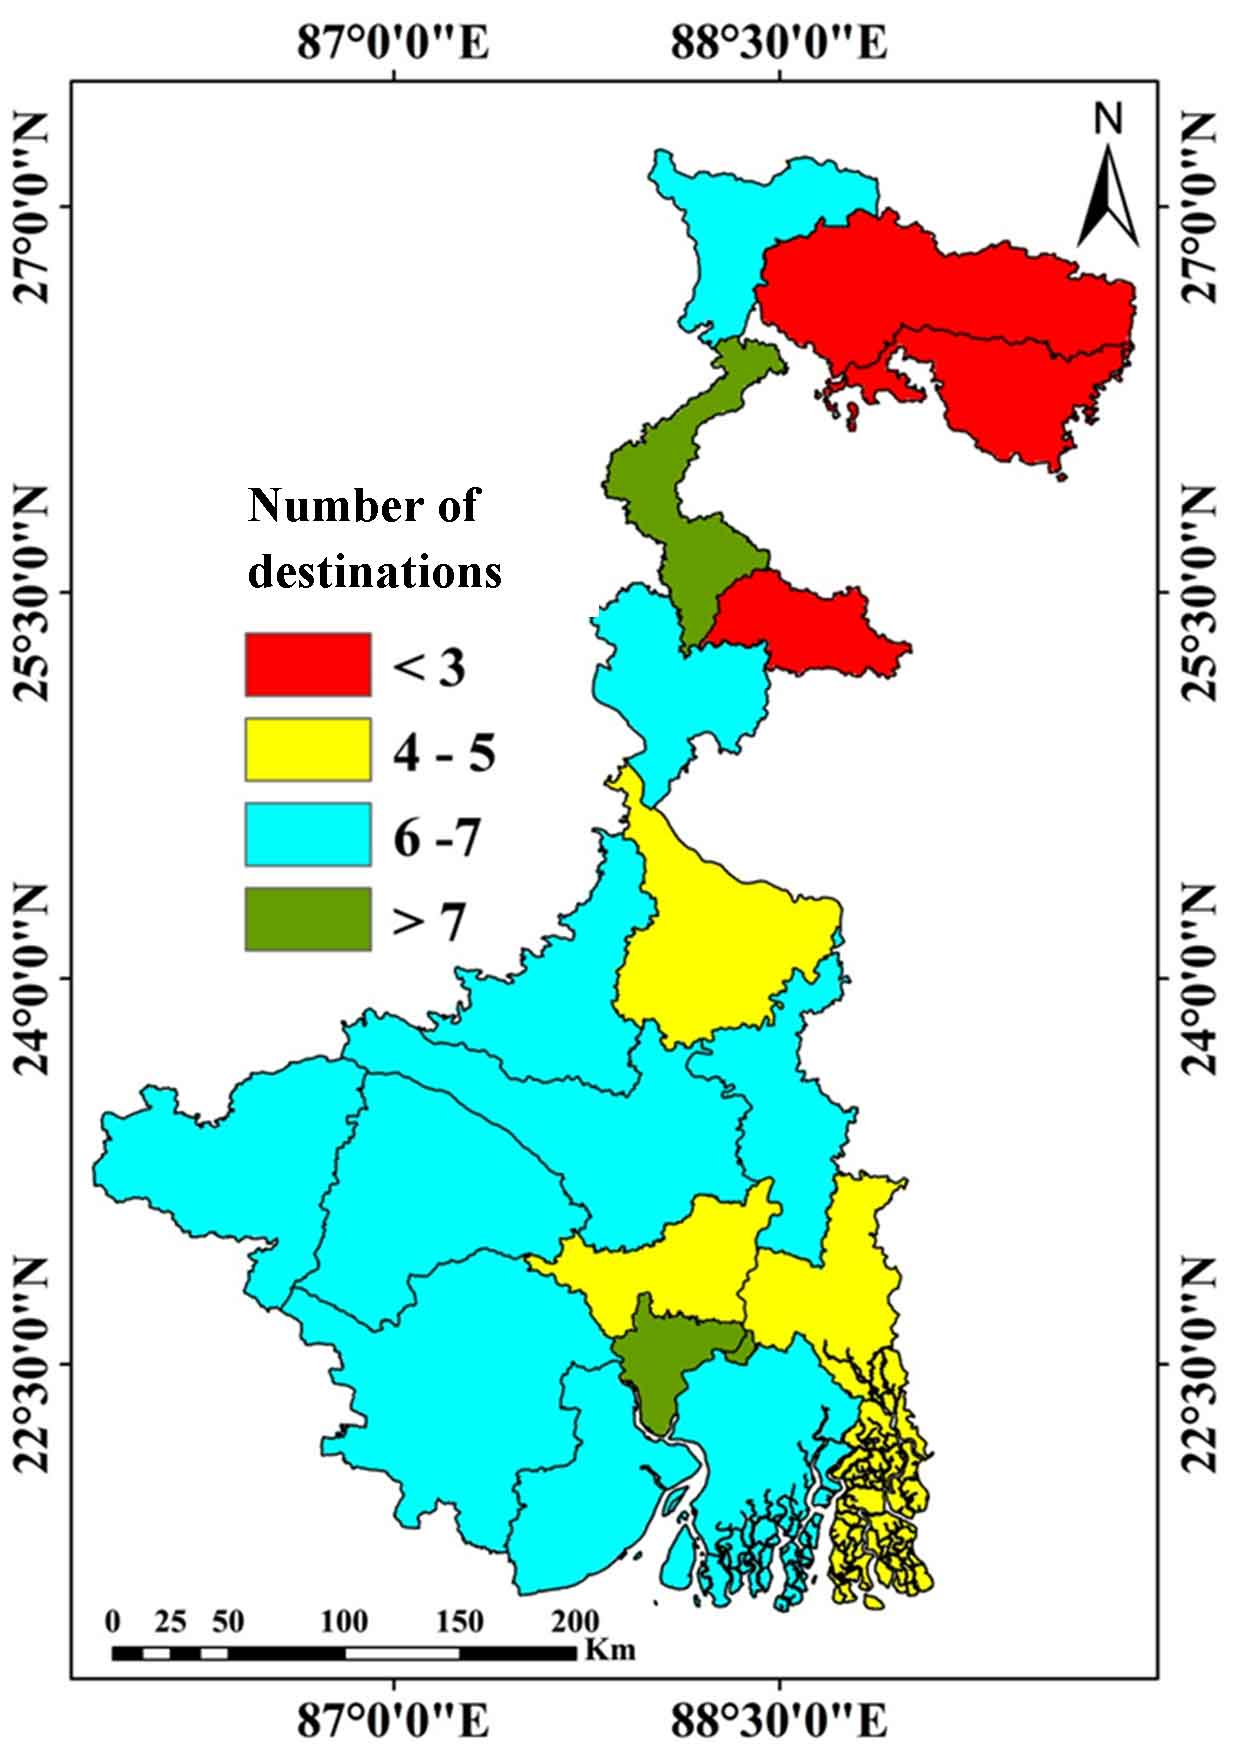
2.5.3.4 District wise Number of Tourist Destinations
Darjeeling, North-Dinajpur, Maldah, Purulia, Bankura, Barddhaman, Birbhum, Maldah, West Medinipur, East Medinipur, South-24 Parganas and Howrah districts are observed with a higher number of tourist destinations (>6 nos). Jalpaiguri, Coochbehar, South-Dinajpur,
Murshidabad, Hooghly, North 24 Parganas and South 24 Parganas are observed with a relatively low number of tourist destinations (<5) (Figure 13). District-wise number of tourist destinations are classified into 4 classes which are <3 (14.14% area), 4 to 5 (16.62% area), 6 to 7 (63.61% area) and >7 (5.62% area). With increasing tourist destinations, ecotourism potentiality is positively oscillated (Meseguer et al., 2021). Here, tourist destinations are reclassified into 4 groups, and following the above suggestion, previously mentioned classes are coded as 2, 4, 6 and 8, respectively.
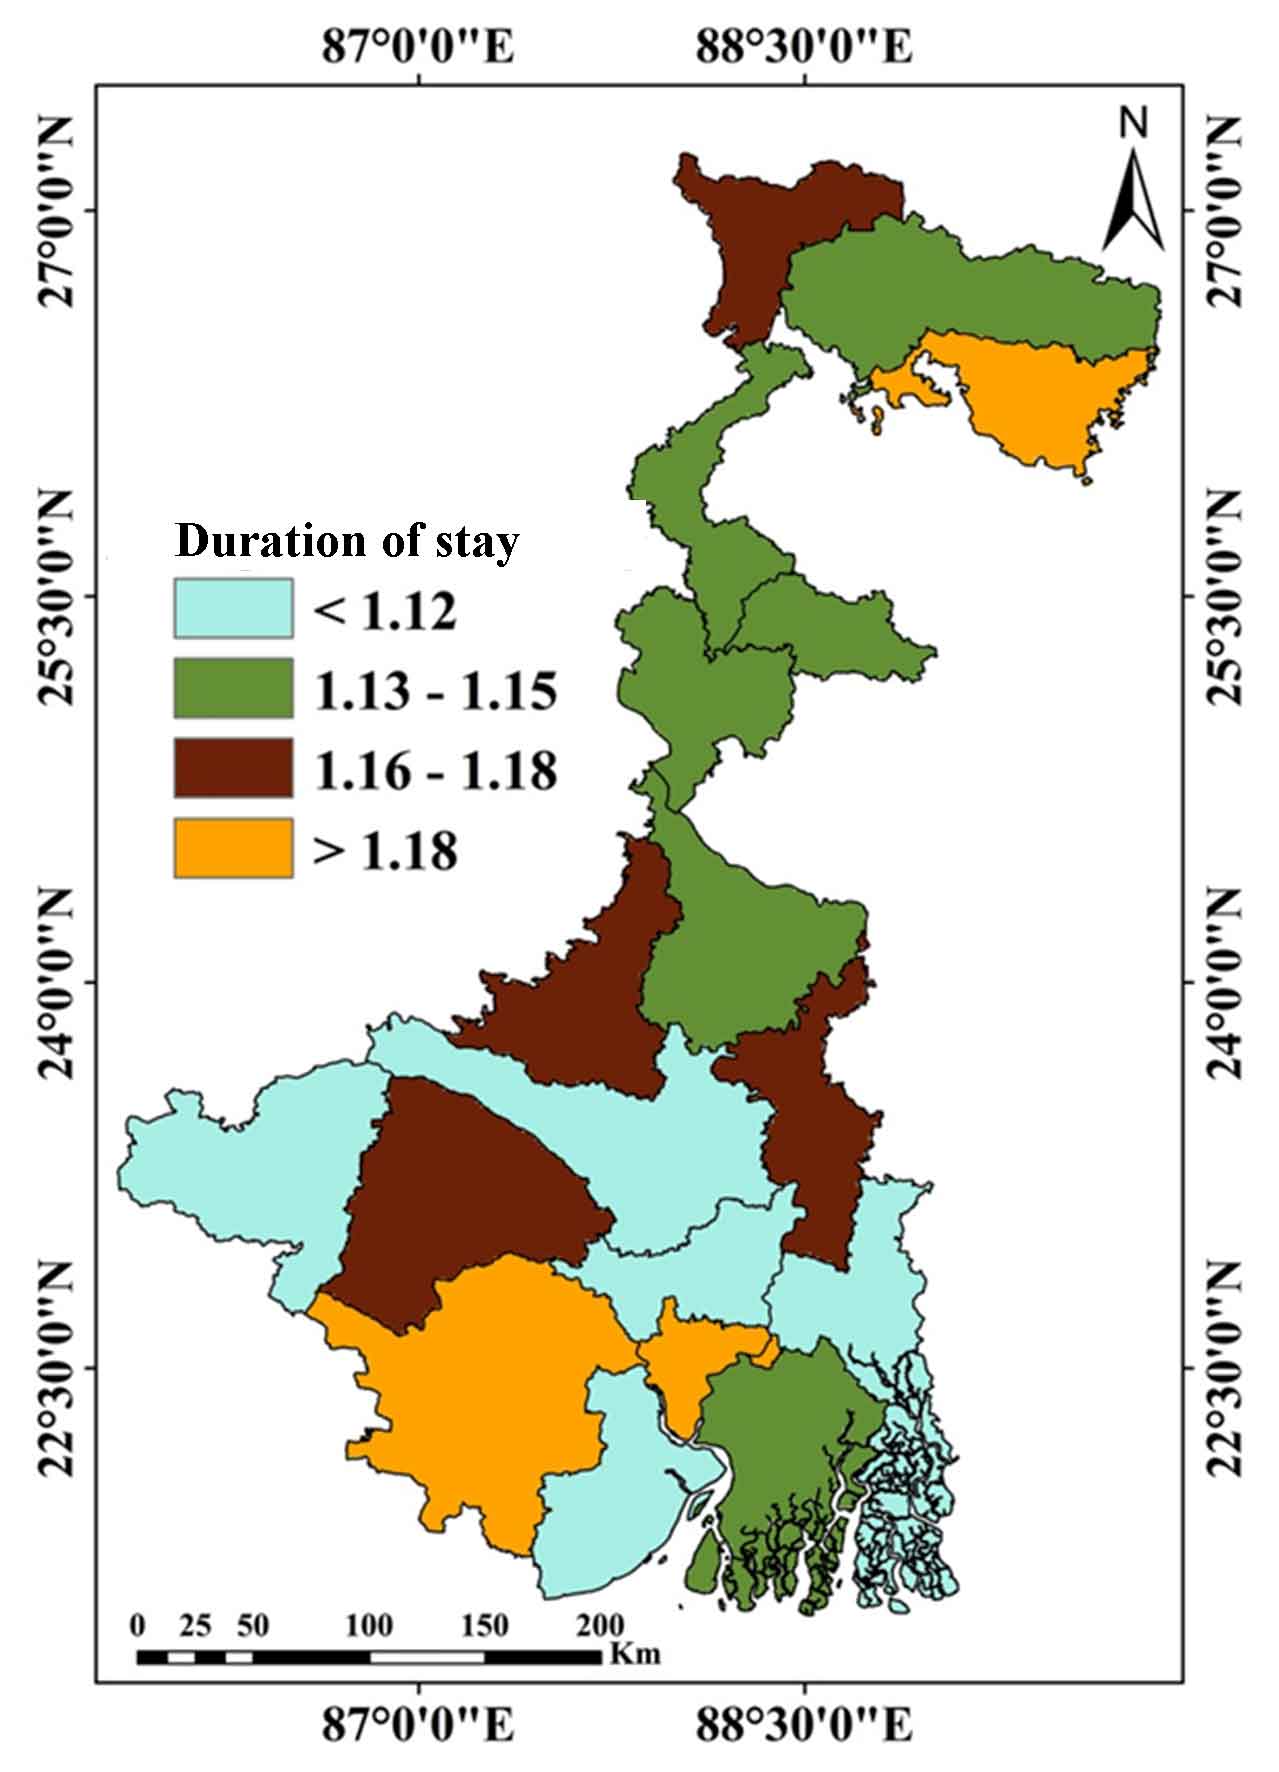
2.5.3.5 District Wise Average Duration of Stay (days)
Figure 14 represents the district-wise average duration of stay (days). Coochbehar, West Medinipur and Howrah districts are noticed with the highest duration of stay. The average duration of stay varies between 1.13 days to 1.18 days at Birbhum, Nadia, Bankura, Maldah, Darjeeling, North Dinajpur, South-Dinajpur, Murshidabad and South 24-Parganas districts. Purulia, Barddhaman, Hooghly, North-24 Parganas and East Medinipur districts have the lowest duration (less than 1.12 days). Overall, the average duration of stay is classified into 4 categories i.e., <1.12 days (43.62% area), 1.13 days to 1.15 days (31.78% area), 1.16 days to 1.18 days (11.91% area) and >1.18 days (12.68% area). Later, those classes are reclassified into 4 groups with 2, 4, 6 and 8 weightages. The average duration of stay at a particular tourist place is positively related to ecotourism potentiality (Barros and Machado, 2010). Following this rule, weightages are assigned, and as the class value increases, ecotourism potentiality also increases and vice-versa.
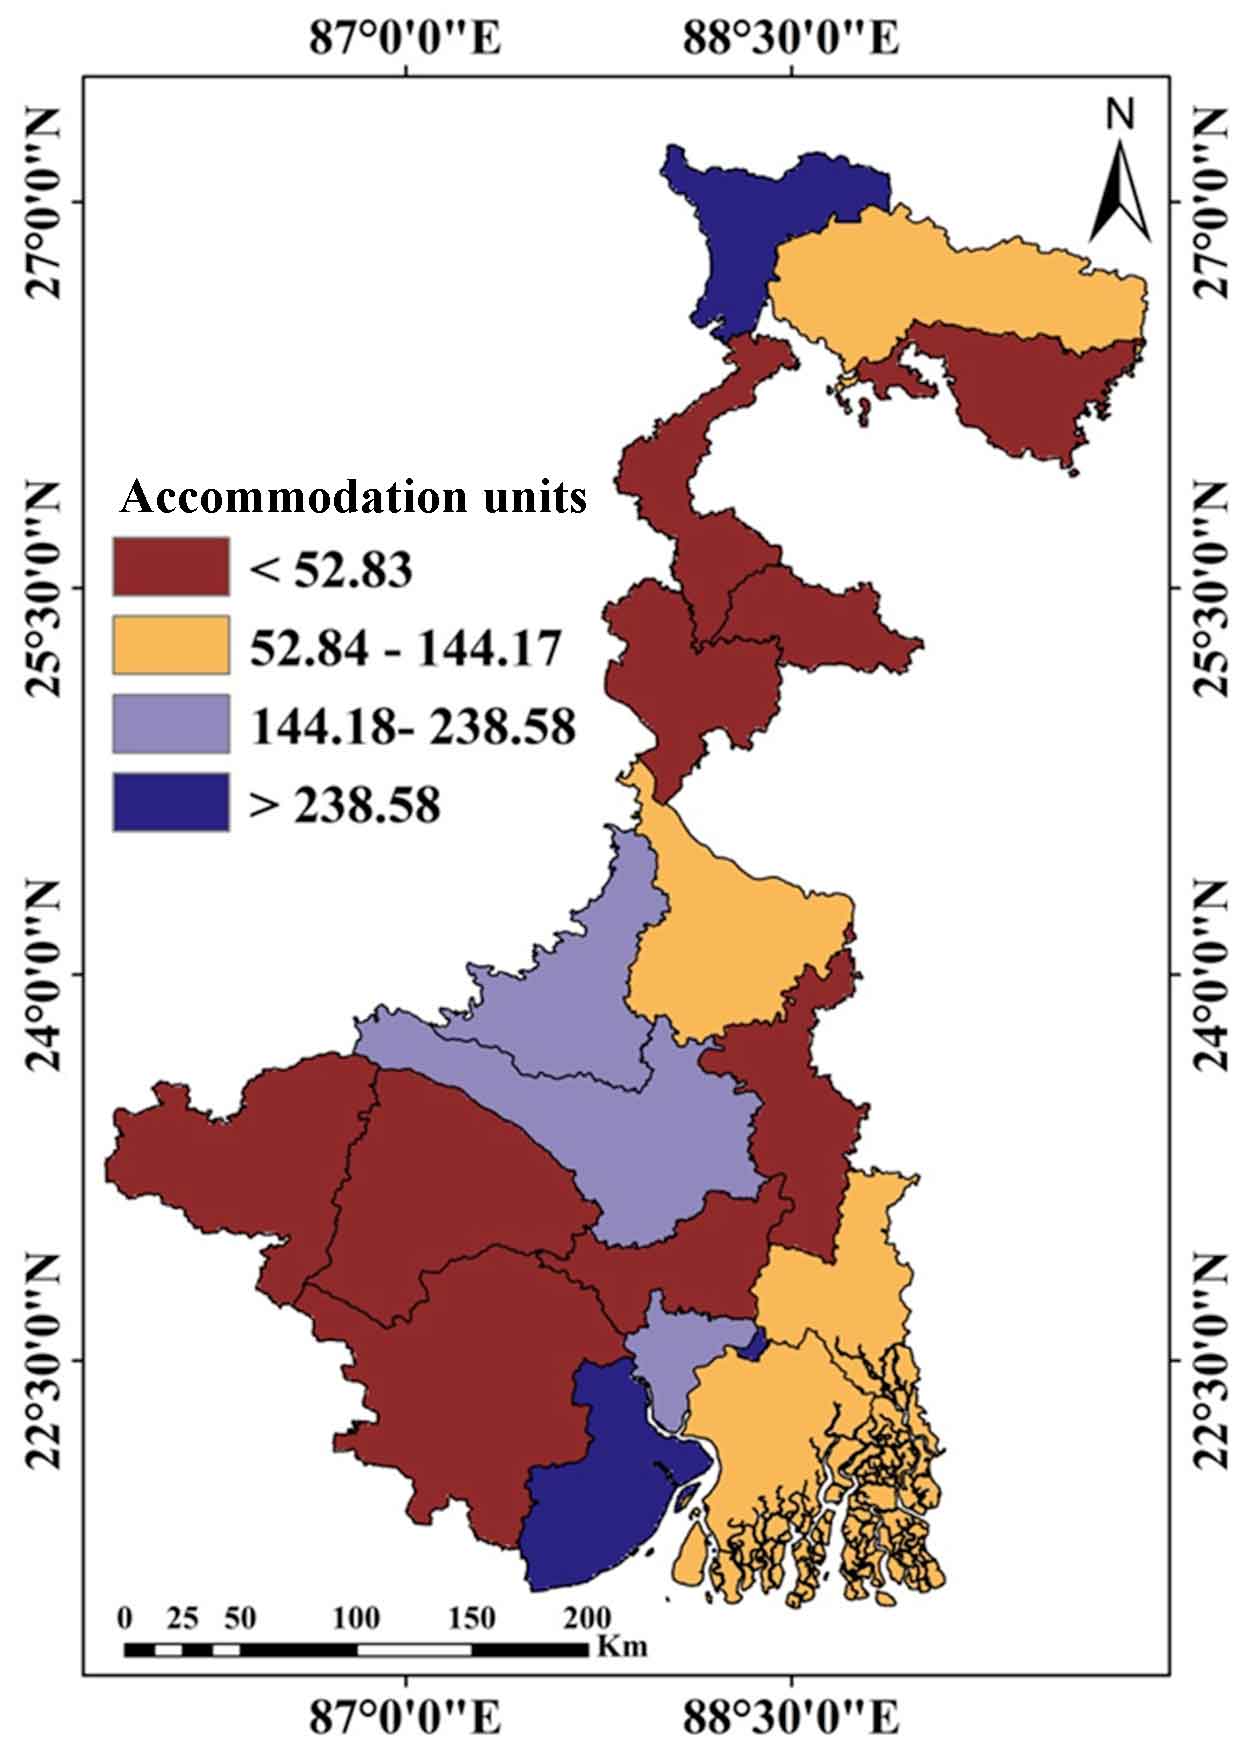
2.5.3.6 Number of Accommodation Units
Figure 15 represents the number of accommodation units of West Bengal. Availability of different accommodation units are classified into 4 groups which are <52.83 (42.01% area), 52.84 to 144.17 (34.15% area), 144.18 to 238.58 (9.89% area), >238.58 (13.95% area). The number of accommodation units is high in Darjeeling, East Medinipur, Barddhaman, Hooghly and Howrah districts (>144.18). The number of accommodation units varies from 52.84 to 144.17 at Jalpaiguri, Murshidabad, North-24 Parganas and South 24 Parganas districts. Rest districts (i.e., Bankura, Purulia, West Medinipur, Hooghly, Nadia, North Dinajpur, South Dinajpur and Maldah) are noticed with a relatively smaller number of accommodation units. The number of accommodation units directly relates to tourism potentiality (Souza et al., 2019; Nikoletta and Servidio, 2012). So, the above classes are recoded with 1, 3, 5 and 7, respectively, and as the class value increases, priority increases which signifies that the tourism potentiality increases with increasing accommodation units.
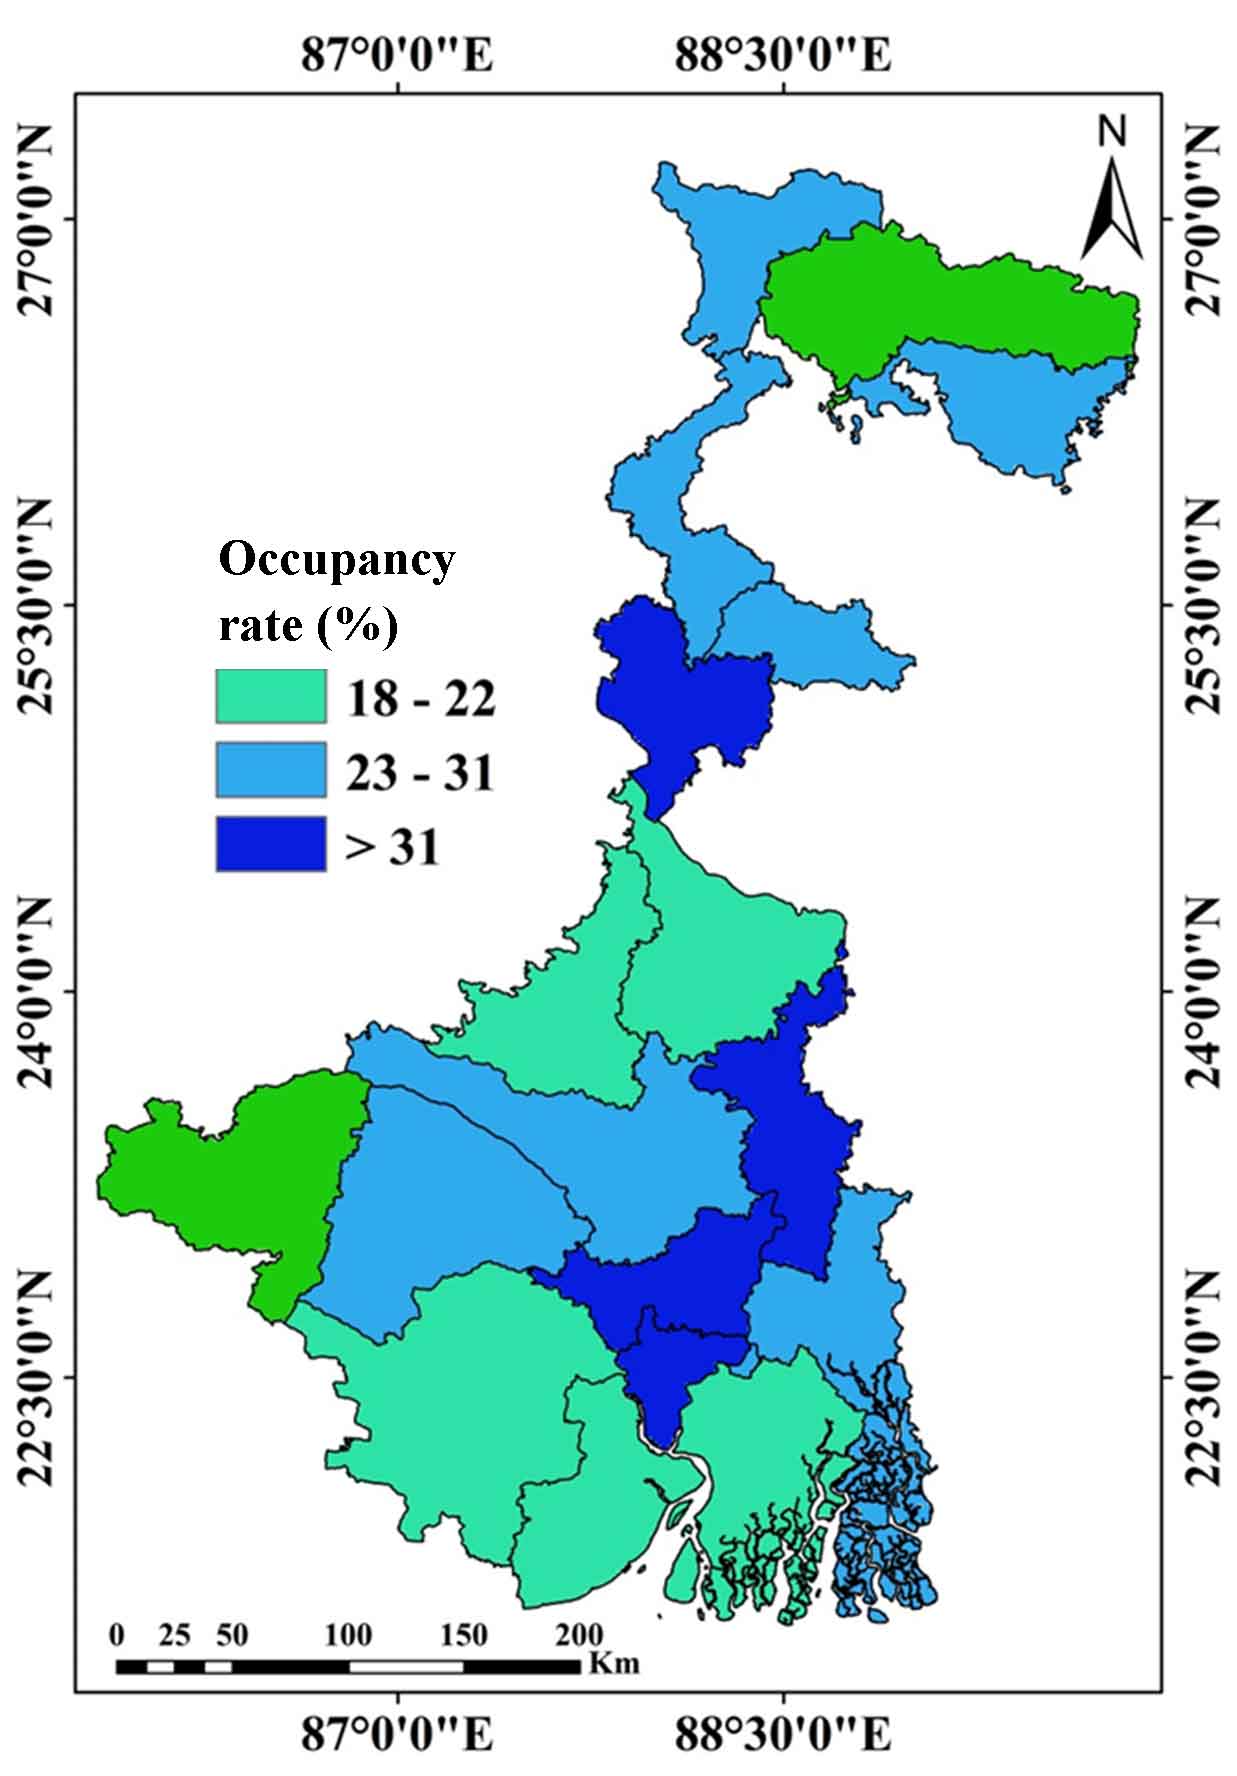
2.5.3.7 Occupancy Rate
District-wise occupancy rates (%) are illustrated in figure 16. The lowest occupancy rate is found in Jalpaiguri and Purulia districts. The occupancy rate (%) (>23%) is high in Bankura, Barddhaman, Nadia, North Dinajpur, South Dinajpur, Coochbehar, Hooghly, Howrah, North-24-Parganas and South 24-Parganas districts. Occupancy rates (%) are classified into 4 classes’ i.e., <17 (14.73% area), 18 to 22 (33.62% area), 23 to 31 (37.46% area) and >31 (14.17% area). Ecotourism potentiality is positively vibrated by the occupancy rate (%). Following the above recommendation, the occupancy ratio is reclassified and prioritized with different weightages (1,3, 5 and 7, respectively). As the class value increases, priority also increases and vice-versa (Pinho and Marques, 2019; Ranasinghe et al., 2020).
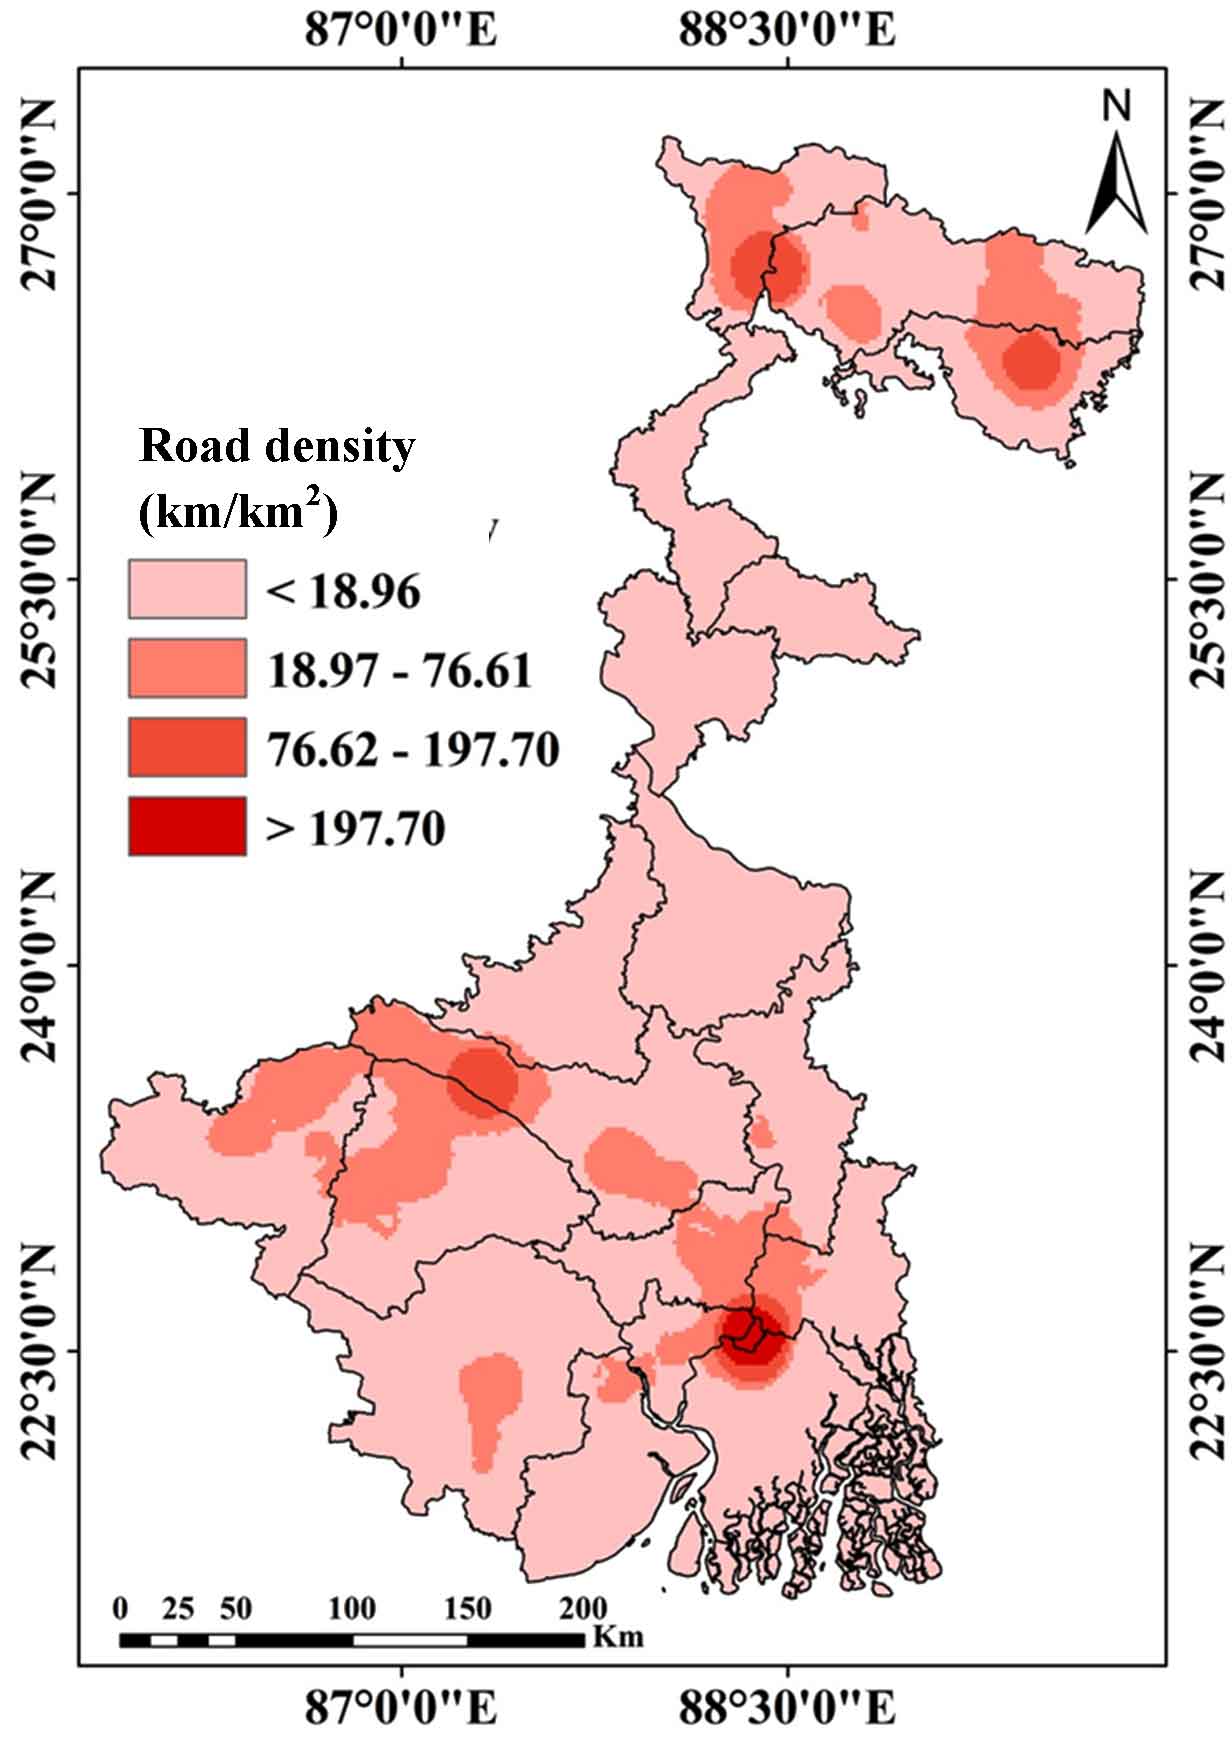
2.5.3.8 Road Densities
The road density map is illustrated in figure 17. Within the West Bengal, road density varies from 0.4 to 316.88 which are classified into 4 classes i.e., <18.96 (80.34% area), 18.97 to 76.61 (16.49% area), 76.62 to 197.70 (2.60% area), greater than 197.71 (0.57% area). Ecotourism potentiality is positively influenced by road densities (Bethapudi, 2013). So, in this research, road density is reclassified into 4 classes (i.e., 2, 4, 6 and 8 respectively), and as the class value increases, ecotourism potentiality also increases and vice-versa.
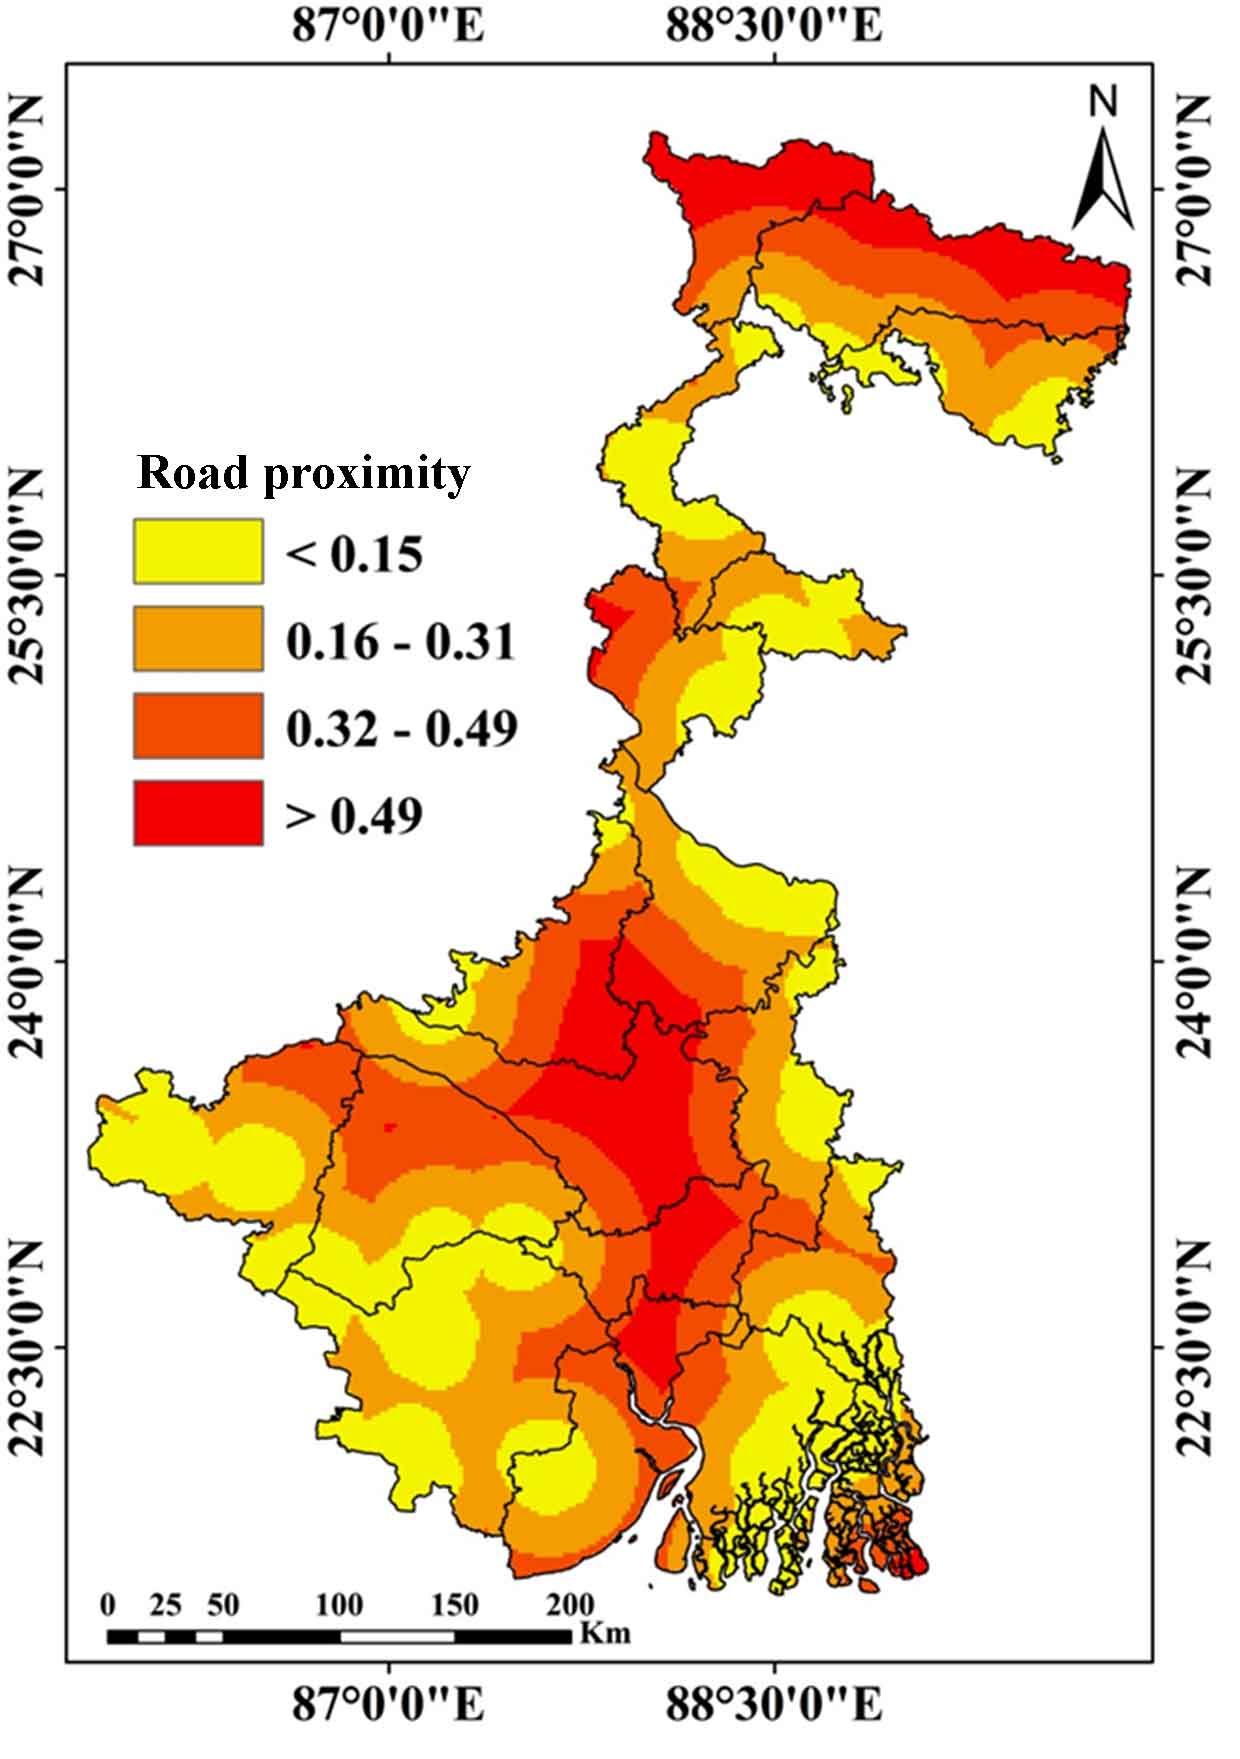
2.5.3.9 Road Proximity
The road proximity map is illustrated in figure 18. Overall, the road proximity of West Bengal varies from 0 to 0.90. Howrah, Hoogly, Kolkata, Barddhaman, Birbhum, Darjeeling, Jalpaiguri and Coochbehar districts have relatively high road proximity values. With relatively low road proximity values, Purulia, Bankura, East Medinipur, West Medinipur, North and South Dinajpur are identified. Here, road proximity is classified into 4 groups i.e., <0.15 (30.39% area), 0.16 to 0.31 (32.13% area), 0.32 to 0.49 (24.37% area) and >0.49 (13.11% area). Later, it is recoded as 2, 4, 6 and 8 respectively, according to their priorities (Khadaroo and Seetanah, 2008). If road proximity increases, it will be easy for tourists to reach a particular tourist spot. Ecotourism potentiality is enriched positively by road proximity (Ambecha et al., 2020; Khalil, 2017).


 ,
Sree Mondal 2
,
Sree Mondal 2