Hard rock Chikotra Basin, surveyed by Wenner array over 23 sites.
Iso-resistivity plotted by ArcGIS 10.5 to prospect groundwater zone.
Spatial variation at all depths plotted using IDW scheme.
High resistivity in NE of study area indicates massive basalts.
Longitudinal geoelectric cross-sections corroborate with spatial variation maps.
Alluvium and columnar jointed basalts are conducive for groundwater.
Abstract
Geoelectrical data was acquired using Wenner array over 23 sites with constant electrode separation of 70 m over Chikotra Basin, Dist. Kolhapur, Maharashtra (India). The spatial variation maps of resistivity at depths from 2 to 70 m were plotted using Inverse Distance Weighted (IDW) technique for interpolation in ArcGIS 10.5 to obtain a comprehensive subsurface hydrogeological representation of the study area. High resistivity (>140 Ωm) up to 20m depth, indicative of massive basalts is deciphered towards the NE part of the study area, while the NW sector reveal low resistive (up to 40 Ωm) feature at shallow depths due to fractured basalts, thus conducive for groundwater exploration. Alluvium deposits and columnar jointed basalts in the central part depicts as EW trending conductive (< 30 Ωm) feature suggesting prospective groundwater zone. Low resistivity (6-50 Ωm) from shallow to deeper depths (up to 70m), in the southern region can be identified as potential aquifer system. Longitudinal geoelectric cross-sections are generated over four profiles to identify the lateral and vertical variation in geology and groundwater potential zones. The western and central part of the northern profile (A-A') is highly resistive with resistivity of the order of 80-140 Ωm constituting compact basalts and thus devoid of water. Low resistive zone (30 Ωm) in the eastern part suggests groundwater at shallow depths. Low resistivity zones ranging from 10-50 Ωm is observed at different depth levels over the central profile (B-B') which can be tapped for groundwater exploitation. Several sites over profiles C-C' and the southern-most D-D' suggest promising aquifer zones. Because defining prospective groundwater zones in hard rock terrain is difficult, it’s crucial to look into a river basin’s hydrogeological arrangement early on in the planning process.
Groundwater resource exploration in hard rock terrain (HRT) has always been a contentious topic and a difficult work for hydrogeologists, as prospective groundwater zones/recharge pockets are limited to small weathered, fractured and fissured backgrounds. (Verma et al., 1980). Weathered and fractured quartzite and granites, which are commonly found in weathered zones, may increase the likelihood of high yielding boreholes. In the Deccan Volcanic Province (DVP) of Maharashtra, secondary porosity and permeability are developed due to weathering and fracturing of rocks (Deolankar, 1980; Rai et al., 2015) which are responsible for groundwater prospects. The unceasing shortage of drinkable water compounded by increasing drought and rising population demands to locate secondary groundwater sources over the hard rock terrains of the DVP of Maharashtra (Shailaja et al., 2019).
Groundwater resources are successfully delineated through geophysical studies all around the world. Because of its relative ease of data acquisition, inexpensive instruments, widely available interpretational schemes and relationship between electrical properties, geologic formations, and aquifer demarcation, the electrical resistivity technique is the most widely used of all non-invasive geophysical methods (Zohdy and Jackson, 1969; Kotra et al., 2016). To this end, many researchers have employed the electrical resistivity approach, including resistivity profiling and vertical electrical sounding (VES), to determine the chemistry of hard rock groundwater (Ramesh and Elango, 2012; Mondal et al., 2016), groundwater contamination studies (Park et al., 2007; Mondal et al., 2013), saline water intrusion and delineation of potential groundwater zones (Hamzah et al., 2007; Adeoti et al., 2010; Maiti et al., 2013; Ali Kaya et al., 2015; Gupta et al., 2015), geothermal explorations (El- Qady et al., 2000; Kumar et al., 2011), environmental assessment (G'omez-Puentes et al., 2016) and geotechnical investigation (Adejumo et al., 2015). Groundwater potential zones require modeling of resistivity data, particularly from hard rock locations, in order to understand fluid penetration through pores and geologically weak zones, as well as fluid percolation patterns in the subsurface.
Previous geophysical studies in Chikotra basin (Gupta et al., 2015) revealed that aquifers were generally found in weathered/fractured zones within or beneath the traps. The resistivity models also show that the northern part of the study area represents a suitable aquifer zone with adequate weathered basement thickness. Several locales in the basin exhibit strong water-bearing potential and thus conducive to groundwater exploration. The secondary geophysical indicators were used to evaluate aquifer protective capacity as well as fracture geometry (Shailaja et al., 2016) over the basin. The fracture porosity values and anisotropy values were found to have a positive association, confirming the porous zones in the NE-SW region of the research area. The protective capacity rating of the Chikotra basin is moderate to poor, according to the longitudinal conductance map (Shailaja et al., 2016). It also suggests that the areas with low protective capacities are very vulnerable to contamination. Physico-chemical analysis of water samples from the Chikotra River basin (Jadhav et al., 2019) reveals that the river water polluted due to the anthropogenic activities and agricultural runoff. However, all the values are within the permissible limit of WHO therefore the water of this river is safe for drinking, domestic and agricultural purpose.
According to morphometric analysis (Patil et al., 2016), the Chikotra River basin is of fifth order, with varied topography, including mountains, hills, plains, and valleys, and a moderate relief ratio. Due to consistently resistant horizontally placed basaltic rock, the drainage pattern seen is dendritic in the majority of the basin; nevertheless, sub-parallel drainage pattern at times indicates some structural control over the drainage.
Ground magnetic data inferred that the Chikotra River basin is composed of three structural units (Anand et al., 2016). The upper unit represent the Late Cretaceous Deccan lava flows, followed by an intermediate layer having NE–SW structures and faults associated with the Proterozoic Kaladgi basin and the deeper unit characterizes the NW extension of Dharwars.
The iso-apparent resistivity maps in this investigation were created using apparent electrical resistivity data. These maps show the distribution of apparent resistivity in the area in relation to the distance between current electrodes, as well as the heterogeneity of apparent resistivity values at different depth levels. Subsequently, the longitudinal geoelectric sections were generated over four profiles. The objectives of the present study are three-fold: (i) to depict the subsurface features in and around Chikotra River basin derived from vertical electrical sounding (VES) data, (ii) to demarcate the groundwater potential zones within the weathered/fractured basaltic rocks as well as below the traps and (iii) to ascertain the aquifer thickness. These findings might then be used to the development, usage, planning, and management of groundwater resources in the studied area.
2 . STUDY AREA: GEOLOGY AND GEOMORPHOLOGY
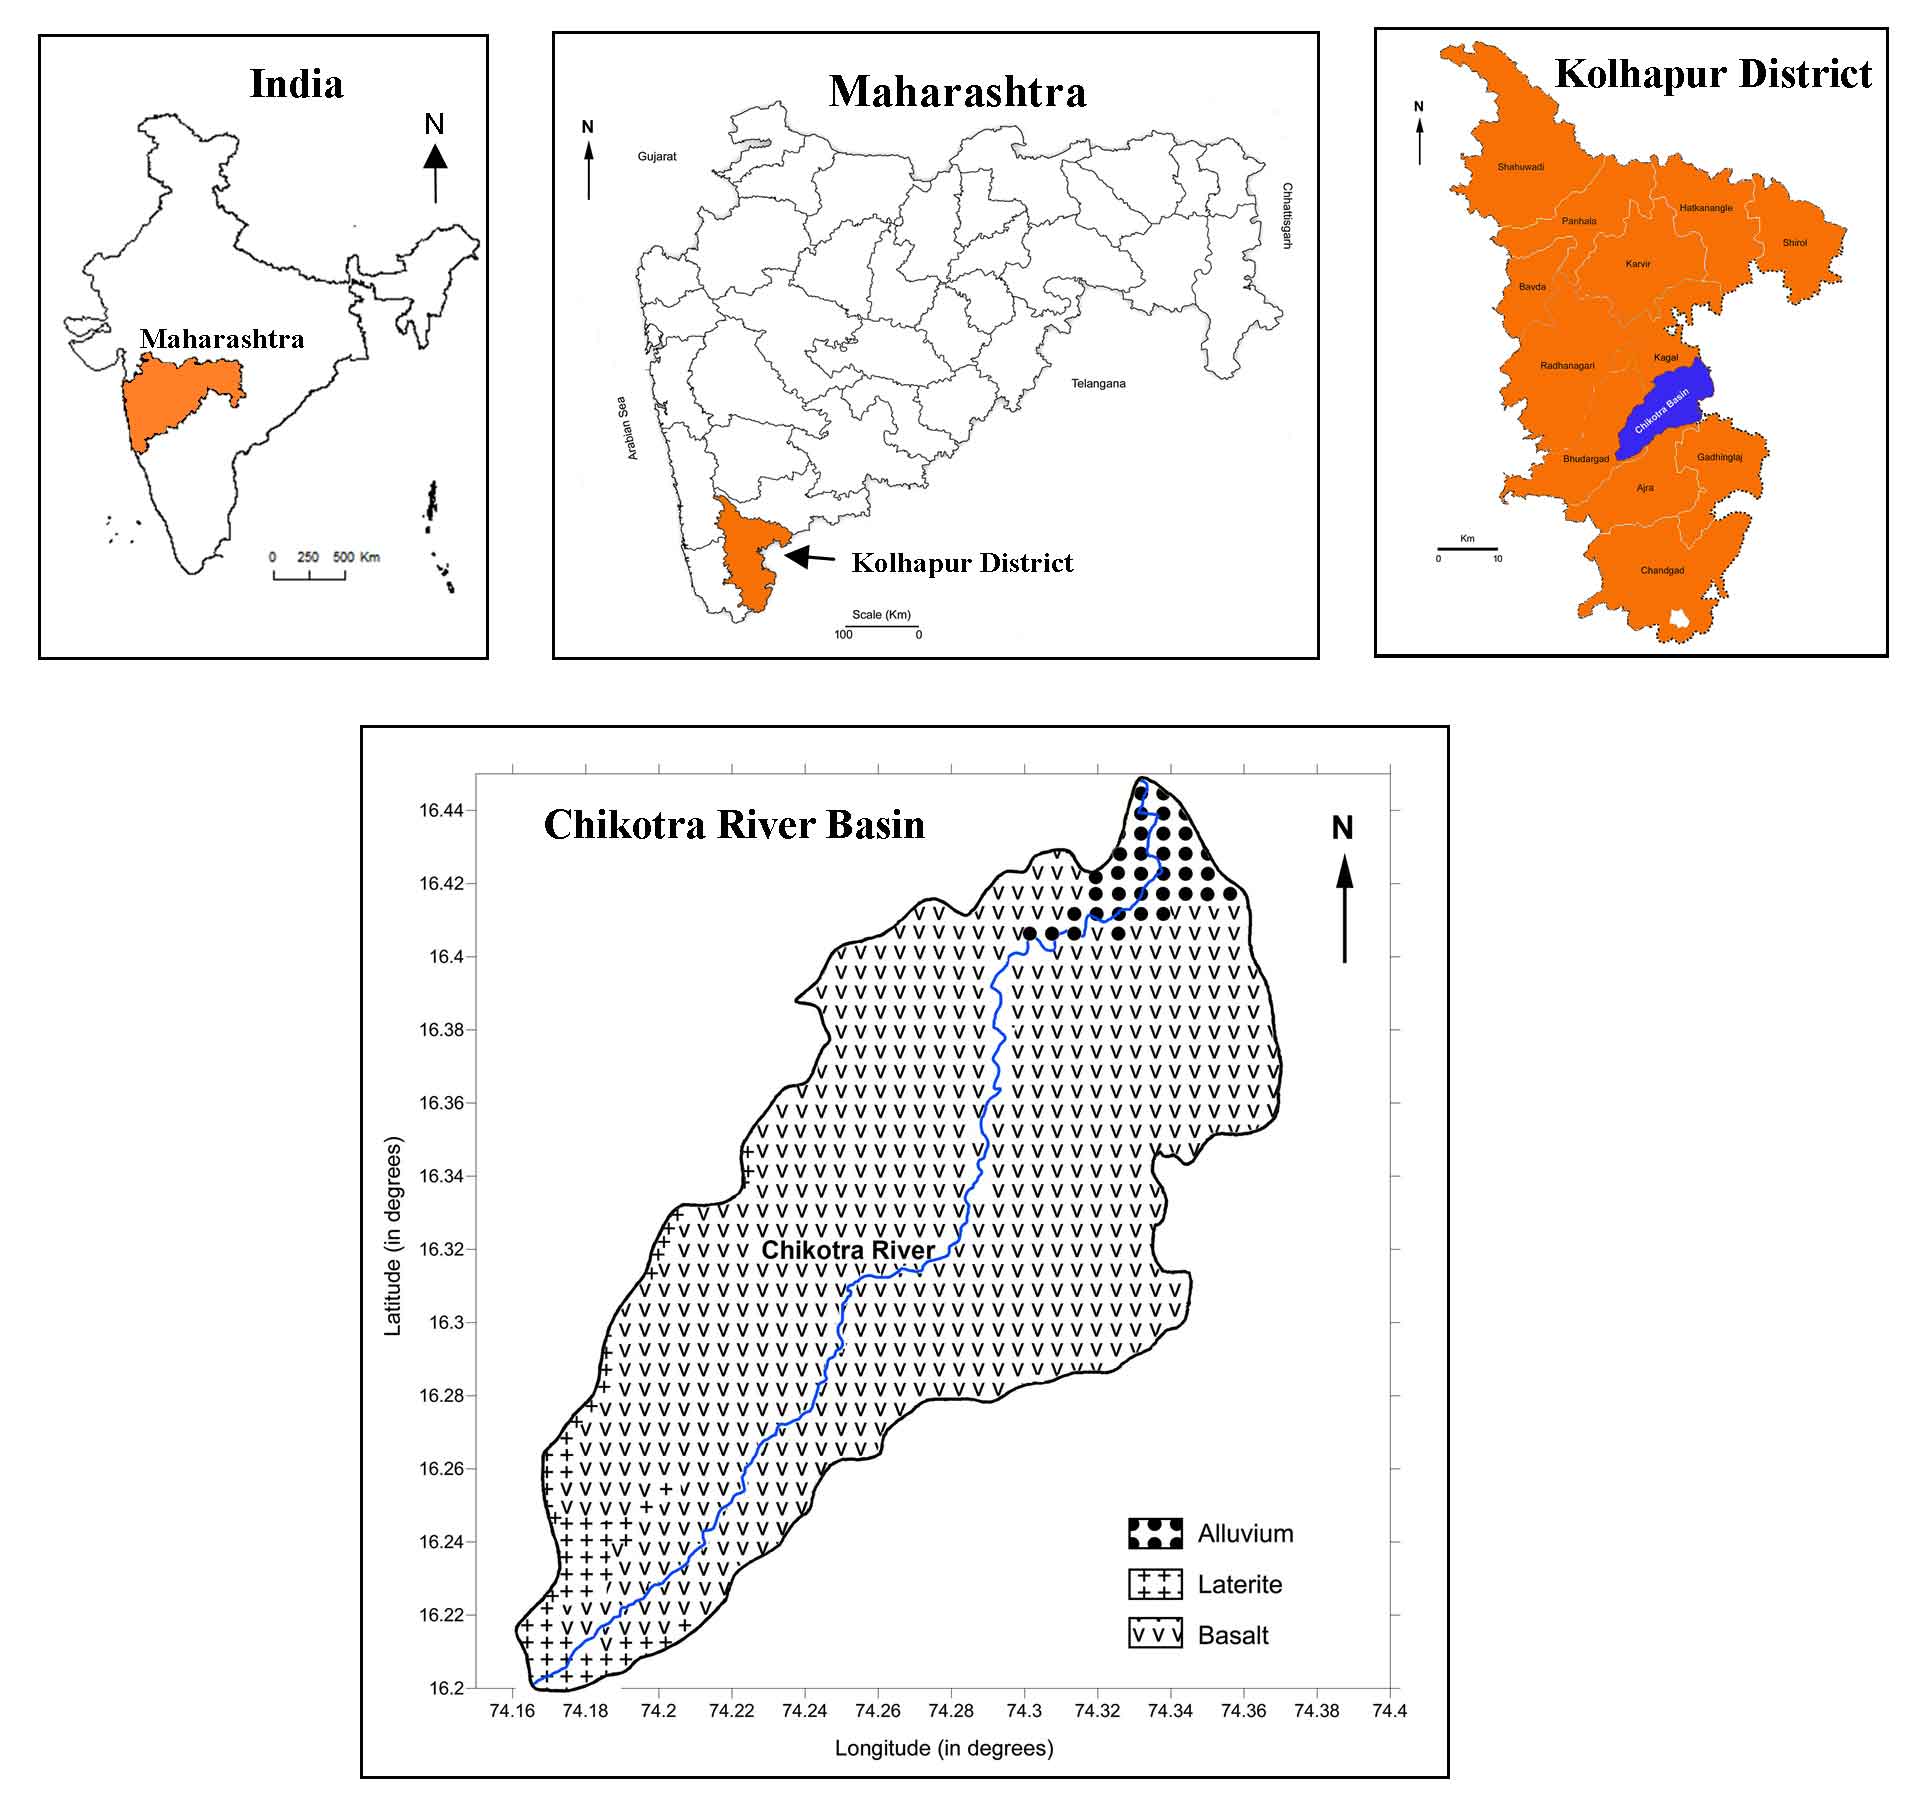
The Chikotra River basin is located in the southern section of Kolhapur district, and includes Bhudargadh, Kagal, and Ajara tahsils. It covers an area of around 351 square kilometres and is located between 16°10'43" and 16°27'20" North latitudes and 74°08'09" and 74°22'30" East longitudes. The study region is made up of hills on the southwestern side and plains on the northeastern side, resulting in a topography that is uneven and complex (Deshpande, 1998). The basalts of the DVP typify the Chikotra Basin (Figure 1). Basaltic flows are often of the simple kind, with maximum thicknesses of 35 to 40 m (Mungale, 2001). The flows were divided by red boles ranging in thickness from less than a meter to 2.5 m. The topographic highs are covered with laterite in some places (source), and a thin veneer of alluvium is evident along the river and stream banks in others. The alluvium is mostly found on the hill slopes with thickness varying from 2 to 6 m, the thickness of which gradually increases in the downstream portions where the Chikotra River (about 47 km in length) meets the Vedganga River. Its lateral extent varies greatly, reaching a maximum of roughly 500 m on either bank in the downstream section (Gupta, 2013). Pebble beds, sand, and silt generated from the Deccan Trap basalts and laterites make up the majority of the alluvium.
Figure 1. Study area: Chikotra River basin in Kolhapur district, Maharashtra (India)
The laterite is found in the upstream portion of the Chikotra River and found as a capping over the flat-topped basaltic hills at an elevation of around 905 m. Basalts are the most common litho-unit in the Chikotra Basin. On the outcrops, they show typical spheroidal weathering, which results in rounded boulders.
Weathering starts at well-developed joints, smoothing out angles and corners initially, then forming thin concentric shells or layers that eventually soften and fall off. Basalts with two sets of conspicuous vertical and horizontal joints have also been identified. Basaltic flows are highly jointed and fractured across the basin. There are numerous columnar joints observed at Murukte. Other places with a lot of joints and cracks are Hasur Khurd and the Khadak Ohol stream on the road to Belewadi Kalamma. These joints give the basalts secondary porosity, making them potential aquifers (Deolankar, 1980). The basaltic flows are separated by the red boles, which are particularly visible in the area. The thickness of these horizons ranges from less than a meter to roughly two meters (Patil et al., 2016).
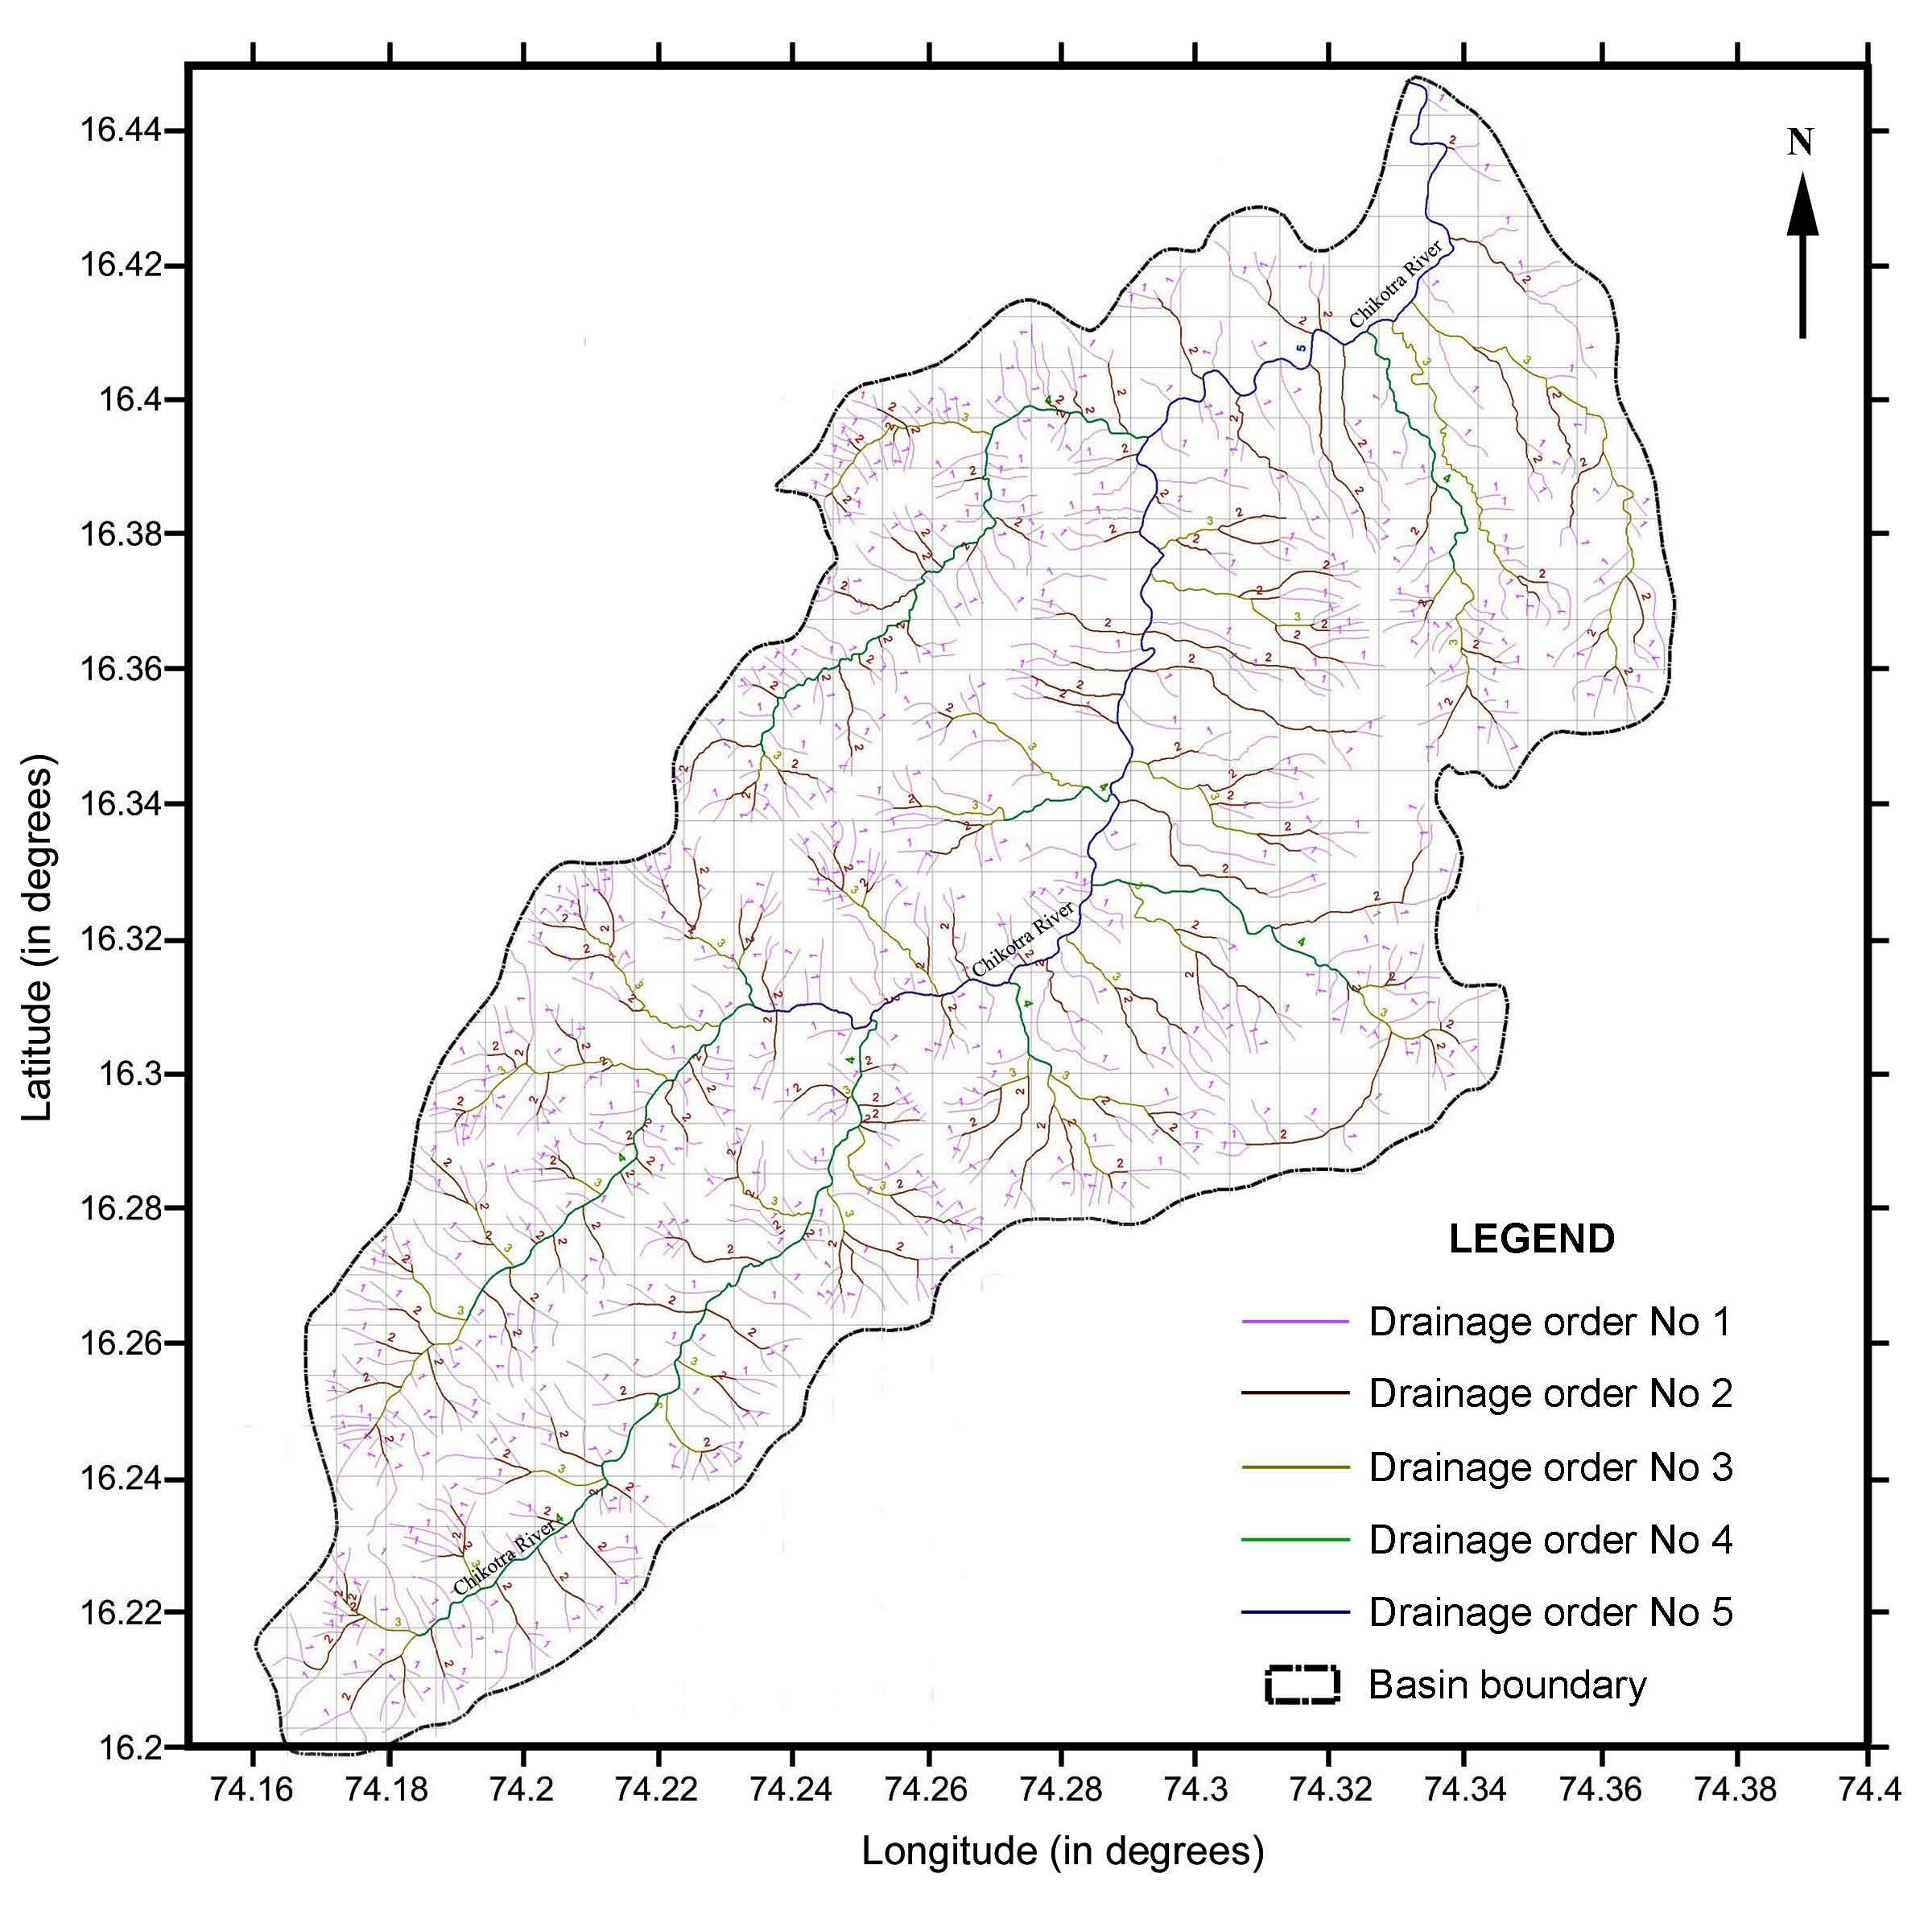
The drainage pattern in the basin is inconsistent (Figure 2) and dendritic and fine grained in the upstream parts. Such drainage pattern is commonly found on horizontally placed basaltic rock that is consistently resistant and has a modest regional slope (Horton, 1945). Furthermore, the laterites that cover flat-topped basaltic plateaus with slopes of less than 5% have favored the commencement of this drainage pattern. The drainage in the basin’s middle reaches has a dendritic pattern but is medium grained, suggesting that joints and fractures are present in basaltic rock formations. As a result, rocks in the watershed are moderately permeable. The drainage pattern becomes sub-parallel and coarse in texture in the basin’s middle to lower reaches. The parallelism of the streams along a specific direction indicates that there is some structural control over the drainage, which is evident from the fact that the rocks are highly fractured and jointed.
Figure 2. Drainage network
The hilly and rugged topography of the study area has given rise to numerous first and second order streams (Table 1). Perennial springs can also be found at the interfaces of different lithologies in some places, which aids in the contribution of water to the streams. The fertile alluvial plain is observed in the downstream part of Chikotra River due to the availability of water. The basin receives annual rainfall ranging from 1000 to 2800 mm, the majority of which comes from the southwest monsoon. In May, the temperature reaches a high of around 40 °C, while in November, it drops to a low of 10 °C to 15 °C (Gupta, 2013).
Table 1. Order-wise stream length
Stream orders
No. of streams
Length of streams (m)
1
781
497727.73
2
224
174019.33
3
70
77717.23
4
13
53479.79
5
1
30749.62
The well discharge rates in the study area range from 135 l/s to 5890 l/s. These variations are due to the hydraulic and morphologic characteristics of the Chikotra River’s tributaries. The minimum values of discharge have been recorded in the agricultural areas of Hasur Budruk and Hasur Khurd villages. The maximum discharge value is recorded at Belewadi Kalamma. Highest drainage area coinciding with highest discharge in general suggests positive relationship between these two variables (Gupta, 2013). It is evident that as the drainage area increases, the discharge also increases.
Based on the available dug well lithology, the hydro-geological section of the study area suggests that the top layer is composed of volcanic breccia with red bole matrix, laterite or black soil, followed by weathered/fractured basalts and compact basalts as basement rock (Gupta, 2013).
3 . MATERIALS AND METHODS
Wenner electrode arrangement in sounding mode was used to acquire the geoelectrical data. This array is made up of four collinear, equally spaced electrodes. Typically, the outer two electrodes are the current (source) electrodes, while the inner two electrodes are the potential (receiver) electrodes. The array spacing increases around the array midway while keeping an equivalent separation between each electrode (Keller and Frischknecht, 1966). The apparent resistivity data collected in the field using Wenner array is easy to calculate and the sensitivity of the instrument is not vital as with other array geometries. To produce observable potential differences, negligible current magnitudes are required. The limitation of this array is that all of the electrodes must be shifted to a new location for each sounding. This array being sensitive to near-surface inhomogeneities, can distort deeper electrical responses. The apparent resistivity is measured using the equation,
\(\rho_a = 2\pi {V \over I}\) (1)
where, ρa is the apparent resistivity, \(V\) is the potential in volts measured between the two current electrodes, \(I\) is the current in amperes passing into the ground, a is the distance between the successive electrodes and 2π is a constant.
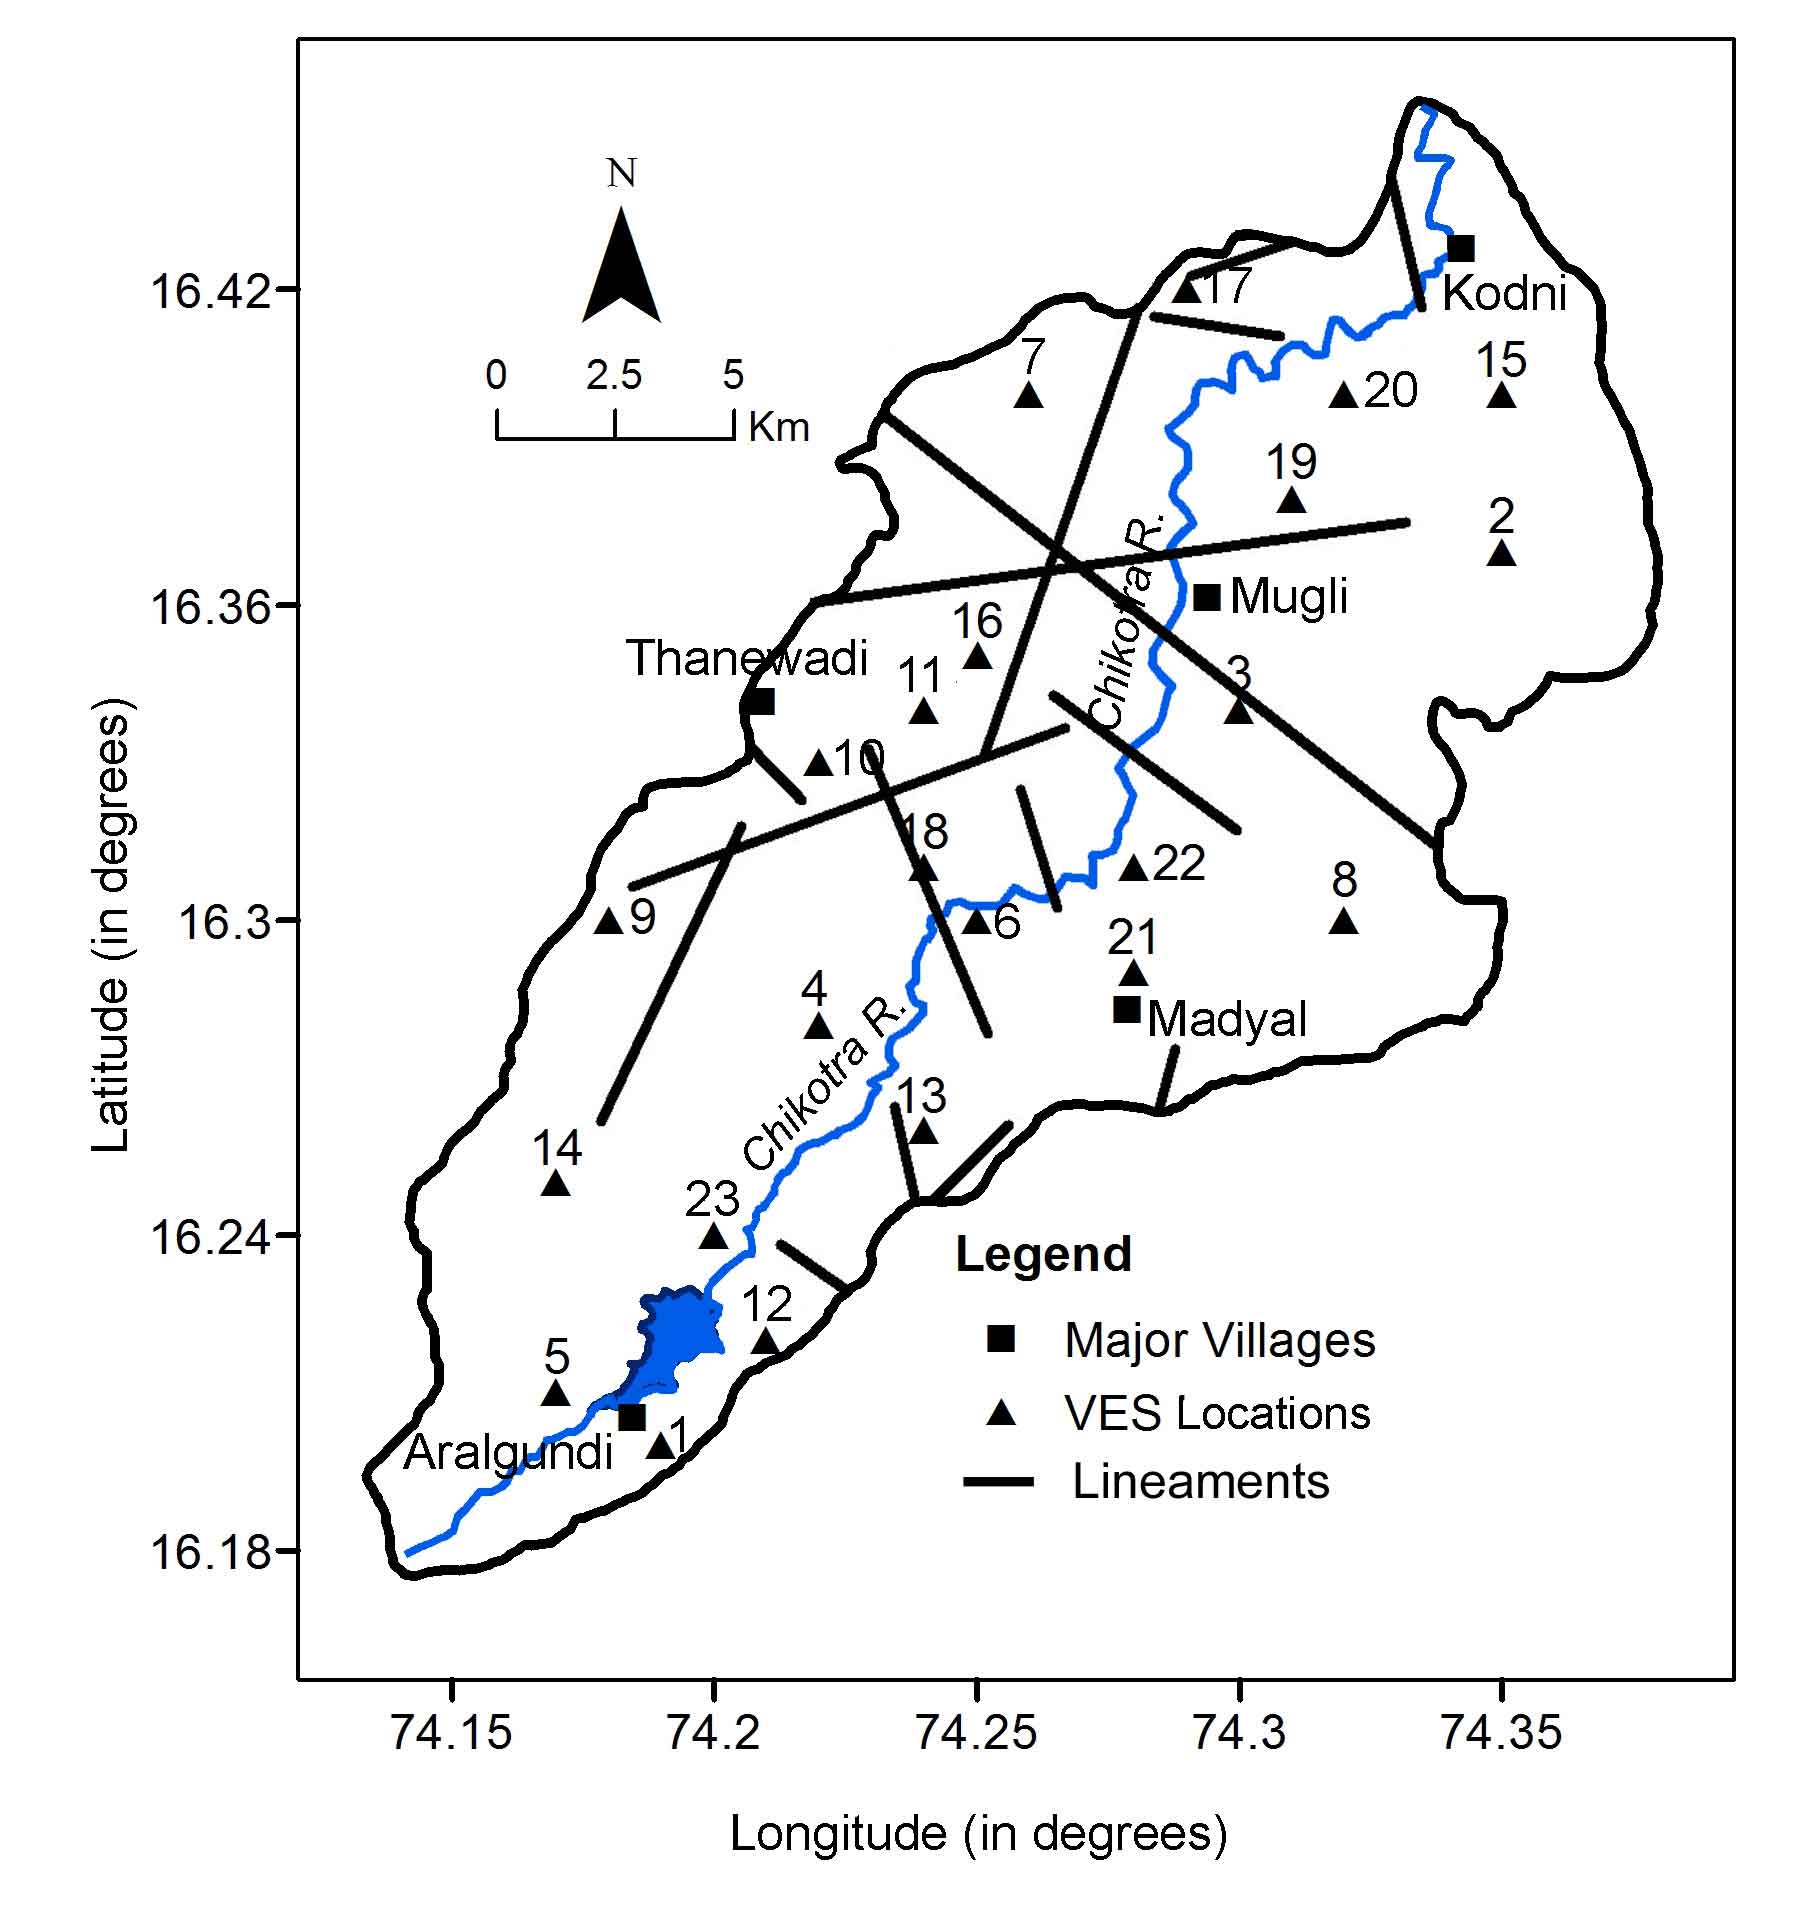
Vertical electrical soundings (VES) data were acquired by Wenner configuration at 23 sites maintaining 70 m constant electrode separation. The survey was carried out with the help of a DDR 3 resistivity meter supplied by IGIS, Hyderabad. The location map of the study area (Figure 3) was prepared using the geographic coordinates of respective VES stations determined in the field using handheld Garmin 72 GPS.
Figure 3. The location of vertical electrical sounding points and lineaments
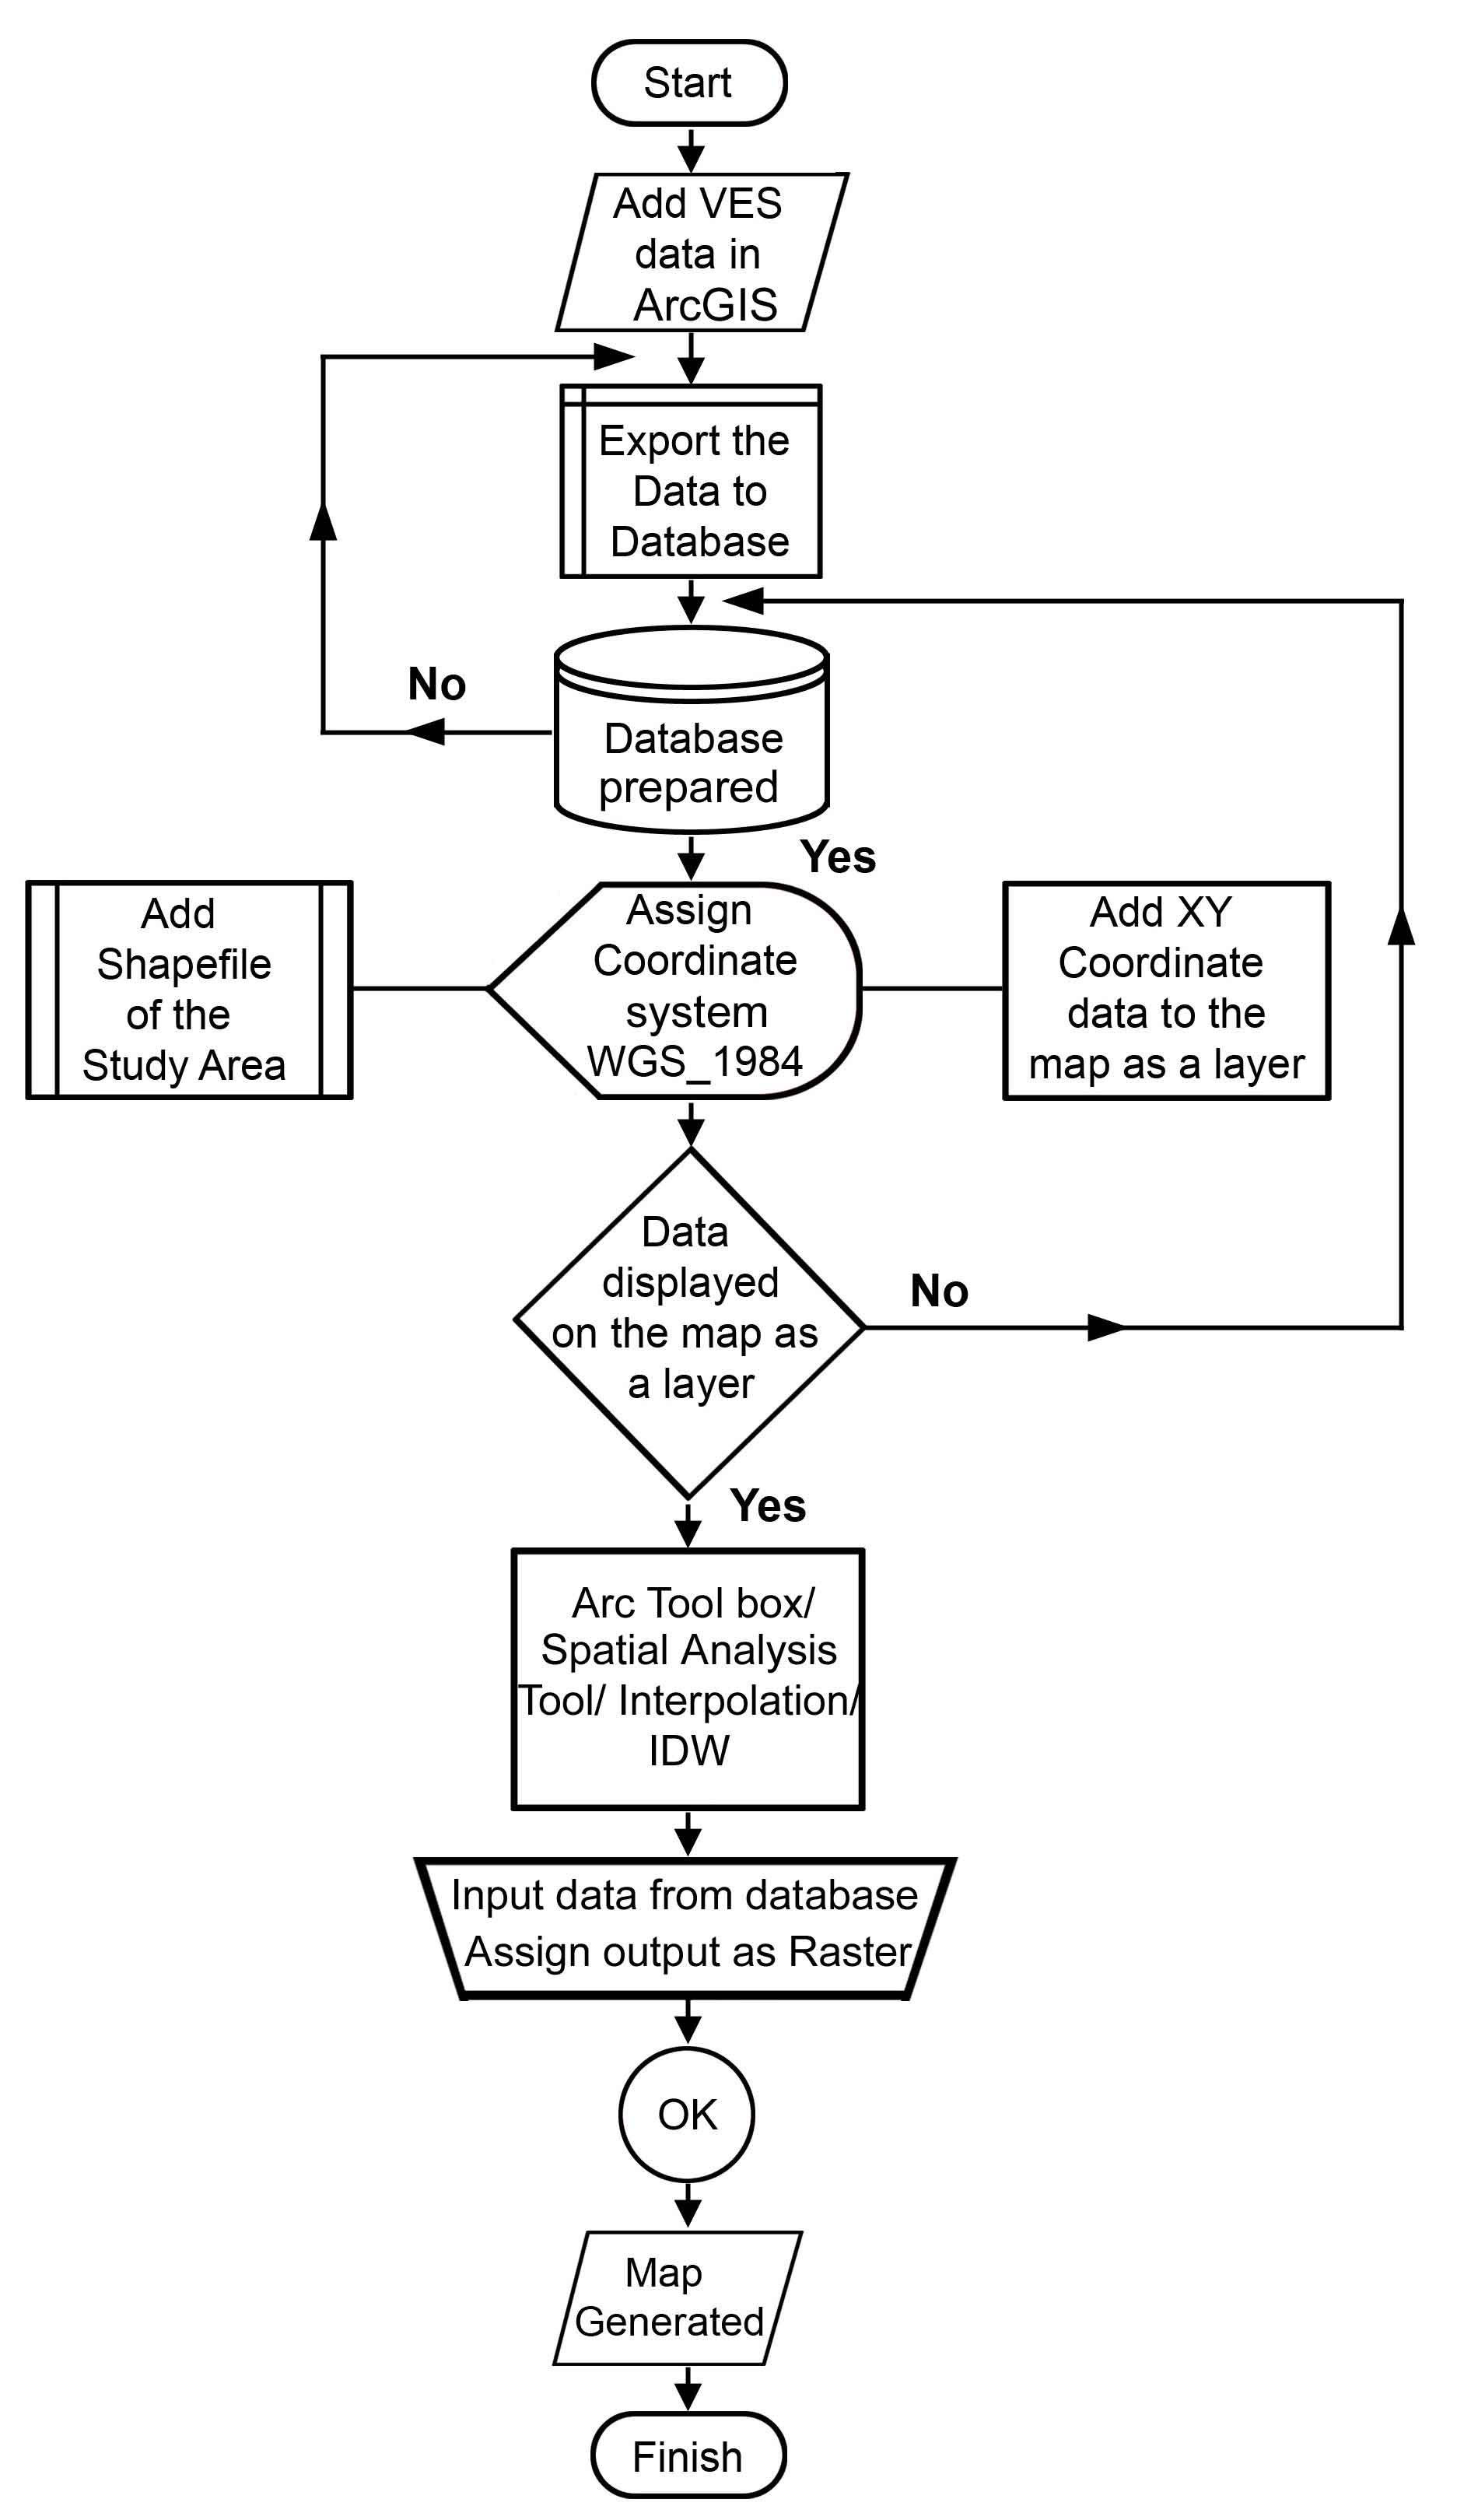
The resistivity distribution over an area under investigation would qualitatively represent the subsurface geology at different depths (Suneetha and Gupta, 2018). Increased electrode spacing allows for deeper current penetration, which can then be utilized to determine depth-wise lithological correlation. With this in mind, resistivity contouring was performed using the Wenner configuration for various electrode spacing, revealing the changes in resistivity at distinct horizons over 23 locations. The obtained resistivity values at different depths from different VES points were tabulated in MS Excel. The resistivity values from sampled points were plotted at these depths in ArcGIS 10.5 environment. However, the un-sampled data in between the measured locations was interpolated using Inverse Distance Weighted (IDW) technique via spatial analyst tool to generate the spatial variation maps (Xie et al., 2011). In an IDW interpolation technique, each estimate value is a weighted average of the sample points around it. Weights are calculated by taking the inverse of the distance between an observed point and the point to be estimated (Burrough and McDonnell, 1998). A flowchart showing the methodology adopted to prepare the spatial variation of isoresistivity data using IDW technique in ArcGIS (Figure 4).
Figure 4. Methodology
Further, geoelectric sections have been prepared over four profiles in the upper, middle and lower parts of the basin in order to understand the vertical variation in geology and to elucidate the groundwater potential zones. IPI2WIN software, a computer-aided 1-D forward modeling approach, was used to interpret the sounding curves (Bobachev, 2003). VES field data is plotted on a double log graph sheet with apparent resistivity versus electrode spacing to produce geo-electrical parameters (layer resistivity and layer thickness) indicating a 2-5 layered structure in the studied area.
4 . RESULTS AND DISCUSSIONS
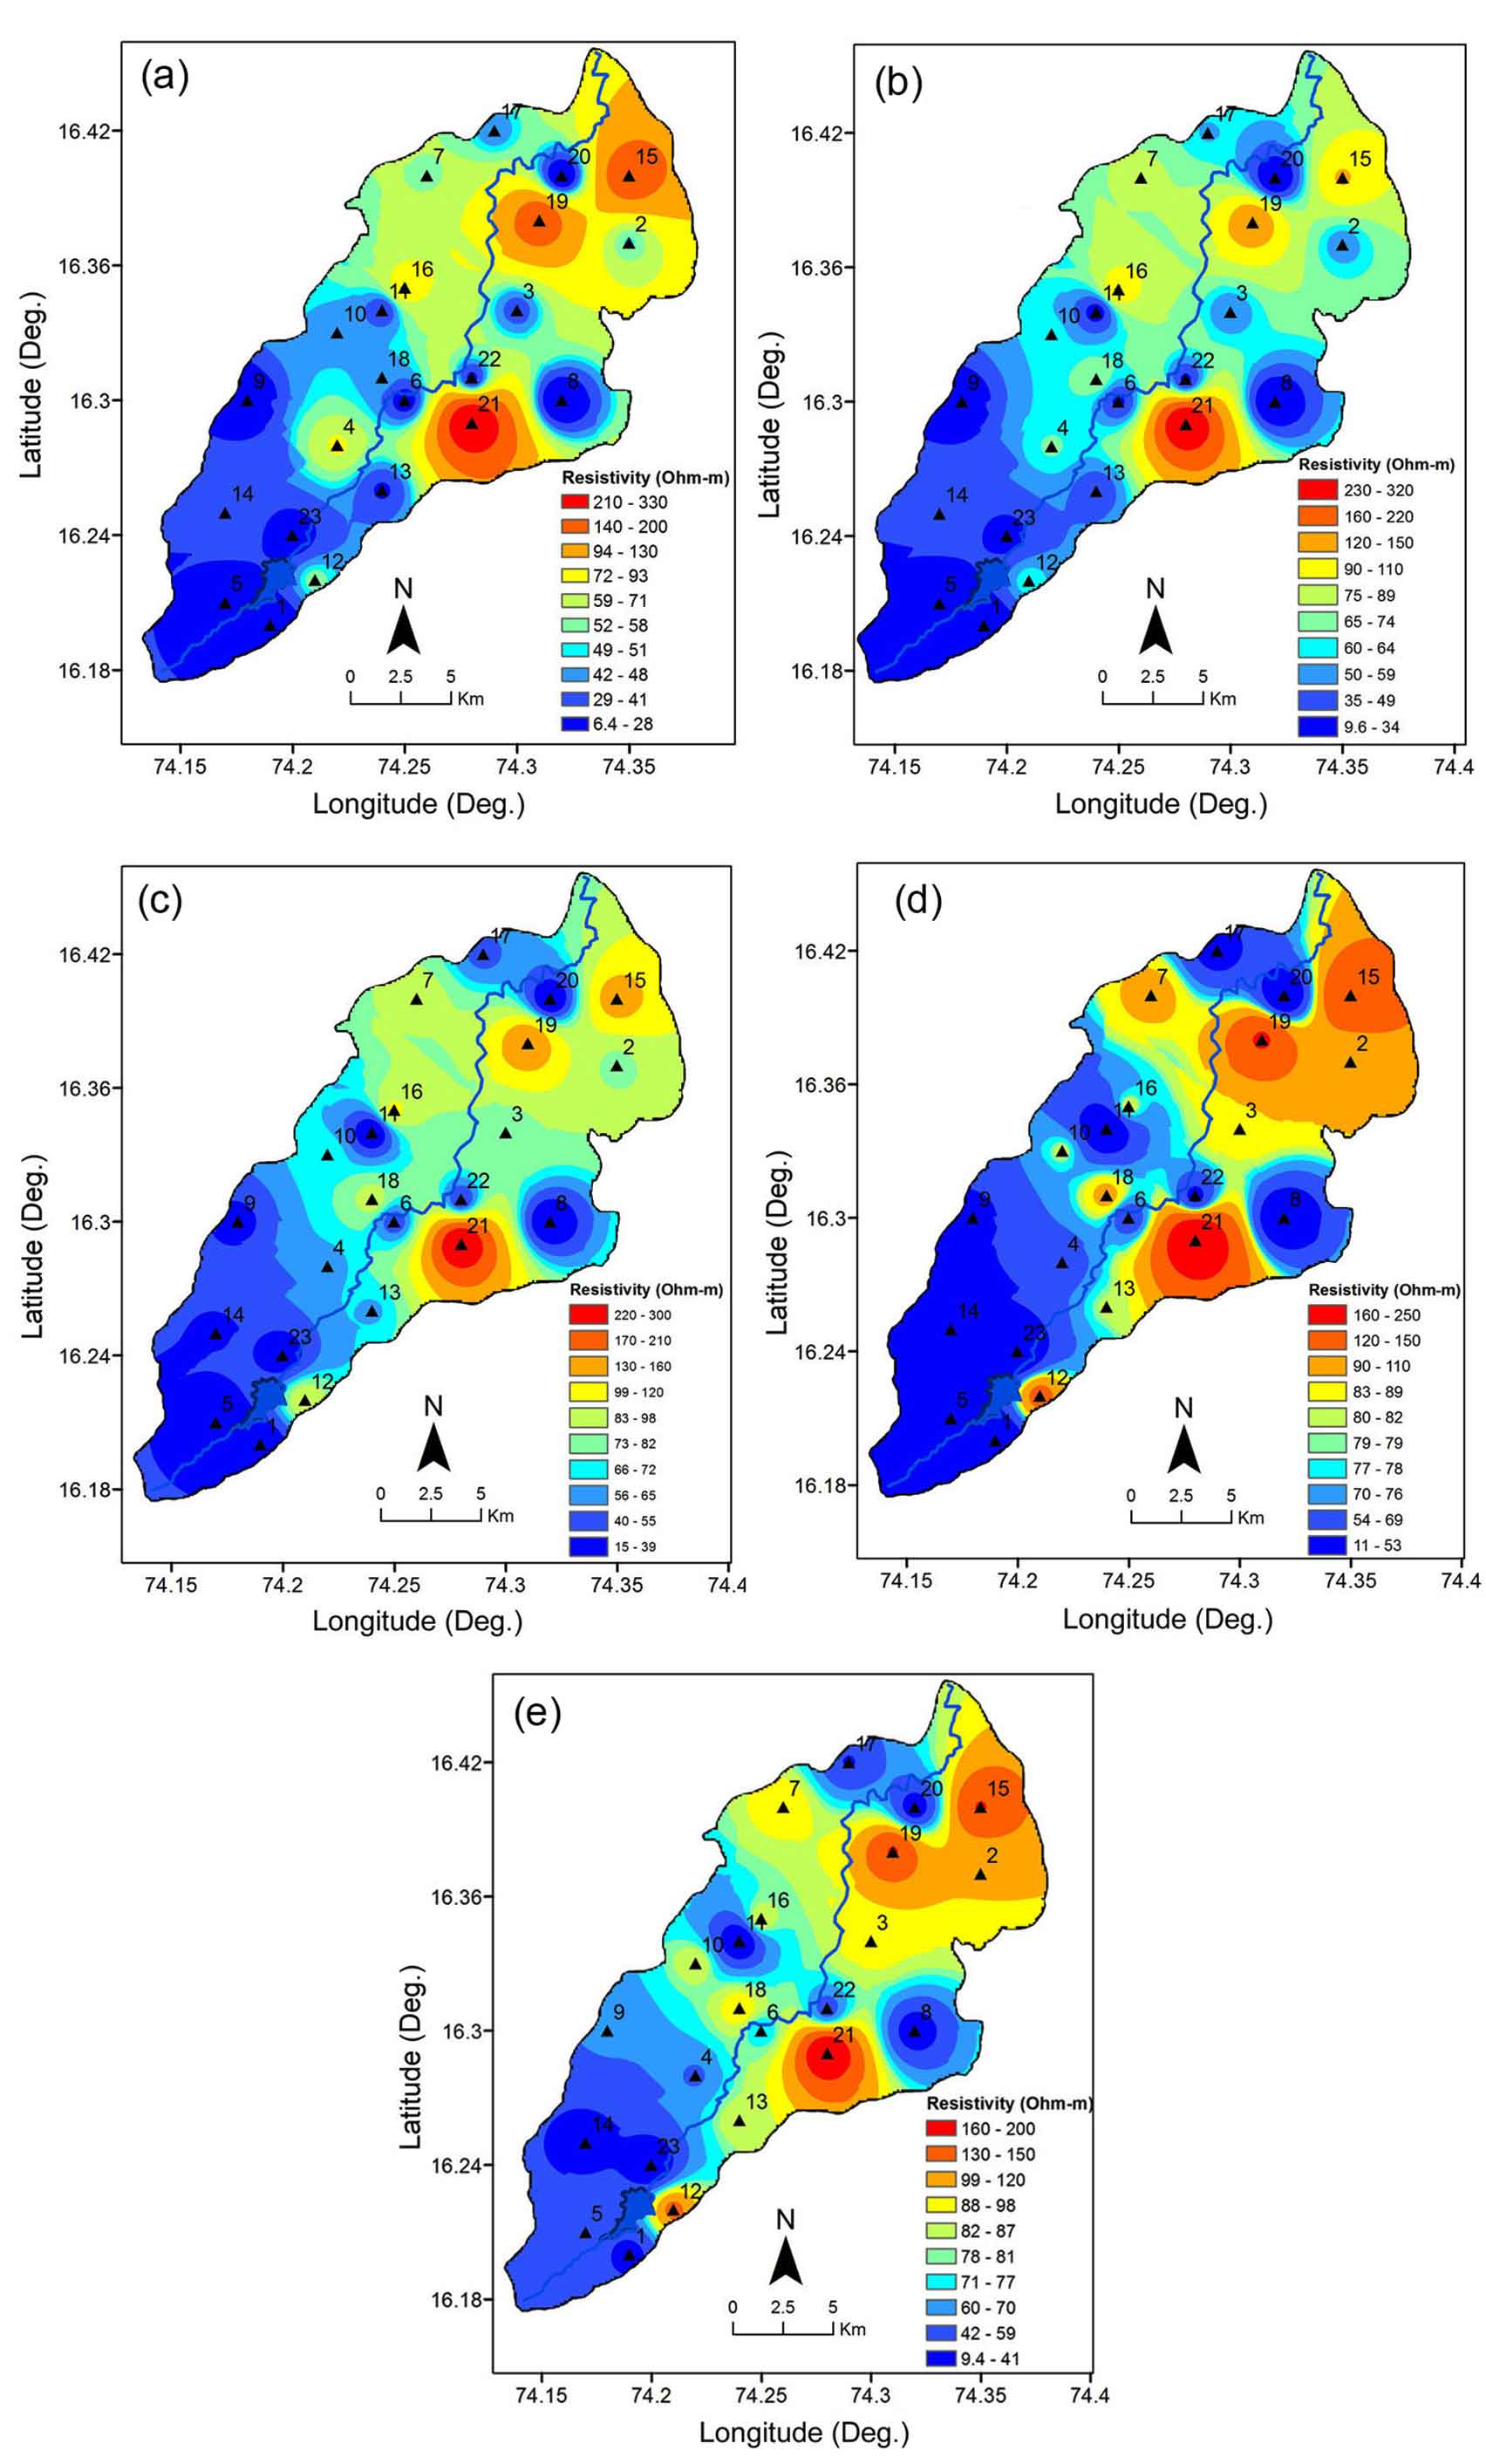
The spatial variation maps for shallow depths (i.e. AB/2 = 2 m, 5 m, 10 m, 15 m and 20 m) (Figure 5a-e) and deeper depths (i.e. AB/2 = 30 m, 40 m, 50 m, 60 m, and 70 m) (Figure 6a-e) were prepared to observe the variation of resistivity at different depths.
Figure 5a-e shows the apparent resistivity distribution at shallow depths (i.e. AB/2 = 2 m, 5 m, 10 m, 15 m and 20 m) over the Chikotra River basin. At 2 m depth, resistivity varies from 6 Ωm to 350 Ωm (Figure 5a). The resistivity in the NE of the study area at VES 15, 19, and 21 is observed to be greater than 140 Ωm from shallow up to the depth of about 20 m which can be attributed to a massive body of basaltic formation. A low resistive feature (6-30 Ωm) at VES 20 and 17 in the NW region is witnessed at all shallow depths of investigation. This is interpreted due to the presence of fractured basalts, which is evident from the fact that parallel drainage pattern in this region indicates the possibility of structural control (Patil et al., 2016). This suggests that the VES points 20 and 17 are conducive for groundwater exploration.
Figure 5. Iso-resistivity spatial variation at (a) 2 m, (b) 5 m, (c) 10 m, (d) 15 m and (e) 20 m
In the central part of the study region, an east-west trending conductive feature is revealed at VES sites 8, 22, 6, and 11 with resistivity ranging from 9 to 30 Ωm. The VES 22 is in the vicinity of alluvium deposits and thus reveals conductive zone. However, the low resistivity at VES 11 up to the depth of 20 m can be attributed to columnar jointed basalts present there, which can be the groundwater potential zone. The low resistivity at 10 m depth from the surface is noticed at VES 3 and 6, which is due to soil moisture along the river bank.
The lowest resistivity is observed at shallow depths up to 20 m from surface in the south and SW region of the Chikotra River basin. The resistivity here varies from 6-50 Ωm (Figure 5a-e). Such low resistivity is also observed at deeper depths (up to 70 m), particularly at VES 1, 14 and 23 (Figure 6a-e). It can be surmised that this region, though hilly and flat tract, there is a scope of promising aquifer. This is further confirmed from the fact that the longitudinal conductance is low and the transverse resistance is high, meaning that the transmissivity of the region is high, signifying fresh water zone (Shailaja et al., 2016).
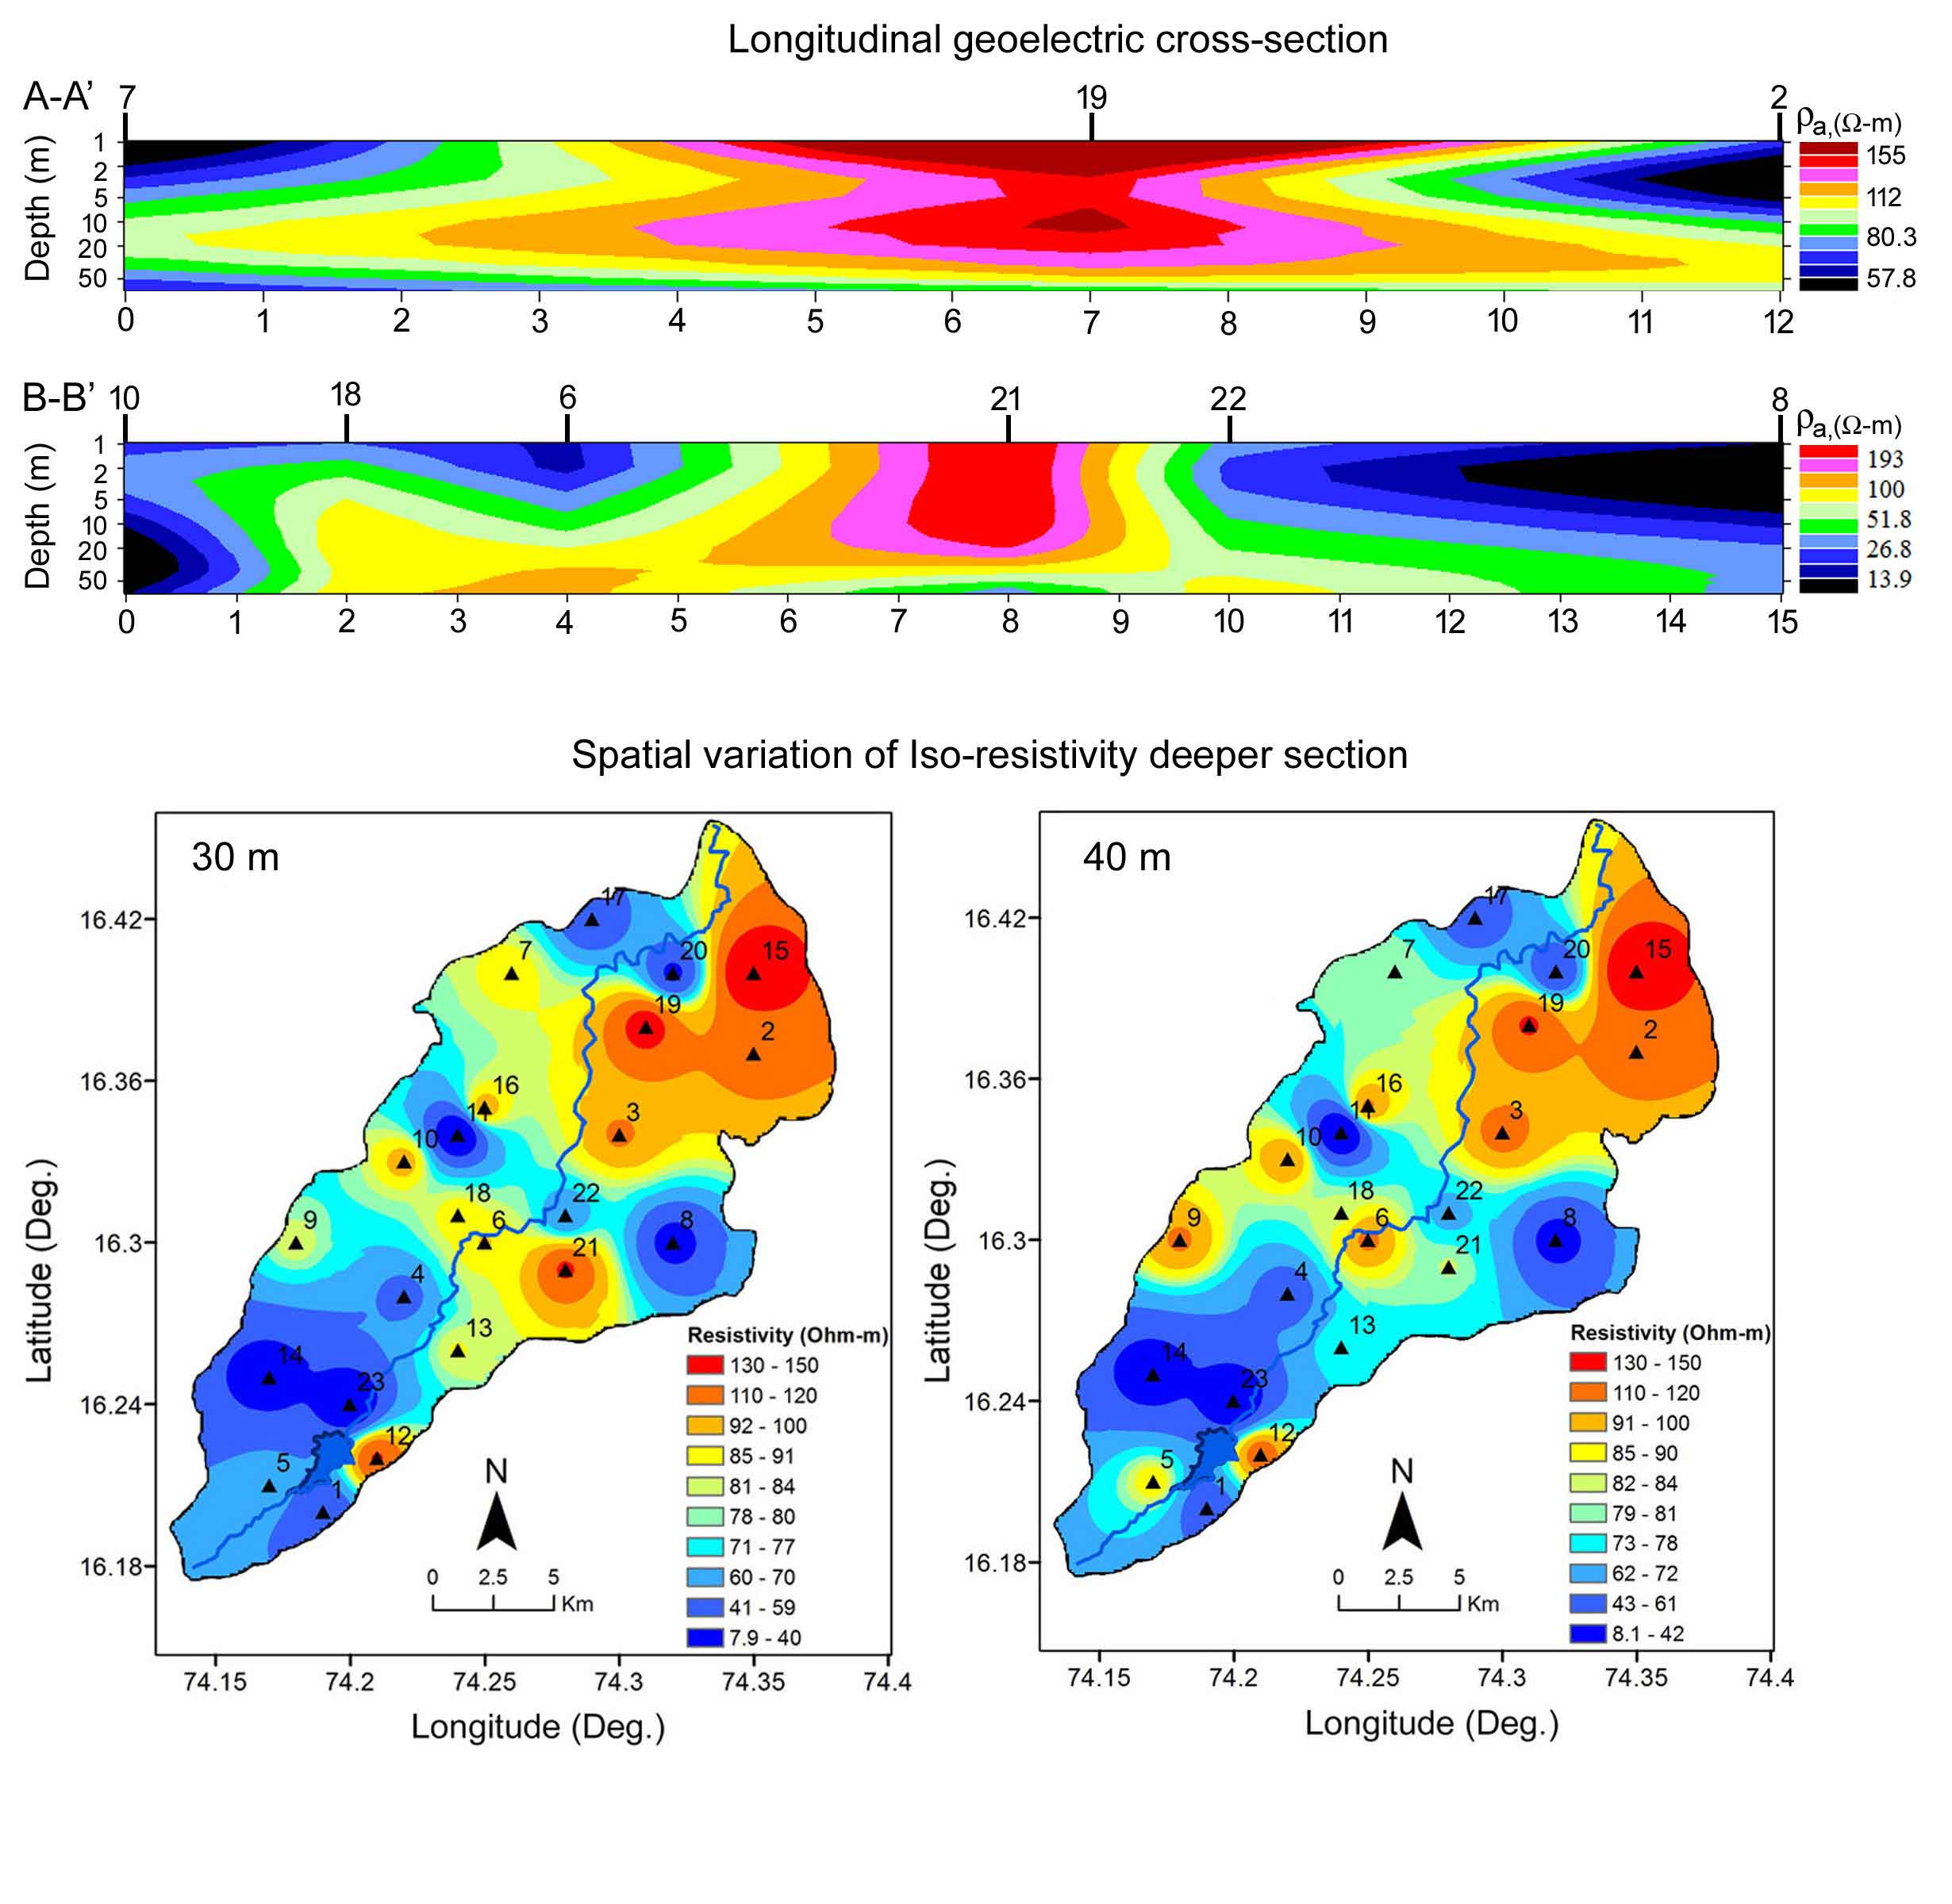
Figure 6. Iso-resistivity spatial variations at (a) 30 m, (b) 40 m, (c) 50 m, (d) 60 m and (e) 70 m
In the central part of the basin, the conductive zone as evidenced in the shallow section is also revealed in the deeper sections at VES 8, 11 and 22 (Figure 6a-e). At Murukte village, prominent columnar joints have been noticed. Elsewhere, such as near Hasur Khurd and Khadak Ohol stream on the way to Belewadi-Kalamma, joints and cracks are abundant. (Patil et al., 2016), which are indicative of groundwater reserves. However, south of the conductive zone, a high resistive zone is delineated at VES 6, 18 and 10, which is conspicuous from 15 m depth and beyond (Figure 6a-e). South of this feature, conductive zones are encountered. It is thus felt that the high resistivity feature encompassed on either side by conductive zones is suggestive of some amount of structural control. This is corroborated by the fact that several cris-cross lineaments traverse this region. This also means that the intersection points of the lineaments are prospective groundwater locale.
In the deeper parts (30-70 m depth), high resistivity (> 130 Ωm) is observed at VES 2, 3, 15 and 19 in the NE of the study area (Figure 6a-e). This is ascribed to massive basaltic formations. VES sites 17 and 20 on either side of Chikotra River in the NW part shows low resistivity values (around 40 Ωm) up to depth of 70 m, which can be exploited for groundwater.
Longitudinal geoelectric sections have been prepared over four profiles (marked as A-A', B-B', C-C' and D-D') in the study region in order to elucidate the groundwater potential zones and to identify the dimension of the aquifers. All the four profiles are trending in NE-SW direction (Figure 7a-d).
Figure 7a represents the longitudinal cross-section plot for profile A-A' covering the VES points 7, 19 and 2 in the northern part of the study area. A thin low resistivity (about 50 Ωm) is revealed up to depth of 2 m at VES station 7. The subsurface beneath this station is moderately resistive with resistivities in the range of 80-100 Ωm. However, at 50 m depth, low resistivity of about 60 Ωm is observed. At VES 19, a high resistivity (150-160 Ωm) feature is delineated from shallow depth up to about 20 m. Beneath this a thin veneer of low resistivity (50 Ωm) is seen. Further east, at VES 2, the top 10 m is conductive with resistivity values of the order of 30 Ωm. Beneath this, the structure is resistive (100 Ωm). It can be inferred from Figure 7a that the western and central part of the profile is rather resistive and devoid of water. However, the eastern part depicts groundwater at shallow depths. This is observed in the spatial variation maps for 2, 5 and 10 m (Figure 5 a-c). The low resistivity observed at depths of about 50 m beneath VES 7 corroborates well with the spatial variation maps at depths of 50, 60 and 70 m (Figure 6 c-e). The high resistivity observed in the longitudinal cross-section is due to the compact basaltic formation predominant in the vicinity of profile A-A'.
Profile B-B' encompasses VES stations 10, 18, 6, 21, 22 and 8 and occupies the central part of the basin (Figure 7b). Low resistivity zone seen beneath VES 10, 18 and 6 at various depth levels. At VES 10, the top 5 m reveals resistivity values in the range of 20-30 Ωm. However, below 5 m depth, the resistivity decreases and varies between 5-15 Ωm up to depth of 50 m. VES station 18 indicates low resistivity in the range of 30-50 m in the top 5 m, beneath which the structure is resistive (~100 Ωm) up to depth of investigation. Further east, below VES 6, the resistivity in the shallow layer is of the order of 20-50 Ωm up to depth of about 10 m. High resistivity (60-200 Ωm) is observed up to depth of penetration. VES 21 is located in a higher elevation, which is clearly reflected in the longitudinal cross-section (Figure 7b). Here, a high resistivity block (>200 Ωm) is observed up to 20 m depth. Beneath this feature, moderately low resistivity (about 60 Ωm) zone is revealed up to depth of about 45 m. A low resistivity (~20 Ωm) patch seen at depth of 50 m, suggesting deeper source of groundwater. However, the depth constraint in the present study could not map the entire aquifer body. A broad low resistivity (10-30 Ωm) zone is encountered beneath VES stations 22 and 8. This feature is shallow (up to 10 m) at VES 22, while it is extending up to the depth of investigation beneath VES 8. The spatial variation maps also suggests conductive zone both in the shallow as well as deep sections at VES 8 and 22, which corroborates with the findings from longitudinal geoelectric section.
Figure 7(c) depicts the longitudinal cross-section over profile C-C' encompassing VES stations 9, 4 and 13. A 10 m thick low resistivity zone having resistivity values of 15-30 Ωm is observed beneath VES 9. The lateral spread of this low resistivity zone is about 4 km, as seen in Figure 7(c). VES 4 reveals moderately high resistivity values (50-80 Ωm) from shallow up to deeper depths. A 5 m thick low resistivity feature is seen below VES 13, having resistivity values in the range of 15-30 Ωm. Beneath this, the structure is hard attaining a maximum resistivity value of about 110 Ωm.
Figure 7. Longitudinal geoelectric sections over profiles (a) A-Aʹ, (b) B-Bʹ, (c) C-Cʹ, and (d) D-Dʹ
The southernmost profile D-D' comprises of VES stations 14, 23 and 12. It is observed from Figure 7(d) that the region around VES 23 is conductive, due to the source of Chikotra River. The subsurface at VES 14 suggests moderate resistivity ranging from 30-50 Ωm up to a depth of 50 m. As mentioned, the structure beneath VES 23 reveals a 5 m thick broad conductive zone having resistivity values 10-20 Ωm, followed by a 5 m thick layer with resistivity of ~30 Ωm. Below this, another broad conductive feature with resistivity values of 10-20 Ωm is observed up to the depth of investigation. Further east, the VES 12 exhibits resistivity of higher order between 55-100 Ωm signifying fractured basalt to moderately compact basalt. Thus the profile D-D' (Figure 7d) suggest promising aquifer zone beneath the VES 23 while VES 14 can also be categorized as a potential aquifer zone. This is probably due to the fact that Chikotra River originates in the vicinity of VES 23.
5 . CONCLUSIONS
Vertical electrical sounding (VES) were conducted at 23 sites over Chikotra River basin in southern Maharashtra, in order to decipher the subsurface features and to quantify the occurrence of groundwater. The spatial variation maps for shallow depths (i.e. AB/2 = 2 m, 5 m, 10 m, 15 m and 20 m) and deeper depths (i.e. AB/2 = 30 m, 40 m, 50 m, 60 m and 70 m) were prepared to examine the resistivity variation at different depths which would qualitatively represent the subsurface geology. Further, the longitudinal geoelectric cross-sections were prepared over four profiles, from north to south in the study area, to determine the groundwater potential zones and the thickness of the aquifers.
Resistivity contouring over VES 15, 19 and 21 in the NE of the study area indicate resistivity values in excess of 140 Ωm from shallow up to the depth of about 20 m which is due to massive basaltic formation. However, VES 20 and 17 in the NW part reveal low resistive feature (6-30 Ωm) at shallow depths of investigation. Presence of fractured basalts in this part indicates some amount of structural control, therefore conducive for groundwater exploitation. In the central part of the study region, an East-West trending conductive feature is revealed from shallow to deeper depths at VES sites 8, 22, 6, and 11 with resistivity ranging from 9 to 30 Ωm, which is presumably due to alluvium deposits and columnar jointed basalts present there, and are thus favorable as groundwater potential zones. It is also observed that several cris-cross lineaments traverse this region and the intersection points of the lineaments are likely to be potential groundwater zones. Very low resistivity (6-50 Ωm) is observed from shallow to deeper depths (up to 70m), particularly at VES 1, 14 and 23 in the south and SW region of the Chikotra River basin. It is envisaged that this region, which has low longitudinal conductance and high transverse resistance leading to high transmissivity can be a potential aquifer system.
Qualitative interpretation results gave a good portrayal for both the lateral and vertical variations of apparent resistivity, along the four geoelectric profiles in the study region. High resistivity in the range of 80-140 Ωm constituting compact basalts is revealed at the western and central part of the profile A-A', while low resistivity of 30 Ωm is seen in the eastern sector, which is likely to be a potential groundwater zone. The central part of profile B-B' is highly resistive having resistivity value in excess of 200 Ωm. The western and eastern parts of the profile depict low resistivity (5-30 Ωm) at different depth levels and thus conducive for groundwater exploitation. Also several sites over profiles C-C' and D-D' are favorable for groundwater exploration. There is semblance in the interpreted longitudinal geoelectric sections and the spatial variation of resistivity at different depths.
It is a well-known fact that several districts in the state of Maharashtra are reeling under severe water scarcity. This is chiefly due to paucity of rainfall. Also the physiographical features play an important role in the occurrence and movement of groundwater. There is thus ample scope for groundwater development at strategic locations in order to bring more agricultural land for irrigation purpose. This can be achieved by adopting proper scientific devices in an integrated manner using state of the art analytical facilities. It is however observed that in many parts of the study area, there exists a possibility of tapping the deeper aquifers in this region through bore wells in the depth range of 50 m bgl for drinking water supply. The shallow aquifers in the weathered, fractured and jointed basalt present in the study area, normally at depth of about 5-10 m bgl, can also be tapped. There are several lineaments cris-crossing the study region and therefore the dug well/bore well sites should be located close to the lineaments, which are generally favorable zones for groundwater.
Tables
Figures
Conflict of Interest
There are no conflict of interest(s).
Acknowledgements
The authors express their gratitude to the Director, Indian Institute of Geomagnetism, Panvel for granting permission to publish the work.
Abbreviations
DVP: Deccan Volcanic Province; HRT: Hard Rock Terrain; IDW: Inverse Distance Weighted; VES: Vertical Electrical Sounding.
Adeoti, L., Alile, O. M. and Uchegbulam, O., 2010. Geophysical investigation of saline water intrusion into freshwater aquifers: A case study of Oniru, Lagos State. Scientific Research and Essays, 5(3), 248-259.
Gupta, S., 2013. Groundwater information, Kolhapur district, Maharashtra. Technical Report No. 1811/DBR/2010, Ministry of Water Resources, Central Groundwater Board, Govt. of India.
Mungale, S., 2001. Geology of the Chikotra River basin District Kolhapur with special reference to watershed development. UnpublishedM.Sc. Dissertation, Pune University, Pune, 63.
Pawar, N. J., Pawar, J. B., Supekar, A., Karmalkar, N. R., Kumar, S. and Erram, V. C., 2009. Deccan dykes as discrete and prospective aquifers in parts of Narmada-Tapi Zone, Dhule district, Maharashtra. In: Srivastava, R. K., Sivaji, C., Chalapathi Rao, N. V. (Eds) Indian Dykes: Geochemistry, Geophysics and Geochronology. Narosa Publishing House Pvt. Ltd., New Delhi, 189-198.
Singhal, B. B. S., 1997. Hydrogeological characteristics of Deccan trap formations of India. Proceedings Hard Rock Hydrosysteins (Rabat Symposium S2, May 1997), IAHS Publ. 241.
Tahama, K., Gupta, G. and Krishnamacharyulu, S. K. G., 2018. Geoelectrical studies to understand the groundwater regime in parts of coastal area of Sindhudurg district, Maharashtra, India. International Journal of Earth Science and Engineering, 11(2), 194-199.


 ,
Gautam Gupta 1
,
Gautam Gupta 1