Temporal satellite imageries are very crucial for change detection of lake surface area.
Integrating different water indexes enhance the accuracy of water body extraction.
Lake Beseka exhibits a remarkable and drastic expansion during the history.
Thresholding methods of separation of water from non-water feature is an easy computation.
Abstract
Changes in lake surface area and fluctuations in water levels are common especially in the Ethiopian Rift Valley region. The aim of this study was to present the spatiotemporal changes of lake Beseka from 1985 to 2020 using multi-temporal Landsat images. Four spectral water indices, namely Normalized Differential Water Index (NDWI), Modified Normalized Difference Water Index (MNDWI) and Automated Water Extraction Index (AWEI) were used for the extraction of the lake water. The results of the study show that lake Beseka has tended to expand significantly and strongly over the past 35 years. During 1985, the lake surface area was around 30.9km2 and within the next 35 years, the lake surface area increased by 18.18 km2and in 2020, its surface area is about 49.1 km2. lake Beseka shows 0.2412km2 area change from 2015 to 2020. This indicates lake Beseka has a decreasing trend of expansion compared to its history. However, the topography of Lake Beseka is lower in elevation a small water level rise in the lake can cover a large area and lead to significant impacts on the surrounding environment. Therefore, the monitoring of lake surface changes by multi-temporal satellite images is very necessary and of decisive importance.
Keywords
Water index , Surface area , Landsat , Lake Beseka , Change Detection
Several methods have been proposed to extract water bodies from Landsat images. The common water mapping methods are categorized as: spectral analysis, single-band thresholding method, supervised and unsupervised classification and spectral water index method (Zhang et al., 2003). Among these methods, the spectral water index method has been widely used for the reason of high accuracy in water body detection (Feyisa et al., 2014; Acharya et al., 2018). Many spectral water index methods were proposed and used in many fields of water resource assessment, such as Normalized Difference Water Index (NDWI) (McFeeters, 1996), Modified Normalized Difference Water Index (MNDWI) (Xu, 2006), Automated Water Extraction Index (AWEI) (Feyisa et al., 2014) and many others.
In this study, surface changes of lake Beseka over a long period (1985-2020) were detected using Landsat time series images. Three water spectral indices were utilized namely NDWI, MNDWI and AWEI. Historical and present conditions of the water surface area were analyzed by utilizing the spatial area extent of the lake at different times, by performing trend analysis of the lake surface area changes, and using anomaly change detection. Most of the available studies have mainly focused on the causes of lake expansion, water quality, and possible environmental effects respectively, without mentioning the amount of quantitative changes in the lake surface and the current state of the lake. Therefore, this study can provide accurate information on the quantitative time series of lake surface changes and zone of the lake expansion.
2 . STUDY AREA
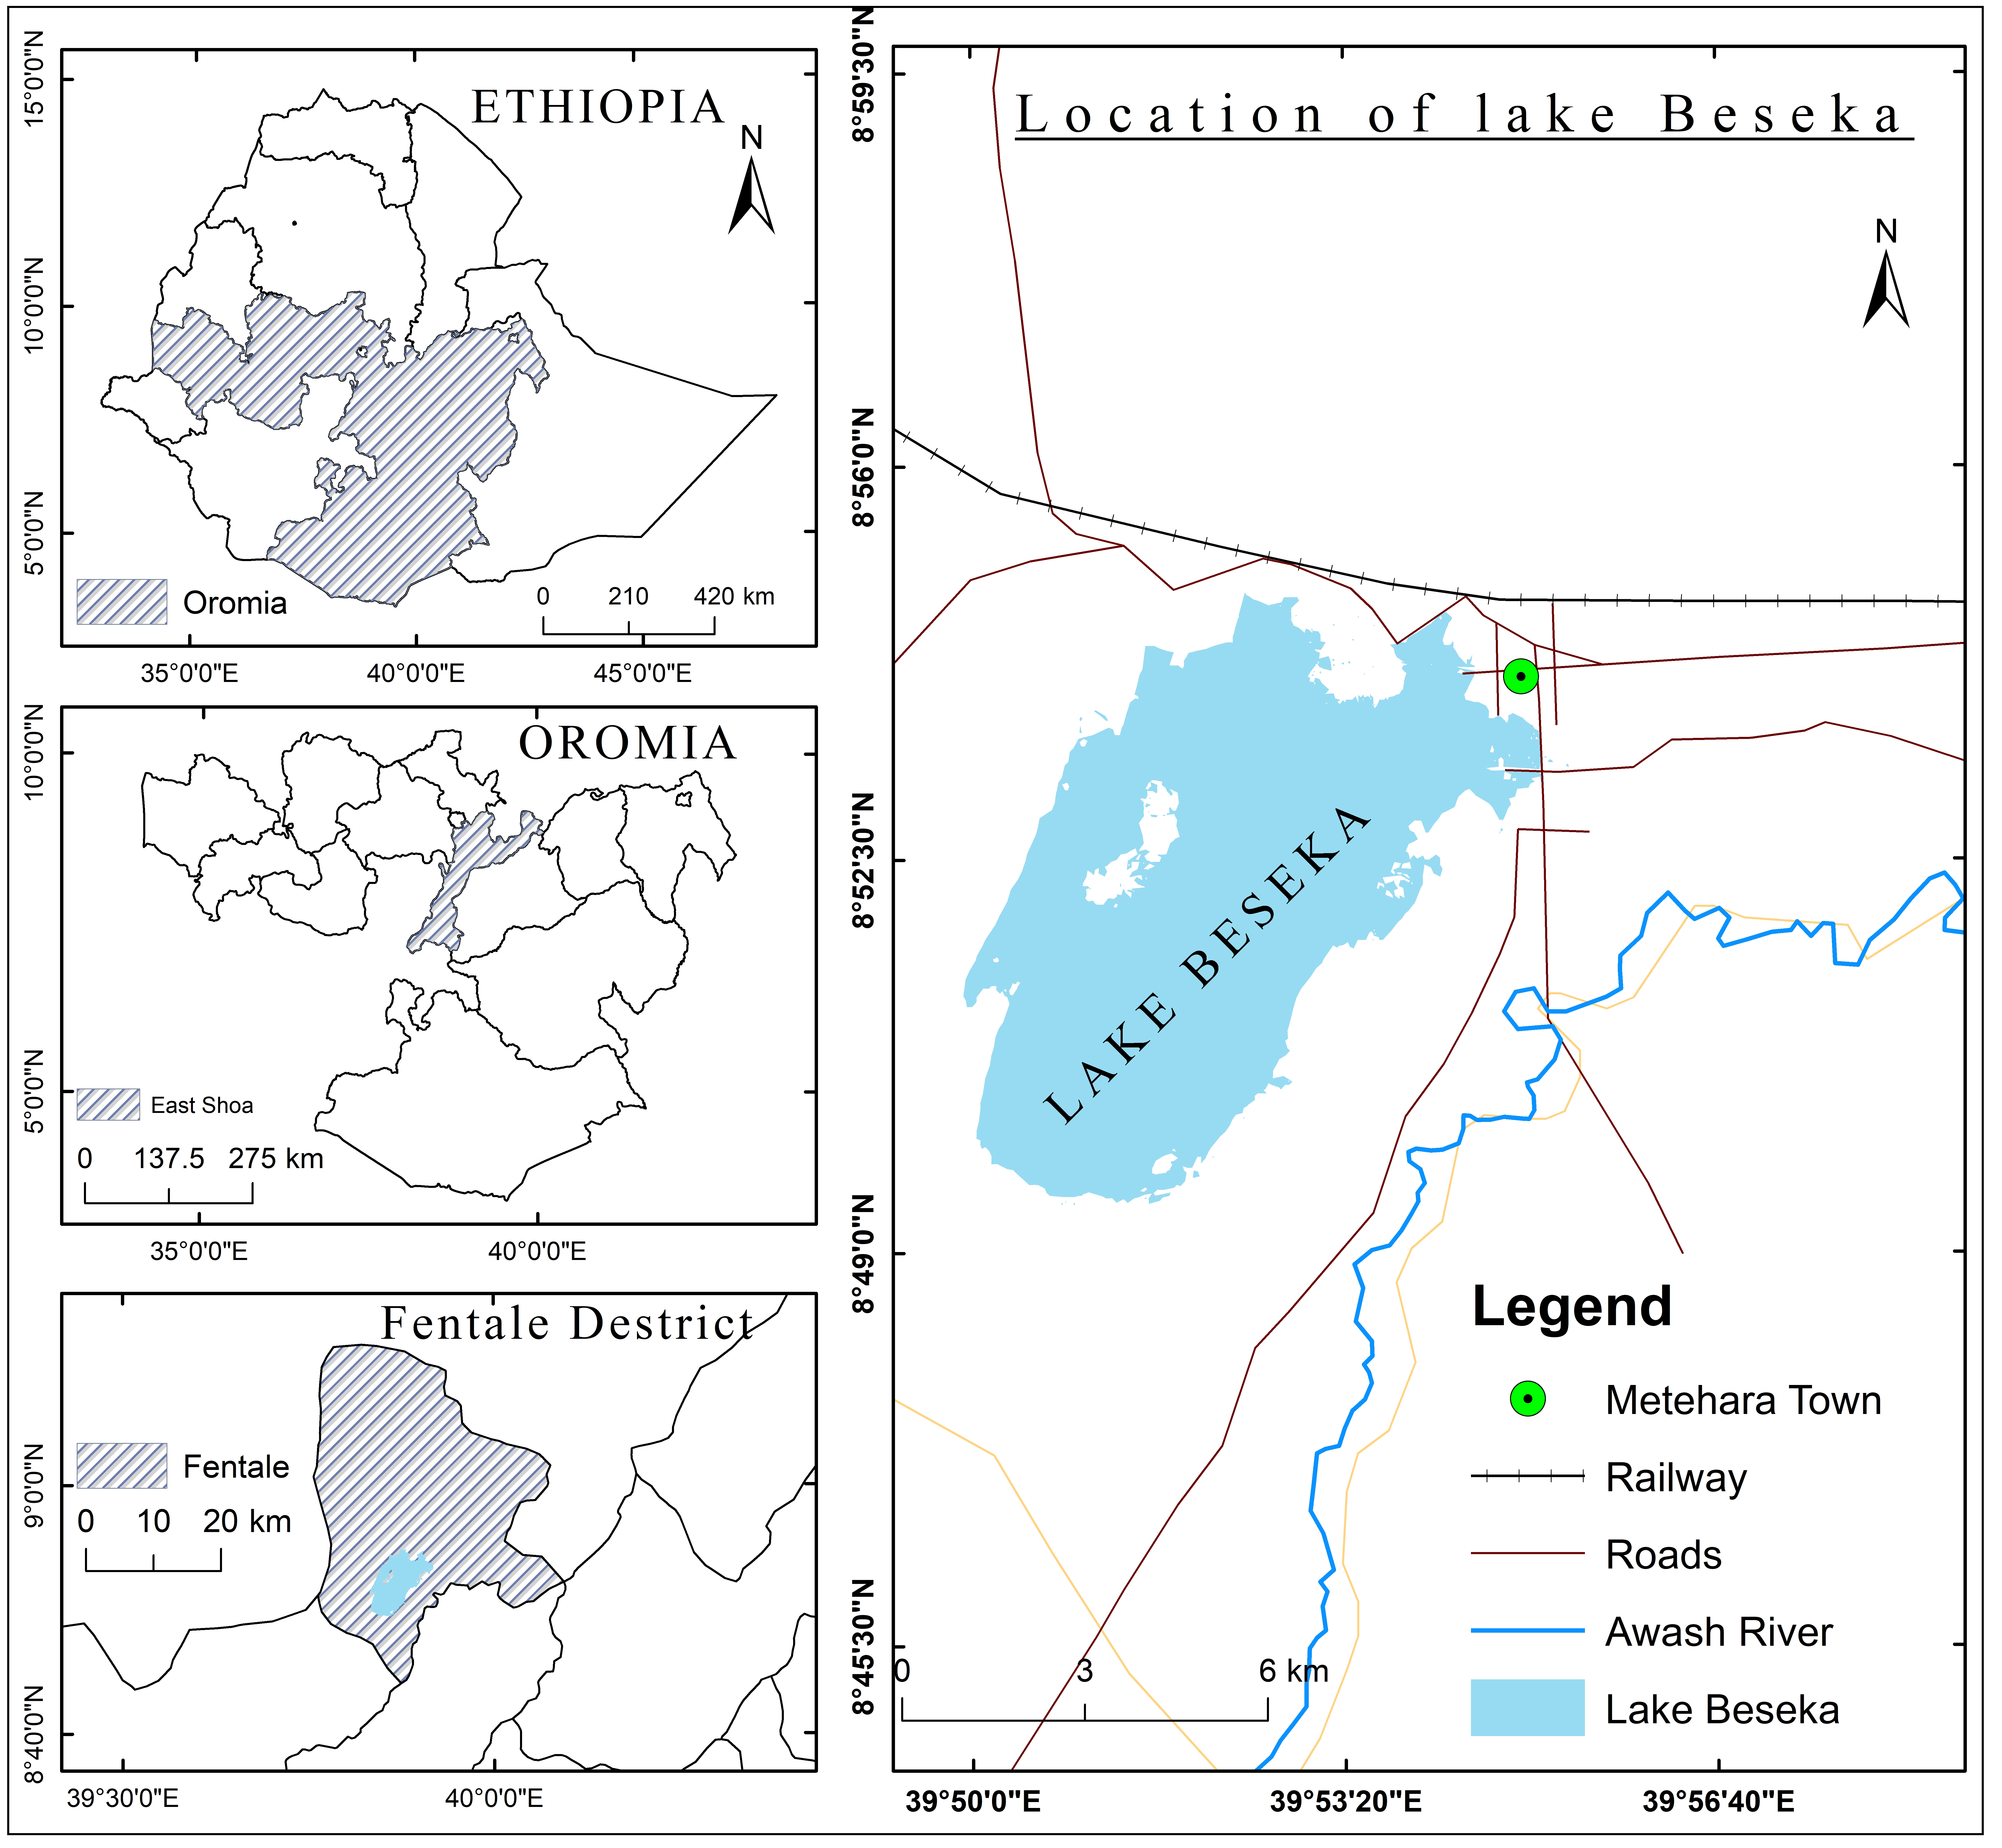
Lake Besaka is located in the main Ethiopian rift valley region near a town called Methara. The town of Matahara lies on a flat plain that extends to the Awash River and surrounded by mountains and hills of varying heights. It has an average distance of 200 km southeast of the country’s capital city, Addis Ababa, along with the Addis Ababa-Dire Dawa-Djibouti road. Geographically, it found between 39º 49ꞌ 10ꞌꞌ E ̵ 39º 55ꞌ 44ꞌꞌ E longitude and 8º 48ꞌ 48ꞌꞌ N ̵ 8º 56ꞌ 24ꞌꞌ N latitude (Figure 1). The lake surrounding has an altitude that ranges from 732 m to1900 m above mean sea level.
Figure1. Location map of the study area: Lake Beseka from northern part of the Ethiopian Rift
The study area and its catchment area are characterized by a semi-arid climate with bimodal and irregular precipitation distribution (Dinka, 2017). The heavy rainy season is from July to September, accounting for 70% of the total rainfall, and the small rainy season from March to April, accounting for 30% of the total rainfall in the study area. The annual average rainfall is approximate 522.7mm. The average minimum and maximum temperature is 28.9°C and 21.8°C, respectively.
Being located in the rift region, the study area is very sensitive to the occurrence of tectonic and volcanic events. For this reason, the study area is characterized by features of historic and recent volcanic craters and traces of fault lines. Mount Fentalle (volcanic crater), extensive scoriaceous hills are found in the north part of the study area, and its eruption history is believed to be at the end of the Eighteenth Century (Rampey et al., 2010).
3 . DATA
Time series Landsat images from 1985 to 2020 were used as the data source for analysis and detection of the spatiotemporal variation of lake Beseka. The images were acquired by Landsat sensors such as Landsat 5 Thematic Mapper (TM), Landsat 7 Enhanced Thematic Mapper Plus (ETM+) and Landsat 8 Operational Land Imagery (OLI). Dry season images of January and February were selected for the data acquisition date when the study area received the lowest mean annual rainfall, resulting free or least cloud cover. 5-year difference: 4 Landsat TM images, 2 Landsat ETM+ images, and 2 Landsat OLI images over a period of 35 years (from 1985 to 2020) were used for the analysis. All images have been downloaded in GeoTIFF format from the US Geological Survey (USGS). The datasets were a good quality product (level 1 product) with a cloud cover of less than 5%. Detailed information about the technical parameters of satellite images used in the study is presented (Table 1 and 2).
Table 1. Specifications of selected Landsat time series images
Satellite
Sensor
Path/row
Acquisition date
Spatial resolution (m)
Source
Landsat5
TM
168/54
21 January 1985
30
USGS
Landsat 5
TM
168/54
17 February 1990
30
USGS
Landsat 5
TM
168/54
30 January 1995
30
USGS
Landsat 5
TM
168/54
13 February 2000
30
USGS
Landsat 7
ETM+
168/54
02 February 2005
30
USGS
Landsat 7
ETM+
168/54
17 February 2010
30
USGS
Landsat 8
OLI
168/54
05 January 2015
30
USGS
Landsat 8
OLI
168/54
01 January 2020
30
USGS
Table 2. Spectral details of TM/ETM+ and OLI sensors
Sensor
Band numbers
Band name
Wavelength (µm)
TM/ETM+
1
Blue
0.45-0.52
2
Green
0.53-0.61
3
Red
0.63-0.69
4
NIR
0.77-0.90
5
SWIR1
1.55-1.75
7
SWIR2
2.09-2.35
OLI
2
Blue
0.45-0.515
3
Green
0.525-0.600
4
Red
0.630-0.680
5
NIR
0.845-0.885
6
SWIR1
1.560-1.660
7
SWIR2
2.100-2.300
4 . METHODOLOGY
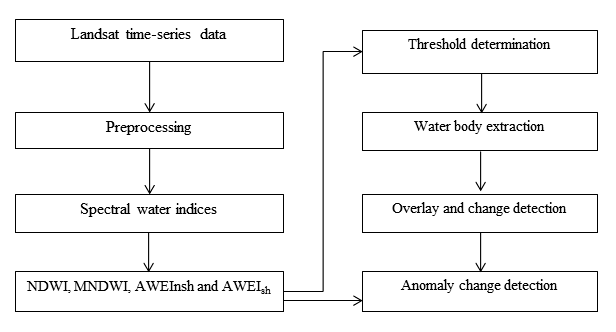
4.1 Image Preprocessing
The digital numbers recorded by the sensors are not a pure representation of the values reflected from the features of the Earth’s surface. This is due to atmospheric absorption and scattering, fluctuations in water vapor, aerosol concentrations in the atmosphere, and temporary fluctuations at solar angle (Wang and Deliberty, 2005; Doxani et al., 2018). Preprocessing such as radiometric calibration and atmospheric correction was performed to prepare the input satellite imagery for further analysis. The SLC-off image observed on 02 February 2005 and 17 February 2010 image (on ETM+ Sensor) was corrected using Landsat gap-fill extension. Since, all the L1T (level 1 product) Landsat TM, ETM+ and OLI products are geometrically corrected (Irons et al., 2013), no geometrical corrections were applied.
Figure 2. Methodology
4.2 Spectral Water Indices
In this study, lake water was extracted based on four spectral water indices, namely Normalized Difference Water Index (NDWI), Modified Normalized Difference Water Index (MNDWI), and Automated Water Extraction Index (AWEI). The Normalized Water Index (NDWI) (equation (1)) was proposed by McFeeters (1996) for the mapping and evaluation of water resources. NIR and green bands used to improve the separation of surface water and non-water features.
\(NDWI= {(Green-NIR) \over (Green+NIR) }\) (1)
where, positive values (NDWI >0) represent water features, and negative values (NDWI <0) represent terrestrial vegetation and soil.
Another researcher, Xu (2006) pointed out that the NDWI method may not be able to effectively separate the noise of the constructed built-up features, and proposed the new index called Modified Normalized Difference Water Index (MNDWI) (equation (2)), which replaces the NIR band with SWIR band, which is band 5 for TM / ETM+ sensor and band 6 for OLI image.
MNDWI can enhance the open water features while suppressing the classification noise in the urban environment.
Feyisa et al. (2014) have developed a new spectral index for water feature extraction which is named as Automated Water Extraction Index (AWEI). AWEI considering two situations, (1) for areas where shadows are not a problem (AWEInsh) (equation (3)) and (2) for areas where shadows and dark surfaces are a problem (AWEIsh) (equation (4)).
The AWEI coefficient is determined based on repetitive experiments that can distinguish between water and non-water surface characteristics (Feyisa et al., 2014).
4.3 Anomaly Change Workflow
The concept of anomalies primarily refers to events such as rare events, unexpected events, noise, and detection of object novelty (Wei et al., 2005; Kittler et al., 2014). This study adopted an anomaly detection workflow algorithm developed by (Reed and Yu, 1990). The Reed-Xiaoli Detector (RXD) algorithm extracts targets that are spectrally different from the background of the image. RXD (equation (5)) is effective when the anomalous targets are sufficiently small, relative to the background.
\(RDX(r) = (r-µ)^T K_{(L×L)}^{-1} (r-µ) \) (5)
where, r is the model vector, μ is the model mean, and K(LxL) is the model covariance matrix.
5 . RESULTS
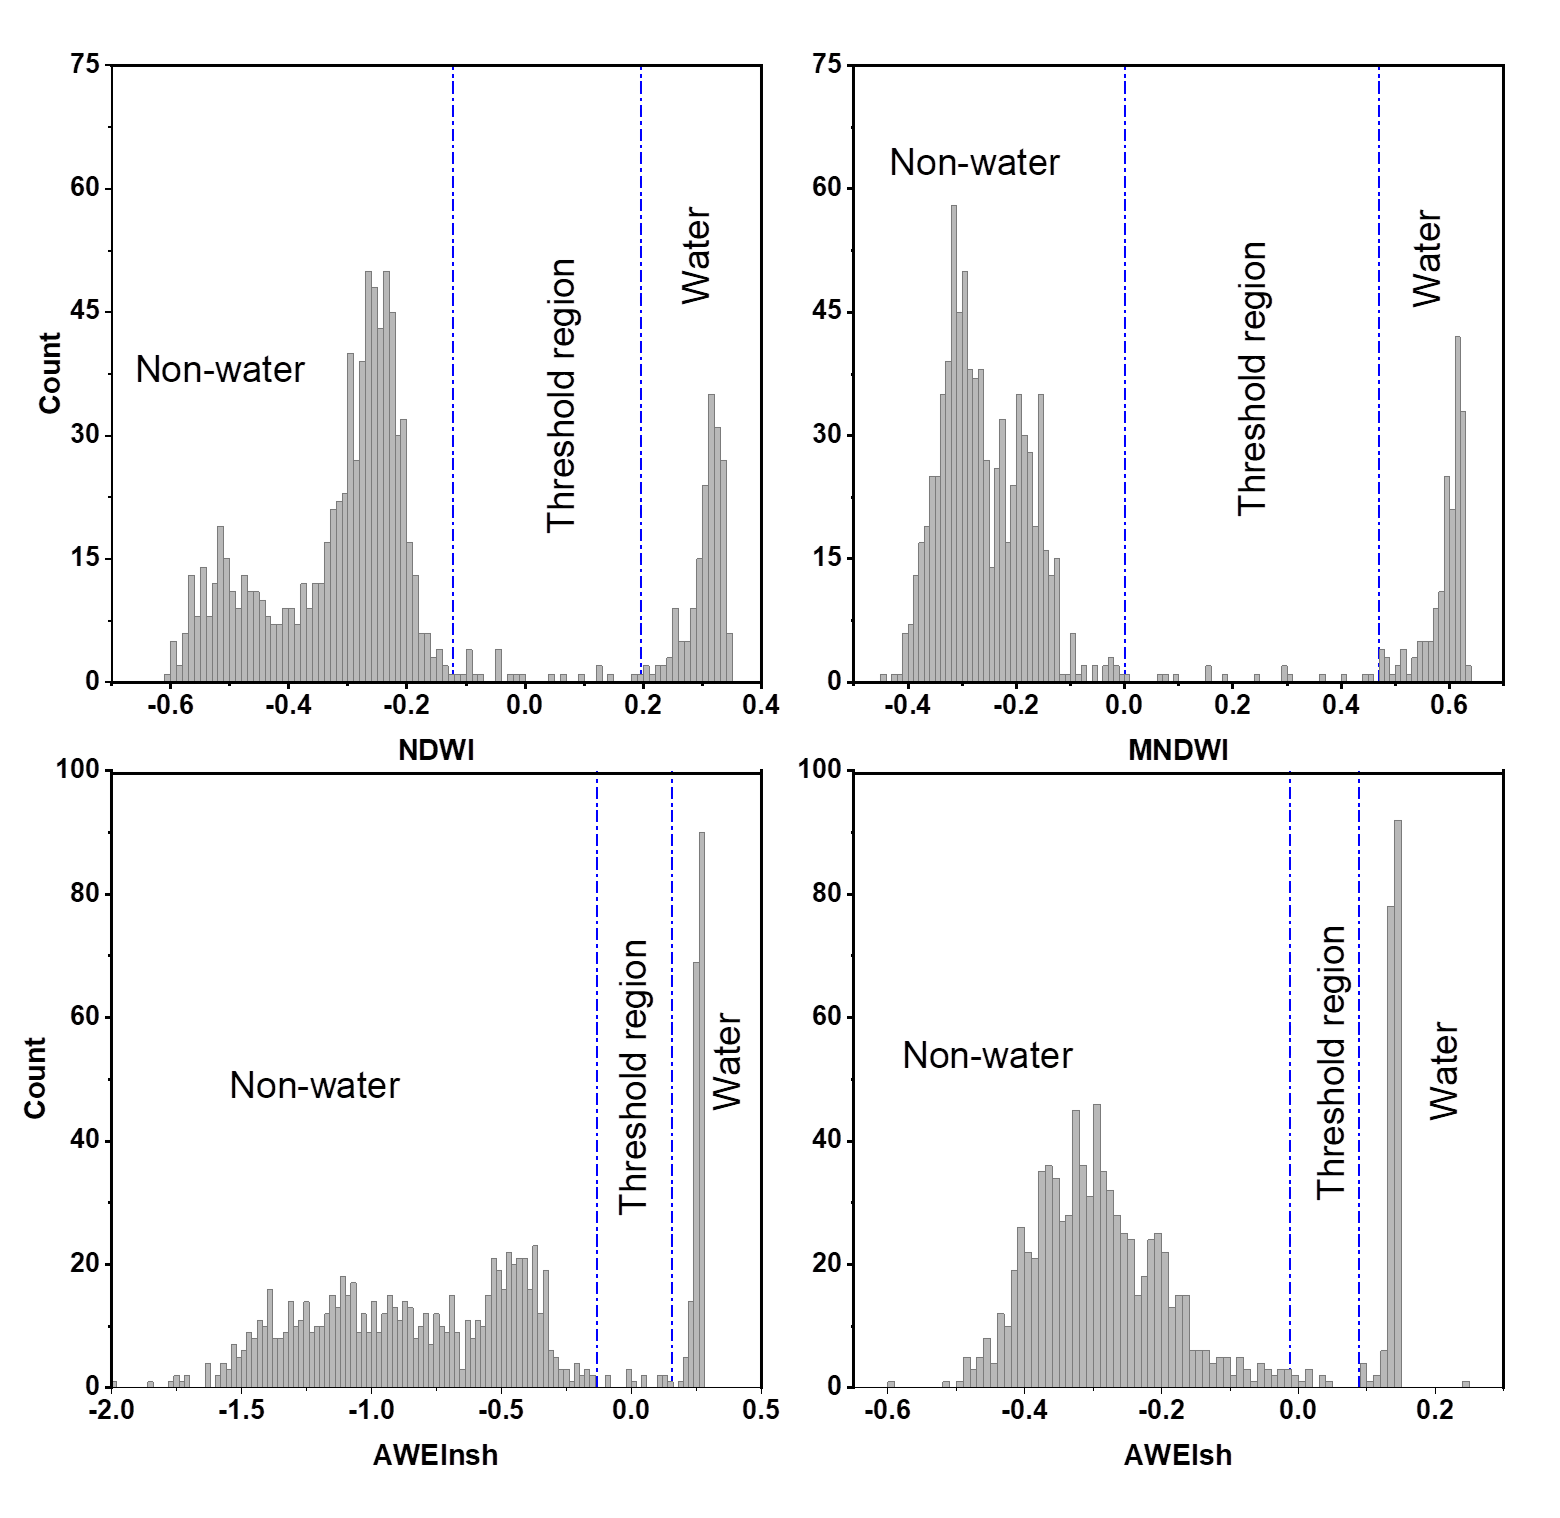
5.1Optimize Thresholds in Water Index
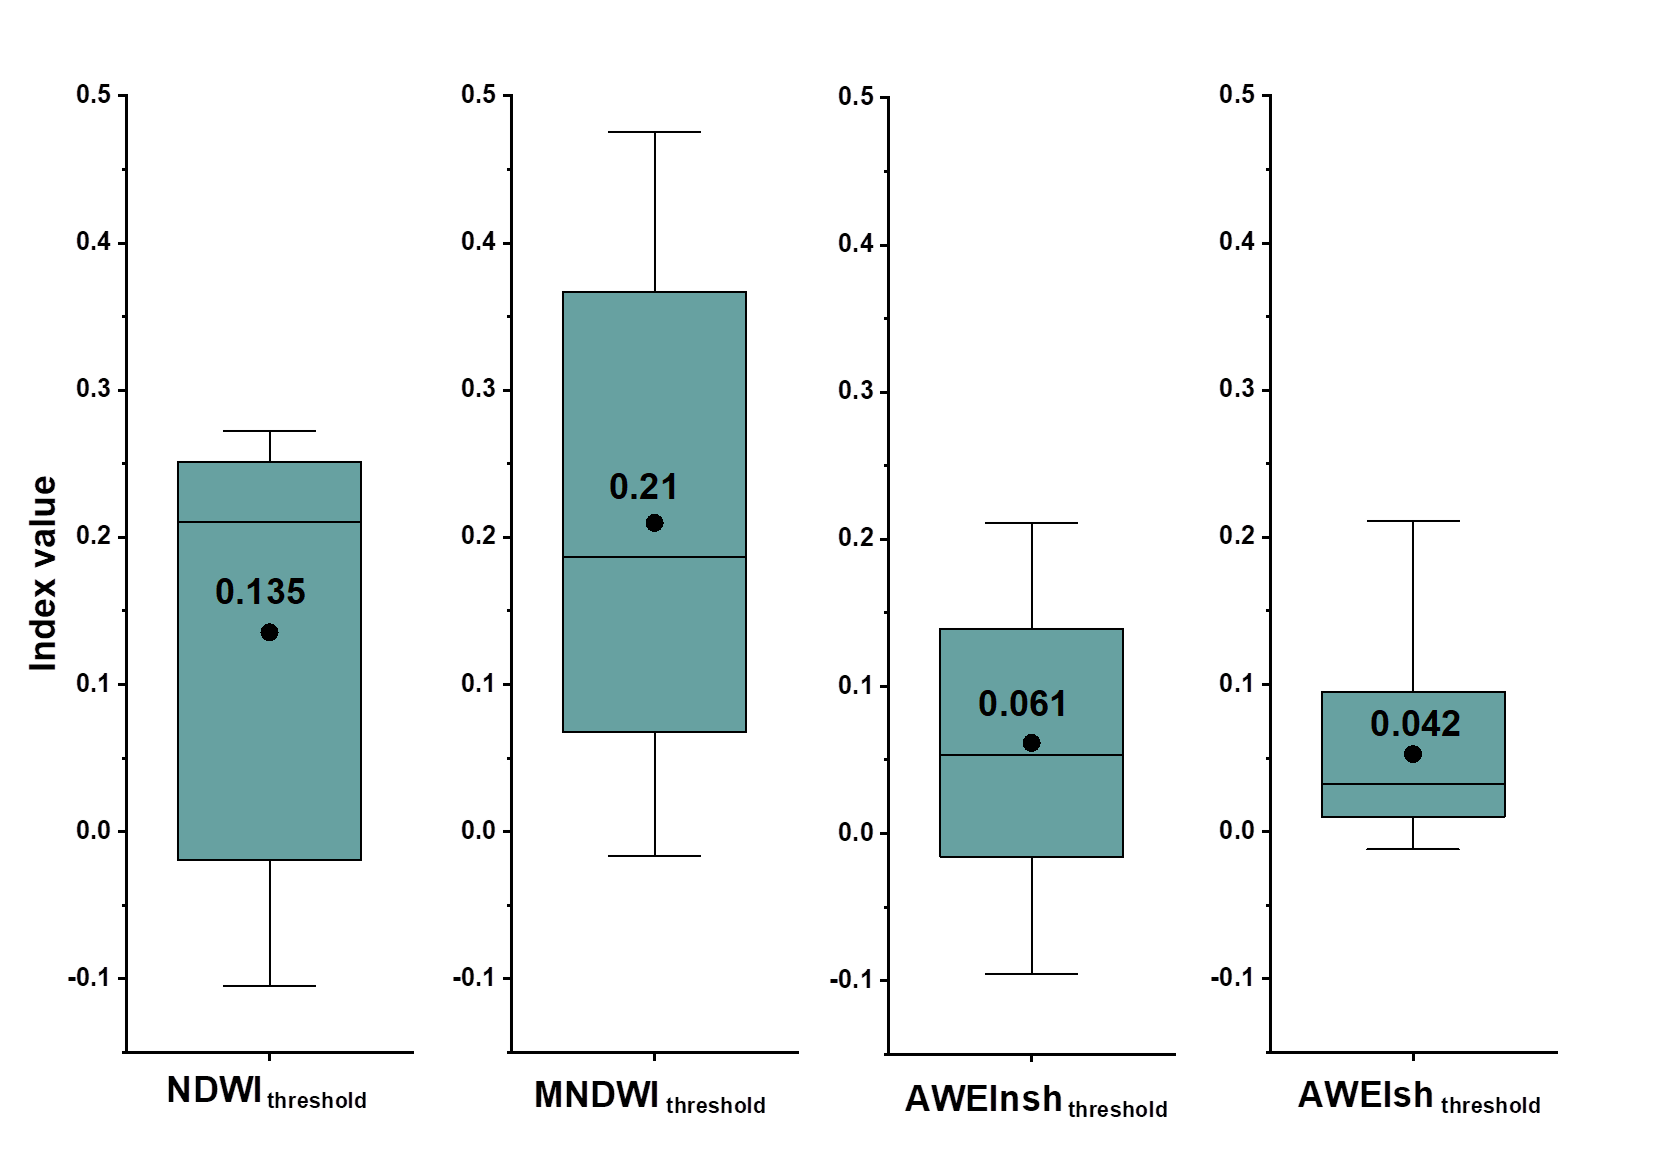
Using the generated NDWI, MNDWI, and AWEI images, non-water and water pixels were separated by the threshold segmentation method. To define and determine optimal thresholds from NDWI, MNDWI and AWEI indices, a pixel value histogram was performed by generating 1000 random points in Arc GIS (Figure 3). Based on this graph, waterless and water futures are separable according to their frequency distributions. The threshold values of NDWI, MNDWI and AWEI can be set to 0, but the threshold is not a fixed value and depends on the components of the sub-pixel land cover (Fisher et al., 2016). A threshold adjustment method is needed to achieve the correct extraction of water from the lake. Otsu’s method (Xu, 2006) proposed a dynamic method that has been successfully used to partition input raster images into homogeneous land and water assuming the threshold values range from two extreme indices. In this work, dynamic threshold adjustment was applied to determine the optimal threshold value for delimiting the water limit of the lake. The threshold distribution of the NDWI, MNDWI and AWEI raster images is given in Figure 4. The NDWI threshold spans the interquartile range from -0.08 to 0.25, with the mean being 0.135. The MNDWI threshold spans the interquartile range from 0.07 to 0.36, with a mean of 0.21. The thresholds of AWEInsh and AWEIsh extend over the interquartile range from -0.85 to 0.15, with mean values of 0.061 and 0.01 to 0.09, with mean values of 0.04.
Figure 3. Histogram plot shows a frequency distribution of pixel values on each spectral water index
Figure 4. Threshold distribution of NDWI, MNDWI, AWEInsh, and AWEIsh raster images.
5.2 Extracted Lake Water bodies
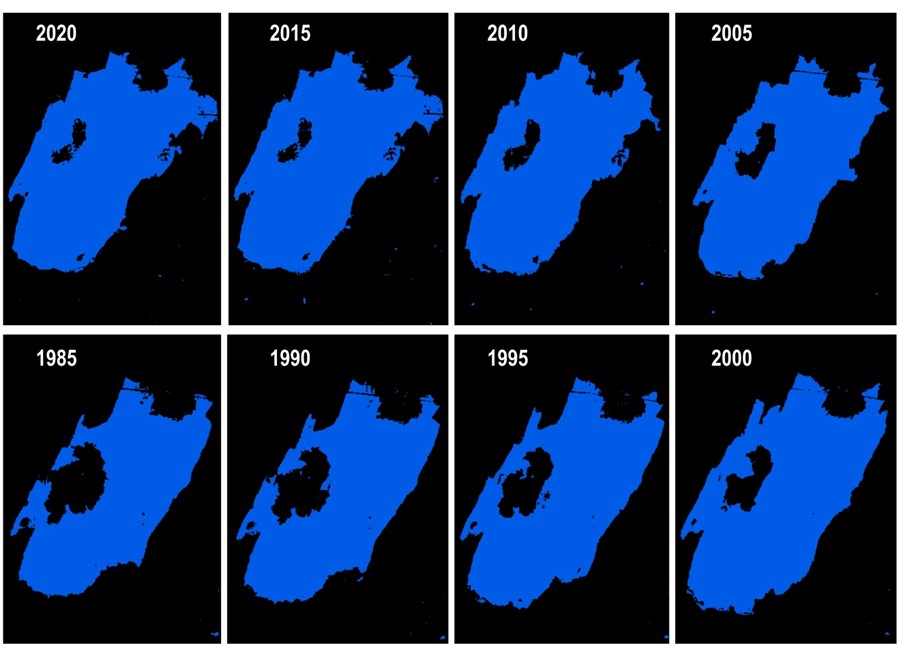
Scholars like Feyisa et al. (2014), Acharya et al. (2018) and Fisher et al. (2016) indicate that the performance of the water index can vary depending on atmospheric and soil surface conditions as well as the water type. In this work, we integrate the three water indexes to delineate the time series lake water bodies. The lake boundaries at different times were generated based on threshold values calculated by dynamic threshold adjustment. We made color slicing of all water index images based on their threshold value using ENVI 5.4 software. Slice images were then classified into two layers and vector overlay analysis was performed, to obtain precise spatial extent of lake water. Raster to vector conversion and overlay analysis were performed using Arc GIS software. Figure 5 shows the shape and water boundaries of the lake from 1985 to 2020 with a time difference of 5 years.
Figure 5. Spatiotemporal change of lake Besaka during 1985-2020.
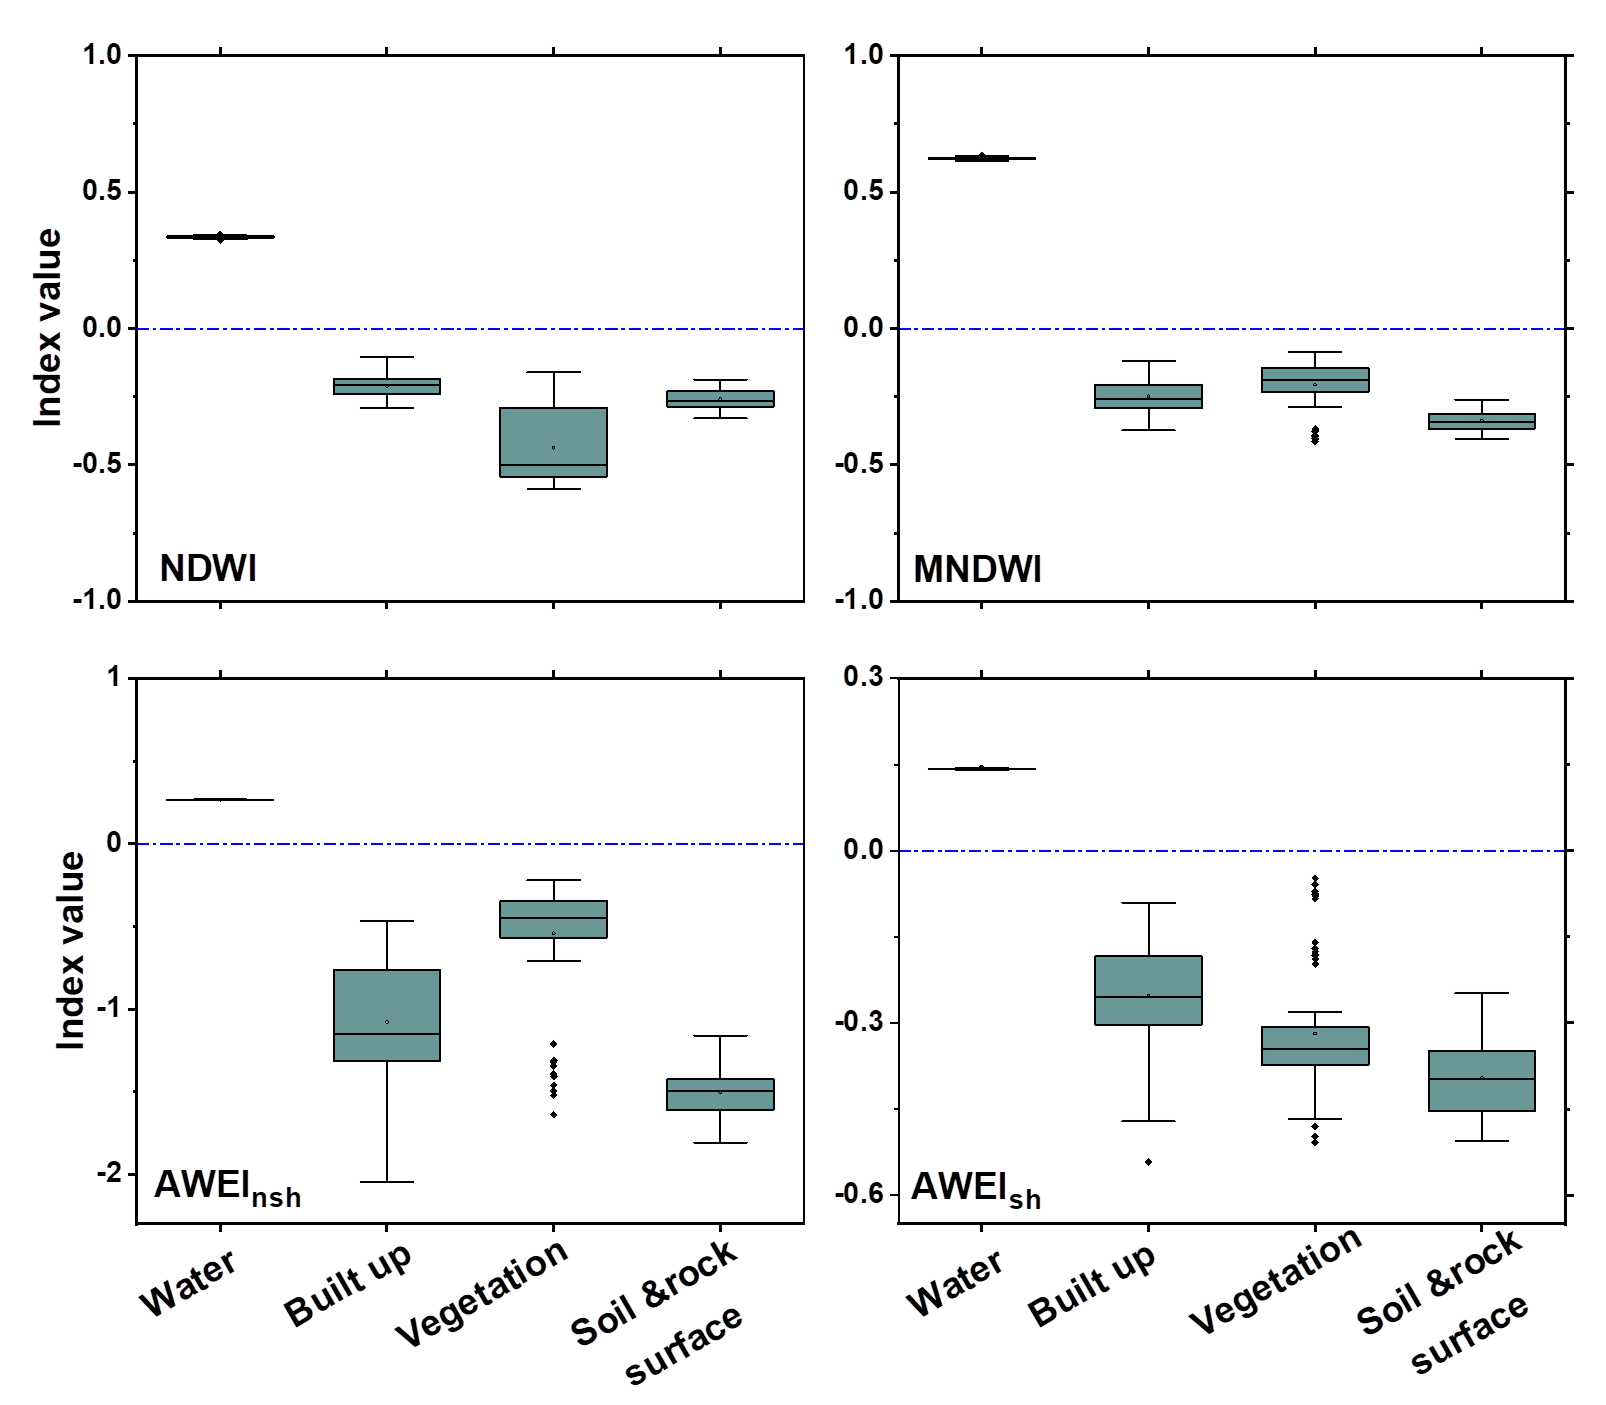
For the accuracy of the water classification, four water indices (i.e., NDWI, MNDWI, AWEInsh and AWEIsh) were also evaluated using statistical analysis. We extract 100 pure pixels from all water index products, taking into account the existing land use types around the lake area. The types of land cover used are water, building vegetation, soil and rock surface. The pixel value box plot is used to analyze the extracted pixels. Figure 6 shows the water index values showing a notable difference from the values of other land cover. Thresholds greater than zero allow rapid separation of water from the respective land covers.
Figure 6. Water index distributions of pure pixel land use land cover types from lake water.
5.3 Spatiotemporal Change of the Lake Beseka
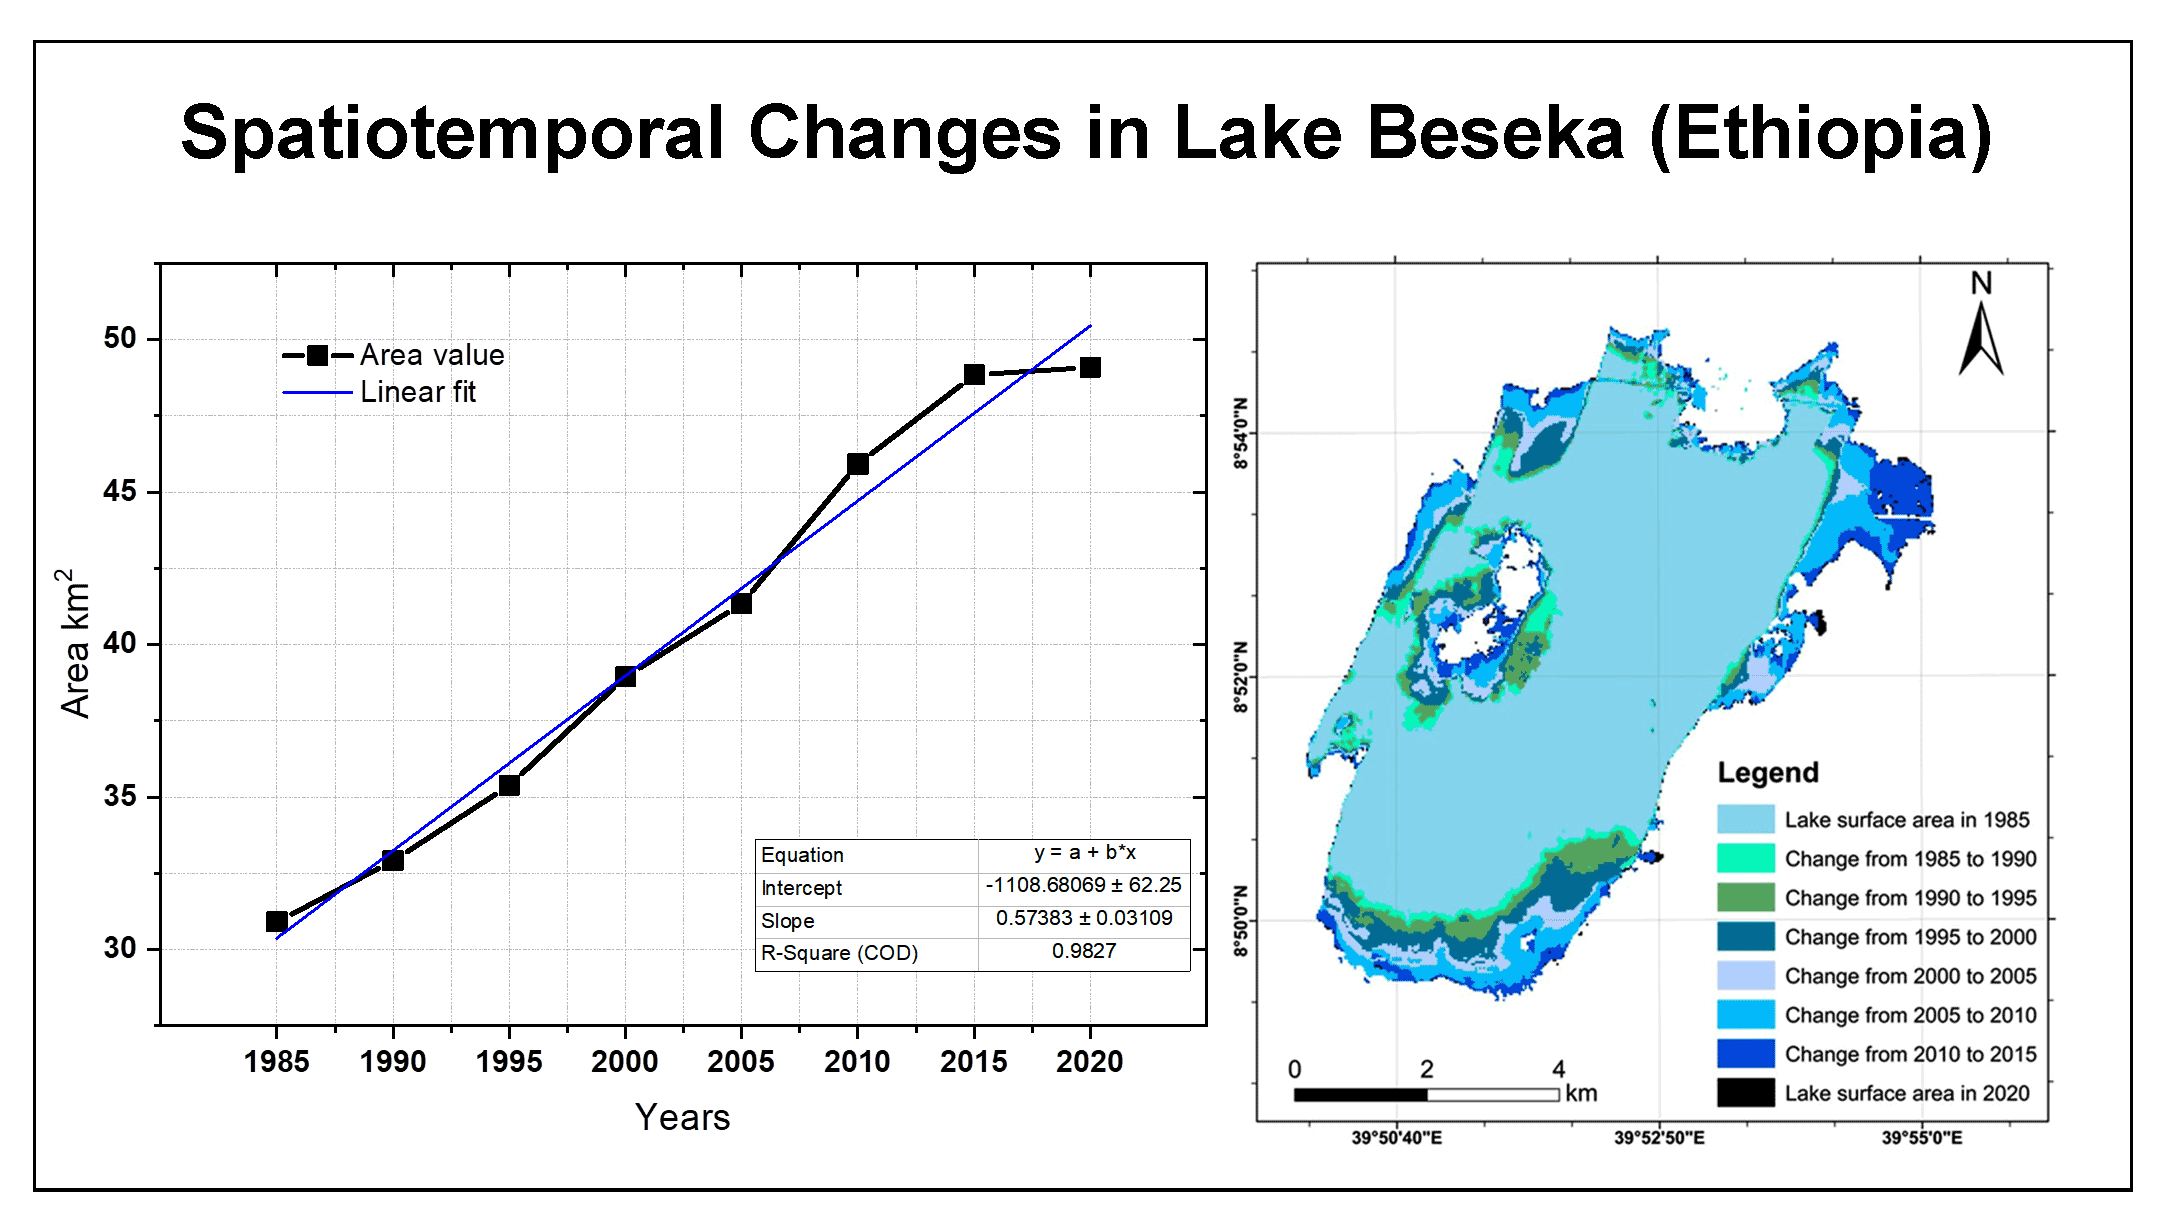
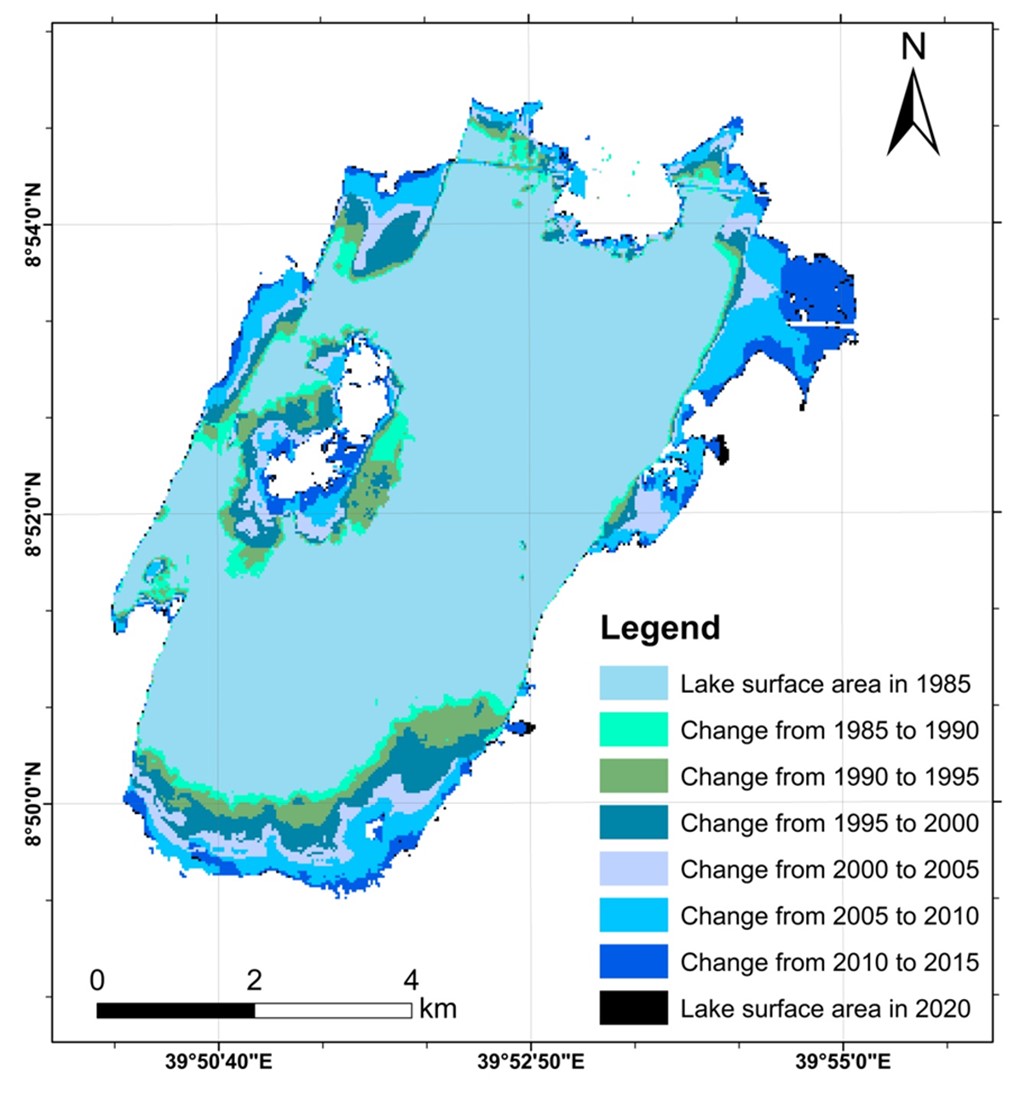
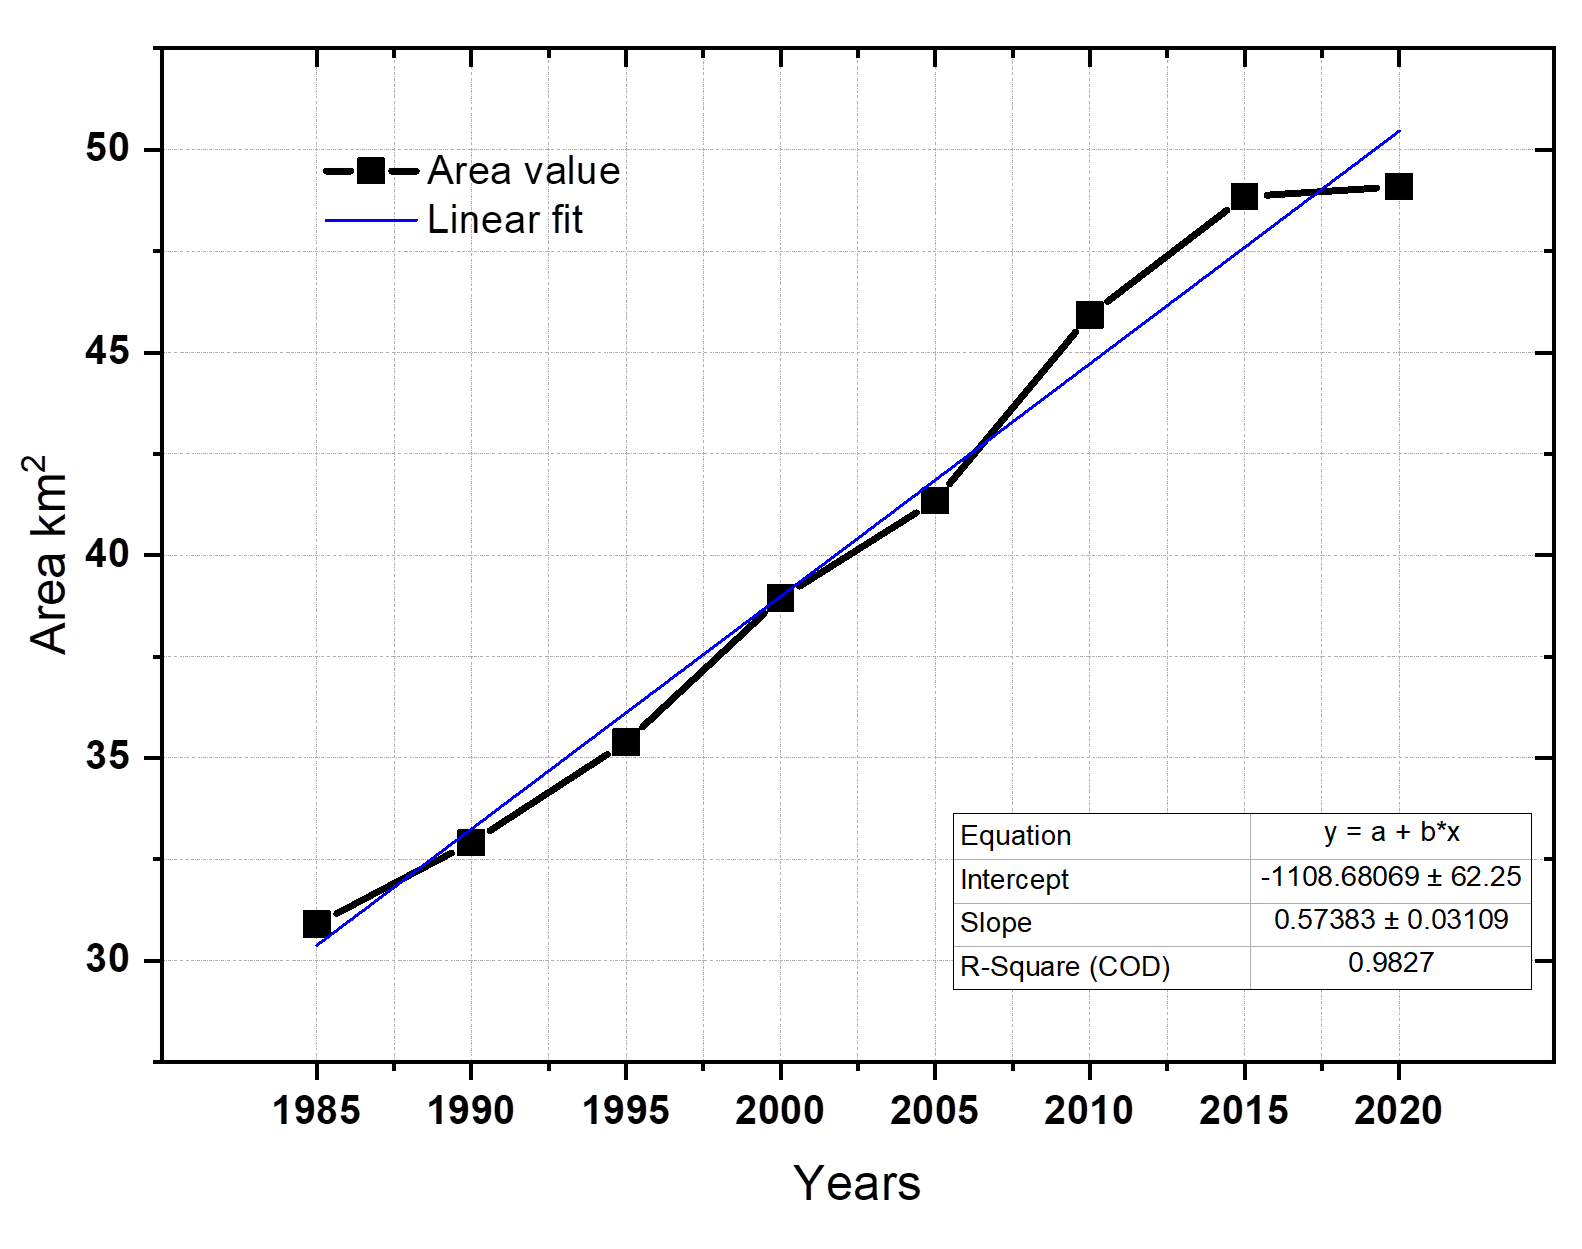
The change of lake surface area produced by Landsat time series images from 1985 to 2020 is shown in different colors in (Figure 7). Statistical results show that the area of the lake is about 30.90km2 in1985, 32.90 km2 in 1990, 35.3844 km2 in 1995, 38.94 km2 in 2000, 41.34 km2 in 2005, 45.92 km2 in 2010, 48.85 km2 in 2015 and 49.09km2 in 2020. In general, the result of the study shows that lake Beseka exhibits a remarkable and drastic expansion trend over the past 35 years. During 1985 the lake’s surface area was around 30.9 km2 and within the next 35 years the lake’s surface area increased by 18.18 km2 and in 2020 the surface area of this lake is 49.1 km2. In 1985 the area of the lake was about 30.9 km2 and in the following 35 years the area of the lake increased by 18.18 km2 and in 2020 the area of this lake is 49.1 km2. The spatial expansion of lake water mainly depends on topographical conditions of the study area. It was mainly extended south, east and northeast during the study period. The main spatial expansion was recorded (4.581 km2) in the period 2005-2010, the remaining (3.5559 km2) from 1995 to 2000. From 1985 to 1990, 1990 to 1995, 1995 to 2000, 2000 to 2005, and 2010 to 2015 the expansion of the lake surface area was within a range of (2 to 3 km2). But, the area of the lake only increased (0.2412 km2) from 2015 to 2020. Figure 9 shows the 5-year expansion of lake Beseka during the study period.
Figure 7. Lake Beseka surface area changes (1985-2020)
Statistical analysis (Figure 8) indicates that the water volume of lake Beseka has shown an overall upward trend over the past 35 years. According to linear regression analysis, the linear fit line has an R-squared value of 0.9827. Even though the year-long water bodies showed similar patterns of increasing trend during (1985-2015) but from 2015 to 2020 the lake water shows a very low surface area change. This is an unexpected phenomenon in the history of lake Beseka.
Figure 8. Surface area change trend of lake Beseka (1985-2020)
5.4 Anomaly Change Detection
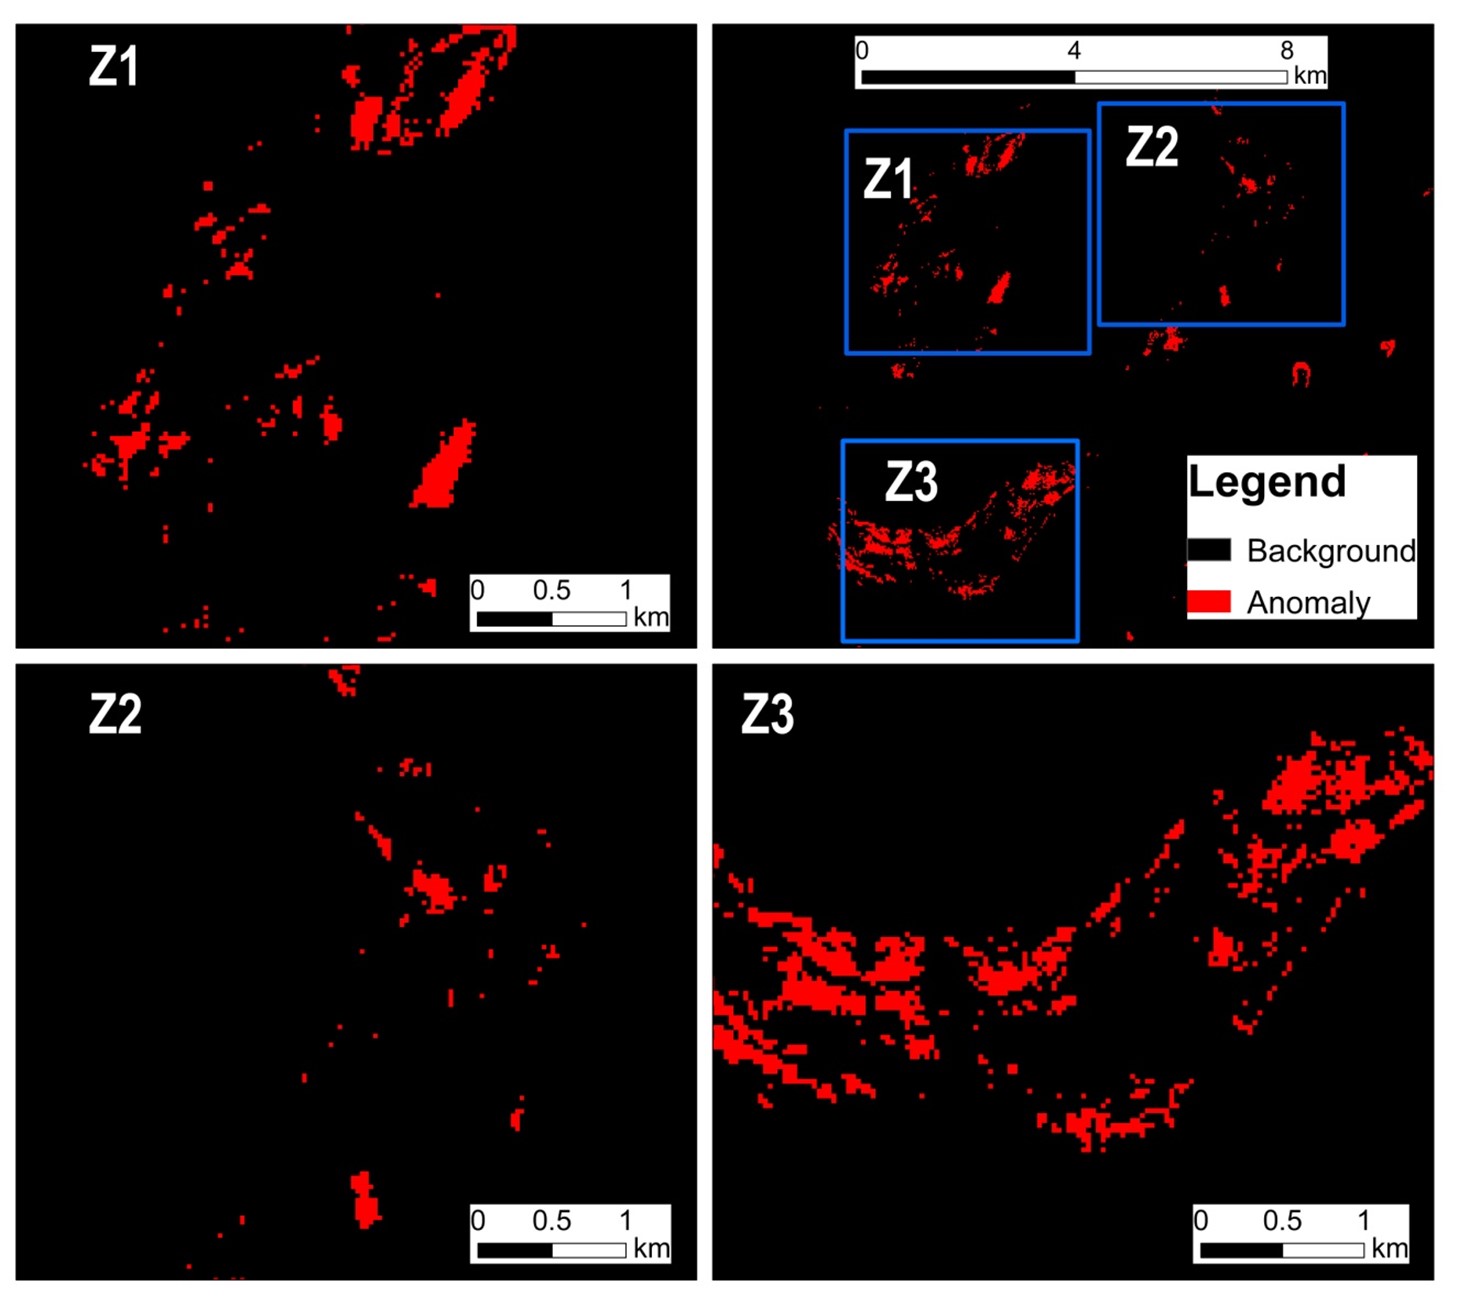
We use ENVI 5.4 image processing software to display the anomaly detection occurring in lake Beseka. We made radiometric calibration, MNDWI and MNDWI image layer stacking, to perform the change detection process. The threshold is set low enough to minimize false positives without ignoring true outliers (Reed and Yu, 1990). A threshold value of 0.05 is used to segment the image into abnormal and non-anomalous regions. The anomaly detection results (Figure 9), show that more anomalies occur to the south, northeast around the city of Metehara, and to the northwest around part of the lake is land. The anomaly is mainly related to the expansion of the lake. The anomaly change detection result was compared with surface area change detection and the result revealed that anomaly regions confirm the surface area change of the lake.
Figure 9. Anomaly change detection maps.
6 . DISCUSSION
Several authors studied lake Beseka in the main Ethiopian rift valley (Ayenew, 2004; Alemayehu et al., 2006; Klemperer and Cash, 2007; Goerner et al., 2009; Senbete, 2008; Hirpo, 2013, Belete et al., 2016; Belay et al., 2019; Dinka, 2012, 2017, 2020; Umer et al., 2020). Most of the research papers mentioned that the surface area of lake Beseka increase drastically and expands dramatically in the past four-five decades. Also, the authors were studied the possible cause and effect of the lake surface area expansion on the nearby society and the natural environment. Doing so, Ayenew (2004), Goerner et al. (2009), Belete et al. (2016), and Dinka, (2012), (2017) stated that the potential causes of the lake Beseka growth could be groundwater inflows, the nearby Metehara sugar plantation irrigation scheme, inundated hot springs, surface runoff, inflows from Awash River and tectonic activities. Studies by Dinka (2017) have shown that the lake basin has no well-known surface outlet. Most of the surface runoff flows into the lake water and this will be one of the causes of the lake’s surface change. Because the topography of the surrounding lake has a lower elevation, even a small rise from the lake can cover a large area. Observations indicate that the severity of the flooding problem in the region is a cause of the increase in lake Beseka (Alemayehu et al., 2006; Dinka, 2017). Groundwater flooding or saline intrusion are also problems that may arise due to the expansion of lake Beseka. The benefits gained from the lake are very insignificant compared to the harmful effects it creates (Dinka, 2017). Therefore, monitoring of the lake surface area change using multi-temporal satellite images was a very important and indispensable activity. The present research aims to assess the spatiotemporal changes in lake Beseka using timeseries Landsat TM, ETM+, and OLI images from 1985-2020. Different spectral water index methods were applied to extract the extent of lake water. The performance of a water index could vary as a function of atmospheric condition, land surface situation, and water type (Feyisa et al., 2014; Fisher et al., 2016; Acharya et al., 2018). In this study, four water indices such as NDWI, MNDWI, and AWEInsh, and AWEIsh were used. For the assessment of classification accuracy pure pixel of the lake water was evaluated from the corresponding land use land cover and the outcome shows that the water body has a clear and distinct difference from other land covers. The results of our study reveal that significant changes were occurred on the lake Beseka surface area during the study period, especially from 1985-2015. However, the lake Beseka surface area changes from 2015-2020 was 0.2412km2, which is insignificant compared to the past condition. We found that lake Beseka is not expanding at the rate of its history.
7 . CONCLUSION
This study focused on the spatiotemporal change detection of lake Beseka from 1985 to 2020. We integrate four water indexes to delineate the time series lake water bodies such as NDWI, MNDWI, AWEInsh and AWEIsh. The lake boundaries at different times were generated based on the threshold values calculated by dynamic threshold adjustment. On the other hand, the result of a change detection map was evaluated by performing an anomaly change detection workflow, which was done to show areas the spatial distribution of anomaly changes occurrence. In general, this study shows that lake Beseka exhibits a remarkable and drastic expansion trend over the past 35 years. During 1985 the lake surface area was around 30.9km2 and within the next 35 years the lake surface area increased by 18.18km2 and in 2020 the surface area of this lake is 49.1 km2. Although this study revealed that significant changes occurred during the study period from 1985 to 2015 covering almost 18 square kilometers. But lake Beseka experienced a surface change of 0.2412 square kilometers between 2015 and 2020. This shows that lake Beseka has a decreasing tendency to expand over its history. In a conclusion since the topography of the surrounding lake is lower in elevation, even a small increase in the lake can cover a large area and this will cause some impact on the surroundings. Therefore, monitoring the lake surface area change using multi-temporal satellite imagery is very necessary and crucial. This approach will bring advantages in surface water feature mapping and flood risk monitoring research.
Tables
Figures
Conflict of Interest
The authors declare no conflict of interest.
Acknowledgements
We would like to thank the USGS for providing the remote sensing data and the Department of Geology, Debre Berhan University for giving necessary facilities to this research. We also thank to the insightful editor and reviewer comment for the improvement of these paper.
Abbreviations
AWEI: Automated Water Extraction Index; ETM+: Enhanced Thematic Mapper Plus; MERV: Main Ethiopian rift valley; MNDWI: Modified Normalized Difference Water Index; NDWI: Normalized Differential Water Index; OLI: Operational Land Imagery; RXD: Reed-Xiaoli Detector; TM: Thematic Mapper; USGS: United State Geological Survey.
Hailu, B. T. and Girma, S., 2019. Spatiotemporal lake level change of Lake Abijata, Ethiopia: A remote sensing approach. Environmental Analysis and Ecology Studies, 6(1).
Li, J. G., Huang, S. F. and Li, J. R., 2010. Research on extraction of water body from ENVISAT ASAR images: A modified Otsu threshold method. Journal of Natural Disasters, 19(3):139-145.
Olaka, L. A., Odada, E. O., Trauth, M. H. and Olago, D. O., 2010. The sensitivity of East African rift lakes to climate fluctuations. Journal of Paleolimnology, 44, 629-644.
Senbete, G., 2008. Participatory evaluation of Gillnet and long line on Lake Beseka, Ethiopia. Proceeding of Ethiopian Society of Animal Production, Addis Ababa, Ethiopia.
Sisay, A., 2016. Remote sensing based water surface extraction and change detection in the Central Rift valley region of Ethiopia. American Journal of Geographic Information System, 5(2), 33-39.


 ,
Murugesan Bagyaraj 2
,
Murugesan Bagyaraj 2