Tourism Potential Zone is mapped using a 5 Step integrated AHP method.
This research has selected eight parameters, which are the Tourist Intensity Measure (TIM), Climate (C), Physical (P), Social (S), Economy (E), Environmental Quality (EQ), Amenities (AN), and Diversity in Local Art and Crafts (LAC′).
Approximately, 23.33% area is identified with a high tourism potentiality, 58.74% area is observed under the moderate tourism potentiality, and 17.92% area is recognized as a low tourism potentiality.
Efficiency testing of the tourism potentiality map indicates high precision utilizing the considerably high R-square value (0.94).
Abstract
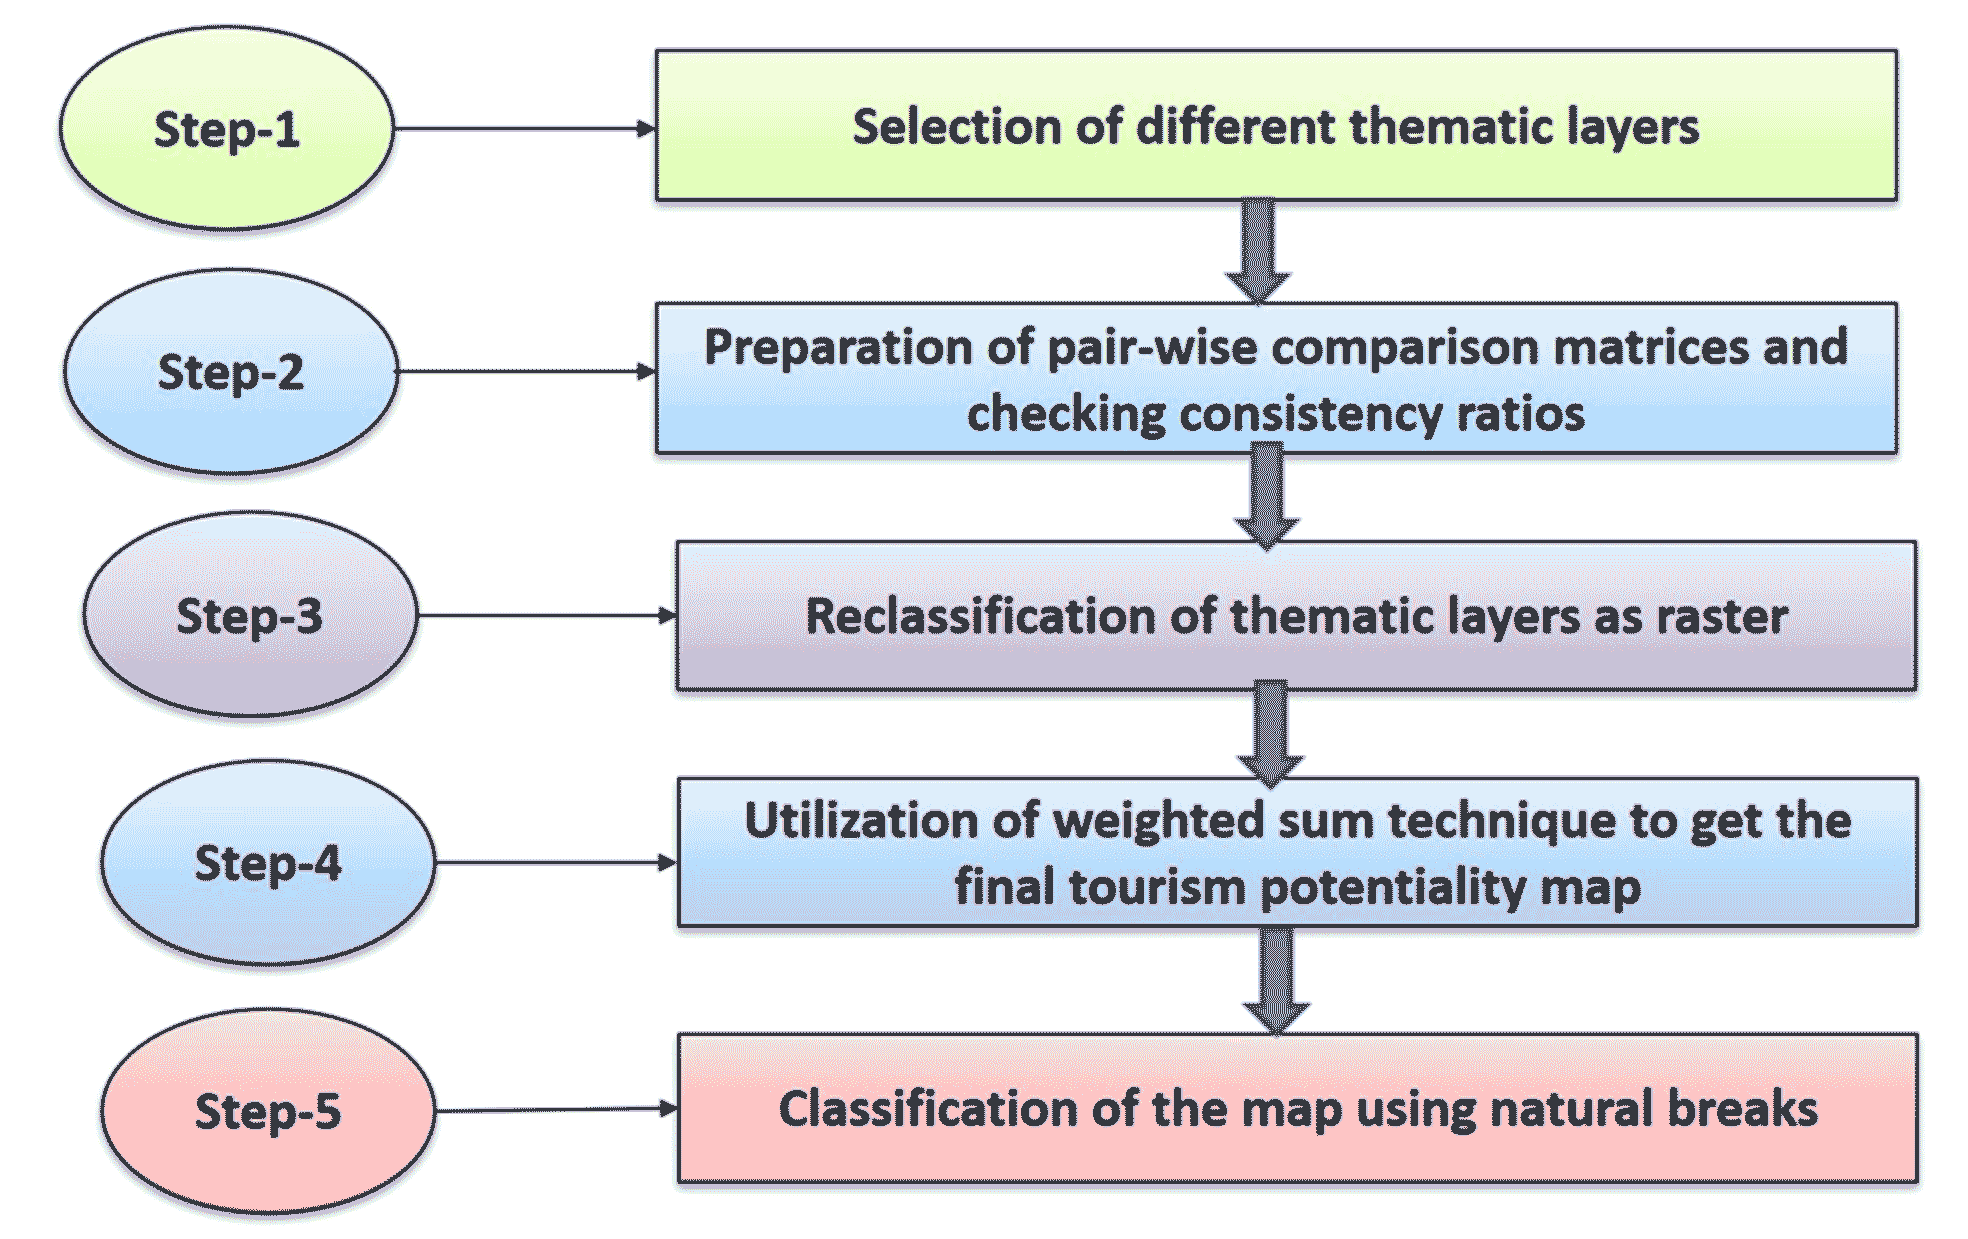
Tourism is a multidimensional sector having significant contributions to sustainable development, economic upliftment, and social benefits. Although the Bankura is full of tourism potential, but its’ tourism potentiality has not been properly used. This study is designed to identify the tourism potential zones of the Bankura district using a 5-steps integrated methodology, which includes the preparation of the thematic layers (Eight parameters and thirty-four indicators) (Step-1); creation of matrices for pair-wise comparisons (Step-2); classification of the raster maps (Step-3); use of the weighted sum method to get the composite variables (Step-4) and classification of tourism potential map using the natural breaks (Step-5). This study has selected eight parameters, which are the Tourist Intensity Measure (TIM), Climate (C), Physical (P), Social (S), Economy (E), Environmental Quality (EQ), Amenities (AN), and Diversity in Local Art and Crafts (LAC′). Approximately, 23.33% area is identified with a high tourism potentiality, 58.74% area is observed under the moderate tourism potentiality, and 17.92% area is recognized as a low tourism potentiality. Efficiency testing of the tourism potentiality map indicates high precision utilizing the considerably high R-square value (0.94). The study uses an exceptional methodological framework applicable in any region.
Keywords
Analytic Hierarchy Process , AHP , Sustainability Indicators , Tourism Potentiality Zones , TPZ , Weighted overlay analysis
1 . INTRODUCTION
Tourism has flourished from the principle of sustainable development (Sahani, 2019; Elena and Thomas, 2018), where it must be economically viable, environmentally sensitive, and culturally appropriate. Tourism potentiality is the capacity of a location to draw visitors who are interested in resource assessment and accessibility (Rahmat et al., 2020; Trukhachev, 2015). According to Bassey (2015), the pool of resources that can be converted into tourist attractions is known as tourism potential. The acute necessity to protect the destination’s soul motivates the theory of tourism potentiality (Cai et al., 2020). It encourages tourists’ awareness, which helps to maintain the environmental physicochemical quality (Torres-Bejarano et al., 2018). As a result, for the integrated development of life and nations, an analysis of tourism potentiality is strongly suggested (Al-Mamun and Mitra, 2012). Several academicians have identified the tourist potential zone in space using a variety of factors. Aynalem et al. (2015), for example, use scenic beauty and biodiversity metrics to promote tourism in Bale, Ethiopia. Bioenvironmental and economic aspects are used by Shadloo and Hanachi (2016) to identify Abardah’s tourism potential zone. To identify potential ecotourism places in Kullu District, Himachal Pradesh, Sahani (2019) considers thirteen indicators. Fu et al. (2020) and An and Alarcón (2021) and several other researchers use market-related factors to identify the tourism potentiality in different parts of the world. However, using both physical and socioeconomic characteristics to identify tourism potentiality in GIS platforms is uncommon.
Several parameters and indicators are instruments for assessing a destination’s tourism potentials, nevertheless, broad indicators by themselves cannot give crucial details about a potential tourism zone. Instead, a number of useful operational elements are equally important when assessing tourism potential effectively (Brilha, 2016). Furthermore, regional facilities, services, and infrastructures must be integrated in such views (Lun et al., 2016).
There are no universally accepted definitions for the concept of tourism and its’ potentiality (Asfairsh and Kumar, 2019). Tourism as a whole must be doable, and formulation of the correct and efficient indicators is necessary (Dimoska and Petrevska, 2012). All the segments must be sustainable or, in real terms, integrated to work within a single cooperated approach (Cernat and Gourdon, 2012). First of all, the tourism is very dynamic, unstable, and unpredictable. It is an industry that predominantly lays its’ basis on a very fragile environment or culturally sensitive areas (Raha et al., 2021). Secondly, the tourism (with sustainability) as a concept becomes popular within a conventional, inadequate framework. Thirdly, the practical usability of the concept of the tourism potentiality can be enhanced with GIS technology, which is still neglected in several issues and paradigms (Shaker, 2018).
As a matter of fact, only a few researchers concentrated on tourism potential zone mapping but they have not considered multiple and appropriate parameters in several cases (Raha et al., 2021). As for example the work of Sahani (2019) only considered thirteen physical parameters (i.e. slope, topographic roughness, vegetation, surface water accessibility, elevation, protected area, climate, visibility, road proximity, village proximity, soil, groundwater and geology) in the tourism potentiality zone identification. Hoang et al. (2018) considered only tourist’s intensity to delineate tourism potentiality zones. The indicators considered in this research allow us to identify tourism potentiality zone of Bankura district. The destination region may be versatile and heterogeneous in character. Taking the above issues into account and following other studies (Paracchini et al., 2011), this research divides the parameters into eight dimensions: Tourism Intensity Measure (TIM), Social (S), Economy (E), Physical (P), Climate (C), Environmental Quality (EQ), Amenities (AN) and Local Art and Crafts (LAC). The baseline issues of each dimension are selected from the reference of the guidebook of WTO (World Tourism Organization, 2004). In the case of Tourism Intensity Measure (TIM), the overall system indicates the pressure of tourists on the local level planning and management (Mariano, 2017). Further, it is directly related with the economic benefits at the local level. In the case of social dimension, tourism sustainability issues should allow managers to evaluate the social benefits of tourist activity through the public services available to the tourist (Kisi, 2019). That social benefit inherently depends on the social structure of the destination region. Therefore, the literacy rate, sex ratio, population density, population growth rate, volume of migration and social carrying capacity are included within this dimension. Economic indicators are directly related with the economic structure of the destination region and also it directly relates with the revenue earning. Keeping the above view in mind, percentage share of net domestic product (2012-13) from hotel and restaurant sector at constant prices 2004-05, main worker, marginal worker and total worker are considered under the economy. Environmental quality is another very important factor to be dealt with. A tourist spot becomes less attracted if it is polluted (Raha and Gayen, 2022). Thus, tourism potentiality seems low. Local art and culture of the tourist spot (Egresi and Kara, 2014) directly relates with the potentiality of tourist spot. If a tourist spot is culturally diverse it can attract more tourist and vice-versa.
The Planning Commission of India has declared tourism as the second largest sector of the country as the tourism can provide employment opportunities for low skilled and semi-skilled workers (John and Chelat, 2013). Domestic tourism contributes almost 75% of country’s tourism economy. Statistics show a sharp increase in the tourist inflow in several destinations in India from 2010-2017. India possesses a large variety of historical and nature-based tourist spots but this sector lacks adequate tourist infrastructure, improper identification and promotion of tourist destinations and coordination of different levels. The prima facie should be to identify the potential tourist spot, which is still neglected in many countries including India. In the West Bengal also beyond Kolkata there are many tourism potential spots. According to Roy and Mondal (2020), every district and block level assessment of tourism potentiality is very much essential. Chatterjee (2020) pointed out that Bankura’s tourism potentiality cannot be utilized if tourism potentiality zone is not demarcated properly (Chatterjee, 2020). We observe that although in 2014-15 visitors’ response of Bankura were collected through Government’s initiative but they typically failed to identify the actual demarcation of tourism potential zones in this area. Not only that the findings ignored several other physical, social, economic and climatic factors. In this scenario delineation of tourism potential zones in Bankura district is a very decent endeavor.
Tourism potentiality zone identification based on Multi-Criteria Decision Making Process (MCDM) and GIS becoming an important aspect now a day. Analytic Hierarchy Process (AHP) technique is such a MCDM tool where objective weightage can be properly utilized to determine the tourism potentiality zone. Over all MCDM techniques, the AHP gains worldwide attention for its’ quick judgmental ability and simple calculation (Velasquez and Hester, 2013; Akcan and Güldeş, 2019). AHP was developed by Saaty (1980) in the immediate reaction of MAVT and MAUT (Lee et al., 2012). AHP prioritizes every parameter by the use of weightage. AHP also determines the consistency measures at every step which illustrates the authenticity of the calculation (Lai, 1995; Li and Sun, 2008). Several scientists from different background now a day recommend using AHP technique over all procedures (Konidari and Mavrakis, 2007). Okeola and Sule (2012) used AHP to study the urban water supply systems in Nigeria. Ambraisaite et al. (2011) used AHP to determine the transport infrastructure risk analysis. The methodological justification of this research can be found in the fact that this research does not utilize composite in built measurement to identify tourism potentiality zones. Rather the study identifies several factors which have a major effect on tourism in the study area. Thus, the objective of this research is to use the effective and appropriate indicator system with GIS and AHP technique to determine the tourism potentiality zone estimation. The composite weightage or priority is determined using the AHP technique. Weighted overlay procedure is applied to determine tourism potentiality zone of the study region. The probable ranking of every sub-variables and main variables is making the research more interesting and unique.
Indian national parks, sanctuaries, marshes, and other natural and cultural settings that are endowed with a distinctive biodiversity -which has grown by up to 6% in the past ten years- are the only places where tourists are attracted (Chaudhary et al., 2022; Puri et al., 2019). Bankura is also known for its religious diversity and cultural diversity, stretching back to the ancient history (Raha and Gayen, 2022). Nevertheless, despite its abundant natural resources, the current tourism business model does not adequately balance indicators relating to the Tourism Intensity Measure (TIM), Climate (C), Physical (P), Social (S), Economy (E), and Amenities. The absence of tourism potential zones of the Bankura hampers the comprehensive utilization of tourist resources. Identification of the tourism potential zone is therefore crucial in this section, although there are very few efforts by the government and non-governmental organizations (NGOs) to protect it. The goal of the study is to demonstrate the Bankura district’s tourism potential zone considering the aforementioned factors. The article is structured as follows:
The description of the study area is illustrated in the second part.
The databases and methodological portion are illustrated in the third section. It stands for the 5-step method applied to this study.
The fourth section summarizes the findings, discusses their implications and shortcomings, and offers recommendations for further research on the potential of tourism.
The conclusion is addressed in the last section.
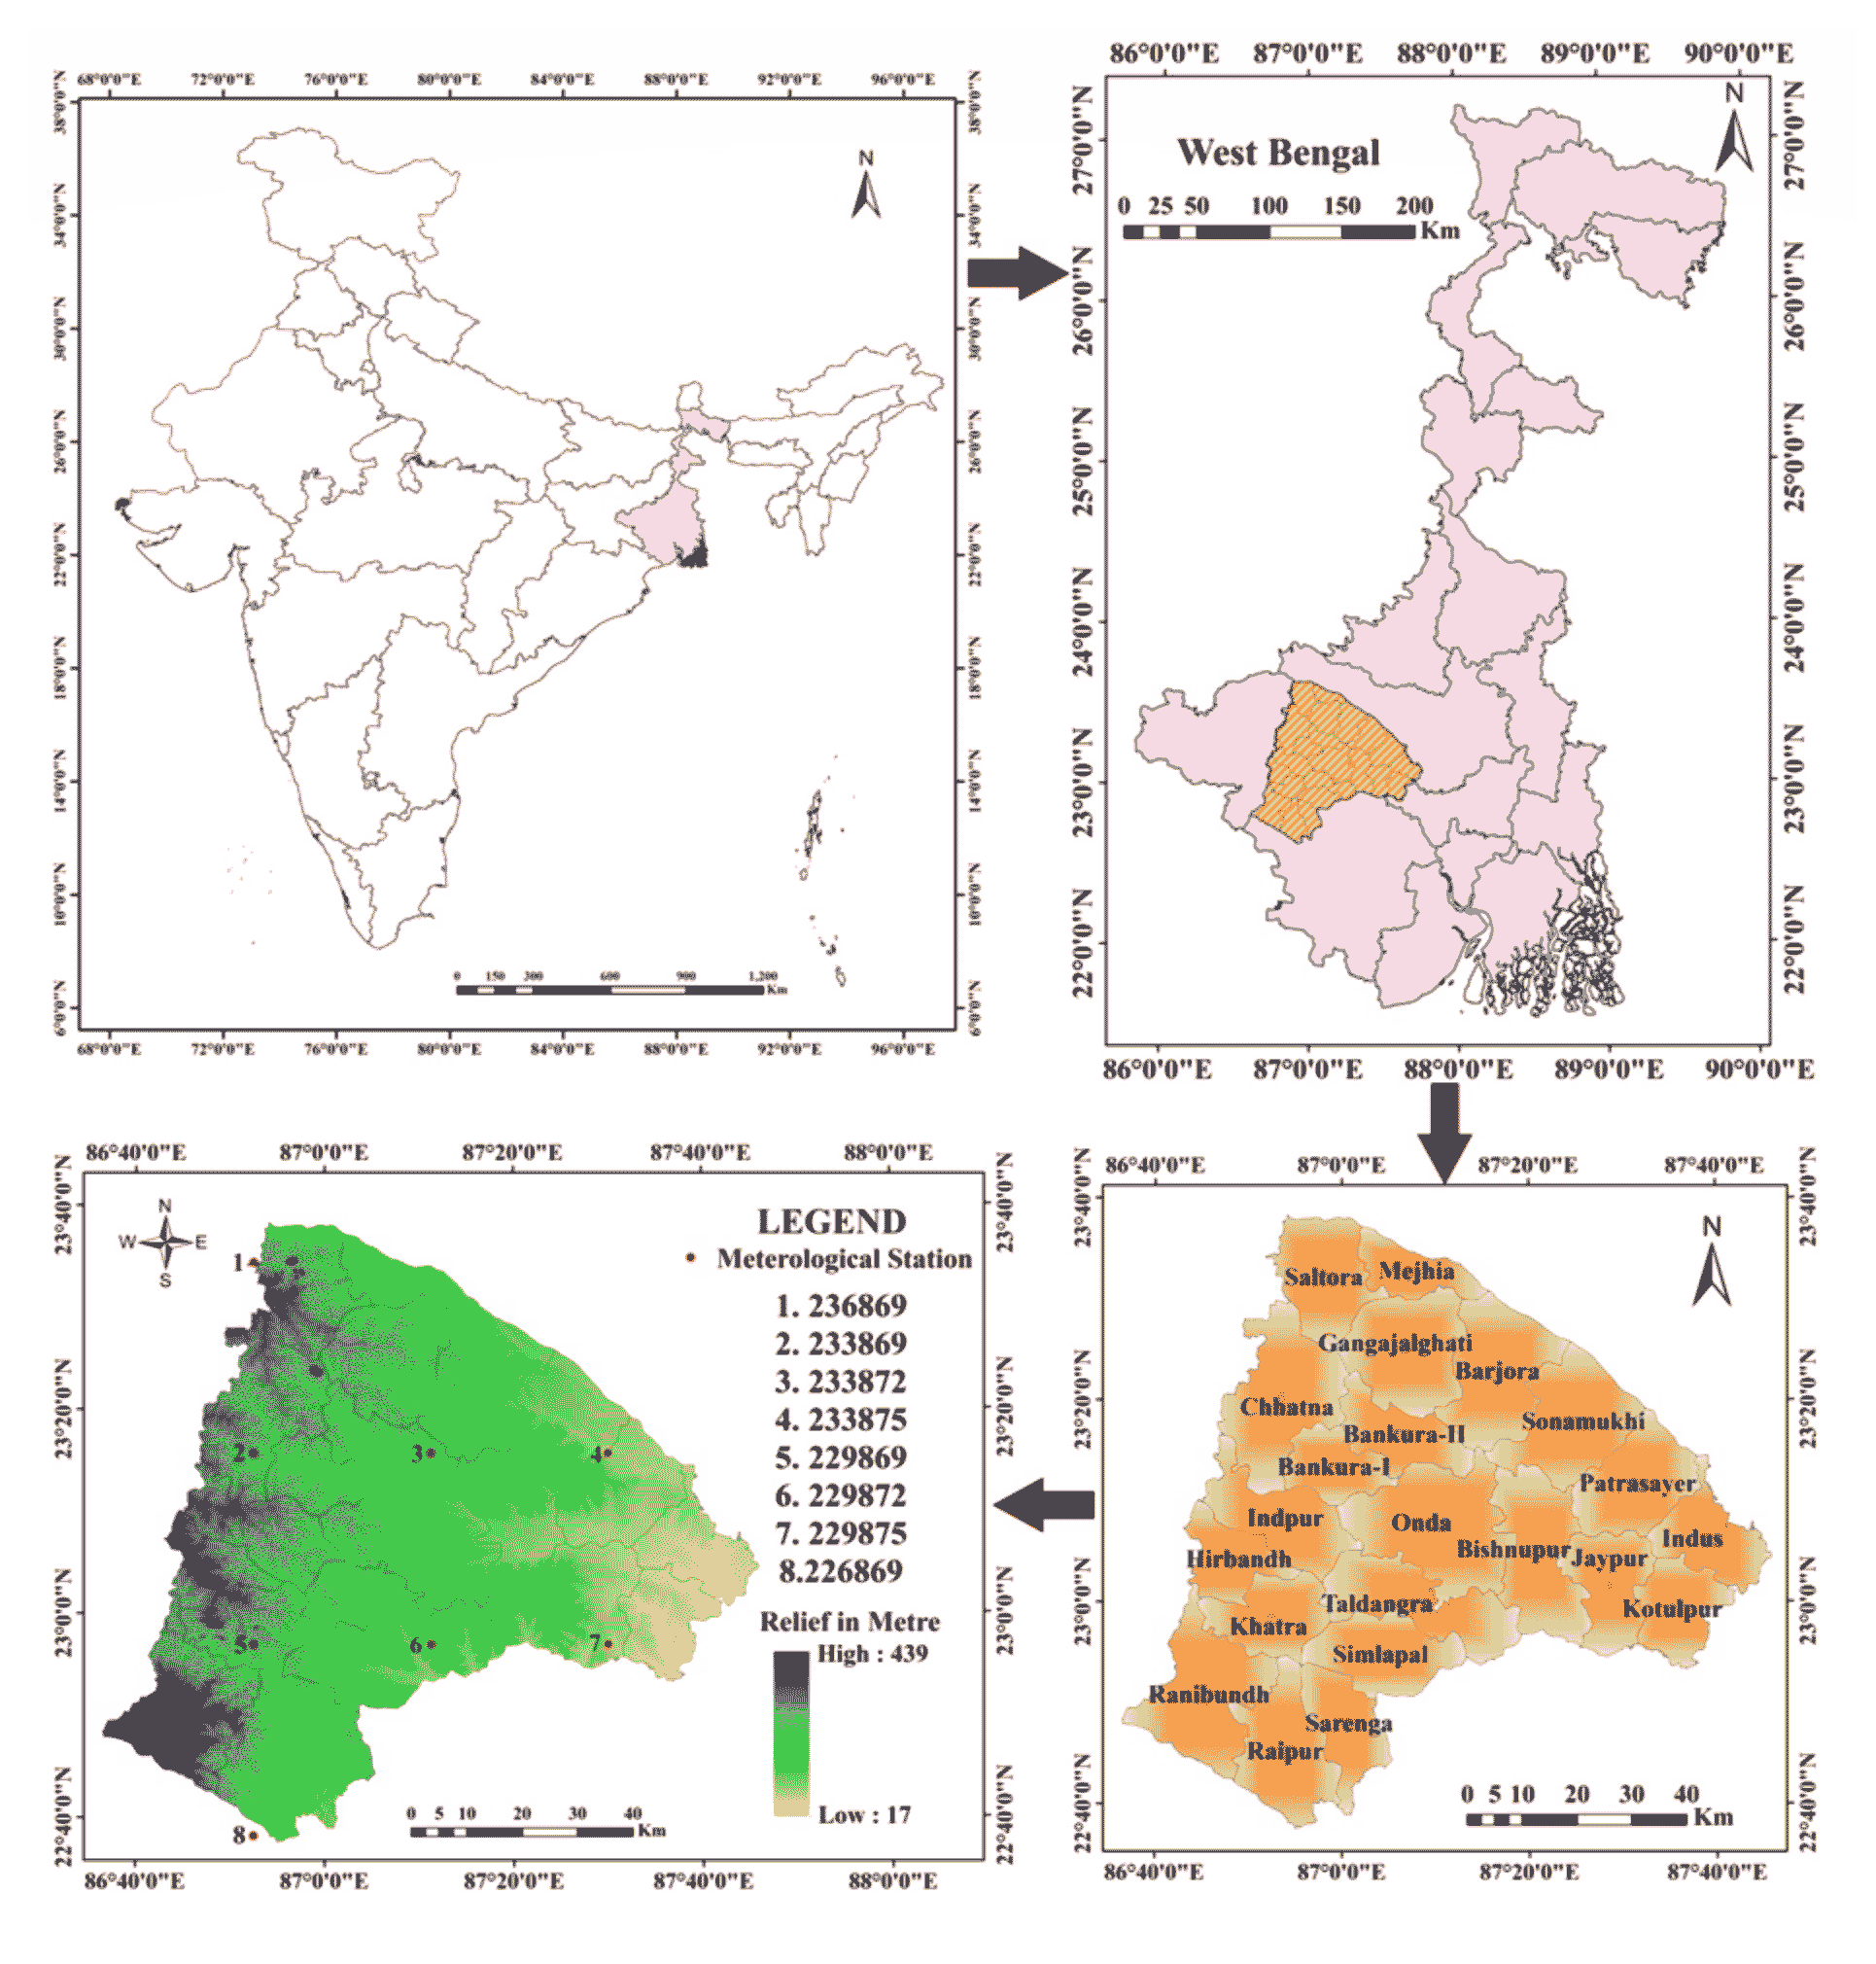
2 . STUDY AREA
Bankura is surrounded by Purba Bardhaman district and Paschim Bardhaman district in the north, Purulia district in the west, Jhargram and Paschim Medinipur district in the south and some part of Hugli district in the east. Although the region receives about 1600mm rainfall but almost all rainfall is confined to the rainy season. The district has 3 sub-divisions which are Bankura Sadar, Khatra and Bishnupur (Shit et al., 2017). Bankura Sadar comprises with 8 C. D. blocks which are as follows: Bankura-I, Bankura-II, Barjora, Chattna, Gangajalghati, Mejhia, Onda and Saltora. Khatra sub- division is composed of Khatra, Indpur, Hirbandh, Ranibandh, Raipur, Sarenga, Simlipal and Taldangra C. D. block. Bishnupur sub-division is comprised of Bishnupur, Indas, Jaypur, Patrasayar, Kotulpur and Sonamukhi C. D. block.
Figure 1. Study area: Bankura District, West Bengal, India
Inaccessible by road due to its rough terrain and dense forest cover, the Bankura district in West Bengal is a treasure trove of natural beauties. Hills with red dirt that are undulating and Sal trees that are a beautiful green color define this neighborhood. Numerous ethnic groups, including the Santhali, Bhumij, Mundas, Oraon, Birhor, Mal, Pharia, Kharia, and Ho, call this region home (Pan, 2011). There are several cultural attractions in the district which includes traditional fairs and festivals. Bishnupur is known as the cultural capital of Bankura and it is known as the temple town. The Susunia is well known for its adventure tourism, where a number of rock-climbing courses are held in the region’s rocky terrain, particularly during the month of winter (Ganai, 2018). The woodland areas of Jhilimili and Sutan are well known as popular tourist destinations because of their distinctive beauty and biodiversity. The Chenchuria is a temple town carries unique cultural attractions and beauty. Samudrabandh is a place where a barrage is located and it is covered by the forested land of 120 km2 area.
3 . METHODOLOGY AND DATASETS
3.1 Data
To perform the study a large number of geospatial data is used. Average Length of Stay (ALS), Hotel Density (HD), Tourist Function Index (TFI), Tourist Density (TD) under TIM is prepared using the Tourism Annual Survey Report of West Bengal 2014-15 (https://tourism.gov.in). Information about roads is obtained from Open Street Map Layer, 2018 (https://www.openstreetmap.org). Station wise Maximum Temperature (MT), Minimum Temperature (MTI), Precipitation (PR) and Relative Humidity (RH) data on daily basis downloaded from Climate Forecast System Reanalysis (CFSR) project which starts at year 1979 and ended at 2014 July. The reanalysis datasets are converted into the station data which is available in the SWAT format (Phiri and Mulungu, 2019). Our study extracts those daily basis station data and converted it into the monthly values. The location of 8 meteorological stations corresponding to our study area is denoted in figure 1. The geological variation of the study area is prepared by digitizing the Survey of India (SOI) Toposheets which has a scale factor 1:50,000.
Relief, slope and aspect map are prepared from ASTER GDEM which has 30 meter spatial resolution. The Normalized Difference Vegetation Index (NDVI) is measured from the LANDSAT satellite image which is downloaded from the NASA Earth Explorer search engine (https://earthexplorer.usgs.gov). Social parameters are extracted from Census of India, 2011 database (https://censusindia.gov.in). Except the Net Domestic Product (NDP) all parameters under economy are extracted from Census of India, 2011. This study uses Indian Air Quality Index (IAQI) which is also called as the National Air Quality Index (NAQI). Air-quality.com (now in partnership with CPCB) broadcasts air quality information which is available about 180 countries in the globe (Clements et al., 2017). The research utilizes average AQI (India) of 2019. There are 6 AQI categories such as Good, Satisfactory, Moderately Polluted, Poor, Very Poor and Severe. If AQI value is between 0 to 50 it is termed as Good. If AQI is within 51 to 100 it will be Satisfactory in nature. If the index value is within 101 to 200 it is termed as Moderately Polluted. Information of AQI of six locations within Bankura is available. Six locations are Bankura, Barjora, Bishnupur, Khatra, Patrasayar and Sonamukhi. Here, informations on 9 most important pollutants of ground water are obtained from the final report of 2013-14 from Central Pollution Control Board (CPCB) (https://cpcb.nic.in). Those 9 ingredients are Electrical Conductivity (EC), the bicarbonate ion (HCO3), Chlorine (Cl), Thorium (TH), Calcium (Ca), Magnesium (Mg), Sodium (Na), Silicon-dioxide (SiO2) and Potassium (K). EC measures the ionic concentration of dissolved solids in the water (Taylor et al., 2018). Pure water serves as a good insulator rather than a good conductor of electrical current. According to the guideline of WHO, EC value should not exceed 400μS/cm. For the human body’s metabolism to function and for other critical physiological processes, the Chloride (Cl) is crucial. “High Chloride damages metallic pipes and structures as well as harm the growing plants” (Meride and Ayenew, 2016). Similarly for magnesium WHO permissible limit is 50 mg/l and it helps in proper functioning in living organisms and find in minerals. The standardized sodium level (Na) and Calcium (Ca) according to WHO are 200 mg/l and 75 mg/l. However, there is no limit in HCO3 and SiO2 values according to WHO. Available amenities of different C.D. block are available from Census of India, 2011. LAC has been explored by utilizing a non-participant based explorative qualitative research approach. Both primary and secondary sources were used to gather those qualitative data. The primary survey was conducted utilizing non-participant observation and counting between March of 2018 and February of 2020. Each and every C.D. blocks are travelled during this tenure. For more clarifications regarding LAC articles of Ganai (2018) and Pan (2011) are consulted.
3.2 Analytic Hierarchy Process (AHP)
AHP is “a theory of measurement through pair-wise comparisons and relies on the judgments of experts to derive priority scales” (Saaty, 2008). Analytic Hierarchy Process (AHP) is a multiple decision-making tool based on Eigen value approach to the pairwise comparisons (Vaidya and Kumar, 2006). It is widely used in evaluation, cost benefit analysis, allocations, planning and development, priority and ranking and decision making. According to Saaty (2001), AHP is an objective mathematical process where subjective preferences may be incorporated for accurate generalization. The wide applicability of AHP is due to its’ simplicity, ready to use, and great flexibility (Ho, 2008). In this study, the Analytic Hierarchy Process (AHP) method is used to analyze the weight values of each thematic layer involved in the tourism potentiality zone identification. Relative rating values of each thematic layer have been assigned for the subclasses based on their causative factor on the tourism potentiality triggers (Navale and Bhagat, 2022). The classes of various thematic layers are further being rated on a scale of 1-9 (Table 1), where higher rating value indicates higher influence for tourism potentiality. By performing a weighted overlay analysis between each of the layers, the final tourist potentiality map is created. The Analytic Hierarchy Process (AHP) is frequently used in the Multi-Criteria Decision Analysis (MCDA) approach to determine the weighted values of each factor. When making decisions, AHP approaches display the hierarchical structure of several criteria in a pairwise comparison method (Raha and Gayen, 2022). Equal number of rows and equal number of columns is noticed in AHP matrix. (Gorsevski et al., 2006). For the construction of a pairwise comparison matrix, each criterion was rated against every other criterion by assigning a relative dominant scale between 1 and 9 (Table 1). The relative scale of all these parameters is given based on different criteria and preferences (1. equally important; 3. moderately important; 5. strongly important; 7. very strong importance; 9. extremely important; 2, 4, 6 and 8 are intermediate values). Thereafter, the weighted values of each criterion have been determined using AHP pairwise comparison matrix (Table 3). Relative importance between two criteria is judged using this matrix. For instance, the importance of the TIM in relation to the other seven criteria listed in the column is shown in the first row. The rows in this matrix are arranged according to the inverse value of each criterion and how significant it is in relation to other criteria (for instance, the TIM is somewhat more significant than the Climate, thus its value is 1 and its value is 0.5, and so on). In the table 4 weights are normalized and a standardized pair-wise comparison matrix is formed and criteria weights are obtained. TIM obtains highest weightage (about 30.5%) as it has highest influence in the tourism potentiality zone estimation. The climate (C) achieves second place with 25.6% weightage. At the successive level Physical (20.4% weightage), Social (7.5% weightage), Economy (7.0% weightage), Environmental Quality (3.9% weightage), Amenities (2.3% weightage) and diversity in Local Art and Crafts (2.7% weightage) are taken into consideration (Table 4). Every raster is divided into different subclasses and individual priority of those classes are also determined (Table 5). The priority or weightage is determined using the following formula:
\(0<w<100; ∑_{(i=1)}^nw_{ij}=100%〗\) (1)
Consistency ratio (CR) was calculated in order to determine whether the pairwise comparisons were consistent or not (Kolat et al., 2012). One of the strengths of the AHP method is that it allows for inconsistent relationships while providing a CR as an indicator of the degree of consistency or inconsistency (Chen et al., 2010; Feizizadeh and Blaschke, 2013). If the CR < 0.10, it indicates a good level of consistency to recognize the class weights.
\(Consistency \ Ratio= {Consistency \ Index\ (C.I.) \over \ Random \ Consistency Index \ (RI)}\) (2)
Where,
\(Consistency \ Index= (λ_{max}-n)/(n-1)\) (3)
where, λmax is the principal Eigen value and n is the number of factors.
Random Consistency Index (RI) (Table 2) is derived from the randomly generated reciprocal matrices (Donegan and Dodd, 1991). Those numbers are utilized from the study of Saaty (1980). According to Saaty, (1980) if consistency ratio is below 0.1 the matrix becomes consistent. In our study, consistency ratio is 0.092 which is less than 0.1. So, here matrix (Table 4) is consistent and the estimated criteria weights can be utilized for tourism potentiality zone identification. Pairwise comparison matrix for each subclass (for each raster layer) is also consistent (Table 5).
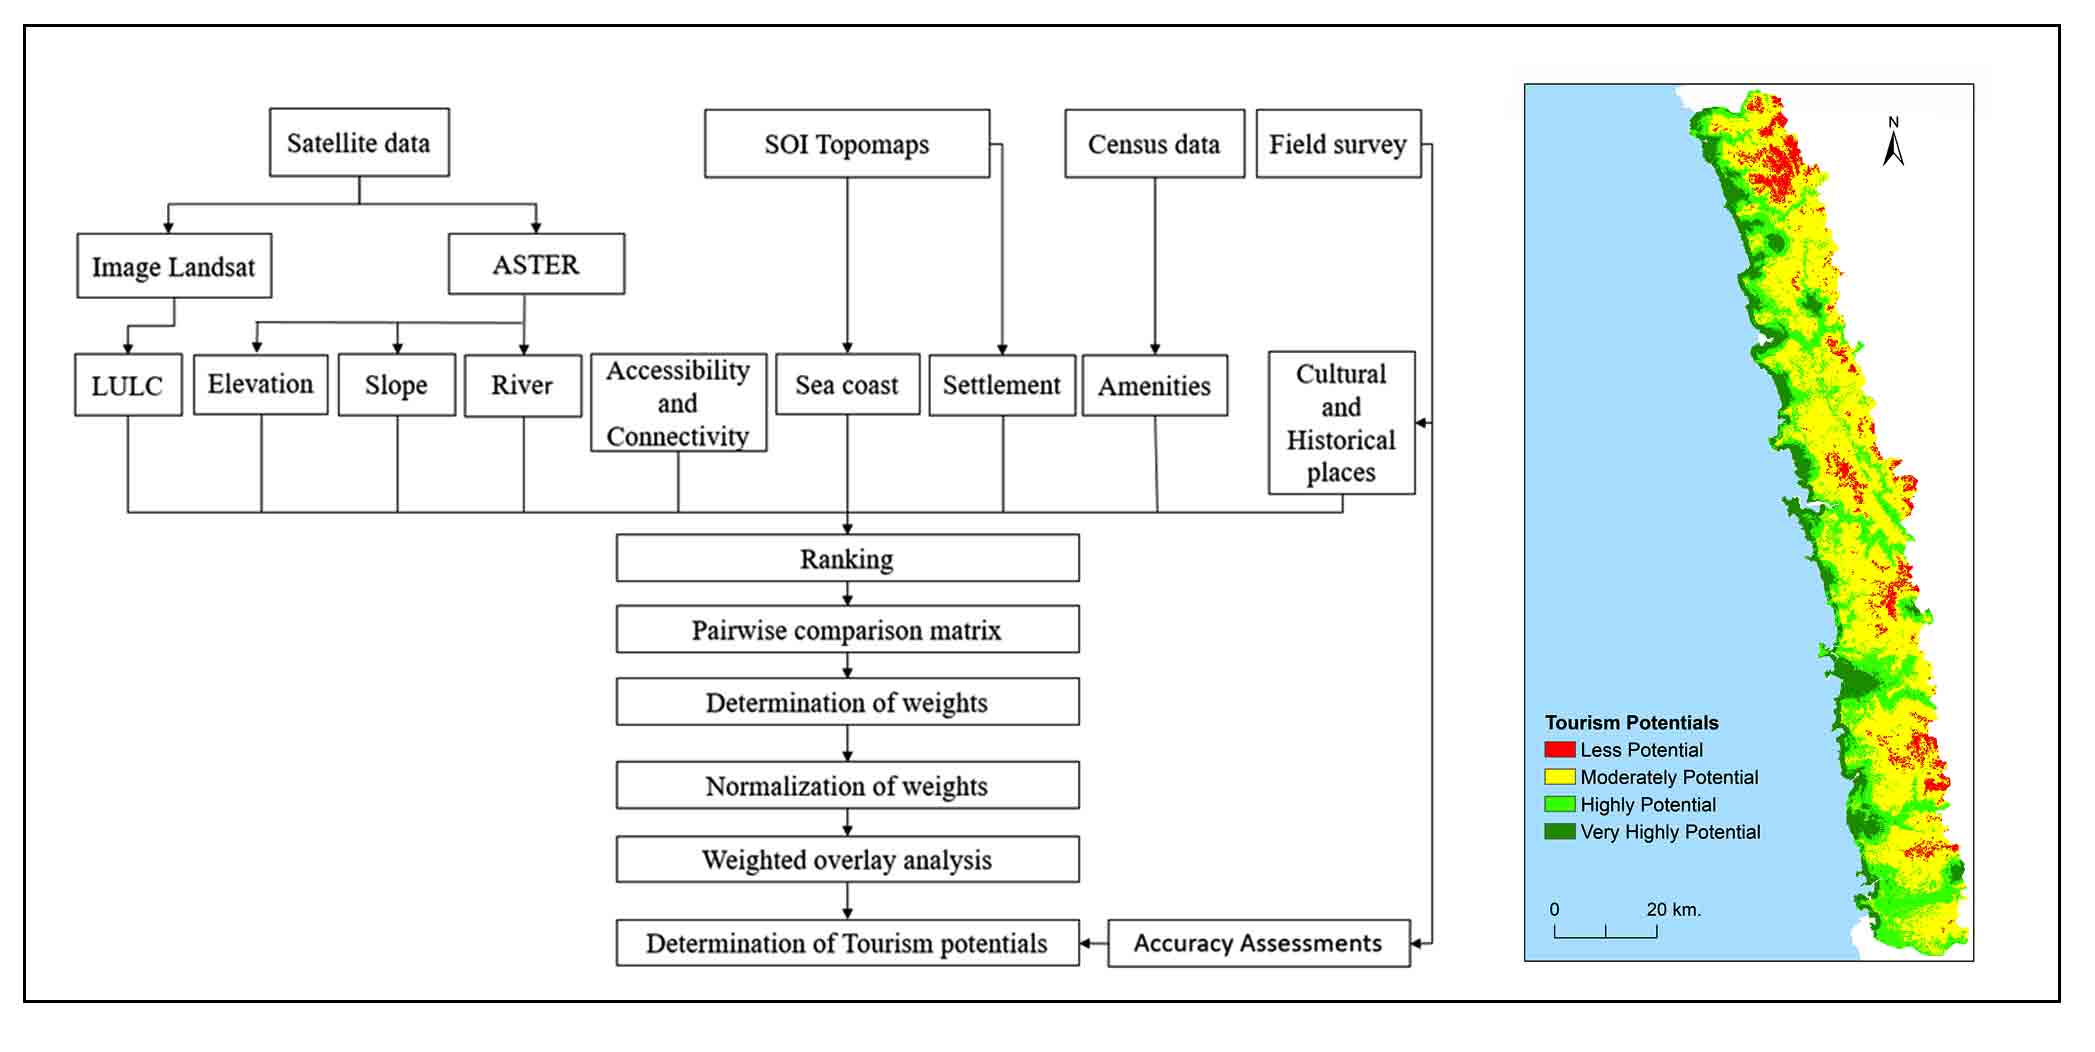
To map probable significant categorization in space the research utilizes Inverse Distance Weighted (IDW) procedure (Becco and Brown, 2013). Figure 2 determine the detailed methodological framework of the research.
Figure 2. Methodology
Table 1. Description of scales (Saaty, 1990)
Scales
Degree of preferences
Descriptions
1
Equally important
The contributions of two factors are equally important
3
Moderate importance
Experiences and judgment slightly tend to certain factor
5
Strong importance
Experiences and judgment strongly tend to certain factor
7
Very strong importance
Experiences and judgment tend to certain factor with extreme strong
9
Extreme importance
There is sufficient evidence for absolutely tending to certain factor
2,4,6,8
Intermediate values
In between two judgments
Table 2. Random Index Value (Donegan and Dodd, 1991)
Order of matrix
R.I.
3
0.4887
4
0.8045
5
1.0591
6
1.1797
7
1.2519
8
1.3171
9
1.3733
10
1.4055
11
1.4213
12
1.4497
13
1.4633
14
1.4822
15
1.4969
16
1.5078
17
1.5153
18
1.5262
19
1.5313
20
1.5371
Table 3. Pairwise comparison matrix
Categories
TIM
C
P
S
E
EQ
AN
LAC
Priorities (%)
Ranks
+ (%)
- (%)
TIM
1
2
2
7
6
5
9
5
30.5
1
16.10
16.10
C
0.5
1
2
7
7
5
5
5
25.6
2
5.20
5.20
P
0.5
0.5
1
4
4
9
8
8
20.4
3
4.60
4.60
S
0.14
0.14
0.25
1
2
2
7
3
7.5
4
3.20
3.20
E
0.17
0.14
0.25
0.5
1
2
6
6
7.0
5
1.60
1.60
EQ
0.2
0.2
0.11
0.5
0.5
1
2
2
3.9
6
4.20
4.20
AN
0.11
0.2
0.12
0.14
0.17
0.5
1
1
2.3
7
0.80
0.80
LAC′
0.2
0.2
0.12
0.33
0.17
0.5
1
1
2.7
8
0.90
0.90
3.2.1 Step-1: Selection and Preparation of the Thematic Layers
In the first step, thematic layers are selected. Here 8 variables are selected with 34 indicators. Those 8 variables are considered in the Analytic Hierarchy Process (AHP) which helps to identify tourism potentiality zone of Bankura. Under the Tourist Intensity Measures (Manera and Valle, 2018), Average Length of Stay (ALS) (Alén et al., 2014), Hotel Density (HD) (Assaf et al., 2015), Tourist Function Index (TFI) (Marković, et al., 2017), Tourist Density (Manera and Valle, 2018; Simancas and Peñarrubia, 2019), Road Density and Road Proximity (Raha et al., 2022) considered. So, using AHP based weightage the spatial overlay equation of TIM will be:
Under Climate (C) (Andereck and Nyaupane, 2011) Maximum Temperature (MT), Minimum Temperature (MTI), Precipitation (P) and Relative Humidity (RH) are considered. Thus, using AHP based weightage equation of Climate (C) must be as follows:
Similarly, under Physical (P), Geology (GL), Relief (RL), Slope (SL), Aspect (AS) and Drainage Density (DD) and Normalized Difference Vegetation Index (NDVI) (Bajgain et al., 2015) are considered. Thus, the weighted overlay equation is as follows:
Under Social (S) (Choi and Murray, 2010), volume of Migration (MG), Literacy Rate (LR), Sex Ratio (SR), Population Density (PD) (Mauerhofer, 2013; Newsome et al., 2012), Population Growth Rate (PGR) and Social Carrying Capacity (SCC) (Hallo and Manning, 2010) are considered. Thus, the weighted overlay equation in this case is as follows:
Creutzig et al. (2015) emphasize on the local economy in case of construction tourism potentiality models. Under the Economy (E), % share of Net Domestic Product (2012-13) at constant prices (2004-05) from hotel and restaurant sector, Main Worker (MW), Marginal Worker (MAW) and Total Worker (TW) are considered in this research. Thus, E is determined using the following formula
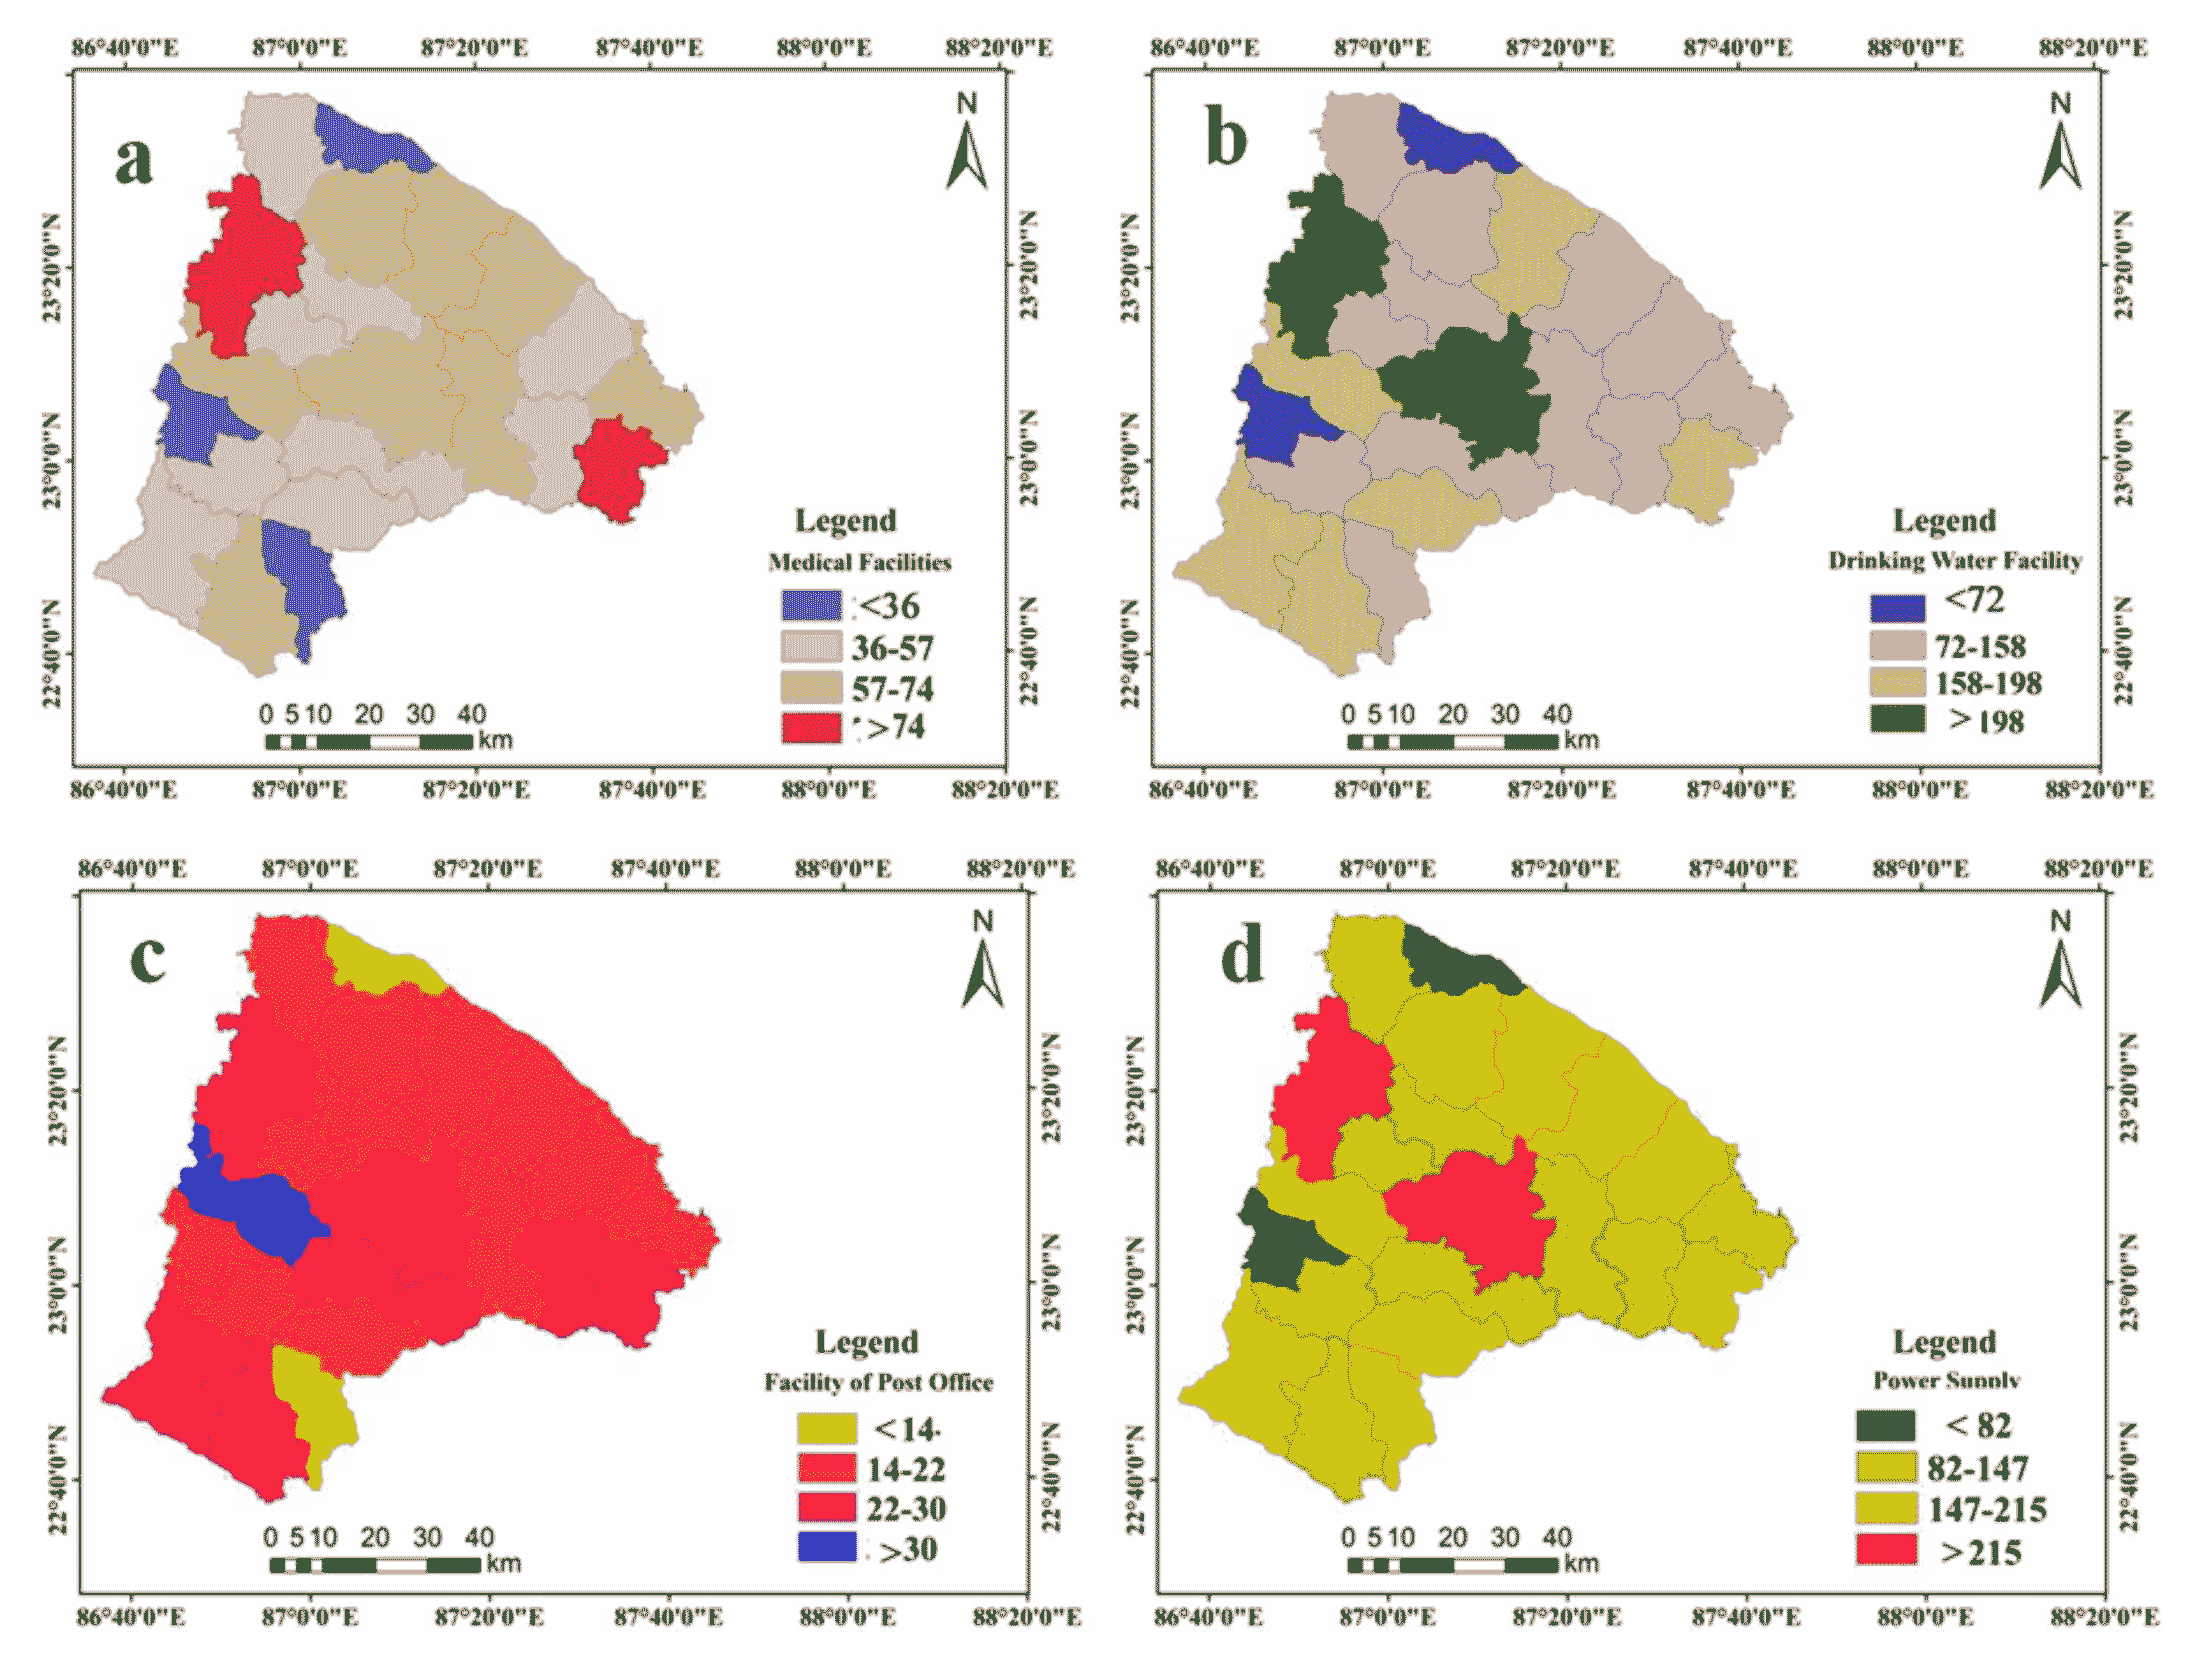
The availability of required Amenities (AN) (Blancas et al., 2011; Guo et al., 2019; Chen and Chen, 2010) in the tourist spots are another important indicator of the sustainable tourism. Here, Medical (M), Drinking Water (DW), Post Office (PO) and Telephonic Facility (TF) are considered. The equation of AN is as follows:
Destinations are more sustainable if environmental quality and ground water quality have a high value. Indicators have positive direct influence on tourism sustainability issue.
Local Art and Craft (LAC) diversity plays a major role in the tourism potentiality. “Art and craft play an important role as souvenirs and mementos thereby spatially and temporally expanding the visitor experience” (Phillips et al., 2017). To identify local art and craft authors surveyed 22 blocks of the study region. Sixteen types of arts and crafts are identified within Bankura and distribution of those arts and crafts varies within 4 to 16 in different C.D. blocks. In this research authors have utilized diversity of LAC which is basically as follows:
\(LAC^{'}=-∑_(i=1)^R(LAC)_i In(LAC)_i\) (12)
Where, \(LAC^{'}\) represents diversity in LAC, \(LAC_{i}\) is the proportion of characters belonging to the ith type of LAC, LAC is local art and crafts. \(LAC^{'}\) is based on the weighted geometric mean of the proportional abundances of the types, and it equals to the logarithm of true diversity as calculated as q =1.
At last the Tourist Potentiality Zone (TPZ) is determined using the following formula:
In all cases, n and k is the weightage determined by AHP.
3.2.2 Step-2:Estimation of Pairwise Comparison Matrix and Checking Consistency Ratio
The pairwise comparison matrices (Tables 3 and 4) are constructed in the second step using an equal number of rows and columns to indicate the relative value of each criterion. Here, weights for various geographical layers are decided upon in light of in-depth literature evaluations considered from renowned databases like PubMed, Scopus, etc. Here, each criterion is evaluated on a scale of relative dominance from 1 to 9. (Table 1, Raha et al., 2021). For example, in Table 4, the Amenities (AN) are more important than the Environmental Quality (EQ). Therefore, the Amenities (AN) are codified with 9 and Environmental Quality (EQ) is codified with 5. Here, the Tourist Intensity Measure (TIM) obtains the highest weightage (30.5%), followed by the Climate (C) (25.6%), Physical (P) (20.4%), Social (S) (7.5%), Economy (E) (7.0%), Environmental Quality (EQ) (3.9%), Amenities (AN) (2.3%) and Local Arts and Crafts (LAC’) (2.7%). For each subclass and selected layers, the pairwise comparison matrices are also prepared (Table 3). The high class attains the highest weightage and the low class attains the lowest weightage and vice-versa. Here, for each case, the consistency ratios are also checked. If the consistency ratio is less than 0.1, it is treated as the consistent and further operation is done.
Table 4. Priorities of the sub-parameters
Main-variables
Sub-variables
Weights (%)
Ranks
+ (%)
-(%)
Tourism Intensity Measure (TIM)
CR: 0.078
TFI
44.50
1
15.70
15.70
TD
33.10
2
19.00
19.00
RD
8.30
3
4.60
4.60
RP
6.80
4
1.500
1.50
ALS
4.30
5
1.60
1.60
HD
3.10
6
1.40
1.40
Climate (C)
CR: 0.056
MT
45.90
1
9.80
9.80
MTI
41.40
2
10.60
10.60
PR
6.90
3
2.90
2.90
RH
5.80
4
1.90
1.90
Physical (P)
CR: 0.06
GL
33.30
1
11.40
11.40
RL
30.80
2
8.40
8.40
SL
10.10
4
2.50
2.50
AS
12.20
3
6.10
6.10
DD
7.20
5
3.00
3.00
NDVI
6.30
6
3.10
3.10
Social (S)
CR: 0.098
SCC
47.30
1
33.40
33.40
MG
28.30
2
8.60
8.60
LI
13.60
3
6.80
6.80
SR
5.00
4
1.50
1.50
PD
3.30
5
1.50
1.50
PGR
2.60
6
1.50
1.50
Economic (E)
CR: 0.06
NDP
57.50
1
22.50
22.50
MW
31.20
2
11.30
11.30
MAW
6.80
3
1.90
1.90
TW
4.50
4
1.20
1.20
Environmental Quality (EQ)
AQI
50.00
1
50
50.00
GWQ
50.00
1
50
50.00
Amenities (AN)
CR: 0.045
M
57.50
1
22.50
22.50
DW
31.20
2
11.30
11.30
PO
6.80
3
1.90
1.90
PS
4.50
4
1.20
1.20
-
LAC
100
1
-
-
3.2.3 Step-3:Reclassification of Raster Maps
In this stage, all spatial layers are reclassified into 4 to 5 classes. Weightages are incorporated based on their priorities. As the importance increases, priority increases and vice-versa.
3.2.4 Step-4: Weighted Sum Analysis
The weighted sum technique is utilized in the fourth stage, to get the tourism potentiality map. The formula is as follows (Raha and Gayen, 2022):
\(TPZ_i=∑_(i=1)^n∑_(k=1)^q(G_i×W_k)\) (14)
where, TPZ represents the potential zone for the tourism at the specific time stamp I, Gi illustrates the rank of q thematic and geospatial layers, Wk implies the weightage or importance of the thematic layers (k) and the total number of thematic layers are signified with the n.
3.2.5 Step-5: Classification of Tourism Potentials
In the fifth stage, the natural break strategy is interestedly utilized to classify the final potential tourism map. The potentiality layer is classified here as the High, Moderate and Low categories. The potentiality flourishes by increasing the class value and vice-versa.
Table 5. Tourism potentiality zonation rating
Main-variables
Sub-variables
Factors
Classes
Rating
Tourist Intensity Measure (TIM)
Hotel Density
(HD)
0.014-0.0395
2
0.0395-0.065
4
0.065-0.0905
6
0.0905-0.116
8
Average Length of Stay in days (ALS)
<6
1
6-11
3
11-15
5
15-20
7
>20
9
Tourist Function Index (TFI)
0.004-0.0085
1
0.0085-0.013
3
0.013-0.0175
5
0.0175-0.022
7
Road Density (km/km2) (RD)
1.922-25.488
1
25.488-49.053
3
49.053-72.619
5
72.619-96.185
7
Road Proximity (RP)
0-0.013
1
0.014-0.027
3
0.027-0.040
5
0.040-0.054
7
Tourist Density
(TD)
1829.42-2997.65
1
2997.65-4165.88
2
4165.88-5334.12
3
5334.12-6502.35
4
Climate (C)
Maximum Temperature
(MT)
1003.418-1006.038
5
1006.038-1008.659
6
1008.659-1011.279
7
1011.279-1013.899
8
1013.899-1016.519
9
Minimum Temperature
(MTI)
632.569-636.148
5
636.148-639.727
6
639.727-643.306
7
643.306-646.885
8
646.885-650.464
9
Precipitation
(PR)
142.215-149.098
4
149.098-155.982
5
155.982-162.865
6
162.865-169.748
8
169.748-176.631
9
Relative Humidity
(RH)
16.389-16.745
5
16.745-17.099
6
17.099-17.455
7
17.455-17.809
8
17.809-18.165
9
Physical (P)
Geology (GL)
Alluvium
9
Laterite
7
Gondwana
5
Granite Gneiss
3
Phyllite
1
Relief (RL) in metre
17-72
8
72-113
6
113-160
4
160-439
2
Slope (SL) in %
48.32-86.5
4
86.5-87.9
3
87.9-88.5
2
88.5-90
1
Aspect (AS)
-1-(-70) (Flat to North to North-east)
9
70-143 (East to South-East)
7
143-216 (Southeast to south to southwest)
5
216-290 (Southwest to west)
3
290-360 (west to northwest to north)
1
Drainage Density (DD)
0.17-5
1
5-9
2
9-13
3
13-17
4
17-22
5
Normalized Difference Vegetation Index (NDVI)
-0.88-0.19
2
0.19-0.28
4
0.28-0.33
6
0.33-0.43
8
Social (S)
Volume of Migration (%) (MG)
21.59-35
1
35-48
3
48-60
5
60-73
7
73-86
9
Literacy Rate (%) (LR)
61.45-65
5
65-68
6
68-72
7
72-75
8
75-79
9
Sex Ratio (SR)
934-943
1
943-951
2
951-959
3
959-967
4
967-975
5
Population Density (PD)
278-367
9
367-455
7
455-544
5
544-632
3
632-720
1
Population Growth Rate (PGR)
1.57-2
9
2-12
8
12-13
7
13-14
6
14-16
5
Social Carrying Capacity (SCC)
4-5
1
5-7
3
7-10
5
10-13
7
Economy (E)
% of NDP share in Hotel and Restaurant Sector on 2004-05 base prices
2.493-3.750
1
3.751-5.008
3
5.009-6.265
5
6.266-7.523
7
Main Worker (MW)
<22.2975
1
22.30-26.08
3
26.09-29.87
5
>29.87
7
Marginal Worker (MAW)
<13.95
1
13.96-18.03
3
18.04-22.11
5
>22.11
7
Total Worker (TW)
<38.55
1
38.56-41.79
3
41.80-45.02
5
>45.02
7
Environmental Quality (EQ)
Air Quality Index (AQI)
58-75
1
76-93
3
94-110
5
111-128
7
Electrical Conductivity (EC)
(mg/l)
0-390
8
390-780
6
780-1170
4
1170-1560
2
Chlorine (Cl)
(mg/l)
<73.75
8
73.76-147.5
6
147.6-221.25
4
>221.25
2
Calcium (Ca)
(mg/l)
<38
8
39-76
6
77-114
4
>114
2
Thorium (TH)
(mg/l)
0-137.5
8
137.5-275
6
275-412.5
4
412.5-550
2
Carbonic Acid
(H2CO3)
(mg/l)
0-116
8
116-232
6
232-348
4
348-464
2
Sodium (Na)
(mg/l)
0-29.25
8
29.25-58.5
6
58.5-87.75
4
87.75-117
2
Silicon Dioxide
(SiO2)
(mg/l)
0-5.25
8
5.25-10.5
6
10.5-15.75
4
15.75-21
2
Potassium (K)
(mg/l)
0-7.5
8
7.5-15
6
15-22.5
4
22.5-30
2
Magnesium (Mg) (mg/l)
0-10.25
6
10.25-20.5
8
20.5-30.75
4
30.75-41
2
Amenities (AN)
Medical Facilities (M)
<36
2
36-57
5
57-74
7
>74
9
Drinking Water Facility (DW)
<72
1
72-158
3
158-198
5
>198
7
Post Office Facility (PO)
<14
2
14-22
4
22-30
6
>30
8
Telephone Facility (TF)
<82
1
82-147
3
147-215
5
>215
7
Diversity of
Local Art and Crafts
(LAC′)
-0.075 to -0.071
4
-0.071 to -0.650
3
-0.650 to -0.050
2
-0.050 to -0.028
1
4 . RESULTS
The pairwise comparison matrix (Table 4) determines the priority weights of every main variable. Tourism Intensity Measure (TIM) and Climate (C) are observed with highest priority (30.5% and 25.6%, respectively) while Amenities (AN) and diversity in Local Art and Culture (LAC′) are observed with least priority (2.3% and 2.7% priority, respectively). Overall the matrix (Table 4) is consistent with CR value 0.092.
TIM is constructed with the help of six sub- parameters within which Tourist Function Index (TFI) and Tourist Density (TD) achieves higher priority (44.5% and 33.1%, respectively). C is constructed with four sub-parameters within which Maximum Temperature (MT) and Minimum Temperature (MT1) is noticed with higher priority (45.90% and 41.40%, respectively). Geology (G), Relief (RL) and Aspect (AS) (Under variable Physical (P)) are recognized with higher priority (33.30%, 30.80%and 12.20%, respectively). Under variable Social (C) volume of migration (MG), sex ratio (SR) and literacy rate (LR) are marked with relatively high priority (37.10%, 30.20% and 21.60%, respectively). % of NDP and % of Main Worker (MW) achieve higher priority under Economy (E) category. Environmental Quality is denoted with two sub variables such as Air Quality Index (AQI) (50% weightage) and Groundwater Quality (GWQ) (50 % weightage) (Table 5). Groundwater Quality (GWQ) has 10 indicators. Electrical Conductivity (EC) and HCO3 have got the highest importance (22.50% and 31.30% weightage, respectively) whereas Silicon dioxide (Sio2) and Calcium (Ca) have got the lowest importance (2.80% and 2.20% weightage, respectively). Diversity in local arts and crafts (LAC′) has no sub-factor (2.7% weightage). Table 5 denotes the priority of indicators. In every cases the matrix is consistent with <0.1 CR value.
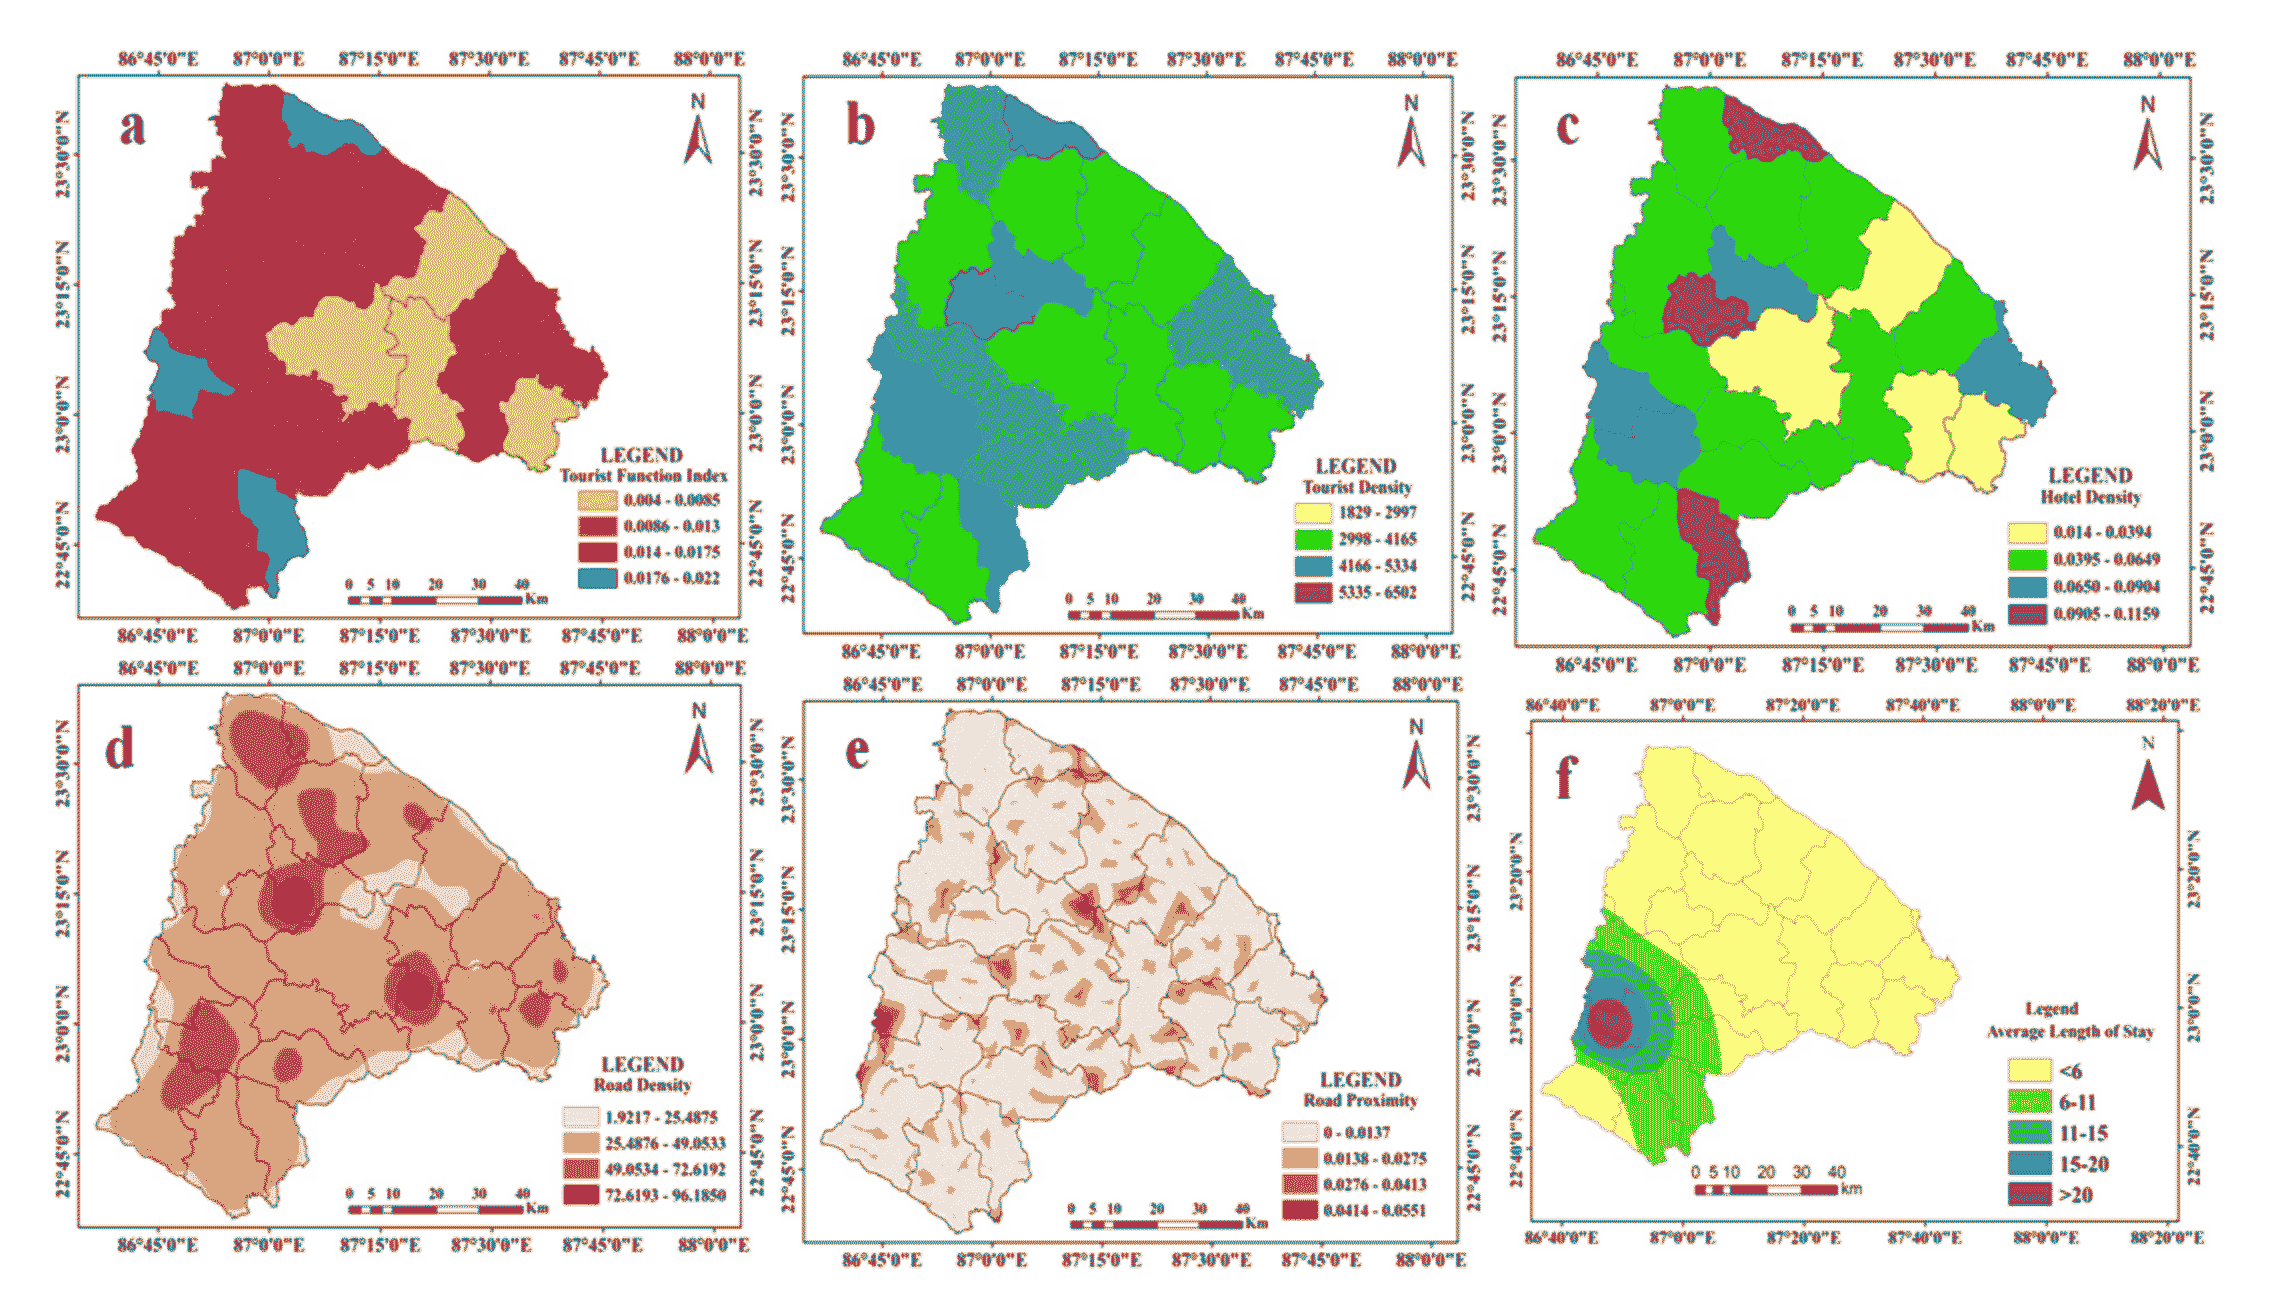
4.1 Tourist Intensity Measure (TIM)
Six variables are considered under TIM i.e. Tourist Function Index (TFI, Figure 3a), Tourist Density (TD, Figure 3b), Hotel Density (HD, Figure 3c), Road Density (RD, Figure 3d), Road Proximity (RP, Figure 3e), and Average Length of Stay (ALS, Figure 3f). Tourist Function Index (TFI) is relatively high (0.014-0.022) at the Saltora, Bankura-I, Bankura-II, Hirbandh, Khatra, Ranibandh, Sarenga and Jaypur C.D. block. TFI is relatively low (0.004-0.0085) at Onda, Bishnupur, Sonamukhi and Kotulpur C.D. block. Remaining C.D. blocks are observed within 0.0086 to 0.0175 TFI. TD is relatively high (4166-6502) at the Bankura-I, Mejhia, Bankura-II, Hirbandh, Khatra and Sarenga C.D. blocks. The remaining C.D. blocks are observed within 1829-4165 TD value. The Hotel Density (HD) is relatively high (0.065-0.159) at the Mejhia, Bankura-I, Bankura-II, Khatra, Hirbandh, Sarenga, and Indus C.D. block. Remaining C.D. blocks are observed within 0.014 to 0.0649 TD value. Road density is highest (72.6193-96.1850) at 4% area of Bankura and it is lowest (1.9217-25.4875) at 9% area of Bankura district. Remaining portions (77% area) of Bankura are observed with RD ranges 25.4678 to 72.6192. Road proximity is high (0.0414-0.0551) at 4% area of Bankura whereas it is low over 80% area of the tourist spot. Average length of stay is higher (>20 days) in Mukutmanipur, Sutan and Jhilimili. On the other hand it is relatively low at Biharinath, Bishnupur, Chenchuria and Jayrambati. Each indicator under TIM is in the positive relationship with tourism potentiality. So, in each case as the class value increases weightage also increases and vice-versa.
Figure 3. Tourist Intensity Measure (TIM): a) Tourist Function Index (TFI), b) Tourist Density (TD), c) Hotel Density (HD), d) Road Density (RD), e) Road Proximity (RP), f) Average Length of Stay (ALS)
4.1.1 Climate Parameter (C)
Under Climate (C), four indicators such as Maximum Temperature (MT), Minimum Temperature (MTI), Precipitation (P) and Relative Humidity (RH) are taken into account. Every variable is split into individual 5 classes. The spatial assessment of MT (Figure 4a) denotes the fact that high MT value is sensed in the northern, northwestern and northeastern portions (about 43% of the total area) of the study area. On the contrary, the high MTI (Figure 4b) is observed in the eastern segment (about 46% of the total area) of the study area. The MT is classified into five groups and it is rated according to their priority (i.e. 5, 6, 7, 8 and 9). Similarly, the MTI is also classified into five subclasses and they are rated as the same manner. Higher precipitation (~169-176mm) is found in the southern and south-western portions (about 7% of the total area) of the study region (Figure 4c). Relative Humidity (RH) is low in the northwestern and western portions (about 18% of the total area) of the study region whereas it is high in the southern and southeastern portions (about 17% of the total area) of the study region (Figure 4d). All classes of RH and PR are also codified according to their importance. As Bankura is a drought-prone region so, higher precipitation and relative humidity will create favorable climate for visitors. The RH and PR are reclassified into 5 individual classes and with increasing the class value importance of each layer increases and vice-versa.
Figure 4. Climatic parameters: a) Maximum Temperature (MT), b) Minimum Temperature (MTI), c) Precipitation (PR), d) Relative Humidity (RH)
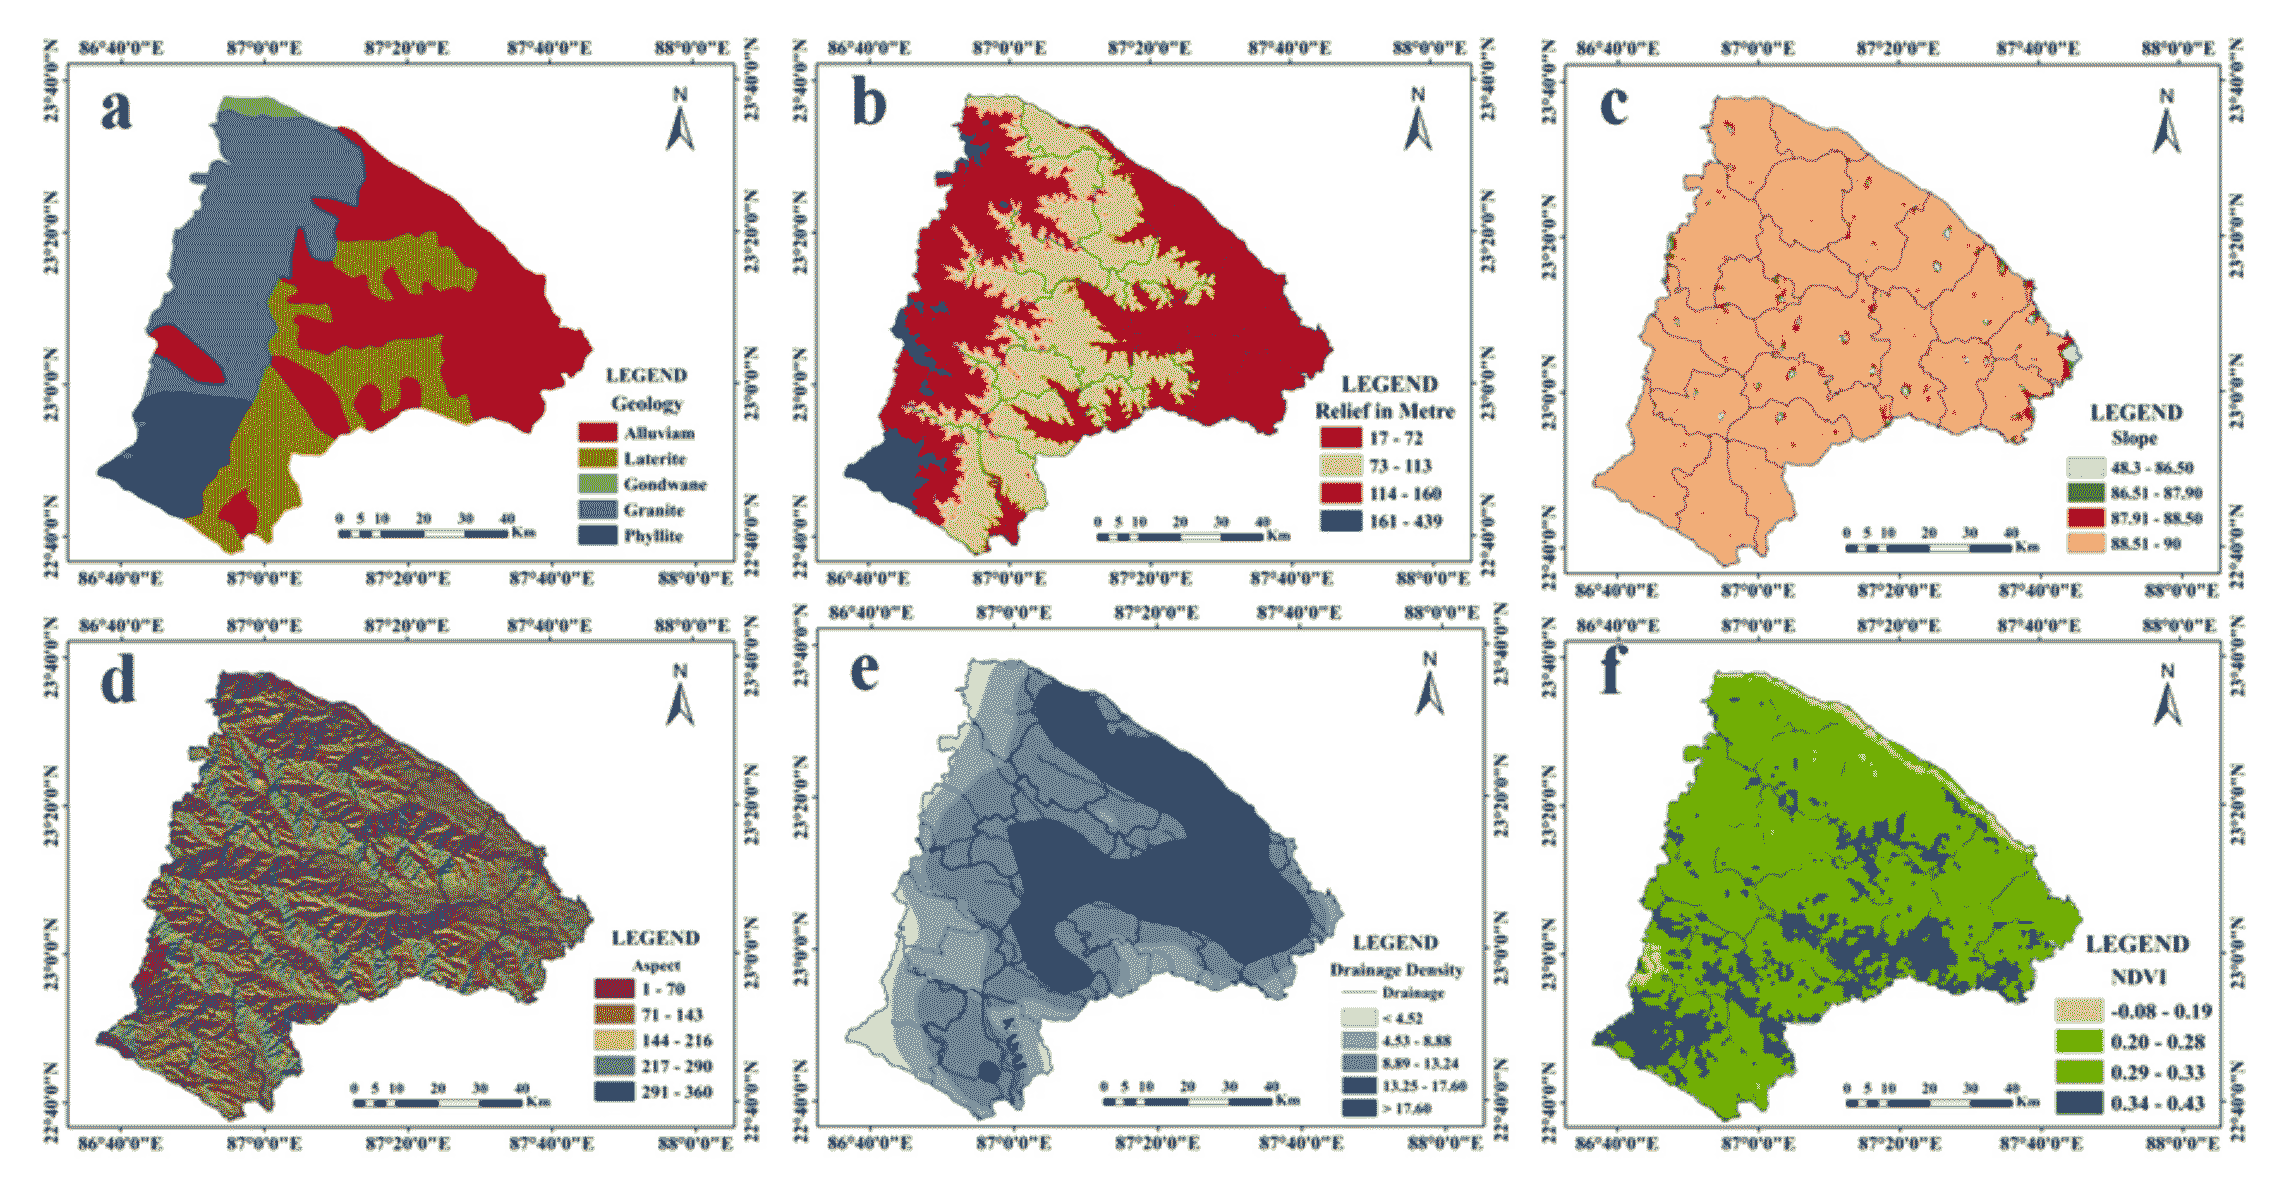
4.1.2 Physical parameter (P)
Under Physical (P) parameter, six indicators are considered. The geological map (Figure 5a) is composed of four units: Alluvium (about 32% area of Bankura), Laterite (about 20% area of Bankura), Gondwana (about 1% area of Bankura), Granite (about 35% area of Bankura) and Phyllite (about 12% area of Bankura). Each category is rated as 9, 7, 5, 3 and 1, respectively. Bankura is a drought prone area which may have negative impact on tourism. Alluvium soil able to store water quite easily thus development of tourism is more or less smooth in this study area. On the contrary, Granite and Phyllite is very much sensitive to drought. Thus, with respect to tourism potentiality alluvium is assigned with higher priority (Code 9) and granite and Phyllite are assigned with low priority (Code 3 and Code 1, respectively). Relief is high (114-439m) in the northwestern portions (about 40% areas) whereas it is low (17-72m) in the eastern and northeastern portions (about 30% areas) of the study area (Figure 5b). Higher relief is identified with the granitic rock which is not able to store water. Thus, with respect to study region, higher relief is more drought-prone and thus, it is assigned relatively low priority (Code 2) with respect to tourism potentiality. As relief value decreases priority increases. Over 90% of the region having higher slope (Figure 5c). Relief and slope are classified into 4 classes. The first class of relief 17-72 is rated as 2 while the last class of relief 161-439 is rated as 8. Higher relief is noticed with high slope so higher class of slope is identified with lowest priority. The first class 48.32-86.5 is rated as 4 while the last class is rated as 1. Similarly, Aspect (AS) is classified into the 5 subclasses and they are also sequentially labeled according to their increasing importance (Figure 5d). Slope direction from North to Northeast and South to Southeast gains relatively high priority (Code 9 and 7) and the aspect from Northwest to West sector gains relatively low priority (Code 3 and 1). Drainage Density (DD) is classified into 5 classes and they are rated as 1, 2, 3, 4 and 5, respectively. Northeastern portions (about 32% areas) of the study region are observed with high DD value (>13.25 DD value) whereas it is low (<13.24 DD value) in the Northwestern and Western portions (about 45% areas) of the study region. High NDVI value (0.34-0.43) is noticed in the eastern and south eastern portions of the study region whereas it is low in the northern and northwestern segment (Figure 5e). High DD and NDVI bear higher priority and vice-versa. Relatively high DD and NDVI create more natural beauty which bears natural charm for tourists. So, in both cases higher DD and NDVI class is coded with higher priority value.
Figure 5. Physical parameters: a) Geology, b) Relief, c) Slope, d) Aspect, e) Drainage density and f) Normalized Difference Vegetation Index (NDVI)
4.1.3 Social Parameter (S)
Five indicators are considered under the Social (S) category. Percentage of literacy is highest (>75%) at Kotulpur block. Literacy Rate (%) belongs to 73% to 75% at Bankura-II, Jaypur, Khatra and Sarenga block. Literacy rate is lowest at Saltora and Hirbandh block (Figure 6a). Remaining C.D. blocks are noticed with 66% to 72% literacy. As literacy rate has direct influence, so in this research literacy rate is categorized into 5 classes and the highest class is assigned with the highest weightage or importance (Code 9). Other classes are rated as 5 (61.45-65), 6 (65-68), 7 (68-72) and 8 (72-75), respectively. 49% to 73% outmigration is noticed in Saltora, Chattna, Bankura-I, Indpur, Hirbandh, Khatra and Ranibandh block. About 36% to 48% outmigration is noticed in the Onda, Bishnupur and Jaypur block. Remaining C.D. blocks are noticed with less than 35% outmigration rate (Figure 6b). Immigration of people has positive influence on tourism (Sánchez-Rivero et al., 2014). Thus, in this research lowest class of migration is assigned with the lowest weightage (Code 1) and the highest class is identified with highest weightage (Code 9). The population density is highest at the Bankura-II, Kotulpur and Indus C.D. block and it is lowest at the Ranibandh block. Remaining blocks are observed with 367 to 632 population density (Figure 6c). Highly dense population generally discourages the attraction of tourist place (Figure 6c). Keeping the above view in mind, highest population density class is assigned with lowest weightage (Code 1) and the lowest population density class is marked with the highest weightage (Code 9). According to the Census of India (2011), Overall Bankura district is noticed with 523 persons/sq.km which is far high than the national average (population density 382 persons/sq.km.). Population Growth Rate (PGR) is high (above 13) at the Chattna, Bankura-II, Onda, Indpur, Hirbandh, Khatra, Mejhia, Bishnupur and Raipur block. 2% to 12% population growth is observed at the Saltora, Gangajalghati, Barjora, Indus and Jaypur C.D. block. Less than 2% population growth rate is observed only in the Patrasayar C.D. block (Figure 6d). High population growth rate hampers a balanced growth in tourism sector. Thus, the highest class of population growth rate (14-16) bears the lowest weightage or priority (Code 1) and lowest class of population growth rate (1.57-2) bears highest weightage (Code 9). 968-975 sex ratio is observed in the Taldangra, Ranibandh and Sarenga block. The 960- 967 sex ratio is observed in the Chattna, Bishnupur, Patrasayar and Raypur block. Low sex ratio (934-943) is observed at the Gangajalghati, Mejhia and Indpur block. Higher sex ratio denotes balanced social structure which creates a positive vibe in the tourism sector (Jayachandran, 2015; Granovetter, 2005). Overall, the sex ratio is divided into five classes and the highest sex ratio class (967-975) is assigned with higher importance or weightage (Code 5) and the lowest class of sex ratio (934-943) is coded assigned with lower weightage (Code 1). Social Carrying Capacity (SCC) is high (7-13) at Saltora, Mejhia, Bankura-II, Bankura-I, Khatra, Ranibandh and Raipur block (Figure 6f). Barjora, Chattna and Onda block are noticed with relatively low SCC value (4-5). Remaining C.D. blocks are noticed with 5 to 7 SCC value. Higher SCC value denotes higher carrying capacity thus, reclassified highest SCC class is identified with relatively higher weightage and vice-versa. Here, SCC has been classified into four classes. 10 to 13 SCC class is assigned with 7 and the lowest class 4 to 5 is assigned with 1.
Figure 6. Social factors: a) Percentage of Literacy (LI), b) Volume of Migration (MG), c) Population Density (PD), d) Population Growth Rate (PGR), e) Sex Ratio (SR), f) Social Carrying Capacity (SCC)
4.1.4 Economy Parameter (E)
Five indicators are considered under Economy (E). The percentage share of main worker (MW) (Figure 7a) is high in the Barjora, Patrasayar and Kotulpur C.D. blocks whereas it is low in the Gangajalghati, Chattna, Indpur, Hirbandh, Hirbandh, Khatra, Taldangra, Simlipal and Sarenga C.D. blocks of the study region. On the contrary the percentage share of marginal worker (MG) is high (above 22%) in the Hirbandh, Ranibandh and Raipur C.D. blocks of the study region (Figure 7b). The percentage share of total worker (TW) (Figure 7c) is relatively higher (above 48%) in the Saltora, Bankura-II, Indpur, Hirbandh, Ranibandh, Patrasayar, Jaypur and Kotulpur blocks. Percentage share of Per capita Net Domestic Product (NDP) (Figure 7d) varies from 2% to 8% within the district. NDP is observed at the highest rate (>6.26%) in Barjora, Ranibandh and Sarenga C.D. block. All parameters within Economy are in the direct relationship with tourism. Thus, the reclassified classes of all variables under E are coded according to increasing priority. As the class value of every indicator is increasing, priorities are also increasing and vice-versa. Table 5 illustrates the priority of every subclasses of individual parameter. The matrix is coherent in every situation since the consistency ratio is 0.1.
Figure 7. Economic Factors: a) Main Worker (MW), b) Marginal Worker (MG), c) Total Worker (TW), d) Net Domestic Product (NDP) (2012-13) of Hotel and Restaurant sector in constant prices at 2004-05
4.1.5 Amenities (AN)
The spatial assessments of different amenities are presented in figure 8. Four indicators are considered in the AN. Abundance of required amenities will increase tourism potentiality value of the study region (Blancas et al., 2011). The medical facilities are comparatively high for the Chhatna and Kotulpur C.D. blocks. On the other hand, it is comparatively low at the Mejhia, Hirbandh, and Sarenga C.D. blocks (Figure 8a). Here, the medical facilities (M) are subdivided into 4 classes and priority rises when the class value rises, and vice- versa. Drinking water facilities (DW) are comparatively high at the Chhatna and Onda C.D. blocks and it is low for the Mejhia and Hirbandh C.D. blocks (Figure 8b). Drinking water facilities are also classified into 4 classes and as the class value increases priority also increases and vice-versa. The facilities of the post offices are the highest at the Hirbandh C.D. block and it is comparatively low for the Mejhia and Sarenga C.D. blocks (Figure 8c). Here, facilities of the post offices are subdivided into 4 classes and priority rises when the class value rises, and vice-versa. Chattna and Onda C.D. blocks are noticed with comparatively better power supply facilities (>215) (Figure 8d). On the other hand, Hirbandh and Mejhia C.D. blocks are noticed with poor power supply facilities. Like other variables, priority raises when the class value rises, and vice-versa.
Figure 8. Amenities: a) Medical Facilities (M), b) Drinking Water Facility (DW), c) Post Office Facility (PO), d) Telephone Facility (TF)
4.1.6 Environmental Quality (EQ)
The Air Quality Index (AQI) of Bankura is 122 which indicate moderate pollution level. Only Khatra records with AQI value 58. The blocks situated at the northern portions (~47% of the total area) of the region are observed with higher AQI value. In most of the cases Water quality Parameters are in lower to medium range which means those have not exceeded permissible limit prescribed by WHO.
4.1.7 Diversity of Local Art and Craft (LAC′)
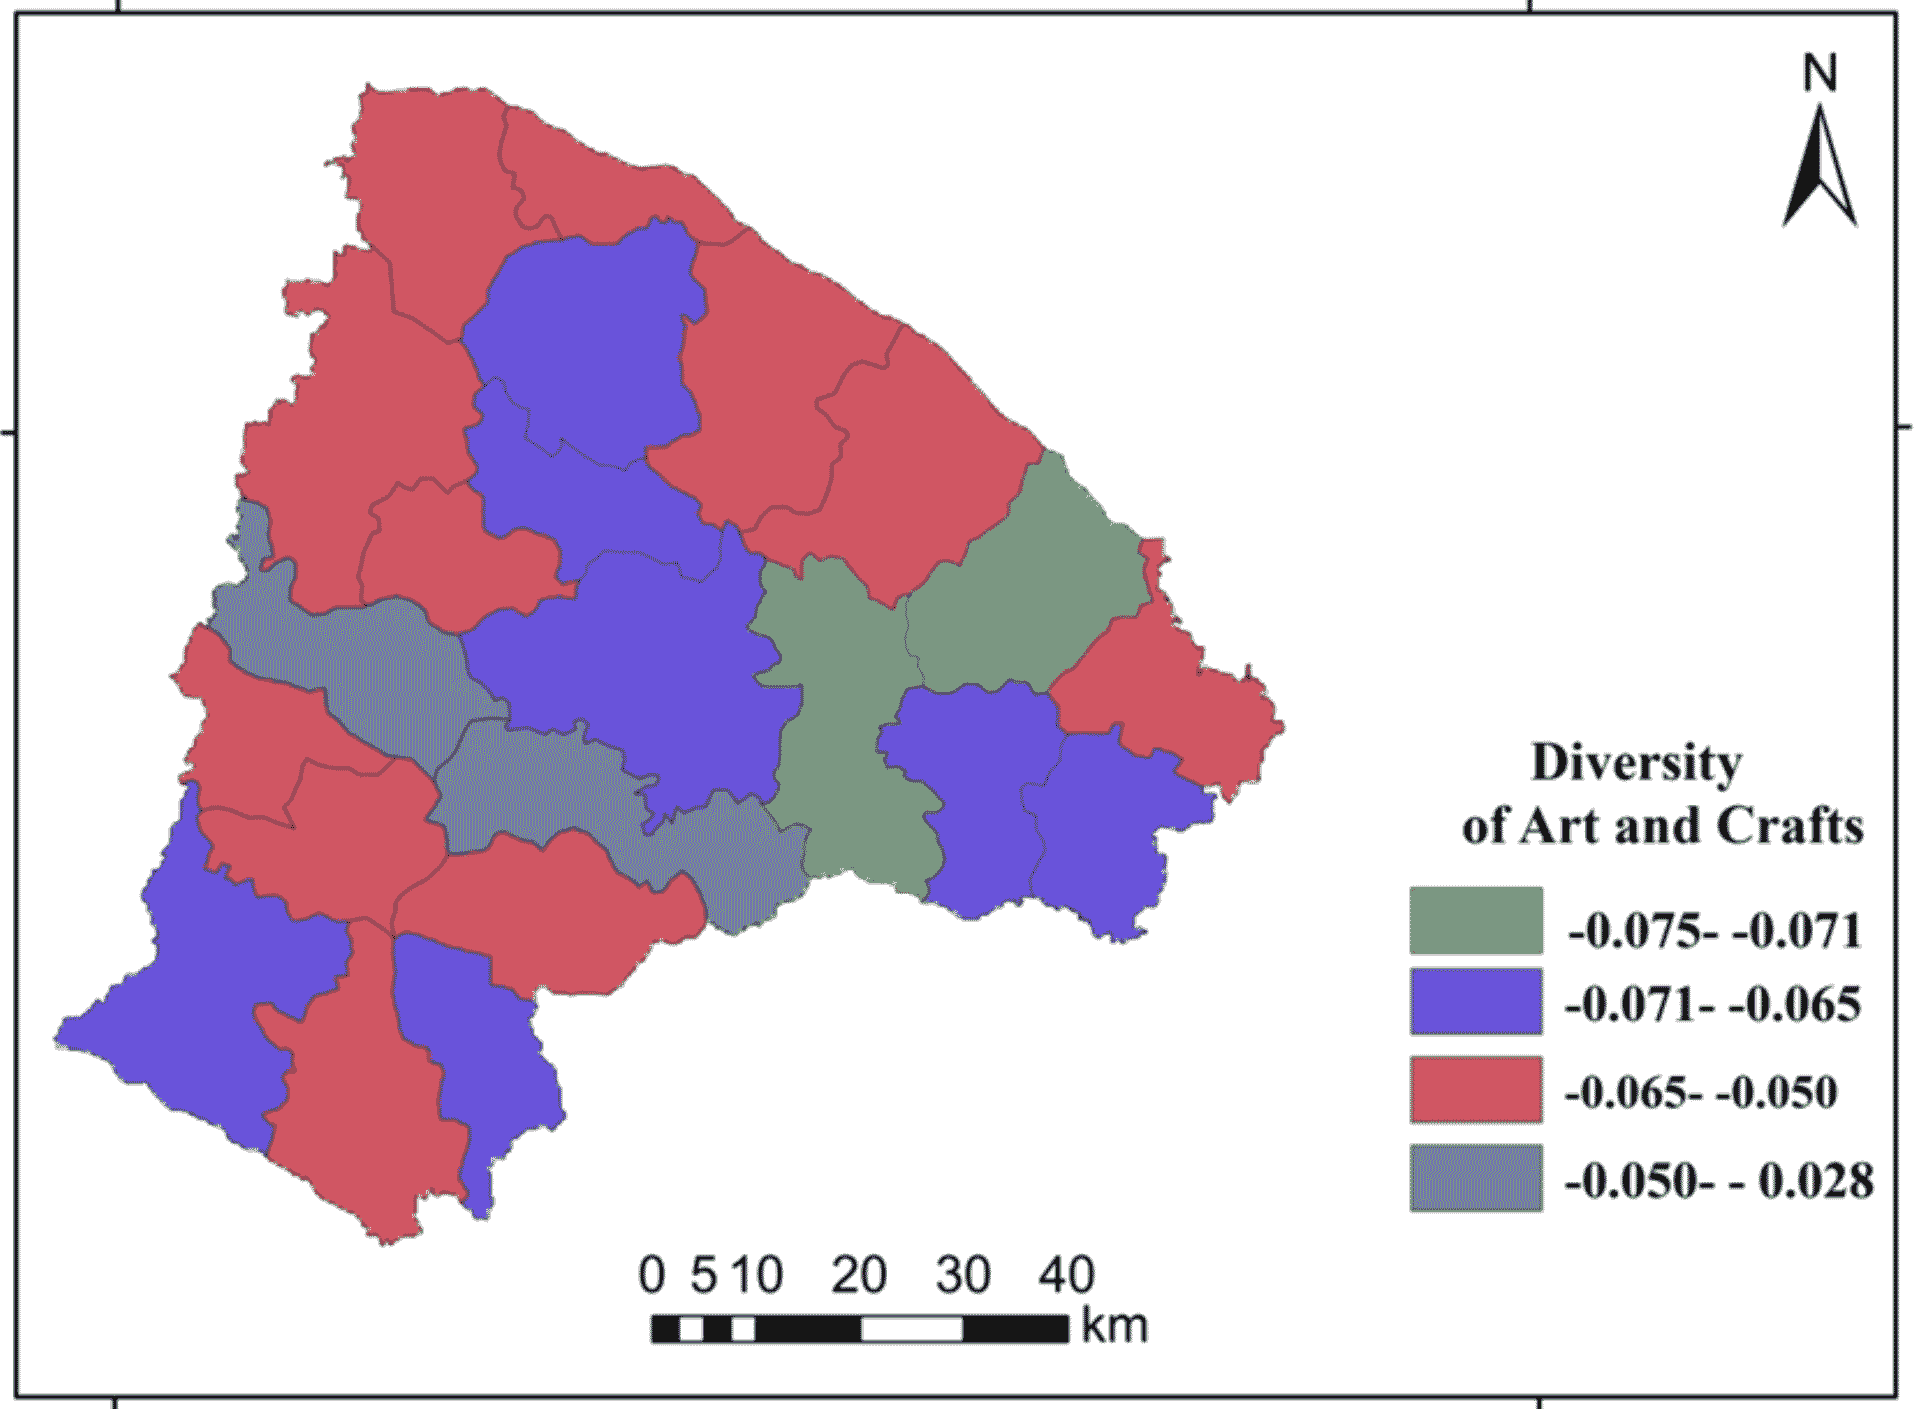
Diversity in LAC is high in the Bishnupur and Sonamukhi C.D. block. Lowest diversity is found in Hirbandh and Taldangra C.D. block. -0.050 to -0.650 diversity is observed in Saltora, Mejhia, Chattna. Bankura-II, Barjora, Sonamukhi, Indus, Khatra Hirbandh, Similipal and Raipur C.D.block. Remaining C.D. blocks are observed with -0.071 to -0.065 diversity value (Figure 9). Bishnupur subdivision having more diversified LAC (-0.065 to -0.075). More diversity refers more types of art and crafts and less diversity includes the counter. Terra-Kotta, Pottery, Dokra, Wood Carving, Cunch Shell, Stone Carving, Bamboo Craft, Bel Metal, Bel Fair, Dasabatar Playing Cards, Lanters, Baluchari Sari, Tasar Silk, Design in Gamccha, Design in Towel, Design in Kaccha Dhuti are the typical arts and crafts exist in Bankura. Except wood carving all the above arts and crafts are available in Bishnupur. Patrasayar is identified with all above mentioned art and craft. Indpur and Taldangra C.D. block are observed 4 (Bel metal, Bel mala, Dasabatar and Lanters) and 7 (Design in Kaccha Dhuti, Tasar Silk, Baluchari Sari, Bamboo craft, Crunch Shell and Playing cards) types of art and craft respectively. Wood carving, Stone carving, Bamboo craft and Bel metal are identified in Indpur C.D. block. Other C.D. blocks are noticed with 10 to 13 types of arts and crafts. The overall LAC diversity value is 1.33. Overall 95% LAC diversity exists within the district.
Figure 9. Local Art and Crafts (LAC)
4.2 Weighted Overlay of Variables
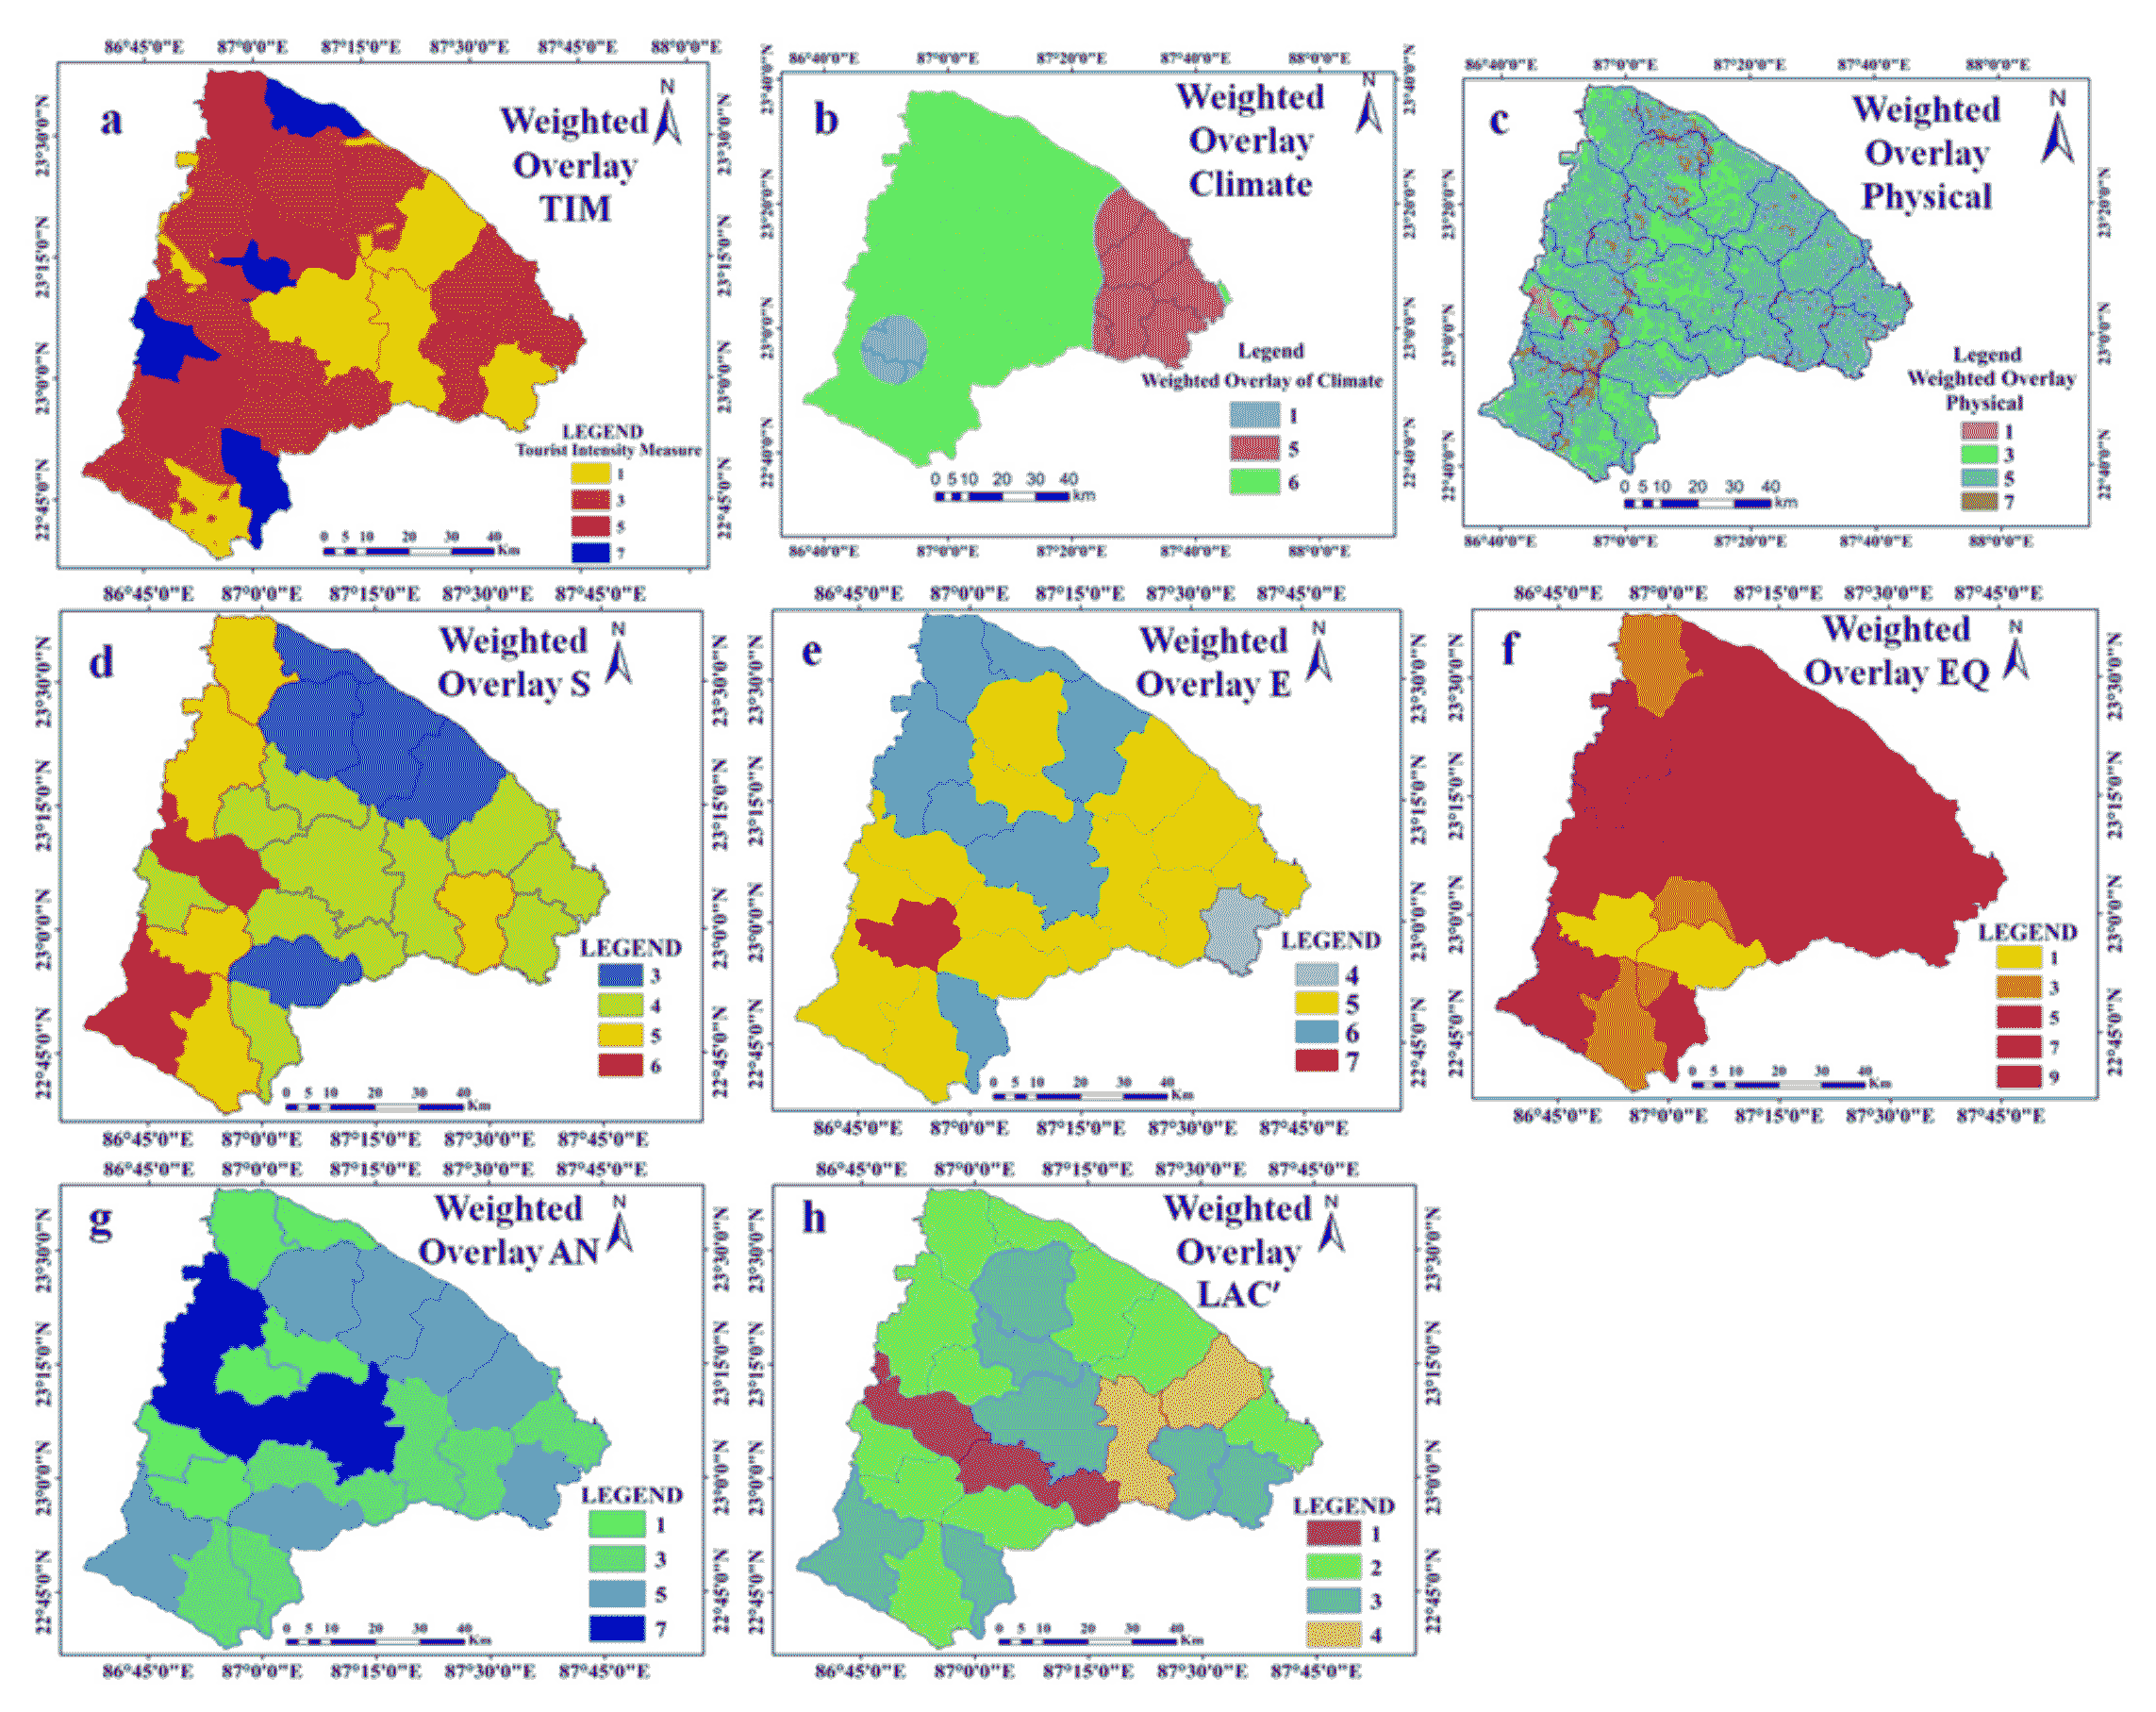
Figure 10 shows the weighted overlay of several sub-parameters. Tourism Intensity Measure (TIM) is reclassified into 4 classes (Figure 10a). TIM is in the positive relationship with tourism potentiality. Thus, TIM is reclassified into 4 classes and they are rated as 1 (27.07% area), 3 (48.51% area), 5 (14.63% area) and 7 (9.78% area), respectively. Category 1 is concentrated in Onda, Bishnupur, Patrasayar, Kotulpur and Raypur C.D. block. Category 5 (Strong importance) and 7 (Very strong importance) are concentrated in Mejhia, Bankura-I, Bankura-II, Hirbandh and Sarenga C.D. block. Rests are identified within category 3. Climatic (C) weighted overlay is reclassified into 3 sub-categories and they are labeled as 1 (4.92% area), 5 (18.42% area), and 6 (76.65% area), respectively (Figure 10b). Southwestern portions of the district are observed with the equal importance (Code 1), eastern and middle portions are observed with moderate to strong importance (Code 3 and 5). Category 1 dominates in the Southern patch (near Mukutmanipur Tourist Spot) and Category 5 dominates in the Eastern portion of the study area (near Samudrabandh and Jayrambati tourist spot). Physical (P) is reclassified into 5 individual classes and they are labeled as 1 (0.69% area), 3 (6.28% area), 5 (42.43% area), 7 (44.96% area) and 9 (5.63% area) (Figure10c). Social (S) is reclassified into 4 categories and they are labeled as 3 (23.87% area), 4 (41.91% area), 5 (23.56% area) and 6 (10.66% area) according to their importance (Figure 10d). Category 3 dominates in the Mejhia, Gangajalghati, Barjora and Taldangra C.D.Block. Category 5 (Strong Importance) and 6 (Strong to Very Strong Importance) dominates in the Saltora, Chattna, Raypur, Jaypur, Ranibandh and Hirbandh C.D. block. Similarly, weighted overlay of Economy (E) are reclassified into 4 (3.28% area), 5 (60.19% area), 6 (32.88% area) and 7 (3.65% area) category (Figure 10e). With respect to Economy (E) Strong to Very Strong importance (Code 6 and 7) is given to Saltora, Chattna, Bankura-I, Onda, Mejhia and Barjora C.D. block. Moderate to Strong Importance (with respect to economy, Code 4 and 5) is provided to Gangajalghati, Bankura-II, Indpur, Ranibandh, Hirbandh, Indpur, Taldangra, Simlipal, Bishnupur, Kotulpur, jaypur, Indus, Patrasayar, Sonamukhi and Barjora C.D. block. Environmental Quality (EQ) is reclassified into 1 (8.04% area), 3 (12.84% area), 5 (37.88% area),7 (28.21% area) and 9 (13.02% area) category (Figure 10f). With respect to EQ, extreme importance is provided to Chattna and Ranibandh C.D. block. Strong (Code 5) importance is provided to Mejhia, Gangajalghati, Barjora, Sonamukhi, Jaypur and Indus C.D. block. Very strong importance (Code 7) is assigned to Bankura-I, Bankura-II, Onda, Bishnupur, Indpur and Hirbandh C.D. block. The weighted overlay of Amenities (AN) is reclassified into four categories and they are labeled as 1 (19.33% area), 3 (26.28% area), 5 (35.77% area) and 7 (18.63% area) (Figure 10g) according to their importance. Strong to Very Strong importance (Code 5 and 7 with respect to AN) is observed at Gangajalghati, Barjora, Sonamukhi, Patrasayar, Kotulpur, Ranibandh and Simlipal C.D. block. Diversity in local art and craft (LAC′) is recoded as 1 (9.38% area), 2 (42.94% area), 3 (32.89% area), and 4 (10.98%) according to their priority (Figure 13h). With respect to LAC′ moderate to strong importance is provided to Bishnupur, Gangajalghati, Bankira-II, Jaypur, Kotulpur, Onda, ranibandhm Sarenga and Patrasayar C.D. block (Figure 10h).
Figure 10. Weighted Overlay of Parameters: a) Tourism Intensity Measure (TIM), b) Climate (C), c) Physical (P) d) Social (S), e) Economy (E), f) Environmental Quality (EQ), g) Amenities (AN), h) Local Arts and Crafts (LAC)
4.3 Tourism Potentiality Zones (TPZ)
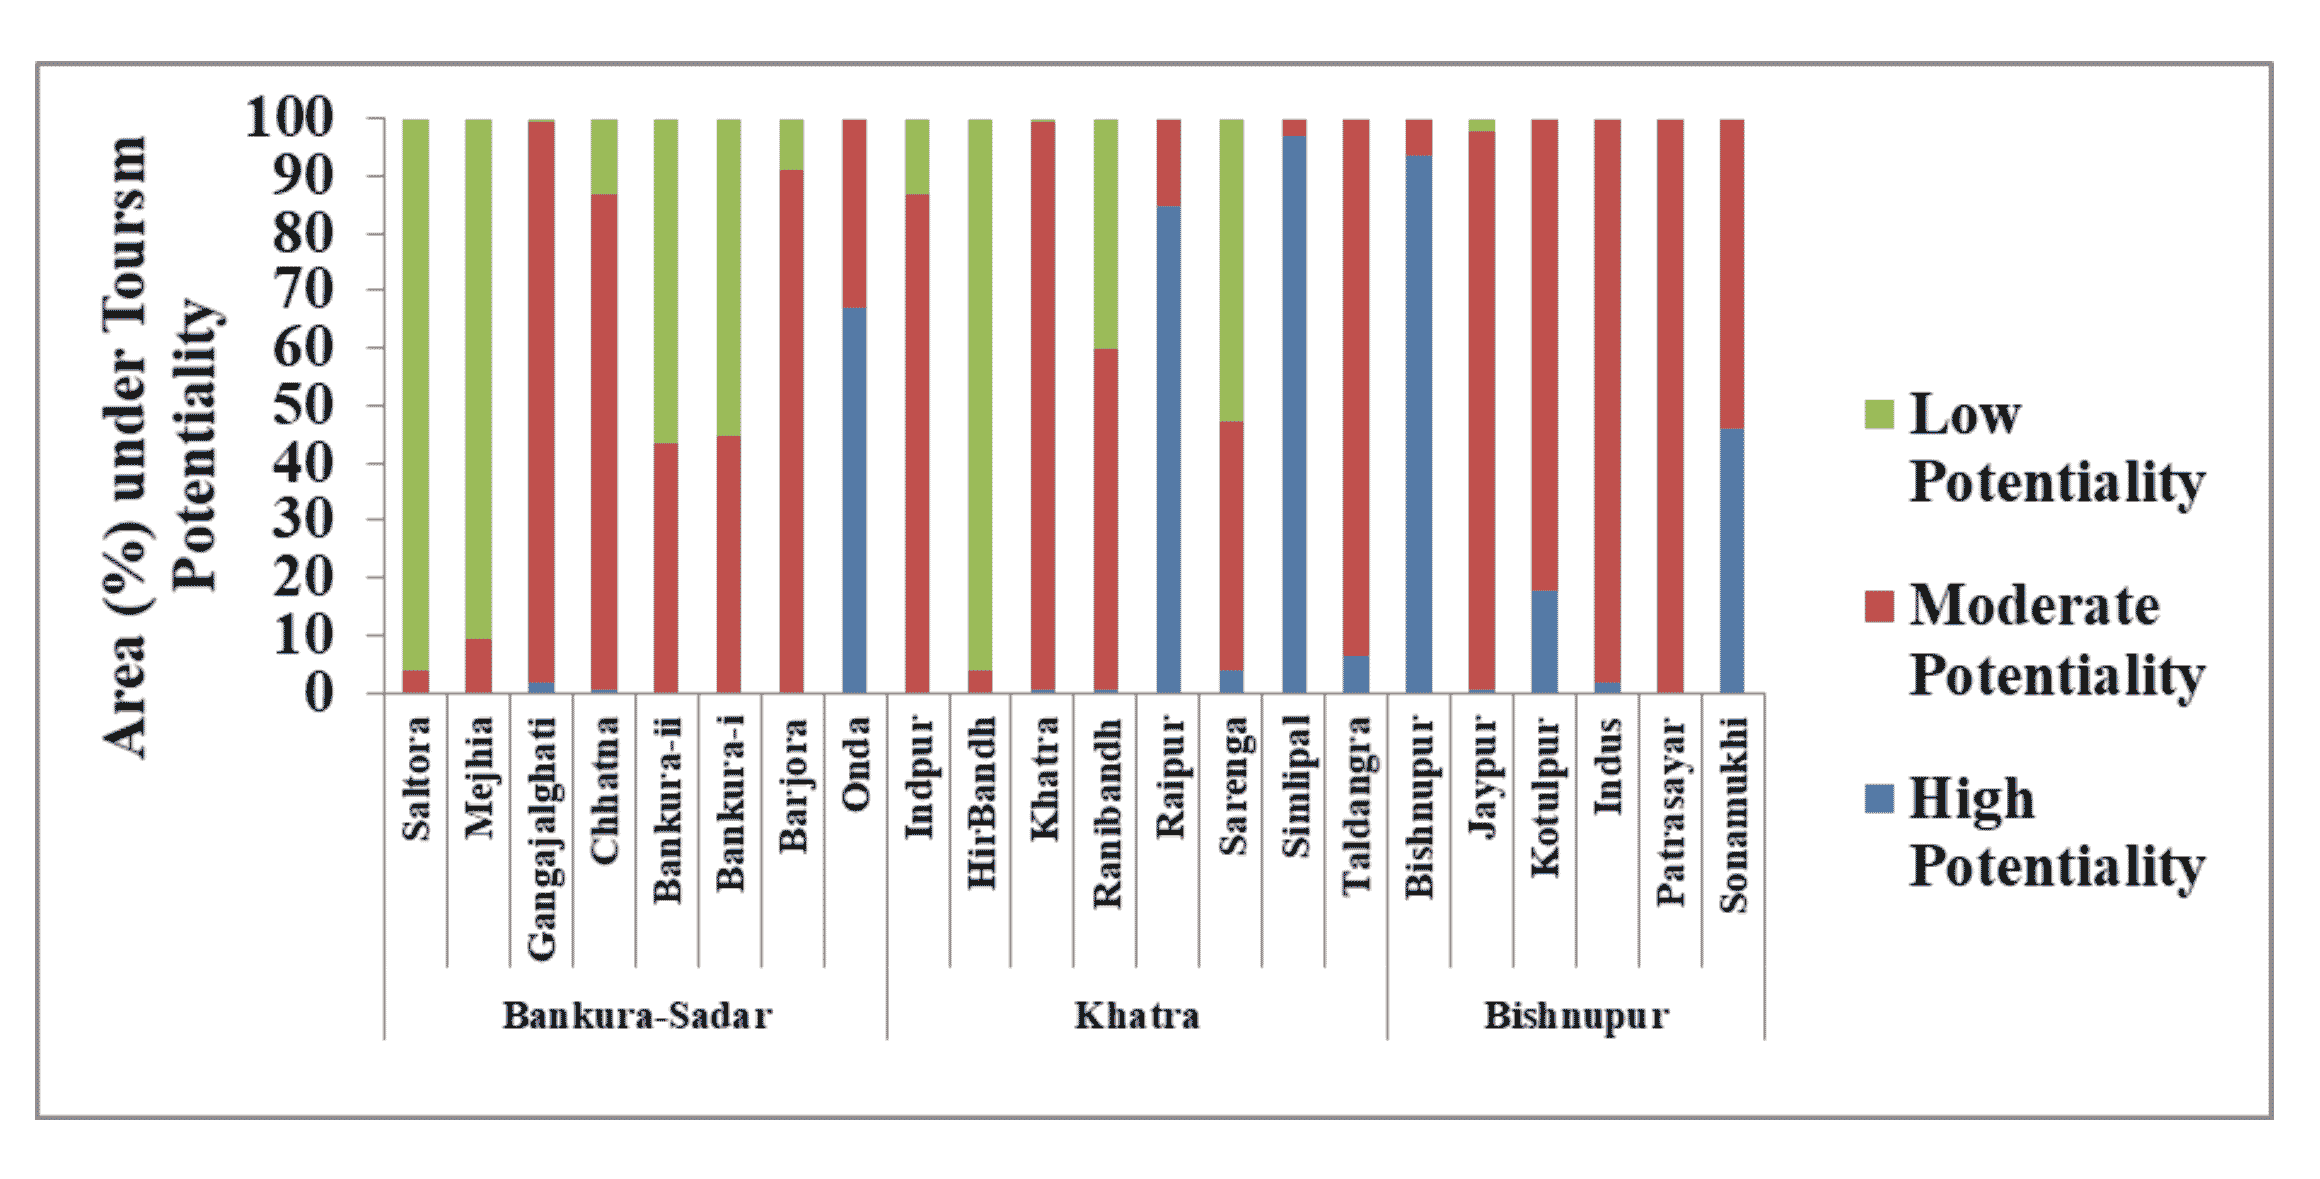
All 8 variables are used to determine the final tourism potentiality of Bankura District (Figure 11). Overall, high tourism potentiality (23.30% area) is scattered in Onda, Bishnupur, Sonamukhi, Taldangra, Simlipal, Kotulpur and Raipur C.D. block. Low tourism potentiality (17.92% area) is also scattered at Saltora, Mejhia, Chattna, Bankura-II, Bankura-I, Indpur, Htrbandh, Ranibandh, and Sarenga C.D. block. About 58.74% area is observed under moderate tourism potentiality. Above 58.74% area under Patrasayar, Jaypur, Indus, Kotulpur, Ranibandh, Chattna, Gangajalghati and Khatra C.D. block are noticed with moderate tourism potentiality. Under the Bankura Sadar sub-division, approximately 96.09% area of Saltora C.D. block is observed under moderate tourism potentiality and only 3.90% area is observed under low tourism potentiality (Figure 13). One hill based tourist spot (Biharinath Hill), one fair and 12 handicraft centres (concentrated in southwest portions of the district) exist in Saltora C.D. block. On the contrary, Mejhia C.D. block experiences a complete reversal picture (Figure 15b). 90.50% area of this C.D. block is observed under low tourism potentiality and 9.49% area is observed under moderate tourism potentiality. 4 hill based tourist spot (Ardhagram, Barjagram, Kustora, Ramchandrapur), 1 historical tourist spot (Mejhia town which is eminent from British Raj) and one temple (Durga temple and Tusu Parab) exist in Mejhia C.D. block. About 97% area of Gangajalghati C.D. block is observed under moderate tourism potentiality. About 1% area of this C.D. block is observed under low tourism potentiality. Almost 2% area of this C.D. block is observed under high tourism potentiality (Figure 11). One hill based (Amarkanan), one water based (Amarkanan water park), several temple based tourist spots (Gokulchand temple, Bahulara ancient temple) exist in Gangajalghati. Over 90.90% area of Barjora C.D. block (Figure 11) is noticed with moderate tourism potentiality. About 9.09% area of this C.D. block is observed under low tourism potentiality. About 1% is observed under High tourism potentiality. Famous Shiva temple, Gajan fair, Kali Utsav, Karam Parab, Sikar Utsav are identified at Barjora. About 14 major handicraft centres are concentrated in the southwestern portion of the Barjora. About 86.12% area of Chattna C.D. block is observed under moderate tourism potentiality (Figure 11). About 13.23% area is observed under low tourism potentiality. Only 0.65% area is observed under high tourism potentiality. 2 fair are festivals (Gajan fair and Tusu Parab), 2 eminent temples (Shiva temple and Katyaani temple), 1 hill based tourist spot (adventure tourism in Susunia hill) and about 10 handicraft centers exist (concentrated in the southeastern portions) in Chattna C.D. block. In Bankura-II C.D. block about 56.45% area is observed under low tourism potentiality and 43.54% area is observed under low tourism potentiality (Figure 11). About 55.45% area of Bankura-I C.D. block is observed under low tourism potentiality, 44.54% area is observed under moderate tourism potentiality (Figure 11). 3 hill based tourist spots, 4 handicraft centers (Terra Kotta, famous horse, ashtray, Baluchari Sari), 4 historical tourist spots and 2 eminent temples (Durga temple, Viswakarma temple) are observed in Bankura-I and Bankura-II C.D. block. In Onda C.D. block, 67.01% area is observed under low tourism potentiality and 32.98% area is observed under moderate tourism potentiality (Figure 11). 2 established temples (Durga temple and Kali temple) and one festival are noticed in this C.D. block. These handicraft centers include Baluchari Sari making, Dhuti design, Bel metal making, Tasar Silk making, Gancha design, Bamboo craft making, playing cards, Dasabatar, Crunch Shell and towel design.
Figure 11. Tourism Potentiality Zone (TPZ)
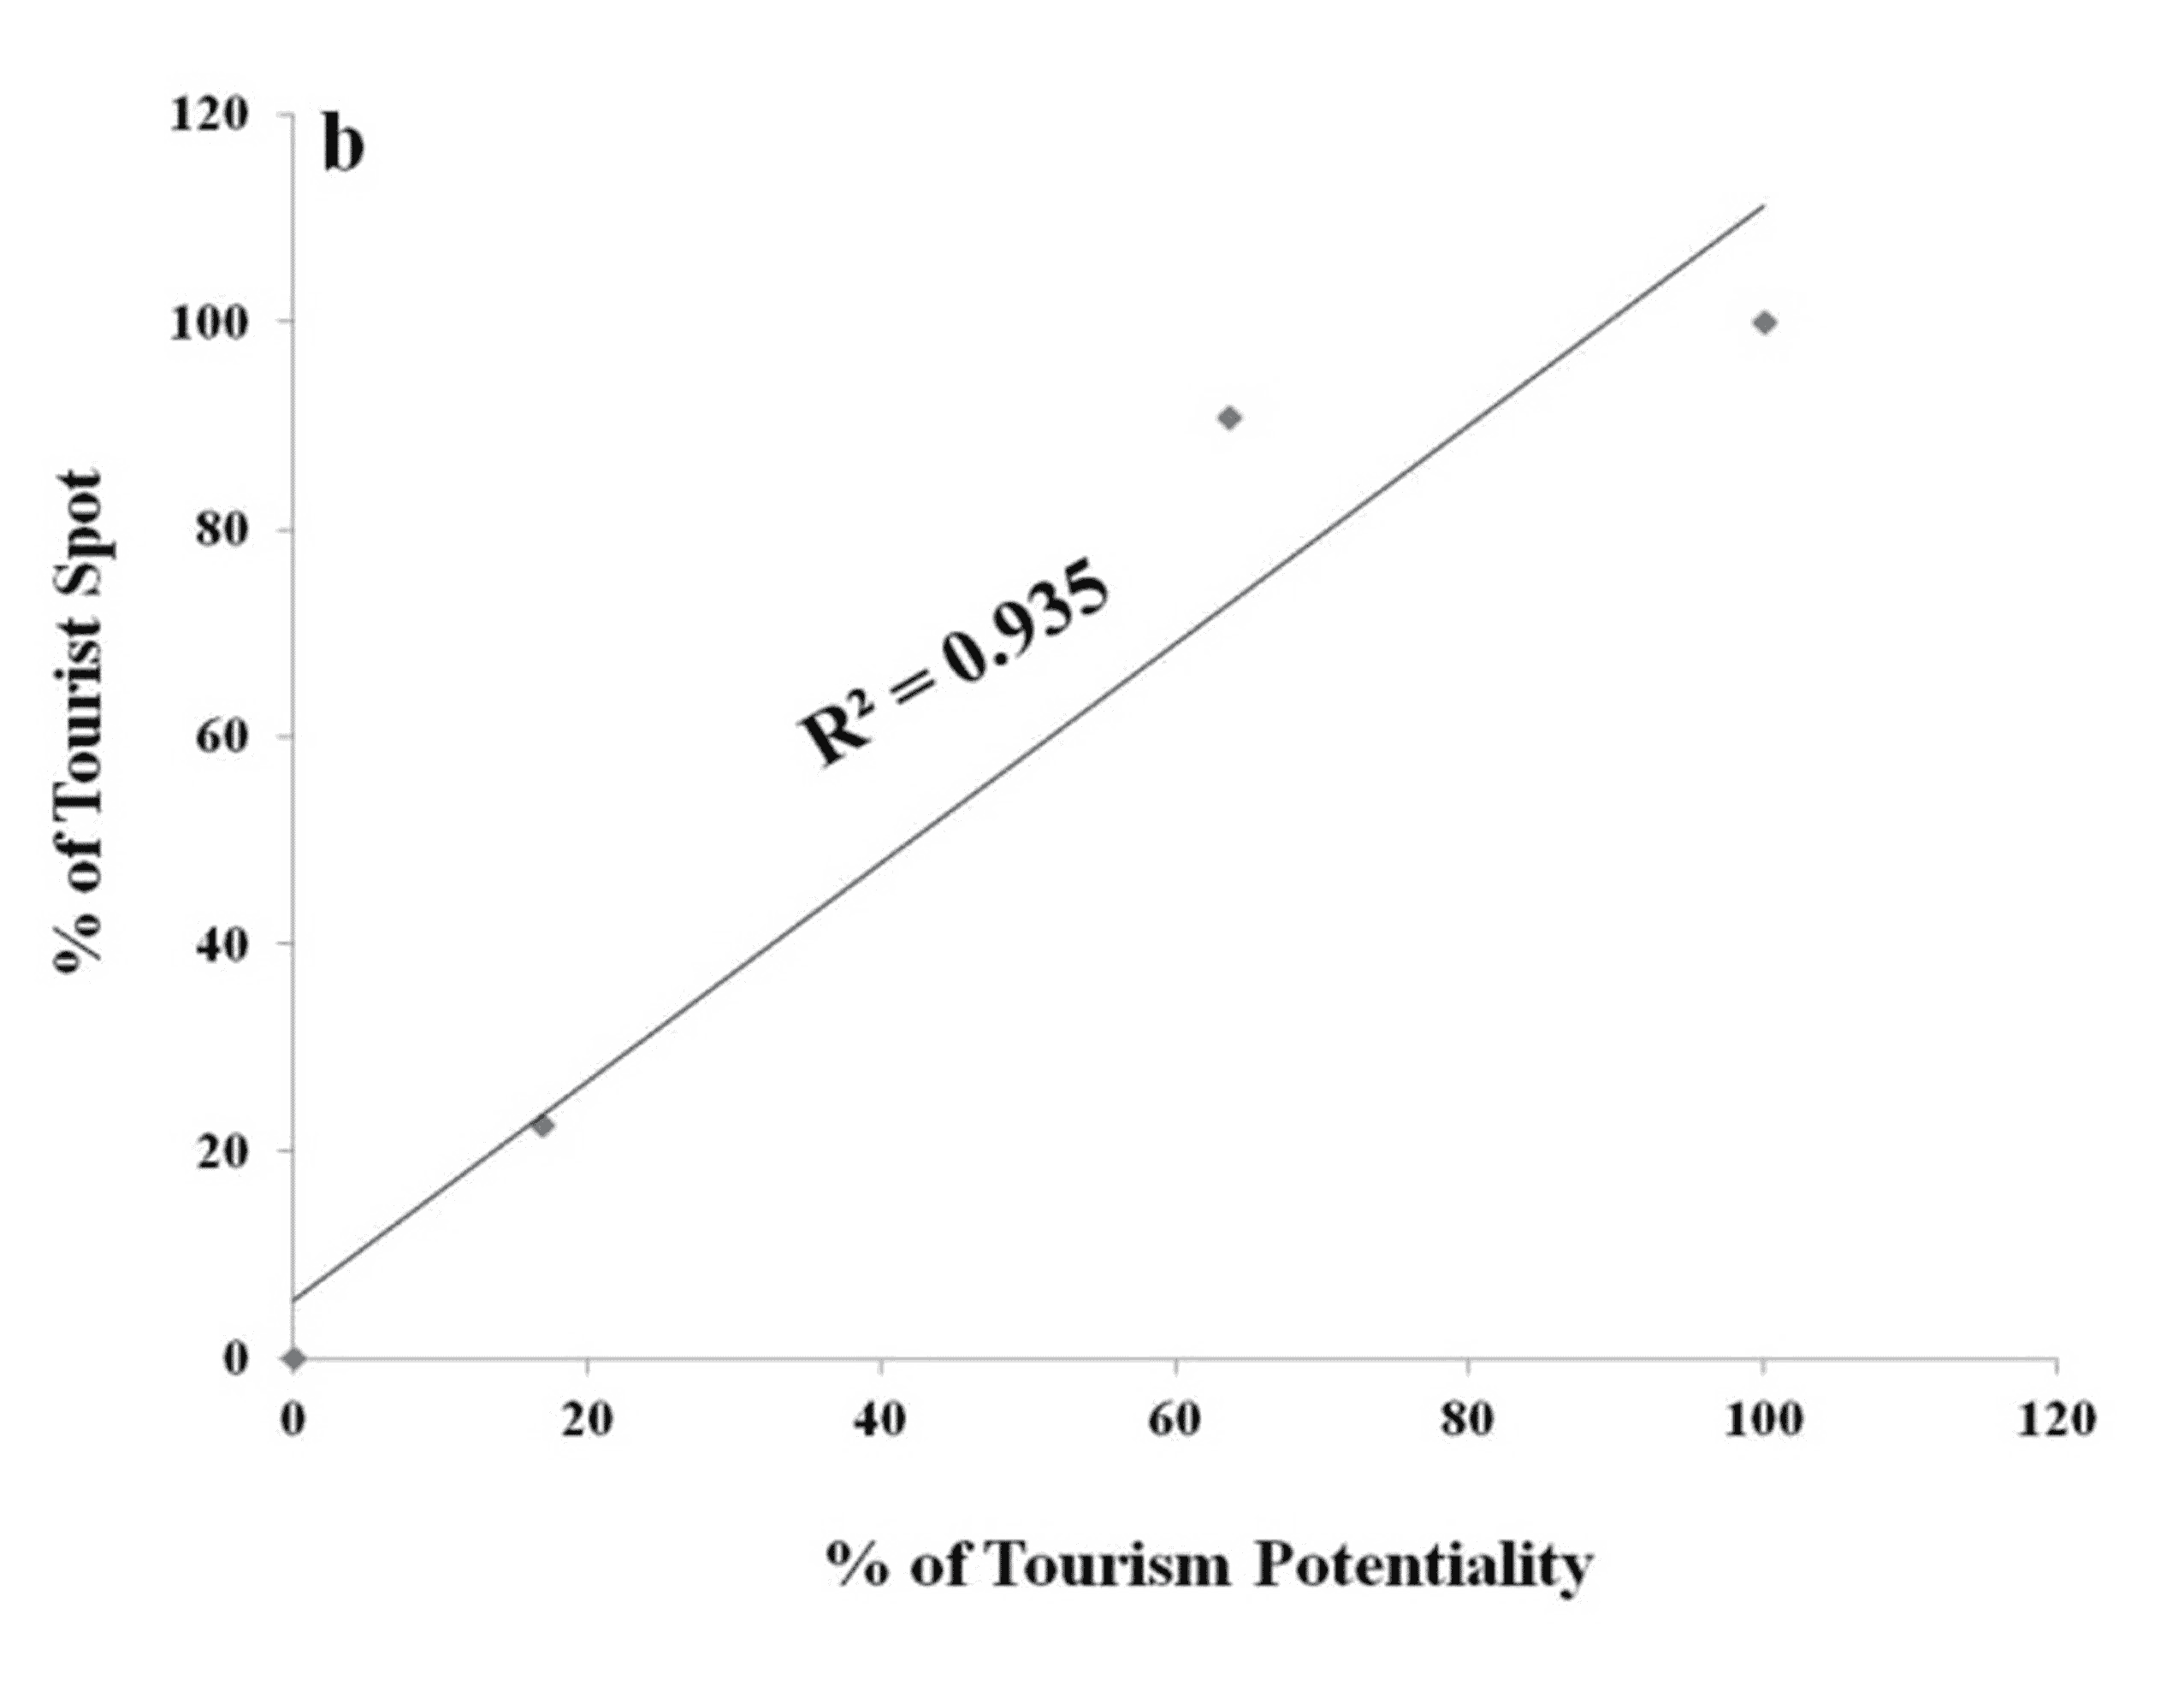
Figure 12. R2 shows considerably good accuracy (0.91) of the predicted tourism potentiality zone
About 53.84% area of Sonamukhi C.D. block (under Bishnupurs subdivision) is observed under moderate tourism potentiality and 46.14% area is observed under high tourism potentiality (Figure 11). This C.D. block is observed with two major fairs and festivals (one festival is related to Bhadu and another is Tusu) observed in post monsoon season. Almost 100% area of Patrasayar C.D. block is noticed with moderate tourism potentiality (Figure 11). 82.12% area of Kotulpur C.D. block is noticed with moderate tourism potentiality whereas the remaining areas are under the high tourism potentiality. There are few temples (concentrated in middle and eastern portions of the Kotulpur C.D. block), one historical and one established tourist spot in Kotulpur C.D. block (Jayrambati tourist spot which is famous for the birth place of Maa Sarada Devi who was the wife of Sri Sri Ramkrishna Paramhangsha Deva). Few temples include Pancharatna Temple, Sri Sri Laxminarayan Jew temple, Sri Bhairab Thakur Jew temple, Sri Ganesh Jew temple. Every year local people celebrate Jhulan Yatra in these temples. Koalpara is observed as the historical tourist spot in this C.D. block. Joyrambati is the established tourist spot in this C.D. block. In the Jaypur C.D. block (Figure 11) about 96.86% area is observed under moderate tourism potentiality, 0.69% area is under high tourism potentiality and 2.44% area is observed under low tourism potentiality. Several handicraft centers and a local water based tourist spot are observed in this C.D. block. Indus C.D. block is noticed with several handicraft centers which exist in the Western sections of the study region. About 98.34% area of this C.D. block is observed under moderate tourism potentiality and 1.65% area is noticed with high tourism potentiality. 6.55% area of Bishnupur C.D. block is observed with moderate tourism potentiality. Bishnupur is known as the temple city of Bankura. Temples are located in the Midwestern portions of Bishnupur C.D. block. Pancharatna Temple, Jorbangla Temple, Raghunathiju Temple, Madanmahan Temple, Gour Netai Temple, and Keshab Rai Temple exist in the Bishnupur C.D. block.
In the Khatra sub-division, about 93.57% area of Taldangra C.D. block is observed under moderate tourism potentiality and 6.42% area of it is observed under high tourism potentiality (Figure 11). The Taldangra C.D. block is observed with water based tourist spot, temples and handicraft centers. About 43.38% area of Sarenga C.D. block is observed with moderate tourism potentiality, 3.71% area is under high tourism potentiality and 52.89% area is observed under high tourism potentiality (Figure 11). There exist 1 established, 3 water based and some handicraft centers in Sarenga. About 59.49% area of Ranibandh C.D. block is observed under moderate tourism potentiality. 0.46% area is observed under high tourism potentiality and 52.89% area is observed under low tourism potentiality (Figure 11). About 84% area under Raipur C.D. block is observed under high tourism potentiality (Figure 11). In Khatra C.D. block 15.50% area is observed under moderate tourism potentiality. Existence of some handicraft centres is identified in Khatra C.D. block. 86.40% area of Indpur C.D. block is noticed with moderate tourism potentiality and 13.29% area is identified as low tourism potentiality. Indpur C.D. block has few handicraft centers and one special festival (e.g. Gajan Fair). 4% area of Hirbandh C.D. block is observed under moderate tourism potentiality and 96% area is observed under low tourism potentiality. About 96% area of Simlipal C.D. block is observed under high tourism potentiality, and 3.31% area is under moderate tourism potentiality. One major fair and festival (Dussera fair) is noticed in Simlipal C.D. block. Terra-Kotta, Pottery, Dokra, Wood Carving, Cunch Shell, Stone Carving, Bamboo Craft, Bel Metal, Bel Fair, Dasabatar Playing Cards, Lanters, Baluchari Sari, Tasar Silk, Design in Gamccha, Design in Towel, Design in Kaccha Dhuti are the typical arts and crafts exist in different C.D. blocks of Bankura District.
Figure 13. Area (%) under tourism potentiality of different blocks
4.3.1 High and Moderate Tourism Potential Zone
Overall, 23.33% area and 68% area in the Bankura district is denoted with the high and moderate potential zone for the tourism. The features of these two zones are illustrated as follows:
The high and moderate TPZ are denoted with comparatively higher TIM value. The road density, road proximity, average length of stay and hotel density are moderate to high in these portions of the study area.
Overall, the climatic condition is suitable in these sections of the study area. There is a suitable interaction between the maximum temperature, minimum temperature, precipitation and relative humidity of the study area.
On a whole, these sections experience the balanced sex ratio, balanced population density, balanced migration rate and balanced population growth rate.
Overall, NDP is high in these sections of the study area; the occupational structure (i.e., the ratio of main worker, marginal worker and total worker) are also balanced in these portions of the study area.
The environmental quality is balanced and suitable for the growth of the tourism.
The diversity of art and craft are also dominated in these sections; which are attracted by the tourists.
The facilities of drinking water, medical, post office and telephonic facilities are also attracting several tourists in these sections of the study area.
4.3.2 Low Tourism Potential Zone
1) The low TPZ is denoted with comparatively low TIM value. The road density, road proximity, average length of stay and hotel density are comparatively low in these portions of the study area.
2) Overall, the climatic condition is not suitable in these sections of the study area.
3) On a whole, these sections experience the imbalanced sex ratio, imbalanced population density, imbalanced migration rate and imbalanced population growth rate.
4) Overall, the NDP is low in these sections of the study area; the occupational structure (i.e., the ratio of main worker, marginal worker and total worker) are also imbalanced in these portions of the study area.
5) The environmental quality is not pure and not suitable for the growth of the tourism.
6) The diversity of art and craft are also scattered in these sections; which are attracted by the tourists.
7) The facilities of drinking water, medical, post office and telephonic facilities are also low which cannot attract the tourists in these sections.
4.4 Validation of Tourism Potentiality Map
Appraisal of precision of output models as a result of multi-criteria decision making is one of the most important parts (Das, 2020). In this case, R2 is the important attribute to be dealt with. R square value 1 is considered as the most accurate precision, without any biased effect. Tourism potentiality increases with increasing number of tourist spots over a particular region (Ferdaush and Faisal, 2014). Here tourist spots include, temple based, potential historical, hill based, handicraft centers, fairs and festivals, established and water-based spot (Figure 11). Cumulative percentage of tourist spot and cumulative percentage of tourism potentiality (pixel count) have been plotted and the R square value is observed as 94% (Figure 12) which means the tourism potentiality zone is fairly accurate. Thus, the result presented here is acceptable without any hesitation.
5 . DISCUSSION
The results discussed in this research paper have several contributions in the discipline of travel and tourism. Those are as follows:
Firstly, this research has discussed the tourism potentiality of the Bankura district; which is historically a popular and well-known tourist spot in the West Bengal. But unfortunately, no other researchers have tried to identify the tourism potentiality issue of the Bankura district, West Bengal. Although, Raha et al. (2021) tried to identify the tourism potentiality issue of the West Bengal, but a true micro-level assessment is missing in their research. Later, Raha and Gayen (2022) identify the green tourism potentiality of the Gangetic West Bengal; but through a large geographical context; it was not easy for the authors to identify the tourism potentiality issue meticulously. As a result, the research is path-breaking and has significant ramifications for the travel and tourist industry.
Secondly, this study considers several diversified indicators (8 parameters and 34 indicators) to identify the tourism potentiality. Several diversified indicators are extremely necessary to identify several diversified phenomena in this region. Raha et al. (2021) and Raha and Gayen (2022) attempted to determine the potential for tourism and green tourism in West Bengal and Gangetic West Bengal, but their selection of the criteria is fairly narrow and constrained. Similarly, Acharya et al. (2022) uses, land use-land cover data along with the remote sensing databases to identify the geo ecotourism zones but several diversified parameters and indicators are missing. Several researchers like, Riti et al. (2016), Zasada and Piorr (2015), Weidenfeld (2018) recommend using parameters and indicators from several diversified disciplines. But for West Bengal as well as for the Bankura district, such an honest effort is missing. Therefore, this research becomes an obvious read for the researchers, because it considers 8 parameters from 8 different dimensions and identifies suitable 34 indicators to illustrate the tourism potentiality in space.
Thirdly, following the Saaty’s (1980, 1990) methodology the research formulates an integrated 5 step methodology, which is flexible enough to apply in any geographical region. The original version of the AHP is challenging to grasp for any researcher. The multistep nature of the AHP makes the original version of the AHP much easier to understand. Raha and Gayen (2022) tried to flexible the methodology in a similar way but choice of their parameters was limited. Several large diversified indicators are merged within this methodology, which makes it flexible and much easier.
Fourthly, the results of this research are minute, flexible and easily comparable with other research outputs in this region. Till now, five research works are found in these portions of the study area. The tourism potentiality in the Rarh Bengal (i.e., the Bankura, Purulia, and Medinipur districts) is investigated by Mandal (2021) and Ghosh et al. (2021) utilising the SWOT, AHP, and quasi observation technique. These areas have a significant geo-tourism potential, according to the authors. Datta (2020) uses the Analytic Hierarchy Process (AHP) and an original SWOT matrix to focus primarily on the geomorphosite-based tourism activities of the Mama Bhagne hill. Raha et al. (2021) and Raha and Gayen (2022) identify mainly high and moderate tourism potentiality in the Western portions of the West Bengal. The present research has also found the high and moderate green tourism potential zones in the Rarh region of the Bankura district, West Bengal. Here, the Bankura district is identified with high tourism potentiality, which is scattered in 23.30% area of the Bankura district. Approximately, 17.92% area of the Bankura is identified with the low tourism potentiality and another 58.74% area is identified as the moderate tourism potentiality. Therefore, this research appeared in paper supports all of the above findings of above researchers.
6 . CONCLUSION
In summary, the research utilizes an integrated 5-step methodology to demarcate the tourism potential zones. Eight variables and thirty-four indicators used to construct and delineate the final tourism potentiality zone. It includes the preparation of the thematic layers (Eight parameters and thirty-four indicators) (Step-1); creation of matrices for pairwise comparisons (Step-2); raster reclassification (Step-3); use of the weighted sum method to get the composite variables (Step-4) and classification of tourism potential map using the natural breaks (Step-5). Those eight parameters are the Tourist Intensity Measure (TIM), Climate (C), Physical (P), Social (S), Economy (E), Environmental Quality (EQ), Amenities (AN), and Diversity in Local Art and Crafts (LAC′). Six indicators help to construct the Tourism Intensity Measure (TIM), four indicators are used to construct Climate (C), and five indicators help to construct Social (S) and Economy (E) each. Two indicators are utilized to construct Environmental Quality (EQ) and four indicators are used in the construction of Types of Amenities (AN). Six indicators help to formulate Physical (P). LAC has no sub-variable. All the composite indicators derived in this system have a low to moderate variability as coefficient of variation does not exceed 40%. This phenomenon assures the existence of low to moderate heterogeneity in the system. Use of the Analytic Hierarchy Process (AHP) in this research is quite beneficial as it measures the internal consistency of every matrix. Judgment of internal consistency is specifically required to judge the randomness of each indicator (Drost, 2011). Following the Saaty’s (1980) scheme every matrix confirms that they have C.R. value of less than 0.1. The strength and weaknesses every main and sub-variables are determined by AHP based ranking and assigned weightage. Higher weightage means it has more influence in that category and vice-versa. The variable TIM illustrates the pressure of tourists in local level. Consideration of variable Physical (P) gives the overview of physical environment of the study region. Consideration of variable S has several implications in this research, i) it promotes and controls the carrying capacity, ii) this sector indicates a balanced sex ratio and optimum population structure, and iii) this dimension indicates a balanced literacy rate which affect the overall quality of population at a glance. The variable E allows us to establish a specific strategy to support strengths and reduce weaknesses in terms of economy. This sector also measures the overall balanced working environment which creates positive direct influence on tourism. The suitable climatic condition of a region can attract more tourists. Thus, suitability of rainfall, temperature and humidity creates a positive vibes for tourists to visit a particular tourist spot in a number of times. Similarly, Environmental Quality (EQ) and Amenities (AN) also play a major role. A non-polluted clean environment helps to increase the influx of tourist arrival to the particular tourist spot. Weighted overlay equations (equations: 4, 5, 6, 7, 8, 9, 10, 11 and 12) express the composite indicator system in the research. The weighted overlay equation in every case helps to manage all the variables into a single equation which determines overall status of that category in space. In case of spatial assessment, every category of the weighted overlay is coded from 1 to 9 according to their priority (Table 2). At last, eight major variables are fitted separately in another overlay equation (equation 13) which helps to identify tourism potentiality zones in space. Tourism potential zones are classified into high, moderate and low categories. Approximately, 23.33% and 58.74% of the area are classified as having high and moderate tourism potential, respectively. 17.92% of the area is classified as having a low potential for the tourism. The quantity of tourist attractions in the area is used to further validate the tourism potentiality zone, and the measured R square is 94%. This proves that the estimated potentiality zone is quite appropriate and acceptable. The sustainable tourism indicators used in this study provide a sound basis for tourism planning and management.
The identification and monitoring several parameters at a glance makes this study fruitful one for implementation. This study brings up a systematic approach and analytical means of Tourism Potential Zone (TPZ) identification and monitoring. Planning and decision-makers can utilize this knowledge to create local and regional tourist strategies.
Tables
Figures
Conflict of Interest
The authors declare that there is no conflict of interest.
Acknowledgements
Authors are thankful to Department of Geography, Coochbehar Panchanan Barma University for providing required facilities to conduct the reported research work.
Abbreviations
ADS: Average Duration of Stay; AS: Aspect; ASI: Availability of Scenic Beauty and Infrastructures; DD: Drainage Density; OR: Occupancy Rate; P: Physical; PD: Population Density; PF: Protected Forest; PGR: Population Growth Rate; PR: Precipitation; RD: Road Density; RF: Reserved Forest; RL: Relief; RP: Road Proximity; S: Social; SR: Sex Ratio SL: Slope; UCF: Unclassified Forests.
Asfairsh, A. G. and Kumar, S., 2019. Assessing progress of tourism sustainability: Developing and validating sustainability indicators. Tourism Management, 71, 67-83.
Beeco, J. A. and Brown, G., 2013. Integrating space, spatial tools, and spatial analysis into the human dimensions of parks and outdoor recreation. Applied Geography, 38,
Cohen, S. A., Prayag, G. and Moital, M., 2013. Consumer behaviour in tourism: Concepts, influences and opportunities. Current Issues in Tourism, 17(10), 872-909.
Mauerhofer, V., 2013. Social capital, social capacity and social carrying capacity: Perspectives for the social basics within environmental sustainability. Futures, 53, 63-73.
Pan, S., 2011. Tourism and rural development: A case study in Bankura District, West Bengal. Doctoral Dissertation guided by Dr. Premangsu Chakraborty. Available at shodhganga.ac.in. (Unpublished Thesis).
Phillips, W., Indar, D. and Thorne, E., 2017. An analysis of the art and craft sector and its potential for sustainable tourism development in the Caribbean.
Sánchez-Rivero, M. and Cárdenas-García, P. J., 2014. Population characteristics and the impact of tourism on economic development. Tourism Geographies, 16(4), 615-635.
Santos, G. E. de O., Ramos, V. and Rey-Maquieira, J., 2014. Length of stay at multiple destinations of tourism trips in Brazil. Journal of Travel Research, 54(6), 788-800.


 ,
Shasanka Kumar Gayen 2
,
Shasanka Kumar Gayen 2