Spatial distribution of dominant land-use types in the study area.
Annual and seasonal trends of LST were computed.
Spatial trends were also highlighted.
Diurnal LST range trends were also evaluated on an annual basis.
Abstract
The concerns over land use and land cover (LULC) change have emerged on the global stage due to realization that changes occurring on the land surface also influence climate, ecosystem and its services. This study aimed to map the temporal dynamic of LULC patterns and LST in the Jarmet wetland in Ethiopia. The dynamics and pattern of changes for a period of 21 years (2000-2021) were analyzed using geospatial techniques. Multi-temporal satellite images from Landsat ETM+ and Landsat-8 OLI sensor data were used to extract land-cover maps. The Land Surface Temperature (LST) trend of the study areas was computed using MODIS satellite imagery (2000-2021). Supervised classification using a Maximum Likelihood Classifier (MLC) was applied to prepare LULC maps of the watershed. The accuracy of the classified map was assessed using high-resolution data, and ground realities have been verified and ascertained through field observations. The results revealed a decreased trend in wetland, forest, shrubland and grassland in the period of 21 years (2000-2021) by -1148.71ha, -1073.26 ha, -1480.1 ha, and -87.73 ha, respectively. On the other hand, farmland and plantation areas followed an increasing trend. LST revealed decreasing trend in terms of mean and minimum with a fraction change of -0.018 and -0.073, whereas the maximum LST value shows an increasing trend with 0.021. The overall accuracy was 84.41%, with Kappa index of 76.13%. The analysis and findings of the study highlight important policy implications for sustainable LULC management in the study area. The study suggests the design and implementation of a guided natural resource policy, stopping the illegal expansion of farmland and educating society about the value of the sustainable management of habitat reserves.
Land-use and land-cover (LULC) changes detection are vital for understanding the global environmental transform processes (Melakneh et al., 2010; Misrak et al., 2012; Ayele et al., 2014; RCW, 2018; Belete and Suryabhagavan, 2019; Mekasha et al., 2020; Bekele et al., 2022). Therefore, the detection and monitoring of LULC changes using satellite multi-spectral image data has been a topic of research interest in remote sensing (Mekasha et al., 2021). Mostly, human modify LULC types both quantitatively and qualitatively (FAO, 2016). Also, vegetation change affects precipitation and temperature, leading to climate change and global warming. In past studies, global environmental changes such as emissions of greenhouse gases, global climate change, loss of biodiversity and loss of soil resources have been closely linked to LULC changes (Mekasha et al., 2022). Increased climate variability and a warming trend in Sub-Saharan Africa, particularly East Africa, is due to exponential human population growth, irrational exploitation of natural resources, unabated forest destruction, extreme rainfall events and higher seasonal mean temperature (Costanza et al., 2014; Suryabhagavn, 2017).
Developing countries are the most affected by changes in climate and land-use. Various techniques of LULC change detection analysis were discussed by Mekasha et al. (2020). The impacts of human activities on wetlands can be manifested through LULC change. The LULC changes are the result of agricultural extension and population growth. Also, climate and land-use change contribute to natural disasters. Several studies justify this impact significantly by developing countries while limited resources, data, technology and budget for combating and resilience. However, the wetland is an inherently dynamic ecosystem that can be modified and destroyed by various natural processes, the direct and indirect consequences of human activity (Roy et al., 2010). Wetland degradation includes habitat loss and fragmentation, resource extraction, drainage and land reclamation, decline or extinction of wild flora and fauna, loss of soil nutrients, water resource, LULC changes are the result of a complex interplay of socio-economic, institutional and environmental factors (Turner et al., 1994; Tegene, 2002; Lesschen et al., 2005; Lambin and Geist, 2006; Falcucci et al., 2007; Li et al., 2017). According to Finlayson and Moser (1991) wetlands occupy about 6% (approximately 890 million ha) of the global land. However, about 50% of the world’s wetlands have been altered or lost in the last 50 years (Dugan, 1993). In tropical and sub-tropical areas wetland conversion to alternative LULC since the 1950s was accelerated mainly due to agricultural land expansion and population growth (Moser et al., 2015). Wetlands of Africa only cover 1% (345000 km2) of the total area of the continent. The total area of Ethiopia covers 113000000 ha (1130000 km2) of land. In Ethiopia, more than 85% of the population lives in rural areas depending on agriculture as the main source of employment. Ethiopian highlands produce in excess of 110 billion meter cubic of water, of which 74% of the total volume of the water resource flows into rivers draining to Sudan, Egypt, Kenya, and Somalia (EPA, 2004; WBISPP, 2005). Therefore, it has attracted wide interests in communities of environment, geography, ecology, hydrology, GIS, remote sensing and so forth. The accuracy of predict LULC change depends on our ability to understand the precedent, contemporary and future drivers of LULC Change (Belete and Suryabhagavan, 2019; Mekasha et al., 2020). An improved understanding of historical LULC change patterns provides a better means to project future trends of LULC change (Melakneh et al., 2010; Misrak et al., 2012; Ayele et al., 2014; Mekasha et al., 2022).
Satellite remote sensing has the potential to provide accurate and timely geospatial information describing changes in LULC (Foody, 2002; Yuan et al., 2005). Among various earth observation (EO) programs NASA’s Landsat missions are known for the free dissemination of extensive data. With the longest (since 1972) continual global coverage at moderate to high resolution, the Landsat data has been commonly used for LULC change detection (Helmer etal., 2000; Lu and Weng 2007; Gao and Zhang, 2009; Gumma et al., 2011; Lu et al., 2012; Jia et al., 2014; Mekasha etal., 2020). Remote sensing images can effectively record land-use situations and provide a good data source. From which updated LULC information and changes can be extracted, analyzed and simulated efficiently through certain means (Belete and Suryabhagavan, 2019). Several techniques for LULC changes have been reviewed (Lu et al., 2007). LULC change detection generally employs one of two basic methods: pixel-to-pixel comparison and post-classification comparison (Ayele et al., 2014; Dinku and Suryabhagavan, 2019), which compares two or more separately classified images of different dates (Shalaby and Tateishi, 2007; Serra et al., 2008). Post classification comparison is considered the more appropriate and commonly used method for change detection (Lillesand et al., 2004). Therefore, remote sensing is widely used in detecting and monitoring land use at different scales (Yuan et al., 2005).
Jarmet wetland witnessed drastic LULC changes mainly as a result of increase in changes in agriculture practices and execution of different development projects particularly during the last four decades. Geographic Information System (GIS) and Remote Sensing (RS) have proved to be very significant in analyzing and assessing LULC changes as well as LST (Melakneh et al., 2010; Misrak et al., 2012; Ayele et al., 2014). Satellite-based RS has the ability to provide synoptic LULC data at a specific time and location (Gomez et al., 2016; Verma et al., 2020). The RS and GIS have a remarkable ability to map and identify LULC and LST changes (Bekele et al., 2021). Over the last few decades, research studies highly relied on the satellite remote sensed spatial information to map individual vegetation species (Belete and Suryabhagavan, 2019) and describe the variation in the vegetation types (Warkaye et al., 2018; Bekele et al., 2022). The present study was taken up to investigate annual changes in LULC pattern and climate impact over the last three decades in Jarmet wetland and its surrounding environments in western Ethiopia by integrating remote sensing and GIS.
2 . MATERIAL AND METHODS
2.1 Study Area
The current study was carried out at Jarmet wetland and surrounding environments located in western part of Ethiopia bounded by 9o52ꞌ43ꞌꞌ-9o42ꞌ11ꞌꞌN latitude and 36o57ꞌ31ꞌꞌ-37o05ꞌ50ꞌꞌ E longitude covering a total area of 8113 ha (Figure 1). Elevation of the region ranges from 1781-2604 m. This wetland is flooded during rainy season and gradually dries up. It is part of the Blue Nile watershed which encompasses the Ethiopian renaissance dam. The climate of Ethiopia is mainly controlled by the seasonal migration of Inter-Tropical Convergence Zone (ITCZ), which follows the position of the sun relative to the earth and the associated atmospheric circulation, in conjunction with the complex topography of the country (NMSA, 2019). Average annual temperature in the region is 27.7oC. Annual rainfall ranges between 411.9-334.6 mm with precipitation throughout the year, but mostly 85% between July and August. In Jarmet station the mean monthly highest temperature is recorded from February to April with its average 26.6oC and peak is 33.1 in February for this station (Figure2). Vegetation is the assemblages of plant species and all ground cover by plants and the main elements of biosphere. Even though the study area is dominated by wetland surrounded by moist afro-montane forest, the remnants of mixed forest exist at the region in a portion of the study area. There are still mature individual plants of Olea Europea subs. cuspidata, Cordia Africana, Podocarpus falcatus, Ficus sycomorus, Phoenix reclinata, Syzygium guineense, Croton macrostachyus and Ficus vasta scattered are seen.
Figure 1. Study area: Jarmet wetland, Western Ethiopia
Figure 2. Precipitation
2.2 Data Acquisition
In this study, temporal data of three Landsat satellite remote sensing images such as Multispectral Scanner (MSS), Thematic Mapper (TM) and Enhanced Thematic Mapper Plus imageries for 2015, 2000, and 2021 used in this study were retrieved from the United State Geological Survey (USGS) database. Specifications of the satellite data acquired for change analysis are given in Table 1. The satellite images were projected in UTM projection, zone 37N and Adindan datum. Overall methodological framework and data analysis are presented in Figure 3.
Figure 3. Methodological workflow
Table 1. Satellite imagery and data
Data type
Format
Path/row
Spectral bands
Scene size
Date of acquired and source
Resolution (m)
Topographic maps
Analogue
Sheet no.0937
January1982 to october1983 EMA
1:50000
Landsat TM
Digital
170/053
1,2,3,4,5,7
185×185 km
01-03-1986 USGS
30 m
Landsat ETM+
Digital
170/053
1,2,3,4,5,7
185×185 km
01-04-2000 USGS
30 m
Landsat ETM+
Digital
170/053
1,2,3,4,5,7
185×185 km
01-31-2005 GLCF
30 m
Landsat ETM+
Digital
170/053
1,2,3,4,5,7
185×185 km
02-11-2015 GLCF
30 m
Landsat MSS
Digital
182/053
1,2,3,4
185×185 km
12-09-1972 USGS
60 m
Geological maps
Analogue
Sheets: NC-37/9
August,2000 (GSE)
1:250000
MODIS LST
Digital
MOD11A2
36
2330km× 2330km
2000-2021
1 km
3.3 Image Processing
The remote sensing image data of the years 2015, 2000, and 2021 were radially calibrated and atmospherically corrected. The relative geometric corrections of the four images were conducted to remove geometric distortion caused by sensor or the Earth’s rotation. Due to the differences between the MSS and ETM+ sensors, the geometric correction of the year 2000 was based on the data of the study area and the image georeferencing accuracy was initially checked with a reference map for the area. All the input images have the same map and projection information with the same number of layers. After layer stacking, sub-setting was performed to get a portion of a large image file into one smaller file. This is helpful to reduce the size of the image file and thus we could focus on only the area of interest.
3.4 Image Classification
The overall objective of the digital image classification procedures is to automatically classify all pixels in an image into land classes or themes (Lillesand et al., 2004). It is a powerful technique to drive thematic classes from multiband image data. It performed for extraction of distinct classes or themes, LULC categories from satellite imagery. For this study, among the various classification methods, supervised and unsupervised classification procedures were used for satellite image classification. In order to minimize the biasness caused by using different band combinations, the same numbers of bands (band 2, 3, 4 and 5) were used for classification in all cases. In this study, training and validation data during optimization were generated using polygon vectors designed for each land-cover type. For the selection of land-cover types, supervised classification method of maximum likelihood algorithm training based region of interest mapping was used and 6 classes were determined from 2015, 2000, and 2021 Landsat satellite imagery. These classifications were produced by using ERDAS Imagine 2015, before the field work. This method is the most common method and widely used for supervised classification in remote sensing image data analysis (Richards, 2014). The maximum likelihood classification assumes that for all classes and the input data in each band follows the Gaussian (normal) distribution function. A pixel has a certain probability of belonging to a particular class. These probabilities are equally identifying and locate land-cover types that are known a priori through combination of personnel experience interpretation of satellite images, map analysis and field works (Jensen, 2005). Table 2 shows the present study and land use types of the study area. In order to model temporal changes in land cover were calculated and analyzed based on the formula of (Al-Naimi et al., 2017) as follows:
where, annual change rate is the change in LULC (a2−a1), a2 is the recent year land-use land-cover in ha, a1 is the initial year LULC in ha and N is the number of years between the initial and the final of the study period. To compute percentage changes in each land-use and land-cover for the study area, targeted LULC were segmented into two change periods of image analysis. From equation (1), a relationship for estimating percentage change of targeted land-use and land-cover for the change detection periods understudy was established (2) (Al-Naimi et al., 2017).
where, ∆inl is a change in the targeted LULC understudy, a1 and a2 are the areas (image-based estimated areas) of the targeted land-use land cover at the beginning and end of the change detection analysis, and A is the total sum area.
Table 2. Land-use and land-cover classification scheme
LULC classes
Description
Wetland
The area where the water table is near or above the land surface covered by marshes, swamps, bogs, rivers and streams.
Forest
These areas are regions covered with big trees of different species, with little or no human activities.
Farmland
This class represents growing agricultural crops and appeared cultivated during growing season.
Shrubs
Areas covered with small shrubs, thickets and grasses with little or no trees are referred to as shrubs and its height is less than 5 m.
Plantation
This class includes eucalyptus plantation and temporary clear field stand a waiting replanting within in eucalyptus plantation.
Grassland
This category is dominated by the grasses, fobs, and grass areas used for communal grazing.
2.5 Accuracy Assessment
Accuracy assessment is essential for individual classifications if the classification data is to be useful in change detection. LULC classification is subject to incur some errors; hence the output (maps) needs to be put to test for assessing accuracy using a reliable statistical technique. For that reason, LULC maps are usually accompanied by an accuracy assessment index that includes a clear description of the sampling design (including sample size and, if relevant, details of stratification), an error matrix, the area or proportion of area of each category according to the map, and descriptive accuracy measures such as user’s, producer’s and overall accuracy (Olofsson et al., 2013). The term ‘accuracy’ is typically used to express the measure of ‘correctness’ of a derived map (classification) which is assessed through the construction of error-matrix (Foody, 2002). To evaluate the accuracy of an image classification, it is a regular practice to create a confusion matrix. In a confusion matrix, the classification results are contrasted with additional reference (Google maps) data. The quality of a confusion matrix is that it distinguishes the nature of the classification errors and also their quantities. Frequently, surrogates to ground truths are obtained from existing land cover data (e.g., LULC map) which
are perceived as suitable reference and which obviously are independent of the sample selection data. Classification accuracy could be affected by lack of fine details, resolutions of images used, due the need to make generalizations and errors are always expected accordingly. In this study accuracy assessment was done for recent satellite image of Landsat ETM+ 2015 for which the ground truth data is likely corresponding. Error matrix is one of the most common methods of expressing classification accuracy (Congalton, 2009). An error matrix is square array of numbers set out in rows and columns which express the number of sample units (i.e., pixels, cluster of pixels, or polygons) assigned to a particular category relative to the actual category as verified on grounds. In the present study accuracy of all the raster layers (2015, 2000, and 2021) was assessed through the development of an error-matrix. A stratified random sampling design was adopted in the accuracy assessment.
The k (KHAT) statistic is a measure of the difference between the actual agreement between reference data and an automated classified data and the chance agreement between the reference data and a randomly classifications (Jensen, 2007). Conceptually, Ḱ can be defined as:
where, N is the total number of samples in the matrix, r is the number of rows in the matrix, xii is the number of observations in row i and column i, x+i represent the total for row i, and xi+ represent the total for column i.
Table 3 shows the accuracy level of each land cover category of Landsat ETM+2015. The error matrix can be used to determine the user and the map producer accuracy. The map producer accuracy is obtained by dividing the number of successes in the class by the total number of samples in a reference class (column). Map producer accuracy is an indicator of the omission errors. User accuracy is obtained by dividing the number of successes by the total number of samples in an obtained class (rows). User accuracy indicates the commission errors. This process is one of the widest and most commonly used validation methods for image classification either using open source or privative tools (Chuvieco, 2007; Lellisand et al., 2015). Validation using error matrix requires representative samples of the population to be assessed. In this study, the samples were determined using the multinomial distribution proposed by Congalton and Green (2009) (3). Small polygons were randomly selected and stratified as sampling unit. The classes were considered deferent amongst them (strata), but with great homogeneity respecting their use. The samples were determined from a chi-square distribution, using a confidence level of 95% and the percentage value of the image covered by each class. The current study revealed an overall accuracy of 84.06% with Kappa index of agreement of 0.75. This was reasonably a good overall accuracy and accepted for subsequent analysis and change detection. Sabins (1997) says that accuracy levels of more than 80% are considered adequate enough for reliable classification of land-cover types.
Table 3. The accuracy level of each land-cover category of Landsat ETM+
Classified data
Reference data
Row total
OE (%)
UA (%)
Shrubland
Grass
land
Forest
Plantation
Wetland
Farmland
Shrubland
4
0
0
0
0
0
4
2
100
Grassland
0
25
1
2
0
2
30
25
83.3
Forest
0
0
4
0
1
0
5
2
80
Plantation
0
2
0
11
0
0
13
15.4
85
Wetland
1
0
0
0
5
1
7
17
71
Farmland
0
2
0
0
0
16
18
15.8
88.9
Column total
5
29
5
13
6
19
77
Commission Error (%)
0
16.7
2
15.40
29
11.11
Producer Accuracy (%)
80
86.2
80
84.62
83
89
Overall classification accuracy is 84.41 %, overall Kappa statistics is 0.76.
2.6 LST Retrieval
Satellite data is an essential data source used to derive LSTs, having the advantages of high quality, fine resolution and favorable spatiotemporal continuity (Belete and Suryabhagavan, 2019). LST is one of the important parameters in the study of surface energy balance. The commonly used methods of remote sensing inversion of LST mainly include the radiative transfer equation method, single window algorithm, single channel algorithm and split window algorithm (Wan et al., 2004). MODIS dataset originally found in sinusoidal (SIN) mapping grid and provided in the form of HDF (Hierarchical Data Format). Therefore, HDF format should be changed into Geotiff format to carry out further analysis. MODIS Land Surface Temperature/Emissivity (LST/E) data with 1 km spatial resolution with a data type of 16-bit unsigned integer to
get the temperature data in °C (Sruthi and Mohammed, 2015). The pixel value (PV) of LST data is converted to °C by using the following empirical formula.
\(LST(^oC)=(PV \times 0.02)-273.15\) (4)
where LST is land surface temperature in degree centigrade (°C) and PV is pixel value of MODIS data.
3 . RESULTS
3.1 LULC Change (2000-2021)
From visual and digital interpretations of the satellite imagery, different LULC categories were distinguished for this study. For the purposes of measurement of areal extent of Jarmet wetland and its surrounding environment; the satellite images were interpreted and analyzed and classified into six different classes. The areal extent of these land-use features is depicted in (Table 4 and Figure 4). The total areas of each LULC class of the study area were computed for five different periods from 2000 to 2021 farmland, wetland, shrubland and forestland were the major LULC types that have accounted for 30.5%, 15.9%, 20.46%, and 14.84%, of total study area. From 2000 to 2021, the wetland and its surrounding environment has dynamically transformed into different LULC categories. One of the most marked changes were the rapid decline of wetland and forested lands from 17.7% in 2000 to 3.5% in 2021 and from 23.8% in 2000 to 10.6% 2021, respectively. This was mainly due to dramatic expansion of farmland and plantation towards wet and forest lands. The farmland had occupied 30.8% of the study area in 2000 and increased to 58 % in 2021. Similarly, plantation cover has increased from 4.3% in 2000 to 19.5% in 2021. However, the other LULCs such as grass and shrub lands have shown irregular trend (increment at one period and decrement at other) over the study periods shown in (Figure 5).
Figure 4. Land-use and land-cover maps
Figure 5. Relative changes in LULC
Table 4. LULC changes during 2000-2021
LULC
2000
2015
2021
Net change
Area
Area
Area
Area
ha
%
ha
%
ha
%
ha
%
Shrubland
+1518.4
18.7
−237.5
2.9
−385.3
4.7
−1480.1
20.46
Farmland
+2495.5
30.8
+4510.8
55.6
+4700.91
58
+2205.41
30.5
Plantation
+348.4
4.3
+591.3
7.3
+1585.32
19.5
+1236.92
17.1
Forest
−1932.3
23.8
−1291.4
15.9
−859.04
10.6
−1073.26
14.84
Grassland
−382.9
4.7
+976.5
12.1
−295.17
3.6
−87.73
1.21
Wetland
+1435.8
17.7
−505.8
6.2
−287.29
3.5
−1148.71
15.9
Total
8113.3
100
8113.3
100
8133.3
100
8113.3
100
Note: The positive sign (+) means gain and the negative sign (−) indicates loss in areal extent.
3.2 LULC Spatiotemporal Patterns
Table 5 describes the land-use and land-cover trend and rate of changes of the study area during the period 2000-2021. Further, the results of LULC classes and their spatial distribution, there were changes showing decrease or increase in any particular LULC types. The LULC categories, which decreased are forest, wetland, grassland, and shrubland which contributed to concomitant increased of farmland and plantation. From 2000-2015, the forest land has decreased by about 42.72 ha at 11.23% rate per annum (Table 5 and Figure 6). Forest area during 2015-2021 rate of change per annum about 432.36 ha were converted by 16.22%. Various extents of forest cover existed in 2015 reduced by −1,073.26 ha (15.6%) during the period of 2015-2021 rate of change per annum. This revealed that the forest decreased is as a result of population growth, unwise use of resource and the forest resources change to other land units. From 2000 to 2021, the shrubland cover of the study areas has experienced the expansion of its spatial cover due to its encroachment into the wetlands and at the expense of the grass land covers. In addition, afforestation and reforestation conducted in the area have played great role in the expansion of shrubland. Furthermore, the number of livestock from time to time and conversion of grasslands and rangelands to agriculture created livestock pressure on existing grasslands and rangelands.
Figure 6. Temporal patterns of LULC
Table 5. LULC trends and annual changes during 2000, 2015 and 2021
LULC classes
2000-2015
2015-2021
2000-2021
Annual rate of change
2000-2021
Area
Area
Area
Area
ha
%
ha
%
ha
%
ha
%
Farmland
+2,015.30
35.33
+190.11
7.13
+2,205.41
32.03
+105.01
5.0
Wetland
−930.00
16.3
−218.51
8.2
−1,148.51
16.7
−4.2
0.2
Grassland
+593.60
10.4
−681.33
25.6
−87.73
1.3
−54.7
2.6
Shrubland
−1280.9
22.45
+147.8
5.54
−1,133.10
16.45
−53.95
2.56
Plantation
+242.90
4.25
+994.02
37.31
+1,236.92
17.96
+58.9
2.8
Forest
−640.90
11.23
+432.36
16.22
−1,073.26
15.6
−51.1
2.43
3.3 LULC Change Detection
The nature of land-use and land-cover change refers to the modification or conversion of LULC to other. A post classification comparison of annual changes revealed different trends in LULC changes from 2000-2021. This information serves as a vital tool in resource management decisions. This process involves a pixel-to-pixel comparison of images of the study years through overlay analysis. The nature of changes has been examined with reference to areas of LULC remained unchanged, gained from other classes and lost to other classes. LULC change during the study period is shown in Table 5.
From 2000 to 2021, the major LU/LC changes were dominated by the conversion from wetland, shrubland and grassland to farmland tabulated in (Table 6). Quantitatively, 1148.51ha, -1133.10ha and -87.73ha of wetland, shrubland and grassland were respectively converted to farmland. These changes were attributed to population growth which forced the farmers to till and expand their lands in greater extent than before to cope up the demand of the growing population and sustain their life. The land cover remained unchanged over the period of 43 years: 28 ha, 312 ha, 567 ha, 19 ha, 261 ha, and 371 ha were under the cover of shrubland, grassland, forest, plantation, wetland and farmland, respectively. Overall, 1558 ha (19.43%) of the total study area remained unchanged 2000-2021 during 43 years period. The change detection matrix as well indicated that there was gain in farmland and plantation area coverage by 1.67 km2 (167 ha) and 1.41 km2 (141 ha) respectively, whereas grassland, shrubland, wetland and forest lands showed decline (loss) in their areal extent by -641 ha, -1,701 ha, -1,713 ha, and -294 ha, respectively.
Table 6. Change matrix of land-use/land-cover changes between 2000 and 2021
Final state 2021
Initial State 2000
LULC
SHL
GL
FR
PL
WL
FL
RT
CT
Area
Area
Area
Area
Area
Area
ha
%
ha
%
ha
%
ha
%
ha
%
ha
%
SHL
28
1.4
78
4.8
33
2.1
1
0.6
88
4
8
1.5
236
244
GL
208
10.7
312
19.2
101
6.3
8
5
321
14.4
21
3.9
971
988
FR
143
7.3
125
7.7
567
35.5
16
0.1
298
13.4
105
19.5
1253
1302
PL
358
18.4
35
2.1
116
7.3
19
11.9
47
2.1
24
4.5
599
600
WL
52
2.7
19
1.2
165
10.3
0
0
261
11.7
7
1.3
504
511
FL
1,153
59.2
1052
64.6
575
36.3
16
0.1
1186
53.3
371
69
4454
4493
CCT
1,946
100
1629
100
1596
100
160
17.7
2225
100
538
100
8017
8111
CC
1,918
98.6
1317
80.8
1029
64.5
141
88.1
1964
88.3
168
31.2
ID
-1701
-87.4
-641
-39.3
-294
-18.4
439
2.7
-1713
-77
3954
735
Note: Land-cover categories are SHL: Shrubland, GL: Grassland, FR: Forest, PL: Plantation, WL: Wetland and FL: Farmland, RT: Row total, CC: Class Change, CT: Class total, ID: Image difference, CCT: Column class total.
3.4 The Impact of LULC Change on Climate
Climate data monthly average for rainfall and temperature statistical mean values or long-term averages were calculated in Diva GIS and presented using graphs. Analyses on generating the average rainfall and temperatures were conducted to reveal general information on the overall estimated rainfall values over a period of 20 years. The study area was observed to have two rainfall seasons the long-term March, April and May season and the short-term rainfall June, July and August as per the rainfall pattern in Figure 7. The highest rainfall amounts were seen in 2000 at 280 mm for 300 mm for the JJA [June, July, and August] season during 2020. 2000 had the minimal rainfall during the MAM [March, April, and May] season at 150 mm and mm for the year 2020 during the MAM season. As observed in the seasonal rainfall variability graph in Figure 7, there was much variability in rainfall especially in the year 2020 which has the highest variability of 25% recorded during the long rains (MAM) and a high of 48% for the short rains season (JJA). This was evident from the field questionnaires where most of the people agreed that there was a huge variability in season and late onsets of rainfall especially during the JJA rainfall season.
Figure 7. Predicted rainfall and temperature
3.5 Climatic Parameters of the Jarmet Wetland
In the Jarmet wetland, annual average rainfall decreased by 12 mm between 2000 and 2020 (Figure 8). Annual average temperatures also increased between 2000 and 2020 by 1.5ºC. The average annual temperature was 24.5ºC before 2001, and raised to27.3ºC after 2001. The error bar maps the confidence interval of the forecast at 95%. Figure 9 depicts the average annual temperatures during 2000-2020 and annual diurnal temperature for the year 2020. A simple annual vapor of precipitation and diurnal temperature for 20 years was performed using the available data. The results are statistically acceptable with a symmetric mean absolute percentage error (SMAPE) of 0.13 and 0.01 for precipitation and temperature, respectively. The graph of forecast for the year 2020 showed a decrease in precipitation of 18% and 10% as compared to the mean precipitation of the periods 2000-2015 and 2015-2020, respectively. As for the temperature, an increase of 18.5% ºC is predicted for the year 2000, as compared to the initial mean temperature of 17.0oC for the period 2000. There is also a strong inter-annual variability in wind speed, with a decreasing trend between 2000-2010 and 2010-2020 (Figure 10).
Figure 8. Annual and diurnal rainfall and temperature
Figure 9. Temperature and rainfall during 2000-2020
Figure 10. Wind speed
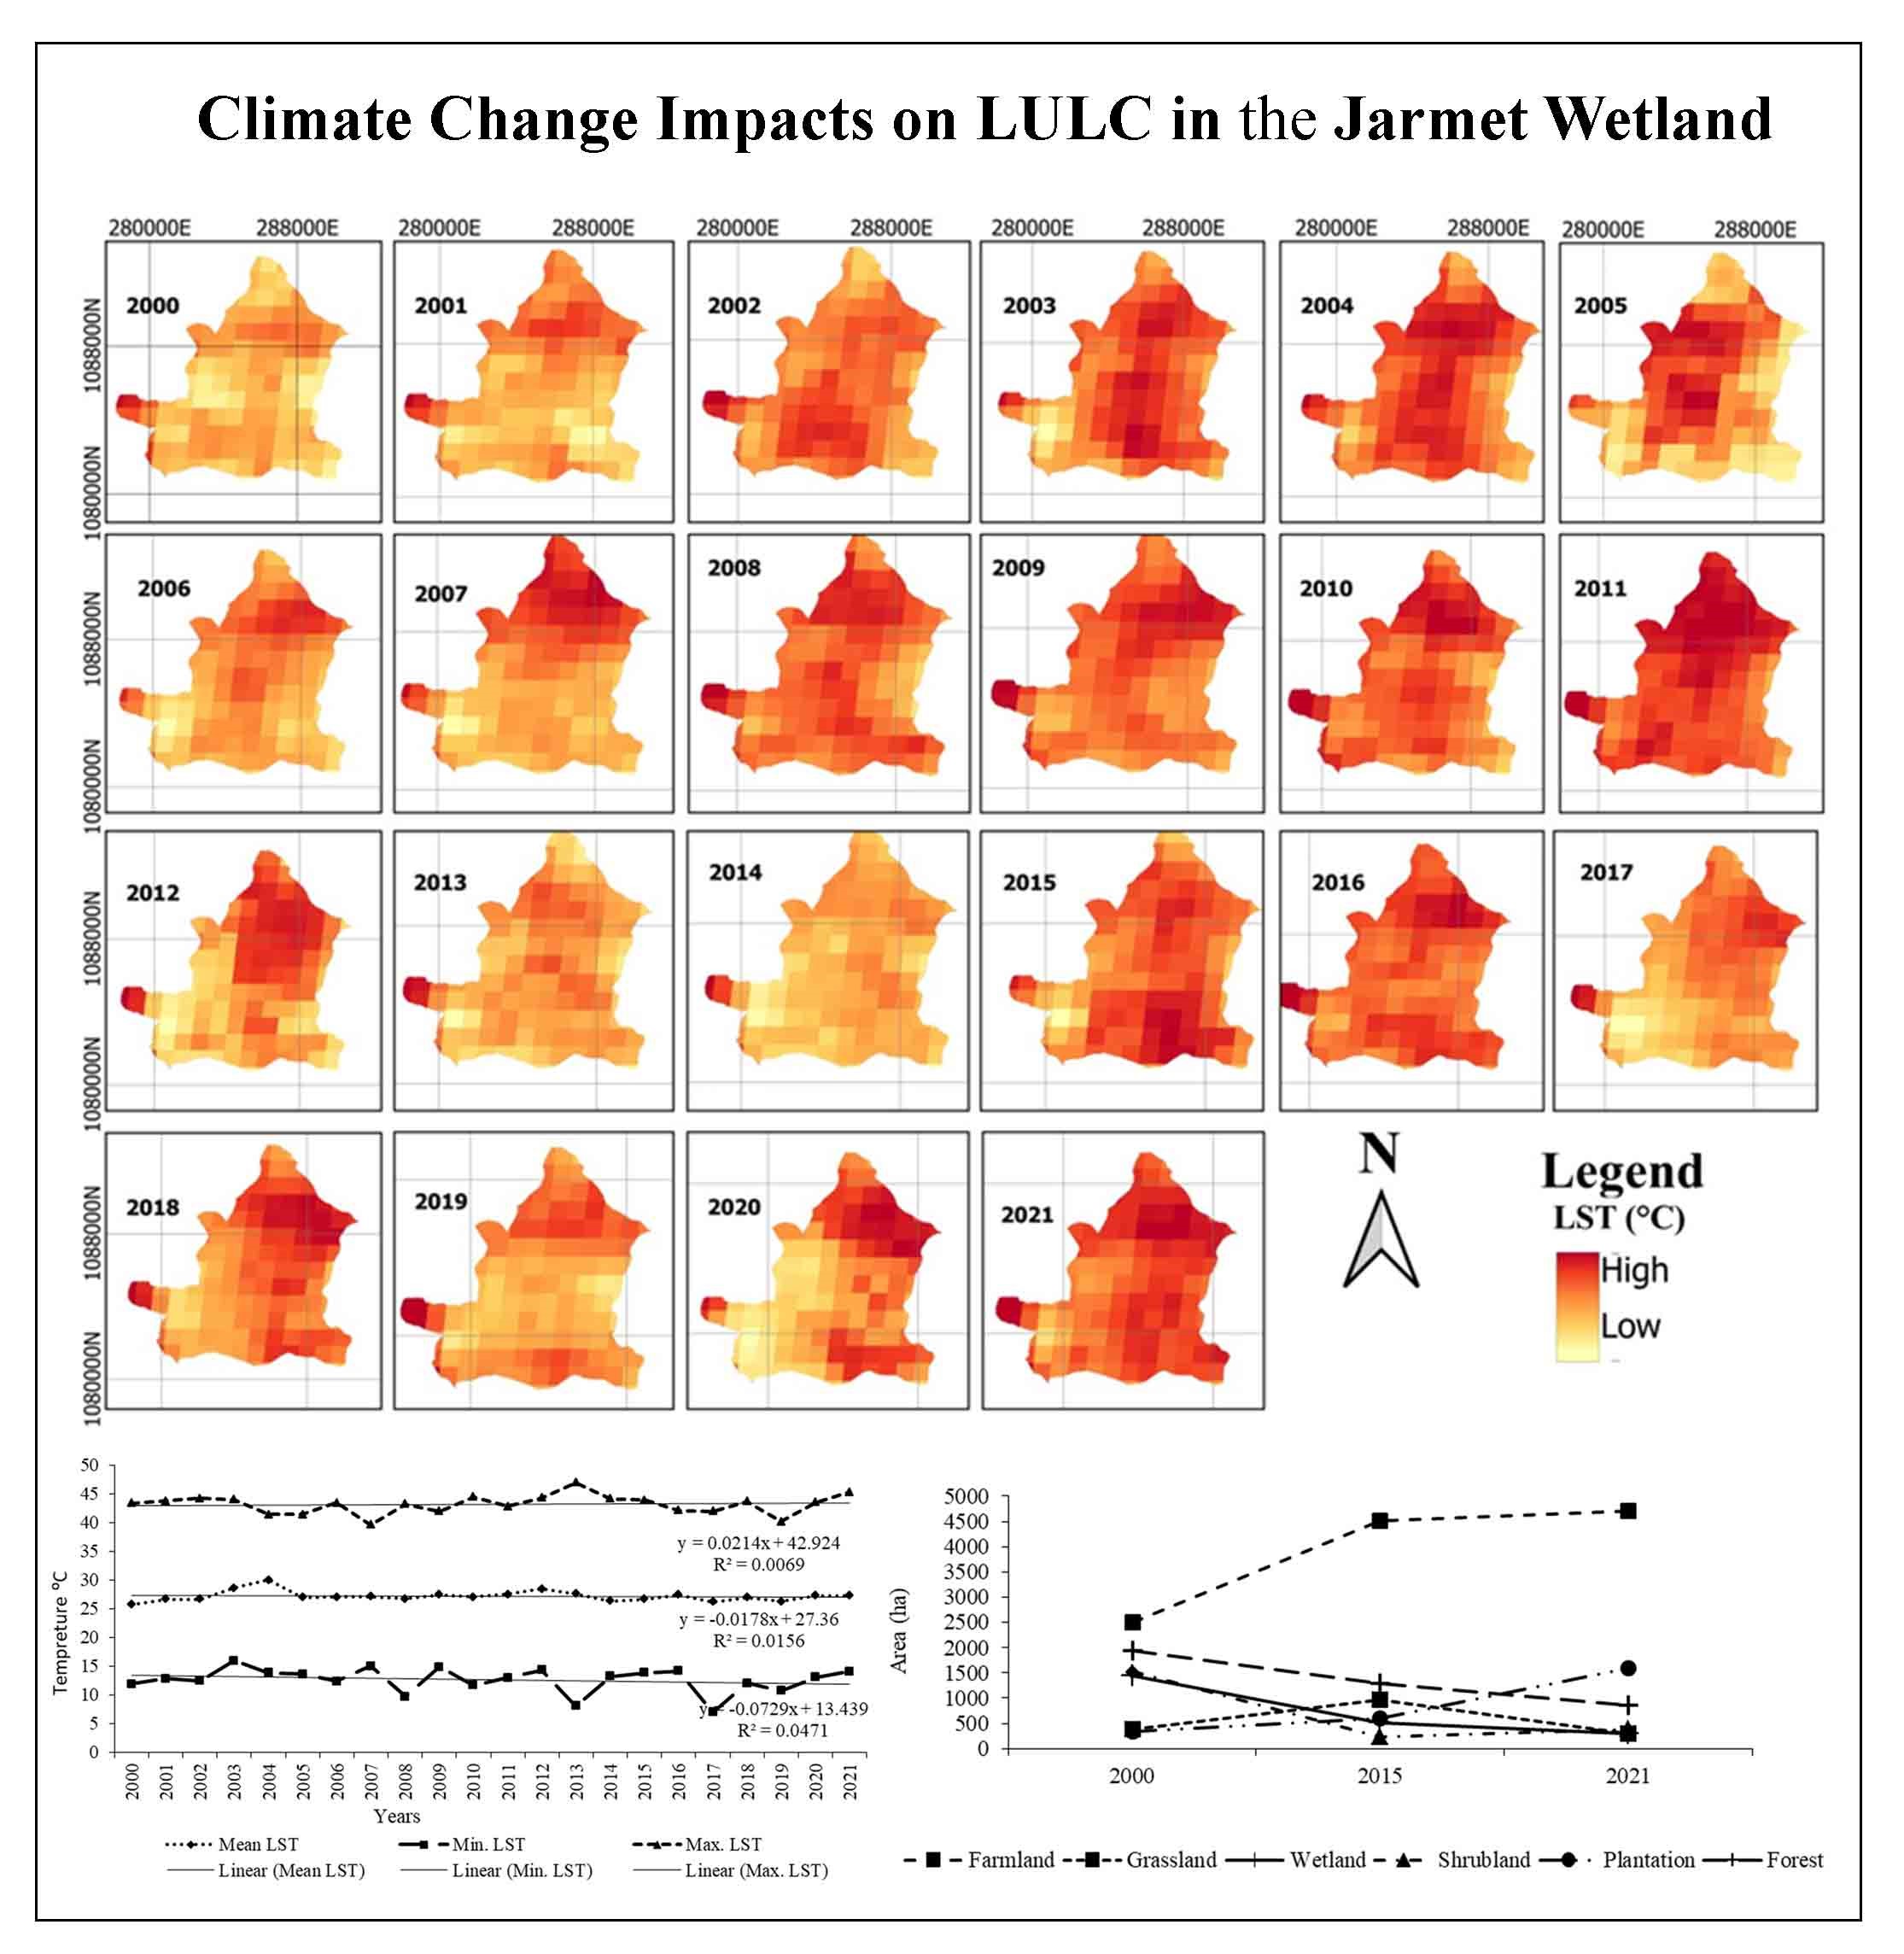
3.6 Land Surface Temperature Trends
Figure 11 and 12 indicates a spatial pattern and areal distribution of LST in 2000 to 2021 of the Jarmet Wetland. The land surface temperature has shown that decreasing trend of mean and minimum LST with a changing factor of -0.018, -0.073 whereas maximum LST show increasing trend with 0.021 changing factor. Accordingly, the result show that mean, minimum and maximum LST varied from 25.68°C, -29.97°C, 6.97ºC -15.95ºC and 39.61ºC -46.99ºC, respectively (Table 7).
Figure 11. LST from MODIS data (2000-2021)
Figure 12. Distribution of LST
Table 7. Mean, minimum and maximum land surface temperature during (2000-2021)
Years
Mean LST
Min. LST
Max. LST
2000
25.68
11.84
43.35
2001
26.61
12.84
43.76
2002
26.64
12.39
44.19
2003
28.57
15.95
44.01
2004
29.97
13.83
41.39
2005
26.96
13.62
41.42
2006
27.03
12.35
43.47
2007
27.12
14.97
39.61
2008
26.69
9.715
43.23
2009
27.40
14.87
41.92
2010
27.06
11.63
44.47
2011
27.48
12.99
42.78
2012
28.45
14.26
44.32
2013
27.54
8.06
46.99
2014
26.29
13.16
44.18
2015
26.67
13.82
43.94
2016
27.43
14.11
42.10
2017
26.13
6.97
41.98
2018
26.92
12.06
43.67
2019
26.22
10.73
40.15
2020
27.28
13.01
43.52
2021
27.28
14.04
45.28
4 . DISCUSSION
Increased human population and its influence on natural habitats are widespread worldwide, and it is more severe in developing countries. In the present attempt, the combined impacts of climate change and LULC on wetlands and surrounding environments. The relationship shows that both influence each other. It finds land use change with a decrease in forest and wetland areas. It has an unprecedented rate of land use changes over three decades. The results of the research indicated that the impact of LULC on the wetland and surrounding environment was greater than that of climate change impacts globally. Recent studies point out the importance of accounting for evolutionary process in forecasts of the future dynamics of LULC utility and LST trend was multi-directional (Wu et al., 2017; Mendoza-Ponce et al., 2018; Wang and Stephenson, 2018). For example, it reported that the earlier the change point, the smaller the relative contribution of climate change and the larger the relative contribution of human activities. However, there is an interaction between climate change and LULC. Climatic variables affect LULC, and in turn LULC affects regional climate (Li et al., 2013). The coupled climatic variables, LULC types, and environmental change models are complex and complicated by the interactions and feedback between subsystems through physical processes that separate the individual impacts of climate change and LULC on the surrounding wetland ecosystems from their combined impacts. In this study, the expansion of agricultural land-induced LULC, directly and indirectly, affects regional climate.
During this study, year 2015 revealed that farmland, plantation and grassland show increasing in 4510.8 ha, 591.3 ha and 976.5 ha, respectively, while forest, wetland and shrubland are decreased to 1291.4 ha, 505.8 ha and 237.5 ha, respectively. These results showed as the wetlands, forests and shrubland in the study area are not controlled by any authority and it is like ‘free area’ for any activity; hence, those inhabitants of the area that can work on farm moved in to produce mostly teff and Guizotia crops. Therefore, the main causes for resource losses in the study area sites are population growth, illegal cutting of forests for energy especially charcoal and firewood, and weak environmental laws and policies. This is comparable to the findings made by Olson et al. (2004) in Uganda.
Present results are in conformity several previous inferences in the study (Tadesse et al., 2017; Tafesse and Suryabhagavan, 2019; Bekele et al., 2022). On the other hand, farmland and plantation are increased to 4700.91 ha and 1585.32 ha, respectively, while others like, shrubland, grassland, wetland and forest decreased to 385.3 ha, 295.17 ha, 289.29 ha and 859.04 ha, respectively. The reasons for farmland and plantation increasing during this period are eucalyptus trees are used as the main source of fire wood for both rural and urban populations, expansion of rural and urban settlement, increasing price of eucalyptus trees, increasing number of unemployment, expansion of irrigation, population growth, weak land management and environmental policy implementation, lack of wise use and irresponsible for natural resource conservation in the area. As evident from the results of this work correspond to similar trends were identified of a study done in wetland uses and dynamics for agricultural purposes and its health implications in lower Ogun River basin, Lagos, Nigeria (2013). Climate and land-use change impacts are similar to countries like Ethiopia, India, Europe, and Africa.
Some studies have shown that the LST algorithm has excluded atmospheric radiation information, and the influence of atmospheric composition on LST no longer needs to be considered when analysing factors affecting LST (Tafesse and Suryabhagavan, 2019; Bekele et al., 2022). The relationship between LULC and LST is complex and multidirectional as land use change has been demonstrated to influence climate at local, regional, and global scales. However, the LST difference is affected not only by the difference in solar radiation but also by the surface cover, human activities, precipitation, airflow, and landscape pattern. Future research must consider factors such as airflow, monsoons, rainfall, solar radiation, seasonal climate change, and landscape patterns (Jiang et al. 2006; Li etal., 2013; Assaye et al., 2017). The quantitative relationship between each factor and temperature needs to be established and the mathematical model needs to simulate climate change. More thorough and detailed studies are needed to understand the dynamic mechanisms of climate change in the Jarmet Wetland and its surrounding environments and further assess human activities' impact on regional climate change.
5 . CONCLUSION
The important objective of this study was to assessment LULC changes and its impact on climate change in Jarmet wetland and its surrounding environment using RS and GIS. The analysis of wetland and its surrounding environment indicated the dynamic change of LULC of the study area over years. The link between human development, illegal land use, weak resource conservation policy, and unwise use of wetland and other land cover recession can be measured through image classification, given that data is available and affordable for researches. In addition, the LULC dynamics is a result of complex interactions between several biophysical and socio-economic drivers. The effects of human activities are immediate and often radical, while the natural effects take a relatively longer period of time. The LULC change experienced in the area indicates the pressure on wetland, shrubland, grassland and forest cover and related biodiversity. Generally, the trends of wetlands, grassland, shrubland and forests are declining. It will create health, economic, and environmental problems for the Jarmet wetland if this changing rate of LULC and LST goes upwards in the upcoming years. This study will help improving the capacity of the government in the study area to device complete strategies at the local and national level for land management. Future researchers may give attention to the microclimatic change in the Jarmet wetland and ecological monitoring.
Tables
Figures
Conflict of Interest
No conflict of interest exists to publish the article.
Acknowledgements
We are thankful to the School of Earth Sciences, and Department of Geography and Environmental studies, Addis Ababa University for support and facilities. We are also grateful to the Geospatial Information institute, Ethiopian Geological Survey, National Meteorological Service Agency, Central Statistical Agency and Alibo Bureau of Agriculture for their support in this study. We also thank two anonymous reviewers for the helpful suggestions.
Abbreviations
LULC: Land-use and land-cover; Ha: Hectare; LST: Land Surface Temperature.
Ayele, K. F., Suryabhagavan, K. V., and Sathishkumar, B., 2014. Assessment of Habitat Changes in Holeta Watershed, Central Oromiya, Ethiopia. International Journal of Earth Sciences and Engineering. 7, 1370-1375.
Congalton, R. and Green, K., 2009. Assessing the Accuracy of Remotely Sensed Data. Principles and Practices. 2nd Edition. CRC/Taylor and Francis, Boca Raton, FL 183.
Lambin, E. F., and Geist, H., 2006. Land-Use and Land-cover Change on Local Processes and Global Impacts. Springer Verlag Berlin Heidelberg. Printed in Germany, 236.
31.
Lellisand, M. T., Kiefer, R. W., and Chipman, J. W., 2004. Remote Sensing and Image Interpretation,Singapore. John Wiley and Sons, Pvt. Ltd.
32.
Lesschen, J. P., Verburg, P. H., and Staal, S. J., 2005. Land-Use and Land-Cover Change (LUCC) Project. IV. International Human Dimensions Programme on Global Environmental Change (IHDP) V. International Geosphere Biosphere Programme (IGBP). International Livestock Research Institute, Kenya.
Melekneh, G., Suryabhagavan, K.V., and Balakrishnan, M., 2010. Land-use and landscape pattern changes in Holeta-Berga Watershed, Ethiopia. International Journal of Ecology and Environmental Sciences. 36, 117-132.
Misrak, A., Suryabhagavan, K. V., and Balakrishnan, M., 2012. Assessment of Cover Change in the Harenna Habitats in Bale Mountains, Ethiopia, Using GIS and Remote Sensing, International Journal of Ecology and Environmental Sciences. 38, 39-45.
Olson, J.M., Misana, S., Campbell, D.J., Mbonile, M., and Mugisha, S., 2004. The spatial pattern and root causes of land use changes in East Africa. LUCID Project Working Paper 47, International Livestock Research Institute, Nairobi.
51.
RCW [Ramsar Convention on Wetlands] 2018. Ramsar Convention on Wetlands, Global Wetland Outlook: State of the World’s Wetlands and Their Services to People. Ramsar Convention Secretariat, Gland, Switzerland.
Wang, T. L., Zhou, L. F., and Yang, P. Q., 2008. Study of Panjin wetlands along Bohai Coast. The information System of wetlands based on 3S technique. Journal of Ocean University of China (English Edition),7(4), 411-415.
67.
Warkaye, S., Suryabhagavan, K. V. and Satishkumar, B., 2018. Urban green areas to mitigate urban Heat Island effect: The case of Addis Ababa, Ethiopia. Int. J. Ecol. Environ. Sci., 44, 353-367.
68.
WBISPP [Woody Biomass Inventory and Strategic Planning Project] 2005. A National Strategic Plan for the Biomass Energy Sector. Ethiopia: Federal Ministry of Agriculture. Addis Ababa.
69.
WCED [World Commission of Environment and Development], 1987. Our Common Future. WCED. Oxford University Press. New York, USA, 398.


 ,
K. V. Suryabhagavan 2
,
K. V. Suryabhagavan 2