1 . INTRODUCTION
With the availability of high-resolution satellite images, exploring the efficient and accurate image fusion methods has become a need of the hour. Several satellites sensors provide multi-band images with accurate color data and having high spectral resolution i.e. the spectral bands needed to distinguish features spectrally but not spatially while other satellite sensors provide high spatial resolution for distinguishing features spatially but not spectrally. There are various applications in remote sensing that involve images with both high spatial and spectral resolutions. In other words, image fusion aims at increasing the spatial resolution of XS images using information from PAN image. The combination or fusion of multi-spectral and panchromatic images or simply pan-sharpening provides more comprehensive solution involving extraction of spatial information needed for various applications (Ling et al., 2007).
The concept of image fusion was mainly focused on the look for the most robust methods of combining images from various sensors and to render a composite image which could be used to better identify features on the earth’s surface. In the multi-spectral images, most urban features can be visually recognized according to the color difference, but they cannot be clearly delineated due to the lack of spatial resolution. In the panchromatic images, however, the shape of most individual objects can be clearly identified, but many of them cannot be classified due to the lack of spectral information (Ehlars, 2007). Several image fusion techniques have been developed in the last two decades for integrating images of different characteristics (e.g. SAR and Optical) and of different spatial resolutions (e.g. SPOT PAN and Landsat TM) so as to obtain better information, interpretation and mapping. For extracting useful information from available high-resolution images, various fusion methods have been developed and used in the last two to three decades (Chavez et al., 1991; Ehlers et al., 2006; Zhou et al., 1998; Zhang, 1999; Li et al., 2002; Chen et al., 2005; James and Dasarathy, 2014; Zhao et al., 2015; Zhou et al., 2016).
The earlier fusion methods are based on simple pixel by pixel addition, subtraction, band arithmetic, ratio (Price, 1987; Munechika, 1993), IHS (Welch et al., 1987; Carper, 1990), PCA, and high pass filters (Chavez et al., 1991). However, IHS and PCA techniques have been reported as having strong spectral distortions in the resultant imagery (Klonus and Ehler, 2007; Chavez et al., 1991; Pellemans, 1993; Simone et al., 2002; Zhao et al., 2015) and are only good for producing images for visual interpretation (Mahyari and Yazdi, 2011; Vivone, 2015). In the recent past, the wavelet transformation (WT) theory has been extensively used and several new methods have been proposed. Current research in image fusion focuses on applying the existing methods on images from different sensors and also on evaluating the quality of the fused images.
In the present study, three image fusion techniques namely; PCA, Wavelet transform (WT) and IHS are applied to QuickBird XS and PAN data set to evaluate the efficiency of the best fusion technique providing enhanced spatial and spectral quality to the resulting fused image. The quality of the fused image is qualitatively assessed through visual image interpretation, correlation between the original XS and the fused image, inter-band correlation and statistical parameters such as mean and standard deviations of the various frequency bands. The fused QuickBird image forms a powerful basis for the generation of large scale land use maps.
2 . IMAGE FUSION TECHNIQUES USED IN THE PRESENT STUDY
Image fusion techniques mainly employed for XS and PAN images attempt to integrate the spatial information of PAN image to the spectral information in the XS image. The integration permits the high spatial information from the PAN image to be injected into the XS image without significantly modifying the spectral information of the later. Some of the image fusion techniques utilized in the present study are briefly discussed below:
2.1 Principal Component Analysis (PCA)
The PCA method is based on statistical parameters. This statistical technique transforms inter-correlated XS bands into a new set of uncorrelated components, the so-called principal components (PCs) (Zhang et al., 2006). PCA involves a linear transformation of XS data to translate and rotate data into a new coordinate system that maximizes the variance of the original data. The first principal component is replaced by higher resolution image after PCA transformation has been achieved. Then the inverse transformation is carried out from PCA back to multi-spectral original data. In this method the XS data set is subjected to a principal component transformation using the following equation (Pouran, 2005),
\(PCI_{i,j}=Y_1X=y_{11}DN_1+y_{12}DN_2+\cdots y_{1n}DN_n\) (1)
Where, \(PCI_{i,j}\) are the brightness values for the first principal component vector, \(X\) is the vector representing the digital numbers of the spectral bands, and \(DN\) are the digital numbers of the image representing the brightness values. The PCI contains, theoretically, all the information that is common to all the bands input to the PCA and is mainly related to intensity or brightness. By substituting the PAN data for the first principal component and applying an inverse PCA, an image with fine spatial resolution will be created, which will be reasonably correct with respect to brightness values whenever PCI and the PAN images are highly correlated. All four QuickBird bands were used as input to the principal component analysis by performing histogram matching of the PAN data with the first principal component as first step. Next step involves replacement of the first principal component by the stretched PAN image. Finally, the inverse PCA transform was performed to obtain XS high resolution imagery.
2.2 Intensity Hue Saturation (IHS)
IHS transform is the most widely used image fusion method that comprises of transforming the Red, Green and Blue (RGB) bands of the XS image into IHS components by replacing the intensity component by the PAN image and performing the inverse transformation to obtain a high spatial resolution XS image (Whang et al., 2005; Carper et al., 1990). The IHS algorithm transforms the data from RGB space into their related intensity, hue and saturation components: where intensity refers to brightness of color, hue refers to the dominant or average wavelength of light contributing to a color and saturation specifies the purity of a color relative to gray. This permits separation of the spatial information into the intensity component from the spectral information, which is split into its related hue and saturation components (Carper et al., 1990).
A simplified model for the IHS transformation proposed by Pohl and Van Genderen (1998) has been implemented in many commercial software to test the suitability of the IHS method for Very High Resolution (VHR) images. The three XS bands, R, G and B, of a low resolution images are first transformed to the IHS color space using the following transformation as (Carper et al., 1990);
\(\begin{pmatrix} I \\ V1 \\ V1 \\ \end{pmatrix}={\begin{pmatrix} 1/3 & 1/3 &1/3 &\\ 1/\sqrt6 & 1/\sqrt6 & -2/\sqrt6 \\ 1/\sqrt2 & -1/\sqrt2 & 0 \\ \end{pmatrix}}\) (2)
\(H=tan^{-1}({\frac{V2}{V1}})\) (3)
\(S = \sqrt{V1^2+V2^2} \) (4)
where, I, H and S are intensity, hue and saturation and V1 and V2 are the intermediate variables. Fusion proceeds by replacing component I with the panchromatic high-resolution image information, after matching its radiometric information with the component I. The fused image, which has both rich spectral information and high spatial resolution, is then obtained by performing the inverse transformation from IHS back to the original RGB space as:
\(\begin{pmatrix} R \\ G \\ B \\ \end{pmatrix}={\begin{pmatrix} 1 & 1/\sqrt6 &1/\sqrt2 &\\ 1 & 1/\sqrt6 & -1/\sqrt2 \\ 11/\sqrt2 & -2/\sqrt6 & 0 \\ \end{pmatrix}}\begin{pmatrix} I \\ V1 \\ V1 \\ \end{pmatrix}\) (5)
Implementing IHS in the above summarized manner proves to be effective and is termed as the fast IHS technique (FIHS) (Tu et al., 2001; Liu et al., 2001), thereby making IHS perfect for the large volumes of data produced by satellites.
2.3 Wavelet Transform (WT)
Wavelet transform is a mathematical tool developed originally in the field of signal processing and is based on the wavelet decomposition of images into different components based on their local frequency content and is similar to Fourier transform analysis. This transformation method applies short, discrete “wavelets” instead of long waves. The wavelet transform breaks down the signal based on primary functions i.e. the wavelets into a set of multi-resolution images bearing wavelet coefficients that contains spatial differences between two successive resolution levels. The wavelet transform of a distribution f(x) can be expressed by the following equation (Mallat, 1989):
\(W(f)(a,b)=|a|^{-1/2}\int\limits_{-\infty}^\infty f(x)\psi(\frac{t-b}{a})dx\) (6)
where, \(a\) and \(b\) are scaling and translational parameters, respectively. Every base function \(\psi(\frac{t-b}{a})dx\) is a scaled and translated version of a function \(\psi\) called mother wavelet. Wavelet transforms proves to be useful in a wide variety of image processing applications, including image enhancement, compression and fusion (Schowengerdt, 1980; Vrabel, 1996; Pohl and Van Genderen, 1998; Liu, 2000).
2.4 Data Characteristics and Pre-processing
The analysis is carried out on QuickBird satellite image acquired on Jan. 08, 2012 of a part of Penang State of Malaysia. The QuickBird images utilized here are the XS image with 4 spectral bands having resolution 2.44m and a high resolution PAN image having resolution equal to 0.61m. Both the images depict several settlement areas with roads, parks and surrounded by grass and forest with mainly palm oil plantation. These images are cloud-free over the study area and no visible atmospheric effects were observed. The details of the satellite images used in the study area are given in Table 1. The most important prerequisite for any successful image fusion is the accurate and precise co-registration of XS data with PAN image. The XS data were co-registered with respect to the reference PAN image by using 385 ground control points (GCPs) and a second-degree polynomial geometric correction model with RMS error of 0.18 pixel. In order to generate similar pixel size to PAN, the XS data were digitally enlarged by a factor of four in both directions. To avoid from blockiness effects, results were smoothed using a 3 by 3 low pass filter (Chavez et al., 1991).
Table 1. Details of QuickBird images used in the fusion analysis
|
Satellite Data
|
Spectral Bandwidth (µm)
|
Spatial Resolution (m)
|
Acquisition Date
|
|
QuickBird PAN
|
0.45-0.99
|
0.61
|
January 08, 2012
|
|
QuickBird XS
|
Band 1: 0.45-0.52
Band 2: 0.52-0.60
Band 3: 0.63-0.69
Band 4: 0.76-0.85
|
2.44
2.44
2.44
2.44
|
January 08, 2012
|
3 . RESULTS AND DISCUSSION
The objective of image fusion is to deduce XS image that maintains the spectral qualities of the lower spatial resolution XS image with the spatial qualities of the higher resolution PAN image. In the present study, three image fusion techniques are applied to high resolution QuickBird XS and PAN images to assess the quality of the fused products. To quantify the spectral and spatial changes, visual assessment, inter-band correlations as well as correlation between PAN image and the three bands (2, 3 and 4) of the XS image and fused images are evaluated and analyzed. Also, correlation coefficients between the band of three fused images and corresponding bands of original XS image are evaluated to assess the best spectral quality restored from the three fusion techniques.
3.1 Visual Assessment
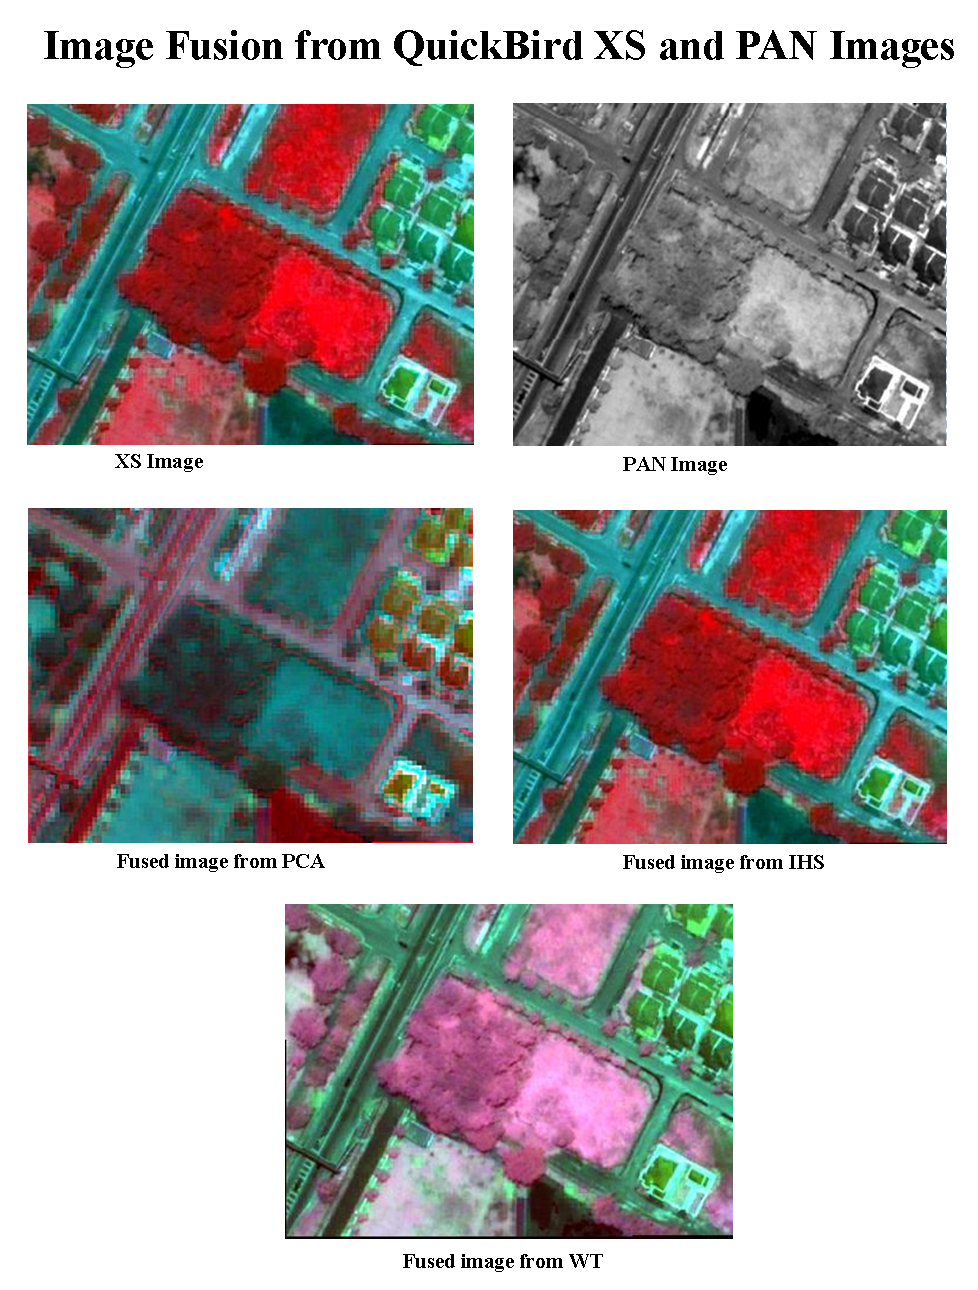
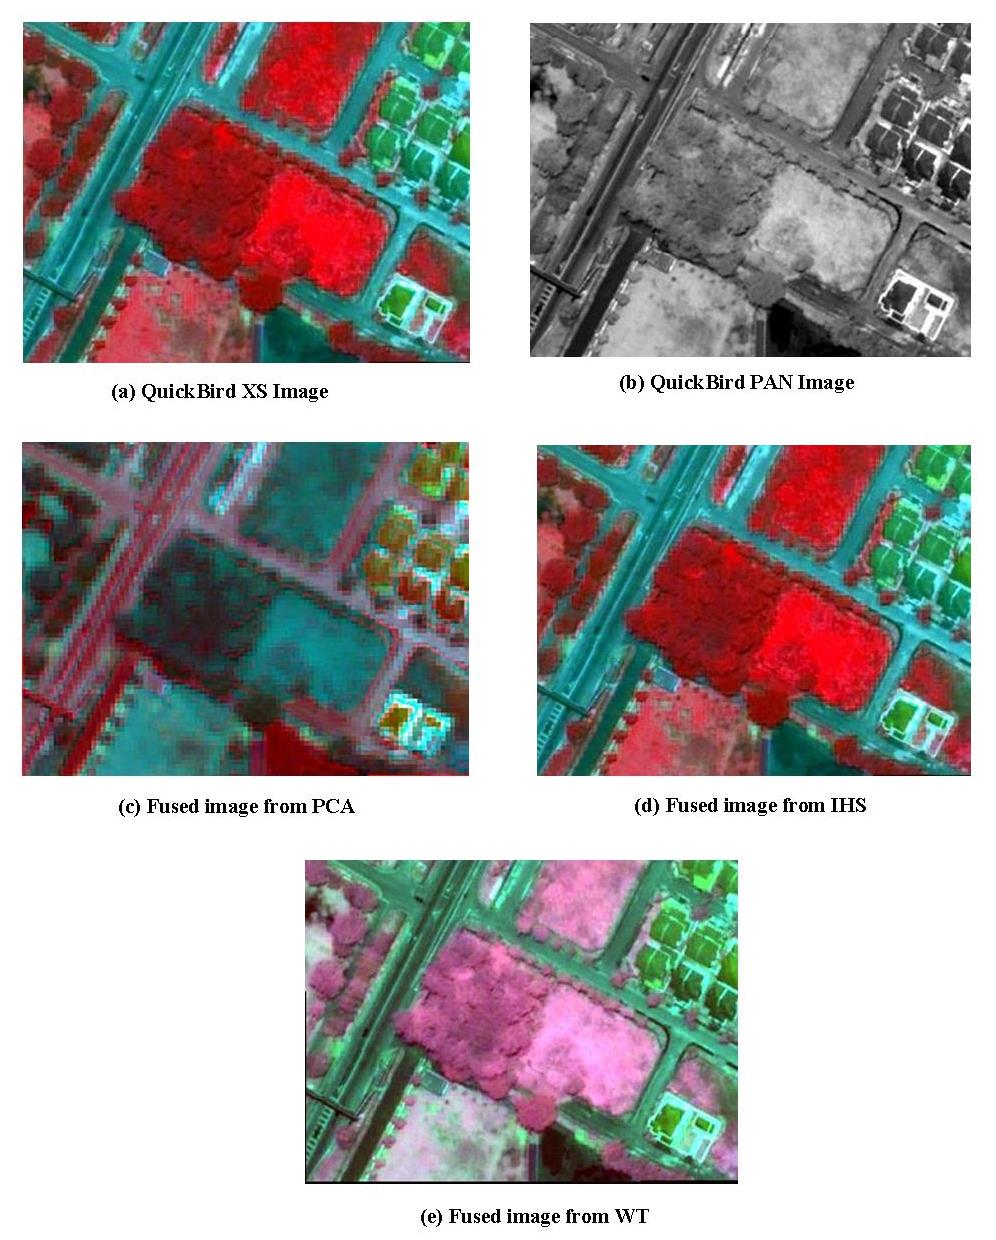
Visual interpretation of the fused images with respect to the original XS image as illustrated in Figure 1 (a, b, c, d and e), is carried out for the qualitative assessment suggesting the enhancement of the spatial details in all the three fused images i.e. the resolution of fused images improves accordingly, although the degree of sharpness varies in accordance with the fusion techniques implemented.
As observed in Figure 1c, the PCA fusion algorithm tends to degrade the spatial as well as spectral resolution of the resultant image to an extent that makes features almost distorted with stepped edges. Color pattern seems to have changed and the fused image appears darker with coarser vegetated areas when compared with the original XS image. Wavelet transform (Figure 1e) improves the spatial resolution but distorts the spectral details of the fused image. It is remarkable to note that the red color of the trees and grassland changed to violet in the 4, 3 and 2 band combinations. The apparent color distortion associated with Wavelet fused image works to the advantage of the interpreter in a way that vegetation and the edges of the buildings are sharp and easily identifiable. The IHS transform (Figure 1d) generates good visual results by preserving the spectral characteristics in all the possible 4, 3 and 2 band combinations as well as with holds high spatial information inherited from the PAN image. Overall, the IHS transform performs the best spatially as well as spectrally as compared to the other two fusion techniques where road edges and intersections are distinct and the cars can be clearly seen on the highway.
From visual interpretation, it can be concluded that high information content (i.e. spatial and spectral) is restored in the fused image obtained from IHS transform method that enables the identification of single buildings, space between buildings, distinct vegetation areas, distance from the roads and small approach roads. This information can be helpful for planning and management of residential or commercial areas.
3.2 Qualitative Assessment
The proximity between two images can be measured in terms of the correlation function that ranges from -1 to +1. A correlation coefficient value of +1 indicates that the two images are extremely correlated, i.e., very much similar to one another whereas value of -1 indicates the two images to be exactly opposite to each other. Inter-band correlation is a significant dimension that should be preserved in fused images. Carper et al. (1990) used inter-band correlation to quantify the spectral changes resulting from image fusion. Table 2 compares inter-band correlations between the original XS QuickBird image and fused images obtained from the three employed fusion techniques for three selected band combinations (i.e. band 2 and 3, band 2 and 4, and band 3 and 4).
Table 2. Inter-band correlation for original XS QuickBird image and fused images
|
Type of Image
|
Band 2 and 3
|
Band 2 and 4
|
Band 3 and 4
|
|
Original QuickBird Image
|
0.917
|
0.432
|
0.568
|
|
PCA
|
0.757
|
0.067
|
0.067
|
|
IHS transform
|
0.938
|
0.461
|
0.184
|
|
Wavelet Transform
|
0.846
|
0.221
|
0.49
|
While the differences are slight, fused image from IHS transform are more similar to that of the original XS image than from PCA and WT techniques. It is also observed that all three fusion techniques produce a strong inter-band correlation ranging from 0.938 to 0.757 in bands 2 and 3. However, the IHS method results in correlation values for bands 2 and 3 and band 2 and 4 (i.e. 0.938 and 0.461, respectively) that are reasonably in close agreement with those for the original XS image thereby, indicating the preservation of the spectral resemblance of the two images. Inter-band correlation values from the other two implemented fusion techniques resulted in lower values for all the three band combinations indicating slight to moderate spectral distortions in the fused images. The same holds good from the analysis of correlation between the PAN image and each band of the original XS image, as shown in Table 3. Therefore, inter-band correlations reveal IHS transform technique to produce the highest spectral quality image while preserving the maximum spectral information from the original QuickBird image as compared to the other two fusion techniques implemented. The correlation coefficient for IHS fused image for all three spectral bands and PAN data are in close agreement with those of original QuickBird image suggesting IHS to be more efficient fusion technique than the other two. The negative correlations in PAN and band 2 and 3 of the fused images obtained from PCA and Wavelet techniques indicate declination leading to loss in the spectral information and insertion of spatial error in the two bands leading to the surface features extraction in these bands to be extremely impossible.
Table 3. Correlation coefficient between PAN image and the bands of original QuickBird Image and fused images
|
Type of Image
|
PAN and Band 2
|
PAN and Band 3
|
PAN and Band 4
|
|
Original QuickBird Image
|
0.254
|
0.184
|
0.663
|
|
PCA
|
0.651
|
0.695
|
-0.298
|
|
IHS transform
|
0.228
|
0.177
|
0.718
|
|
Wavelet Transform
|
0.324
|
-0.052
|
0.483
|
It is therefore ascertained that the best spectral information is restored in the fused image produced from the IHS transform that preserves the multispectral integrity between all the bands under consideration. The spectral quality of the fused image is of worthiness if the correlation between the bands of original image and fused image values are in close agreement. Each spectral band of the original XS image is correlated with the respective bands of the three fused images and results are presented in Table 4.
Table 4. Correlation coefficient between the original and fused QuickBird images
|
Type of Image
|
Band 2
|
Band 3
|
Band 4
|
|
PCA
|
0.736
|
0.678
|
0.590
|
|
IHS transform
|
0.931
|
0.965
|
0.983
|
|
Wavelet transform
|
0.828
|
0.749
|
0.864
|
It is observed that correlation coefficient for all three bands is highest for IHS transform technique and ranges between 0.931, 0.965 and 0.983 for band 2, band 3 and band 4, respectively. The PCA and Wavelet transform methods create bands with the medium correlations ranging from 0.590 to 0.864. Statistical parameters including mean and the standard deviation are analyzed and results are presented in Table 5.
Table 5. Mean and standard deviations (SD) for the original and the fused images
|
Type of Image
|
Band 2
|
Band 3
|
Band 4
|
|
Mean
|
SD
|
Mean
|
SD
|
Mean
|
SD
|
|
Original QuickBbird Image
|
497.0
|
82.5
|
300.8
|
81.9
|
730.4
|
209.7
|
|
PCA
|
508.1
|
107.6
|
319.1
|
99.3
|
710.0
|
217.1
|
|
IHS transform
|
494.7
|
90.1
|
298.9
|
84.3
|
721.7
|
202.5
|
|
Wavelet transform
|
574.9
|
100.2
|
298.3
|
95.7
|
726.8
|
197.9
|
Statistical measures indicates that IHS transform technique best preserves the spectral fidelity of the original XS image by restoring the statistical parameters of the fused image to be in close agreement, thereby, inducing less errors in all the three spectral bands.