Only 14% of Dhaka City is adequately served regarding eye care hospitals, while 45% is overserved and 41% underserved, showing poor resource distribution.
ANN ratio 3.34 confirms facilities are widely dispersed, increasing travel time and delaying access.
About 66.7% face financial barriers, the highest among low-income households (<10,000 BDT/month).
People with disabilities and slum dwellers face significant access challenges due to poor infrastructure, transport, and a lack of information.
Dhaka North is overserved, while Dhaka South is underserved, especially in dense peripheral areas.
Abstract
Access to quality eye care is vital for public health, yet in Bangladesh, it is hindered by inadequate infrastructure, limited facilities, and insufficiently trained personnel. This study examines the accessibility and spatial distribution of eye health services in Dhaka City Corporation using Geographic Information Systems (GIS), Eight Key Informant Interviews (KIIs), and Six Focus Group Discussions (FGDs). GIS analysis revealed that only 14% of the city is adequately served, 45% is overserved, and 41% is underserved. The Average Nearest Neighbour (ANN) analysis indicated a significantly dispersed pattern (ANN ratio = 3.34; z-score = 20.49; p < 0.001). Key challenges include financial constraints (66.7% of respondents), poor accessibility for people with disabilities, transportation barriers, and lack of service information. While 68.8% of participants were satisfied with services and gender parity was noted, gaps in coverage and consistency persist. The findings call for equitable distribution of resources, mobile outreach, and improved affordability.
Keywords
Average nearest neighbor , Eye care , GIS , Healthcare facility , Public Health
1 . INTRODUCTION
Vision is the most significant sensory ability for humans, greatly influencing life, health, sustainable development, and the economy. Globally, approximately 250 million individuals experience moderate to severe vision impairment, with 36 million among them being blind. Additionally, over one billion people suffer from near-vision impairment due to the lack of access to reading glasses. Bangladesh, as a developing nation, has a population of about 165 million (Hussain et al., 2022).
Geospatial mapping and accessibility analysis of health facilities, particularly within the context of eye care services in Bangladesh, underscores the vital role of Geographic Information Systems (GIS) in understanding the spatial distribution of healthcare resources (Smith and Johnson, 2021). The utilization of GIS has been pivotal in identifying the location and distribution of health facilities, enabling an assessment of accessibility and disparities in service coverage (Brown and Lee, 2022; Garcia and Jackson, 2020). Studies by Patel and Jones (2019) and Davis, and Martinez (2019) have highlighted the importance of GIS in uncovering disparities in access to eye care services, particularly in remote and underserved regions, shedding light on the challenges faced by individuals seeking such services.
Furthermore, the diverse array of healthcare service providers in Bangladesh, including public institutions, private clinics, NGOs, and community initiatives, has been noted to contribute to increased access to eye care services (Liu and Wang, 2018; Brown and Lee, 2022). However, it is crucial to address the existing disparities in service coverage, which may be influenced by factors such as funding availability, infrastructure, and population density (Johnson and Anderson, 2017; Kim and Gupta, 2018). Recommendations from various studies underscore the need for strategic planning, mobile clinics, transparency in pricing and quality assurance, and community-based initiatives to enhance equitable access to eye care services within the targeted region (Rodriguez and Williams, 2021; Anderson and Smith, 2020; Davis and Martinez, 2019; Patel and Jones, 2019). In summary, this literature review emphasizes the significance of GIS-based mapping in assessing and addressing healthcare accessibility issues, with a particular focus on eye care services in Bangladesh.
Access to quality eye care services is a fundamental component of overall healthcare, with a significant impact on individuals’ well-being and quality of life. However, in Bangladesh, there are persistent challenges in ensuring easy and equitable access to eye care services for the population. The limited availability of health facilities, inadequate infrastructure, and insufficiently trained personnel pose barriers to accessing timely and appropriate eye care services. To address these challenges and improve access to eye care services in Bangladesh, a comprehensive assessment is required. This assessment will encompass various components, including mapping health facilities, conducting needs assessment of the target population, and evaluating facilities in the locality and among the target population. The objective is to identify the existing gaps, barriers, and challenges that hinder easy access to eye care services and develop effective strategies to overcome them.
Mapping medical facilities will provide a comprehensive understanding of the eye care services offered in the targeted area, their capacity, and geographic distribution. This will help to identify further interventions and resource allocation. The targeted population’s needs assessment will provide insight into their goals and needs for eye care, allowing interventions to be tailored to their demographics, prevalence of eye problems, and utilization patterns. The facilities assessment and mapping will evaluate the readiness of health facilities to deliver quality eye care services. It will identify gaps in resources and capacity, allowing for targeted interventions to enhance service delivery. Overall, the objective of this study is to conduct mapping and identification of health facilities in the targeted area, with a specific focus on identifying existing eye care services and their targeted locations.
1.1 Eye Health Status in Bangladesh
The World Health Organization (WHO) estimates that globally, around 2.2 billion people are affected by visual impairments due to various eye diseases. These include presbyopia (1.8 billion cases), refractive error (123.7 million), cataracts (65.2 million), age-related macular degeneration (10.4 million), glaucoma (6.9 million), corneal opacities (4.2 million), diabetic retinopathy (3 million), trachoma (2 million), and other eye disorders (37.1 million). Notably, about 90% of these visual impairments occur in low and middle-income countries (LMICs) (WHO, 2021). In Bangladesh, a significant LMIC with a population exceeding 160 million, more than 6 million people are reported to have visual impairments, with an additional 0.75 million estimated to be blind as of 2019. The WHO highlights that approximately 80% of such visual impairments, including loss of central and side vision, blurred vision, generalized haze, light sensitivity, night blindness, and blindness, can potentially be prevented with adequate and timely eye care, a level of intervention not always available for many chronic diseases (The Daily Star, 2021). In Bangladesh, a developing nation, the high prevalence of blindness has a significant impact on socioeconomic conditions. The Bangladesh National Blindness and Low Vision Survey 2000 reported an age-standardized blindness prevalence of 1.53%, indicating that approximately 675000 adults aged 30 and above are blind in the country. The survey also found a higher incidence of blindness and low vision (LV) in the elderly, women (1.72% vs. 1.06% in men), the illiterate, and manual laborers among men compared to non-manual workers. Geographically, the highest rates of bilateral blindness were in the Barisal (2.28%) and Khulna (1.97%) Divisions, with lower rates in other areas, including Dhaka Division at 1.13%. Cataracts were identified as the leading cause (79.6%) of bilateral blindness, and cataract surgical coverage (CSC) was alarmingly low across Bangladesh (32.5%), particularly in Barisal Division. CSC was notably lower for women and in rural areas compared to urban areas. The study highlighted a significant number of uncorrected Aphakia-aphakic’s (post-cataract surgery patients without proper spectacle correction), especially among women, those who had surgery in eye camps, the illiterate, and rural residents. This indicated a need for better quality and more frequent cataract surgeries, with a focus on improving operative techniques and postoperative care (Hasan et al., 2023). Additionally, the survey estimated a 0.56% prevalence of LV in the adult population aged 30 and above. Leading causes of LV included retinal diseases (38.4%), corneal diseases (21.5%), glaucoma (15.4%), and optic atrophy (10.8%). Based on these findings, approximately 250,000 adults in Bangladesh require low-vision services (Islam et al., 2023).
2 . STUDY AREA
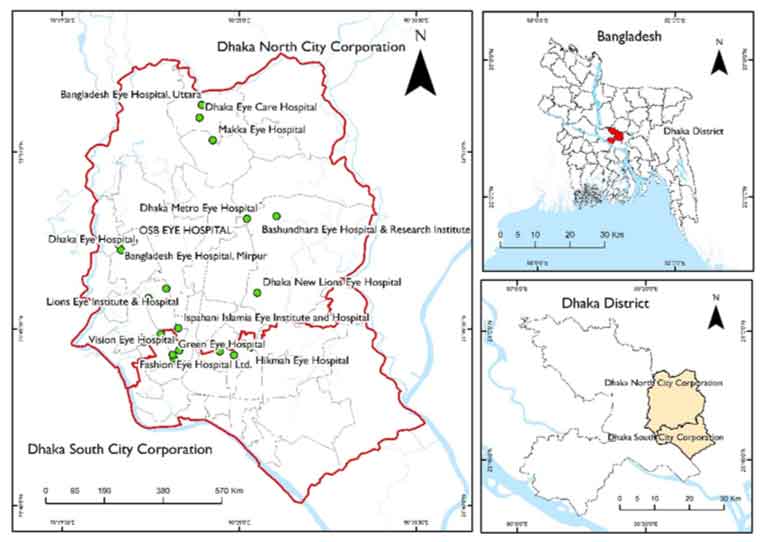
Dhaka City Corporation (DCC), situated in the heart of Bangladesh, serves as the administrative nucleus for the sprawling capital city of Dhaka. Geographically, Dhaka is positioned in the central part of the country, and it holds a pivotal role as an economic, cultural, and political hub. According to recent literature, the city’s geographical coordinates are approximately 23.8103° N latitude and 90.4125° E longitude (Shammi et al., 2023). In Dhaka North, the total population is 5,979,537, comprising 3,260,537 males and 2,718,096 females. The population density is reported at 30,474 individuals per square kilometer, illustrating the high level of urbanization and compact living in this region. Similarly, in Dhaka South, the total population is 4,299,345, with 2,334,858 males and 1,963,834 females (BBS, 2022).
The population density in Dhaka South is notably higher, reaching 39,353 individuals per square kilometer, indicating a more densely populated urban environment. These figures highlight the significant demographic diversity and urban density within the two city corporations, reflecting the complex social fabric and dynamic nature of Dhaka (BBS, 2022).
Figure 1. Study area
3 . MATERIAL AND METHOD
3.1 Overall Study Approach
The comprehensive approach to this study involved the utilization of Geographic Information Systems (GIS) and Key Informant Interviews (KIIs) with a range of stakeholders, including government and non-government resource persons such as civil surgeons, upazila and district health officers, and various healthcare stakeholders. Additionally, on-site visits to medical centres, community clinics, and government-affiliated eye care chambers, as well as document evaluation and discussions with local government authorities, followed a systematic methodology. To achieve the research objectives, several research methods were employed, including desk research, Focus Group Discussions (FGDs) with open-ended questions, as well as semi-structured questions for respondent profiling and identification of level of satisfaction and burden. Key Informant Interviews (KIIs) were also conducted.
FGD and IDI methods were employed to gain insights into the common patterns and situational analyses of eye care centres from the perspective of beneficiaries or users. In contrast, KII was instrumental in conducting situation analyses and identifying critical information such as area coverage, organizational details, the number of facilities in the locality, types of eye care services offered, organizational capacities, contact information for service access, and service provision frequencies.
Although the study included a total of 8 Key Informant Interviews (KIIs) and 6 Focus Group Discussions (FGDs), the sample size was strategically determined to ensure the depth and diversity of perspectives rather than statistical generalization. Participants were selected through purposive sampling to capture a wide range of insights from key stakeholder groups, including government health officials, representatives from non-governmental and civil society organizations, local government authorities, religious and ethnic community leaders, persons with disabilities advocates, health representatives, and slum community representatives. The FGDs focused on slum dwellers, one of the most marginalized populations in Dhaka, providing valuable insights into the grassroots challenges of accessing eye care services. Despite Dhaka’s large and socio-demographically diverse population, the selected sample provided rich, contextually grounded data across varied demographic and institutional categories. Therefore, the limited number of interviews and discussions is justified by the diversity and relevance of the participants, ensuring thematic saturation appropriate to the qualitative nature of the study.
This study adhered to the standard ethical procedures commonly applied in field-based qualitative research. Before participation in Key Informant Interviews (KIIs) and Focus Group Discussions (FGDs), all respondents were provided with a clear explanation of the study’s purpose, how the information would be used, and their rights as participants. Informed verbal consent was obtained from each participant before the commencement of the interviews or discussions. Participants were assured that their involvement was entirely voluntary and that they could withdraw at any time without consequence or penalty. To ensure confidentiality, no personal identifiers were collected, and all responses were anonymized during transcription and analysis. Data were stored securely, accessible only to the research team, and used solely for academic purposes.
Based on findings from the FGD and KII, it was determined that the average service area for eye healthcare was approximately 3 Km. Using this information, a 3 Km buffer zone was created for eye health care services. Subsequently, a dissolved buffer was generated at the same length, and an intersect analysis was performed between the undissolved and dissolved buffers. This process allowed for the calculation of the overserved area, with the dissolved buffer serving as the served area. The total served and overserved area was then determined using identity features. Finally, the underserved area was calculated by intersecting the dissolved ward boundary with the total served and overserved area. The percentages of served, underserved, and overserved areas were calculated based on these values using MS Excel.
In the Dhaka region, 6 Focus Group Discussion (FGD) sessions were conducted (8 respondents in each FGD Session), primarily targeting ‘Slum people/Slum dwellers’. These FGDs were aimed at gaining valuable insights, opinions, and perspectives from residents of slum communities in Dhaka. The objective was to obtain a deeper understanding of their experiences, challenges, and needs, enabling a more comprehensive approach to addressing their specific concerns. Furthermore, in the same region, Key Informant Interviews (KIIs) were conducted across various categories of key informants. Notably, 2 KII were held with individuals categorized as ‘Public representative-community leaders’, which included elected representatives and local leaders.
Additionally, 1 KII was conducted with Religious Leaders. Another KII involved representatives from organizations focused on persons with disabilities, while 2 KII featured individuals from Non-Governmental Organizations (NGOs), Civil Society Organizations (CSOs), and officials associated with Community clinics. A separate KII engaged local government authorities, including Social Welfare Officers and Health care providers from the UHFPO. Lastly, 1 KII involved individuals from the Slum Community leaders. In total, 8 Key Informant Interviews were conducted in the Dhaka region, reflecting a comprehensive and structured approach to gather diverse insights and perspectives from various stakeholders in the area.
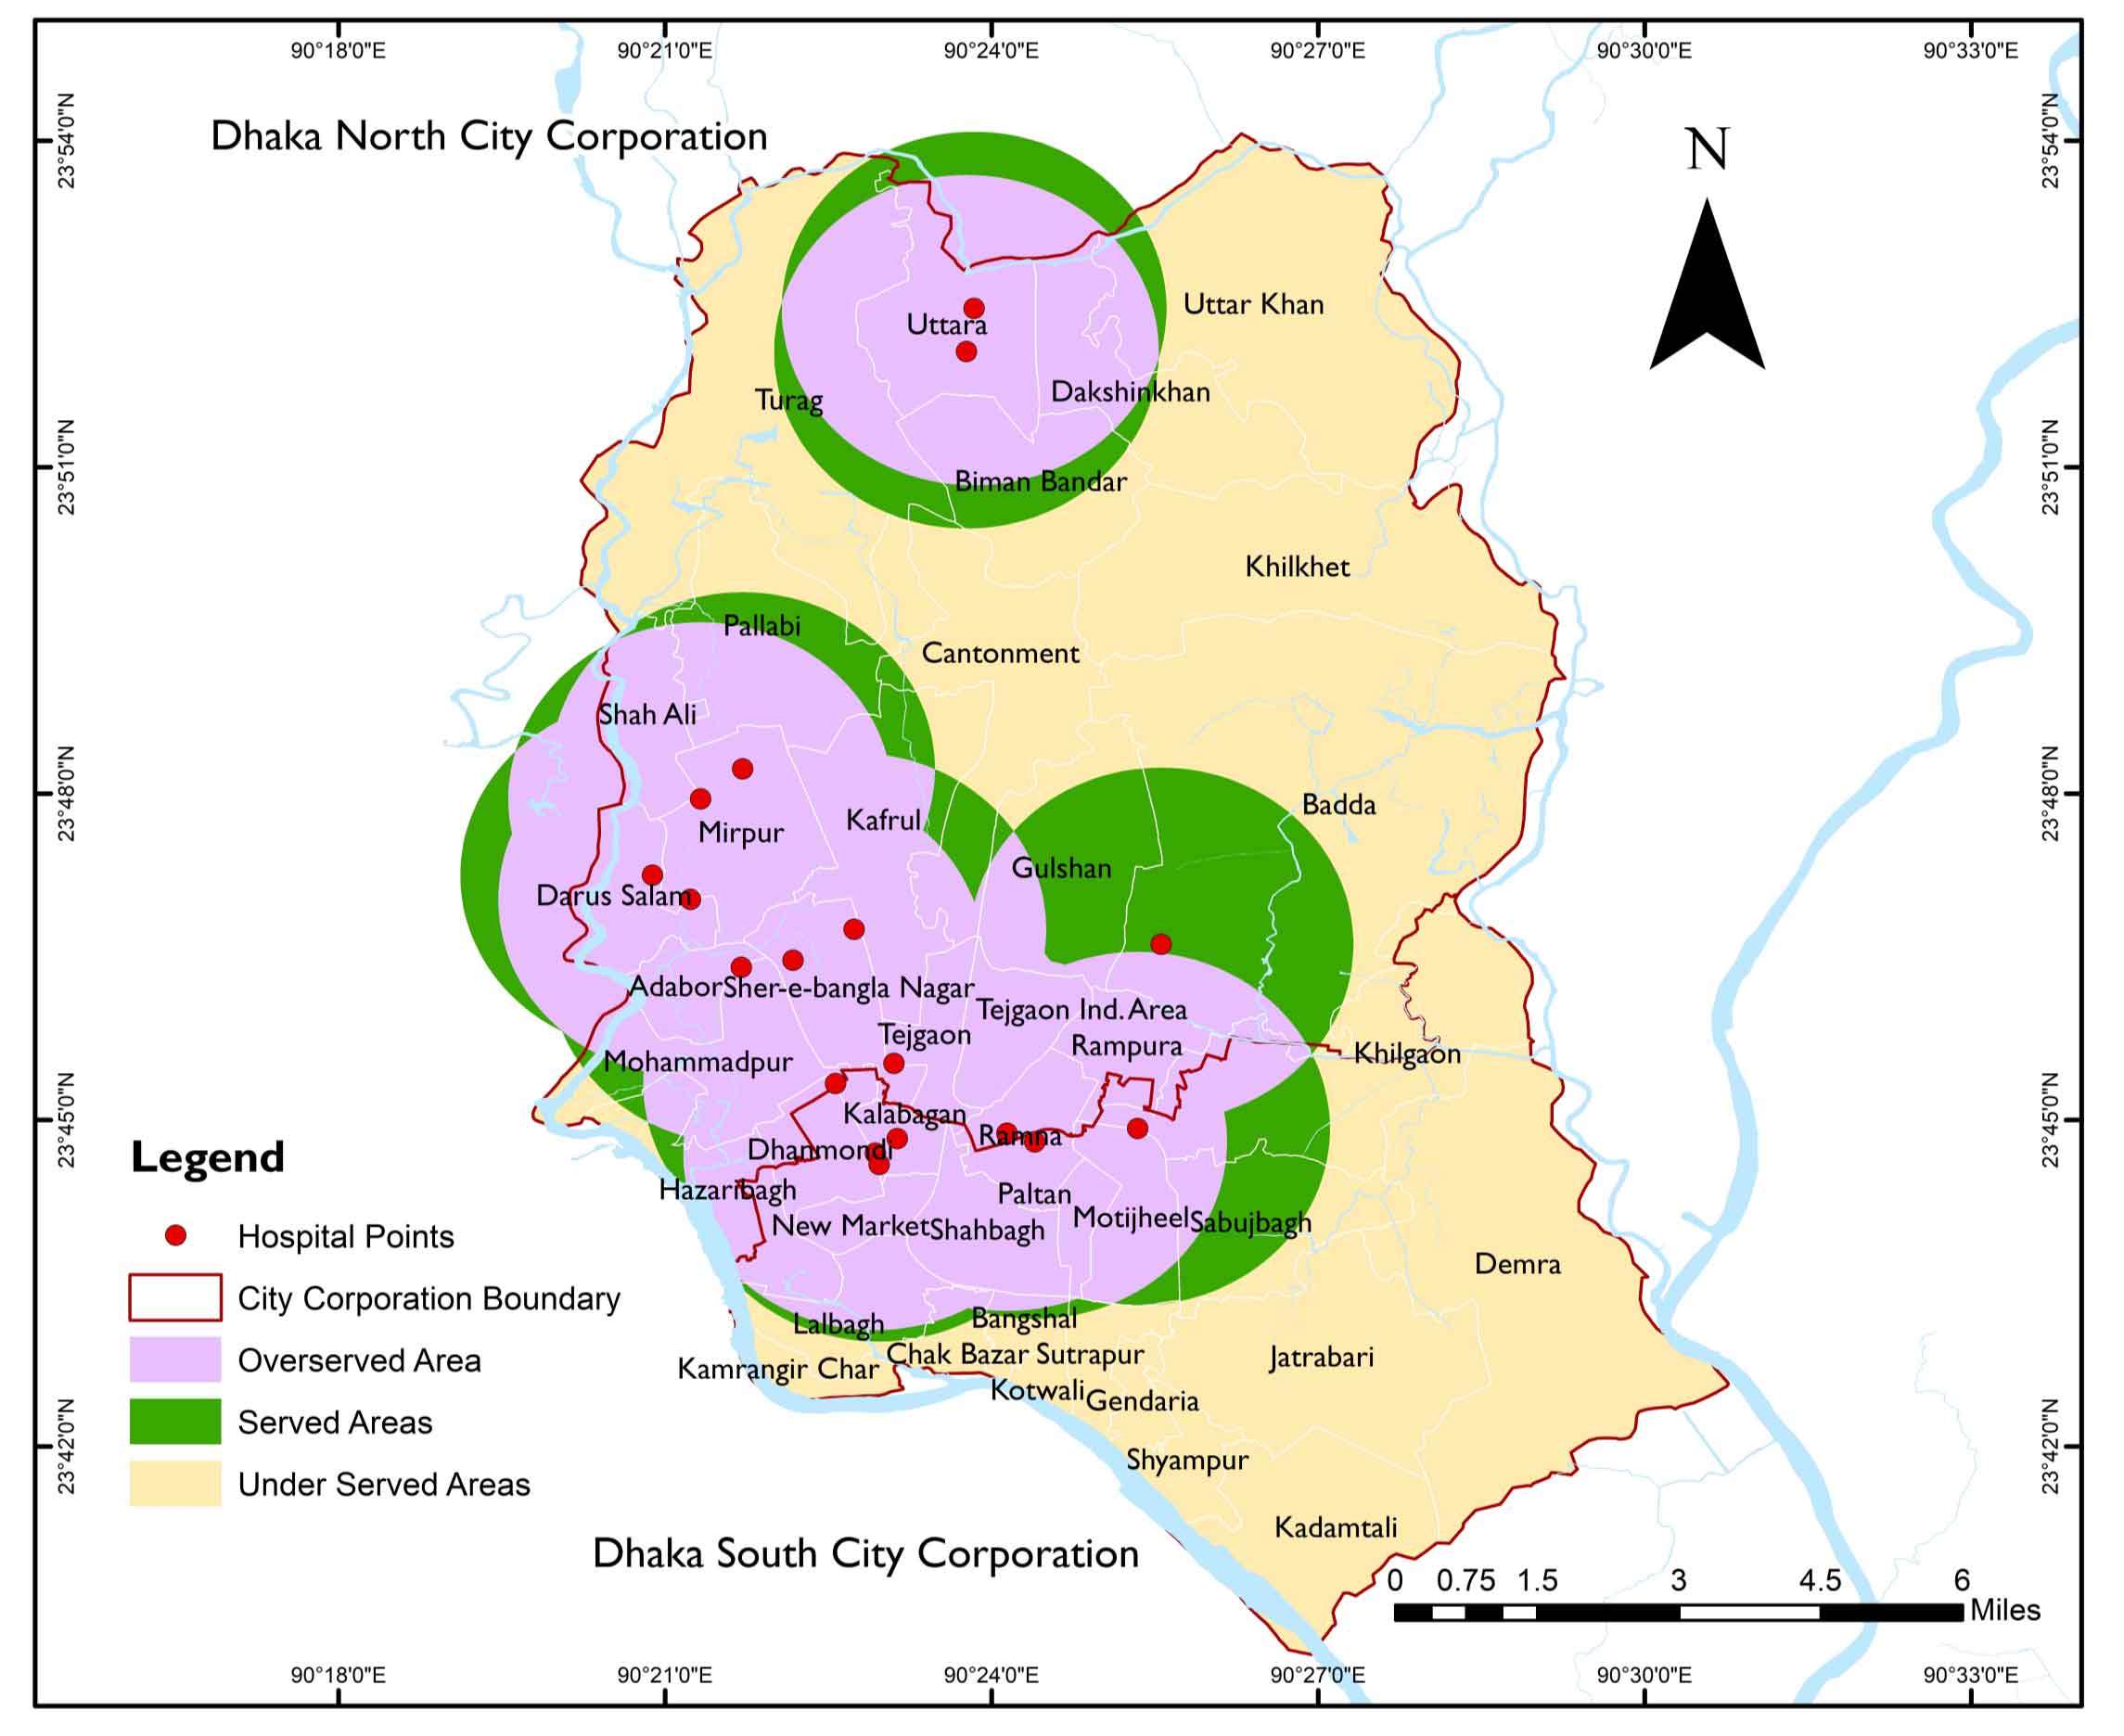
Furthermore, the study utilized GIS for service facility assessment mapping, employing the ‘served’, ‘underserved’ and ‘overserved’ approach, a common method in Geographic Information Systems (GIS) for analyzing the spatial distribution of service facilities and evaluating their accessibility. This approach categorizes the population or demand areas into three categories: ‘served’ areas, where service facilities sufficiently meet demand; ‘underserved’ areas, characterized by unmet demand; and ‘overserved’ areas, where service facilities exceed demand, possibly leading to inefficient resource allocation (Higgs et al., 2015).
The GIS data used in this study were sourced from multiple reputable channels to ensure comprehensive spatial analysis. Health facility location data were obtained from the Directorate General of Health Services (DGHS) and local government records. Administrative boundaries and ward-level shapefiles were acquired from the Bangladesh Bureau of Statistics (BBS) and the Local Government Engineering Department (LGED). Base maps and high-resolution satellite imagery were sourced from Open Street Map and Google Earth Pro (accessed between January and February 2024) to support the geolocation and visualization of eye health facilities. On-site visits and field verification supplemented the facility readiness and service provision data during the primary data collection phase (March to April 2024). While these sources provided a robust foundation for spatial analysis, certain limitations should be noted. Some government databases lacked the most recent updates, and minor discrepancies were observed between reported locations and field-verified GPS coordinates. Additionally, the absence of a centralized and up-to-date health facility registry may limit the completeness of the dataset. These limitations were mitigated through triangulation with field observations, interviews, and visual validation using satellite imagery.
3.2 Average Nearest Neighbor
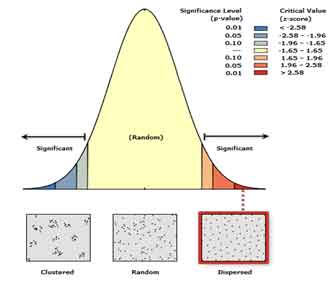
The Average Nearest Neighbor (ANN) metric is a crucial tool in geographic analysis, gauging the distance between the central points of spatial features and their nearest counterparts. It involves averaging these distances and comparing them to a hypothetical, random spatial distribution. When the spatial layout under observation (the observed) exhibits mean distances that are shorter than those in an imaginary random (expected) distribution, the pattern is classified as clustered, resulting in an average nearest-neighbor ratio of less than one. Conversely, when the observed mean distance exceeds the expected random distribution, the spatial arrangement is deemed dispersed, characterized by an average nearest-neighbour ratio greater than one (ESRI, 2015).
Within the realm of Geographic Information Systems (GIS), ANN analysis is a pivotal spatial statistic for examining the clustering or scattering of point features. This method calculates the mean distance between each point and its nearest neighbor and contrasts it with the expected mean distance in a scenario of complete spatial randomness (CSR) (Getis and Ord, 2010). The ANN index is invaluable for deciphering spatial patterns and determining whether point features are clustered or randomly distributed within the study area. Values below one signify clustering, whereas values above one indicate dispersion. This analysis has found applications across diverse fields, including ecology, urban development, and epidemiology, aiding researchers in pinpointing spatial trends and informing decision-making processes (Wang et al., 2017). By employing ANN analysis in GIS, professionals gain a deeper understanding of the spatial dynamics of point features, which is essential for making informed decisions to address spatial patterns and optimize resource allocation.
The mean separation between two neighbours (Mansour, 2016).
\(\bar{d} =(∑_{i=1}^Nd_i /N)\)(1)
In this context, N represents the number of opinions, and \(d_i\) signifies the proximity of the adjacent neighbor for point i .
The predicted value of the distance between the closest neighbors in a random pattern.
A is the study area’s size, and B is the study area’s perimeter length.
The Variance
\(Var(∂)=0.070A/N^2 +0.038B \sqrt{A/N^2}\) (3)
4 . ANALYSIS AND FINDINGS
4.1 Respondent Profile Summary and Analysis
The study surveyed a total of 48 respondents (6 focus group discussions × 8 respondents per FGD session), with an equal gender distribution of 24 males and 24 females, ensuring balanced representation. The average age of participants was approximately 39.6 years, ranging from 20 to 56, with the majority falling within the 30-49 age bracket. This indicates that the data largely reflects the perspectives of a mature, middle-aged population likely to have more consistent and long-term experiences with healthcare services. In terms of economic background, most respondents belonged to the lower-middle-income group, with monthly incomes ranging from BDT 10,001 to 15,000. A smaller fraction earned above BDT 25,000, highlighting that the study predominantly represents individuals from modest economic settings. This is a crucial consideration when evaluating access to and satisfaction with healthcare services, particularly in terms of their affordability.
Table 1. Demographic profile of the respondents
Category
Sub-category
Frequency
Percent (%)
Sex
Female
24
50
Male
24
50
Total
48
100
Monthly Income
<10,000 BDT
9
18.8
BDT 10,001 - 15,000
14
29.2
BDT 15,001 - 20,000
11
22.9
BDT 20,001 - 25,000
7
14.6
BDT 25,000+
7
14.6
Total
48
100
Satisfaction with Eye Care Services
Satisfied
33
68.8
Not Satisfied
15
31.3
Total
48
100
Financial Burden (Self-Perception)
Burdened
32
66.7
Not Burdened
16
33.3
Total
48
100
Age Group
20-29 Years
9
18.8
30-39 Years
14
29.2
40-49 Years
14
29.2
50+ Years
11
22.9
Total
48
100
Accessibility to Public Eye Care Services
Accessible
31
64.6
Inaccessible
17
35.4
Total
48
100
Regarding access to services, respondents reported an average distance of 3.16 km to the nearest healthcare facility. Despite this, 64.6% of participants reported that services were accessible, suggesting that distance and transportation may not be significant barriers for most. This relatively high rate of perceived accessibility is encouraging, especially among lower-income groups, where service proximity can significantly influence utilization. When asked about satisfaction with the services received, 68.75% of participants expressed positive feedback. Interestingly, satisfaction was higher among women (75%) compared to men (62.5%), possibly reflecting gender-based differences in expectations, experiences, or the nature of services accessed.
Table 2. Satisfaction and financial burden by sex and income group
Satisfaction category
Satisfied / Burden (%)
Not satisfied / Not burden (%)
Level of Satisfaction Based on Sex
Female
25.00
75.00
Male
37.50
62.50
Overall
31.25
68.75
Income Group Satisfaction Level
<10,000 BDT
55.56
44.44
BDT 10,001 - 15,000
21.43
78.57
BDT 15,001 - 20,000
36.36
63.64
BDT 20,001 - 25,000
42.86
57.14
BDT 25,000+
28.57
71.43
Overall
35.42
64.58
Income Group Burden Level
<10,000 BDT
88.89
11.11
BDT 10,001 - 15,000
57.14
42.86
BDT 15,001 - 20,000
72.73
27.27
BDT 20,001 - 25,000
71.43
28.57
BDT 25,000+
42.86
57.14
Overall
66.67
33.33
However, financial burden was identified as a key challenge, with 66.67% of respondents reporting difficulty in affording healthcare services. The burden was most acute among those earning less than BDT 10,000 per month, where nearly 89% experienced financial stress. This strong correlation between income level and financial hardship highlights the need for policy measures, such as subsidized or free services, to ensure equitable access for economically disadvantaged populations. Overall, the findings offer valuable insights into the socioeconomic and experiential factors that shape healthcare access and satisfaction among the study population.
4.2 Gender and Income-Based Differences in Satisfaction, Accessibility and Financial Burden
The analysis reveals notable differences in satisfaction, accessibility, and financial burden across gender and income groups. In terms of satisfaction, females reported a higher rate (75%) compared to males (62.5%), suggesting that eye care services may be more aligned with the expectations or needs of female respondents. This gender-based difference underscores the potential value of developing service delivery models that take into account gender-specific preferences and experiences. When examining accessibility across income levels, disparities become more pronounced. While 78.6% of respondents in the BDT 10,001-15,000 range perceived services as accessible, only 44.4% in the lowest income group (<10,000 BDT) reported the same, indicating that economic barriers, such as transportation costs or proximity to facilities, may be present. Interestingly, 71.4% of those in the highest income group (BDT 25,000 and above) found services accessible, indicating that
financial flexibility enhances access. Satisfaction levels also varied by income: the lowest satisfaction (21.4%) was seen in the BDT 10,001-15,000 group, while higher-income groups showed moderate satisfaction despite having better access. Finally, the financial burden was strongly tied to income levels. A significant 88.9% of respondents earning less than BDT 10,000 reported financial stress, compared to just 42.9% in the highest income bracket. This inverse relationship underscores the necessity of income-sensitive policies, such as subsidized care or transportation support, to ensure equitable access to eye healthcare services across all socioeconomic segments.
The data reveal that Dhaka’s eye health services present a nuanced and multifaceted landscape, characterized by both commendable strengths and notable challenges. A key concern identified is the limited accessibility for individuals with disabilities, an issue stemming from inadequate accommodations at many eye health facilities. This shortfall significantly impedes access to essential services for a vulnerable segment of the population. Transportation issues further exacerbate accessibility challenges, as many Dhaka residents face limited, inconvenient, and costly transportation options. The reliance on public transport, such as buses, rickshaws, and trucks, coupled with the financial burden of high fares, especially for longer distances, represents a substantial obstacle to accessing eye care services. Service quality within the eye health sector appears to be a contentious issue, with public perception varying significantly. This range of opinions, from high satisfaction to discontent, points to an inconsistency in service delivery that warrants attention. Affordability or the lack thereof, emerges as a pervasive concern, with many participants citing financial constraints as a barrier to accessing eye health services. The high costs associated with medical care and additional fees place a significant strain on individuals seeking eye care.
The study also highlights a notable gap in the provision of detailed information regarding the services offered, the equipment used, the capacity of organizations, and the availability of contact details for service providers. This deficiency hinders a comprehensive understanding of the eye health services available in Dhaka. Geographic considerations, particularly the distance to and the location of eye health facilities, are frequently raised as issues. The dispersed nature of these facilities highlights the need for a more strategic and accessible distribution of health centres throughout the city. Inclusivity concerns, particularly those related to accommodating the needs of individuals with disabilities, recur throughout the study. The financial barriers posed by high medical costs and additional fees are consistently cited as significant impediments to accessing eye health care. The study examines a mix of public and private service providers in the eye health sector, indicating a diverse service landscape that encompasses both government hospitals and private organizations.
Notably, the study finds that gender equality in service provision is largely upheld, with both men and women reportedly receiving equitable treatment. The accompanying SWOT analysis provides a structured assessment of the sector’s strengths, weaknesses, opportunities, and threats. It highlights the high accessibility for non-disabled individuals, a variety of transportation options, and the presence of both government and private eye care facilities as key strengths.
However, it also identifies critical weaknesses, such as limited specialized transportation options for individuals with disabilities and high transportation costs. Opportunities for improvement are recognized, including potential collaborations with transportation providers and the expansion of specialized transportation options. Conversely, the analysis highlights looming threats, including the deterrence of patients due to high transportation and medical costs, which could significantly impact the overall accessibility and effectiveness of Dhaka’s eye health services.
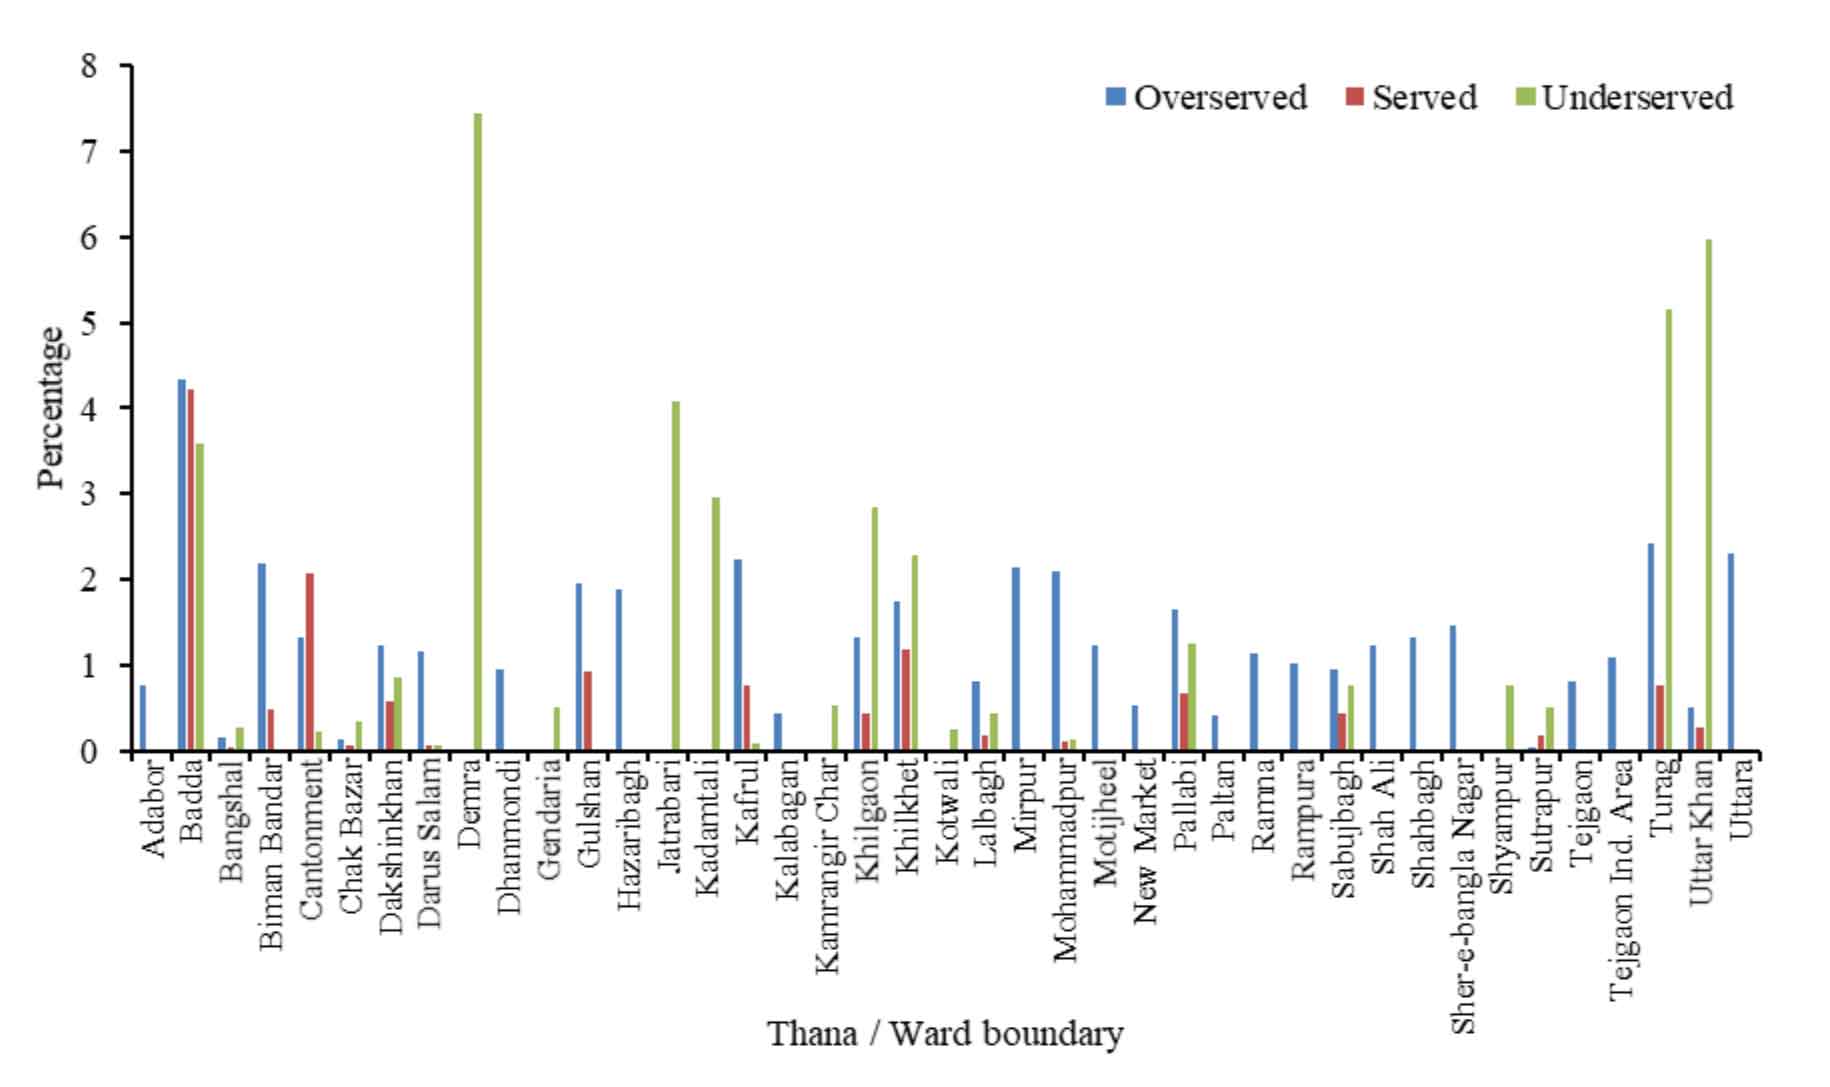
Figure 2. Thana-wise served, over-served, and underserved area
4.3 Served, Overserved, and Underserved Area Identification
The distribution of eye service facilities in the Dhaka Metropolitan Area reveals notable spatial disparities between Dhaka North City Corporation (DNCC) and Dhaka South City Corporation (DSCC), indicating uneven access to essential eye health services. In DNCC, which includes 19 Thanas such as Adabor, Badda, Gulshan, Kafrul, Mirpur, Pallabi, Turag, and Uttara, approximately 15 Thanas (79%) show signs of being overserved particularly Badda (4%), Gulshan (2%), and Turag (2%) suggesting a concentration of eye facilities in more developed or affluent zones. Only 6 Thanas (32%) in DNCC fall into the served category, implying balanced service delivery. In comparison, 7 Thanas (37%) are underserved, with significant service gaps in areas like Turag (5%) and Uttar Khan (6%), which are located on the city’s periphery. Conversely, DSCC covers about 22 Thanas, including Dhanmondi, Hazaribagh, Jatrabari, Kadamtali, Demra, and Kamrangir Char. Here, only 10 Thanas (45%) are overserved, with modest levels in Dhanmondi (1%) and Hazaribagh (2%), while a very small proportion (14%) are adequately served. A larger share 11 Thanas (50%) are underserved, with alarmingly high figures in Demra (7%), Jatrabari (4%), Kadamtali (3%), and Khilgaon (3%). These underserved areas are typically more densely populated and located in the southeastern and southwestern parts of DSCC, where urban infrastructure is more strained. The overall pattern highlights that while DNCC tends to have better access and some degree of facility over-concentration, DSCC is characterized by a systemic under-provision of eye care services. This imbalance highlights the urgent need for targeted investments, decentralization of services, and a policy focus on underrepresented Thanas, particularly in Dhaka South, to achieve equitable access to eye healthcare across the entire metropolitan region.
4.4 Average Nearest Neighbor
Table 1 provides intriguing insights into the spatial relationships within a dataset using a technique known as nearest-neighbor analysis. This method is particularly adept at revealing how points are positioned concerning each other across a given space. Firstly, the ‘Observed Mean Distance for Average Nearest neighbor’ is around 892 m. For example, a landscape sprinkled with various points. This figure indicates that, on average, the distance from any point to its closest neighbor is approximately 892 meters. It’s akin to measuring the distance between each tree in a large forest and its nearest fellow tree and then calculating the average of all these measurements.
Compare this to the ‘Expected Mean Distance’, which is approximately 267.3 m. This number represents the average distance that would be anticipated between points if they were sprinkled randomly across the same area, akin to randomly dropping seeds over a field and measuring the average distance between them.
The ‘Nearest Neighbor Ratio’ ‘of 3.337524 provides context for these two figures. This ratio, being significantly greater than 1, highlights that the points in the dataset are much more spread out than they would be in a random distribution. In simpler terms, it's like observing that the trees in our forest are not just randomly scattered but are in fact, quite deliberately spaced apart. The ‘Z-score’ of 20.492575 is a statistical measure that further accentuates this observation. A high positive Z-score, as in your case, implies that the observed pattern of spacing is not a fluke but a notable deviation from what randomness would produce.
Figure 3. ANN for health care facilities
Table 1. Demographic profile of the respondents
Category
Sub-category
Frequency
Percent (%)
Sex
Female
24
50
Male
24
50
Total
48
100
Monthly Income
<10,000 BDT
9
18.8
BDT 10,001 - 15,000
14
29.2
BDT 15,001 - 20,000
11
22.9
BDT 20,001 - 25,000
7
14.6
BDT 25,000+
7
14.6
Total
48
100
Satisfaction with Eye Care Services
Satisfied
33
68.8
Not Satisfied
15
31.3
Total
48
100
Financial Burden (Self-Perception)
Burdened
32
66.7
Not Burdened
16
33.3
Total
48
100
Age Group
20-29 Years
9
18.8
30-39 Years
14
29.2
40-49 Years
14
29.2
50+ Years
11
22.9
Total
48
100
Accessibility to Public Eye Care Services
Accessible
31
64.6
Inaccessible
17
35.4
Total
48
100
Lastly, the ‘P-value’ of 0.000000 solidifies the conclusion. This value essentially tells us that the chances of seeing such a pattern by mere coincidence are extremely slim, almost negligible. In summary, these numbers collectively paint a picture of a dataset where points are not just randomly thrown together but are significantly and meaningfully dispersed across the space.
5 . DISCUSSION
In this comprehensive mapping assessment, with a primary focus on mapping health facilities for eye care services in Bangladesh and specific attention to the mentioned eye care centers, the study has provided invaluable insights into the state of eye care accessibility and provision across the country. This conclusion incorporates key informant interview (KII) data and further elaborates on recommendations derived from the study. The meticulous mapping of these eye care centers has not only identified their geographic locations but has also delved into the specifics of their services, facilities, and operational capacities. However, it’s the KII data that has added depth and context to this mapping, providing a qualitative dimension to the assessment. This study provides a detailed analysis of eye health service accessibility in Dhaka City Corporation, utilizing GIS and qualitative methods. The results reveal that only 14% of the city is adequately served, 45% is overserved, and 41% is underserved, highlighting inefficient resource allocation and the clustering of facilities in a few areas. At the same time, many residents face significant travel burdens, as confirmed by an Average Nearest Neighbor ratio of 3.34 and a Z-score of 20.49, indicating a highly dispersed facility pattern that limits timely access to essential eye care.
Figure 4. Service facility coverage map for Dhaka
While the respondent profile offers a demographically and economically representative snapshot, highlighting gender parity, a predominantly middle-aged population, and a concentration in lower-middle-income groups, the analysis remains largely descriptive, limiting its explanatory power. Although the study highlights financial constraints as a critical barrier to healthcare access and satisfaction, the absence of formal quantitative modeling limits a deeper understanding of the interactions among key variables, such as income, gender, age, and perceived accessibility. For instance, while lower-income respondents (<10,000 BDT) reported the highest financial burden (88.9%) and the lowest accessibility (44.4%), females indicated greater satisfaction than males (75% vs. 62.5%). However, these trends are presented narratively without statistical validation through correlation or regression analysis. Moreover, variables such as cost of care, affordability thresholds, and service quality are acknowledged but not operationalized through measurable indicators. Incorporating structured survey instruments such as Likert-scale ratings for perceived service quality, direct cost reporting, and affordability indexes would allow these dimensions to be quantified and analyzed systematically. Doing so would not only enhance the analytical consistency of the study but also provide policymakers with actionable, evidence-based insights for designing targeted interventions that address both structural and perceptual barriers in urban eye healthcare delivery.
The spatial distribution of eye health facilities has a significant impact on health outcomes, particularly regarding the prevalence of untreated visual impairments and preventable blindness. Evidence indicates that communities residing in underserved zones those located farther from facilities or without reliable transportation are less likely to access timely care, leading to worsening conditions such as cataracts, refractive errors, and diabetic retinopathy. According to the World Health Organization, more than 1 billion people globally live with vision impairment that could have been prevented or has yet to be addressed due to inadequate access to services (Bourne et al., 2017). The spatial mismatch between need and service availability is especially acute in low- and middle-income countries, where the prevalence of blindness is nearly eight times higher than in high-income countries (WHO, 2019). In Bangladesh, where most ophthalmologists are concentrated in urban areas, 80% of visually impaired individuals live in rural or peri-urban settings with insufficient access (Ichhpujani et al., 2022). A WHO study further notes that untreated cataracts, the leading cause of blindness globally, remain prevalent in areas where healthcare infrastructure is poorly distributed (WHO, 2019). These findings align with this study's GIS analysis of Dhaka, which shows that underserved areas are not only spatially distant from facilities but also socioeconomically disadvantaged, thereby exacerbating health inequities. Strategic redistribution of facilities, investment in mobile clinics, and transportation solutions are essential to reducing the burden of avoidable visual impairment in such contexts.
The findings of this study reveal a complex landscape of eye health service provision in Dhaka, with distinct strengths and challenges that align closely with the results of the SWOT analysis. One of the primary strengths is the high accessibility of eye care services for non-disabled individuals, supported by a relatively wide distribution of both government and private facilities, as observed in the GIS mapping and field visits (Hasan et al., 2023). The presence of multiple transportation modes, such as rickshaws, buses, and ride-sharing services, further facilitates access for the general population (James, 2021). However, this accessibility does not extend equally to all groups. A significant weakness is the lack of specialized transportation and facility accommodations for individuals with disabilities, a gap frequently noted in the Key Informant Interviews (KIIs) and Focus Group Discussions (FGDs), which aligns with broader findings on inequity in health access (WHO, 2019; Ichhpujani et al., 2022).
Additionally, high transportation costs and medical expenses, particularly for follow-up care and advanced treatments, emerged as critical financial barriers, consistent with the identification of underserved areas and qualitative accounts (Bascom and Christensen, 2017). On the opportunity side, collaboration with local transport providers and the introduction of mobile or community-based eye clinics could enhance accessibility in underserved zones an insight derived from both GIS spatial analyses and stakeholder recommendations. Conversely, persistent threats include the risk of further marginalizing vulnerable groups due to rising service costs and infrastructural deficiencies. The nearest neighbor analysis, which revealed a dispersed spatial pattern of facilities, reinforces the need for more equitable distribution to reduce access gaps (Kuran et al., 2020). By integrating SWOT findings with empirical data, this study highlights the need for holistic and inclusive planning to enhance Dhaka’s eye health system.
There is a notable lack of detailed information about the services offered, equipment used, and contact details, which hinders a full understanding of the available eye health services. Geographical considerations, such as the distance and location of health facilities, emerge as significant concerns, indicating a need for strategically placed health centers. Inclusivity for individuals with disabilities and financial barriers due to high medical costs are repeatedly highlighted as major impediments. The nearest neighbor analysis provides a deep understanding of the spatial relationships within the dataset. The significant difference between the observed and expected mean distances, along with a high nearest neighbor ratio and Z-score, indicates that the points in the dataset are more spread out than in a random distribution. This pattern is not coincidental but a notable deviation from randomness, as indicated by the negligible p-value. These findings collectively illustrate a significantly and meaningfully dispersed distribution of points across the space. The urban service coverage in Dhaka shows a clear and quantitative insight into the uneven distribution of services across the city. The data categorizes areas into ‘Overserved’, ‘Served’, and ‘Underserved’, revealing significant disparities in service coverage among different administrative areas. Despite these challenges, the study finds that gender equality in service provision is well maintained. The eye health sector in Dhaka features a mix of public and private service providers, suggesting a diverse landscape. The study underscores the need for improvements in specialized transportation, affordability, and information dissemination to enhance the accessibility and quality of eye health services in Dhaka.
6 . CONCLUSION
This study presents a comprehensive analysis of eye health service accessibility in Dhaka City Corporation, integrating Geographic Information Systems (GIS) and qualitative methods. The findings reveal a stark imbalance in service distribution: only 14% of the city is adequately served, 45% is overserved, and a striking 41 % is underserved. Such disproportionality indicates inefficient resource allocation, with many eye care facilities concentrated in limited areas while large segments of the population lack access to nearby services. The Average Nearest Neighbour (ANN) analysis reinforces this conclusion, showing a high nearest-neighbor ratio of 3.34 and a Z-score of 20.49, indicating a significantly dispersed pattern of facility locations. This suggests that residents in underserved areas face considerable travel burdens, undermining their ability to access timely and essential eye care services.
Qualitative insights from Key Informant Interviews (KIIs) and Focus Group Discussions (FGDs) add depth to the spatial data, highlighting persistent barriers such as high transportation and medical costs, limited infrastructure for people with disabilities, and insufficient information on available services. Residents of slum communities and individuals with disabilities, in particular, face compounded challenges due to poor transportation options and a lack of specialized accommodations at eye health centres. Moreover, the absence of clear and accessible information about the services offered, including equipment availability and contact details, contributes to confusion and unmet needs. Despite these challenges, the study finds that gender equality in eye care provision is largely maintained, suggesting that inclusive service delivery is achievable when equity is prioritized.
To address these issues, several targeted recommendations are proposed. First, the government and healthcare planners should prioritize the strategic redistribution of eye care services, utilizing GIS data to inform the establishment of new centres in underserved areas. Second, the deployment of mobile eye care units can bridge service gaps in slums and peripheral zones, offering basic consultations and referrals. Third, transportation support and infrastructure improvements, particularly for people with disabilities, are crucial to overcoming physical access barriers. Fourth, affordability must be addressed through subsidized services, community-based insurance schemes, or tiered payment models to ensure that low-income populations are not excluded from care. Finally, a centralized, publicly accessible database or digital platform should be developed to disseminate accurate and up-to-date information on eye health services, including service availability, locations, hours of operation, and contact details. By implementing these measures, Dhaka can move toward a more equitable, efficient, and inclusive eye health system that ensures no population group is left behind.
Tables
Figures
Conflict of Interest
The authors confirm no conflict of interest.
Acknowledgements
The authors sincerely thank all Key Informants and FGD participants for their valuable insights, and the field team for their dedicated support. We also appreciate the guidance and encouragement provided by colleagues and mentors throughout the study.
Abbreviations
ANN: Average Nearest Neighbor; BBS: Bangladesh Bureau of Statistics; BDT: Bangladeshi Taka (currency); CSO: Civil Society Organization; CSR: Complete Spatial Randomness; DCC: Dhaka City Corporation; DGHS: Directorate General of Health Services; DNCC: Dhaka North City Corporation; DSCC: Dhaka South City Corporation; FGD: Focus Group Discussion; GIS: Geographic Information Systems; KII: Key Informant Interview; LGED: Local Government Engineering Department; NGO: Non-Governmental Organization; UHFPO: Upazila Health and Family Planning Officer.
References
1.
Anderson, A. and Smith, T., 2020. Geospatial mapping of eye health facilities and service coverage in a targeted region of Bangladesh. Journal of Health and Medical Geography, 12(1), 56-68.
Brown, P. and Lee, S., 2022. Using geographic information systems (GIS) in healthcare facility mapping: A Review of Methodologies and Applications. Health Services Research Journal, 28(4), 311-330.
6.
Davis, R. L. and Martinez, P. C., 2019. Spatial analysis of eye care services in urban and rural areas: Implications for policy and planning in Bangladesh. Health Policy and Planning, 34(5), 321-335.
Garcia, M. S. and Jackson, R. L., 2020. Analyzing healthcare accessibility in rural areas: A GIS-based approach. International Journal of Health Geographics, 19(1), 45.
Johnson, E. R. and Anderson, B. W., 2017. Assessing the spatial distribution of eye health facilities in Bangladesh: A GIS-Based Study. International Journal of Health Planning and Management, 32(4), 450-468.
17.
Kim, S. H. and Gupta, N., 2018. Evaluating accessibility and equity in eye care services: A GIS-based assessment in Dhaka City. Health and Place, 24, 160-167.
Liu, X. and Wang, Y., 2018. Mapping healthcare facilities using GIS for improved access to eye care services: Lessons from Bangladesh. Geospatial Health, 13(2), 235-247.
Patel, A. B. and Jones, C. D., 2019. Geospatial analysis of healthcare disparities: A case study of eye care services in Bangladesh. Journal of Global Health, 7(2), 85-96.
22.
Rodriguez, M. and Williams, K., 2021. Assessing geographic disparities in eye health services: A case study of Moulvibazar and Mymensingh Sadar. Geospatial Health Research, 9(3), 198-213.
Smith, J. A. and Johnson, L. M., 2021. Geospatial mapping and accessibility analysis of health facilities in a Targeted region: A Comprehensive Study. Journal of Healthcare Geography, 15(3), 225-243.


 ,
A H Md Mahabub Nawaz 2
,
A H Md Mahabub Nawaz 2