Among the CDBs, Koch Bihar-II (96.30%) and Dinhata-II (96.36%) recorded the highest proportion of TT injection reception, indicating robust healthcare outreach and effective delivery of immunization services. Dinhata-I (94.55%) and Mathabhanga-II (93.88%) also exhibited high levels of TT coverage, underscoring the relative success of maternal health interventions in these areas. Moderately high TT coverage was observed in Tufanganj-I (89.74%), Sitalkuchi (89.29%), and Mathabhanga-I (89.36%), which, although below the overall average, still reflect a favorable situation. However, Sitai (80.00%) emerged as the most underperforming block, with 6 out of 30 women (20.00%) not having received the TT injection during pregnancy. This is followed by Haldibari (84.62%), which also warrants attention due to its relatively lower coverage. The disparities among different blocks suggest that while immunization programs are largely effective, localized challenges persist. These may be attributable to factors such as logistical constraints, lack of awareness, socio-cultural barriers or gaps in health infrastructure.
7.6 Types of family planning methods
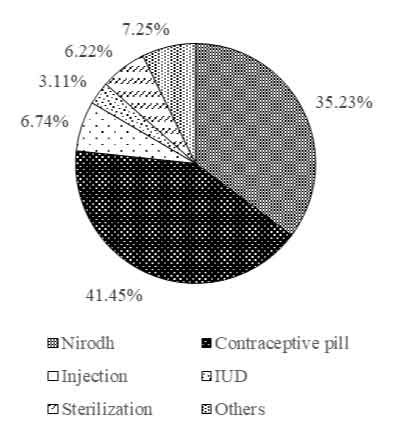
Table 9 presents the percentage distribution of married respondents across various CDBs who reported using different types of family planning methods. Based on data collected during a 2024 field survey, the table reflects the contraceptive preferences of 193 individuals and provides valuable insight into the family planning practices prevalent in the region. The data shows a clear dominance of temporary methods, particularly contraceptive pills and Nirodh (condoms), over permanent and clinical methods such as sterilization and intrauterine devices (IUDs). Among all the methods recorded, contraceptive pills emerge as the most commonly used, with 41.45% of the respondents reporting their use (Figure 6). This is closely followed by Nirodh, which accounts for 35.23% of users. The preference for these methods highlights a strong tendency toward temporary, reversible contraceptive options. These methods are widely accessible, do not require clinical procedures, and are generally perceived as safe and convenient by users. In contrast, only 6.74% of the respondents reported using injectable contraceptives and an even smaller proportion, 3.11%, opted for IUDs. The use of sterilization, a permanent method, was reported by 6.22% of the respondents, while 7.25% used other unspecified methods, possibly including traditional or indigenous practices. A closer examination of the data reveals significant variations across different blocks. In blocks such as Sitalkuchi, Mathabhanga-I, and Sitai, the use of contraceptive pills is notably high, indicating effective dissemination of oral contraceptives, possibly supported by government or health worker distribution. Similarly, Nirodh usage is relatively high in blocks like Koch Bihar-I and Dinhata-II, suggesting a fair degree of male participation in family planning in these areas. On the other hand, the adoption of more clinical or long-term methods remains limited. The low figures for IUD and injectable use point to potential barriers such as lack of awareness, limited access to trained medical personnel or cultural hesitation towards invasive procedures. Sterilization, although limited in most blocks, appears to be more accepted in specific areas such as Tufanganj-II, where 28.57% of respondents reported undergoing the procedure. This suggests a more favorable attitude toward permanent methods in certain local contexts. It may also reflect higher levels of health literacy or greater trust in the public health system. Conversely, in blocks like Sitai and Haldibari, the presence of a significant proportion of respondents using “other” methods may point toward reliance on informal practices or a lack of clarity in understanding standard contraceptive categories. The overall pattern that emerges from the data illustrates a predominantly female-centered approach to family planning, with the burden of contraceptive responsibility falling largely on women. This may be indicative of broader gender dynamics in reproductive health decision-making, where male involvement remains limited to condom use and is otherwise minimal. The low uptake of long-term and permanent contraceptive options across the majority of blocks underscores the need for improved health education, enhanced counseling services and expanded access to a wider range of family planning methods.
Table 8. Percentage distribution of the respondents based on the reception of Tetanus Toxoid (TT) during pregnancy
|
CDBs
|
Women having children
|
Reception of Tetanus Toxoid (TT) injection during pregnancy:
|
|
Yes
|
No
|
|
Nos.
|
%
|
Nos.
|
%
|
|
Haldibari
|
26
|
22
|
84.62
|
4
|
15.38
|
|
Mekhliganj
|
58
|
53
|
91.38
|
5
|
8.62
|
|
Mathabhanga-I
|
47
|
42
|
89.36
|
5
|
10.64
|
|
Mathabhanga-II
|
49
|
46
|
93.88
|
3
|
6.12
|
|
Koch Bihar-I
|
64
|
61
|
95.31
|
3
|
4.69
|
|
Koch Bihar-II
|
54
|
52
|
96.30
|
2
|
3.70
|
|
Tufanganj-I
|
39
|
35
|
89.74
|
4
|
10.26
|
|
Tufanganj-II
|
23
|
21
|
91.30
|
2
|
8.70
|
|
Dinhata-I
|
55
|
52
|
94.55
|
3
|
5.45
|
|
Dinhata-II
|
55
|
53
|
96.36
|
2
|
3.64
|
|
Sitai
|
30
|
24
|
80.00
|
6
|
20.00
|
|
Sitalkuchi
|
28
|
25
|
89.29
|
3
|
10.71
|
|
Total
|
528
|
486
|
92.05
|
42
|
7.95
|
Source: Field survey, 2024
7.7 Child birth interval
Table 10 presents the distribution of respondents based on the spacing between childbirths, categorized into intervals of less than 1 year, 1-2 years, 2-3 years, 3-4 years, and more than 4 years. The results indicate a significant skew toward longer birth intervals, particularly in the 3-4 year and more than 4-year categories. Specifically, 32.95% of the respondents reported a birth interval of 3-4 years, while 21.02% reported spacing of more than 4 years between children. These figures reflect a gradual shift toward healthier spacing practices, which are positively associated with improved maternal and child health outcomes. A further 32.20% of women reported a 2-3 year interval, which also falls within the recommended birth spacing suggested by public health agencies such as the WHO.
Table 9. Percentage distribution of the respondents based on types of family planning methods adoption
|
CDBs
|
No. of married respondents using family planning methods
|
Types of family planning methods
|
|
Nirodh
|
Contraceptive pill
|
Injection
|
IUD
|
Sterilization
|
Others
|
|
Nos.
|
%
|
Nos.
|
%
|
Nos.
|
%
|
Nos.
|
%
|
Nos.
|
%
|
Nos.
|
%
|
|
Haldibari
|
12
|
4
|
33.33
|
5
|
41.67
|
0
|
0.00
|
0
|
0.00
|
1
|
8.33
|
2
|
16.67
|
|
Mekhliganj
|
18
|
7
|
38.89
|
8
|
44.44
|
1
|
5.56
|
1
|
5.56
|
|
0.00
|
1
|
5.56
|
|
Mathabhanga-I
|
20
|
6
|
30.00
|
9
|
45.00
|
2
|
10.00
|
0
|
0.00
|
2
|
10.00
|
1
|
5.00
|
|
Mathabhanga-II
|
17
|
5
|
29.41
|
7
|
41.18
|
1
|
5.88
|
1
|
5.88
|
1
|
5.88
|
2
|
11.76
|
|
Koch Bihar-I
|
20
|
9
|
45.00
|
7
|
35.00
|
2
|
10.00
|
0
|
0.00
|
2
|
10.00
|
0
|
0.00
|
|
Koch Bihar-II
|
25
|
8
|
32.00
|
10
|
40.00
|
3
|
12.00
|
2
|
8.00
|
1
|
4.00
|
1
|
4.00
|
|
Tufanganj-I
|
11
|
4
|
36.36
|
5
|
45.45
|
0
|
0.00
|
0
|
0.00
|
1
|
9.09
|
1
|
9.09
|
|
Tufanganj-II
|
7
|
2
|
28.57
|
3
|
42.86
|
0
|
0.00
|
0
|
0.00
|
2
|
28.57
|
0
|
0.00
|
|
Dinhata-I
|
22
|
7
|
31.82
|
10
|
45.45
|
2
|
9.09
|
0
|
0.00
|
0
|
0.00
|
3
|
13.64
|
|
Dinhata-II
|
23
|
11
|
47.83
|
7
|
30.43
|
1
|
4.35
|
2
|
8.70
|
2
|
8.70
|
0
|
0.00
|
|
Sitai
|
10
|
3
|
30.00
|
5
|
50.00
|
0
|
0.00
|
0
|
0.00
|
0
|
0.00
|
2
|
20.00
|
|
Sitalkuchi
|
8
|
2
|
25.00
|
4
|
50.00
|
1
|
12.50
|
0
|
0.00
|
0
|
0.00
|
1
|
12.50
|
|
Total
|
193
|
68
|
35.23
|
80
|
41.45
|
13
|
6.74
|
6
|
3.11
|
12
|
6.22
|
14
|
7.25
|
Shorter birth intervals-those less than 2 years-were far less common. Only 0.57% of women reported a spacing of less than one year, while 13.26% indicated a birth interval of 1-2 years. These figures are encouraging, as short intervals between pregnancies are often associated with higher risks of adverse outcomes, including low birth weight, premature births and maternal depletion. The relatively low prevalence of short intervals may indicate an increasing awareness of the health implications of closely spaced pregnancies, as well as the impact of family planning interventions and maternal counseling services. However, there are significant variations across CDBs. For instance, Mathabhanga-I and Koch Bihar-I reported notably high percentages of respondents with birth intervals exceeding four years (40.43% and 37.50% respectively), while Tufanganj-II and Dinhata-II recorded high proportions in the 3-4 year category (43.48% and 41.82%). These findings may point to better access to and utilization of family planning services in these areas, or to specific cultural or economic factors that influence reproductive decision-making. Conversely, blocks such as Koch Bihar-I and Koch Bihar-II also exhibit considerable representation in the 3-4 year interval group (32.81% and 27.78% respectively), but they also have sizable proportions of women spacing births over four years (37.50% and 22.22%). These results suggest a balanced distribution between moderately and widely spaced births, possibly indicating diverse patterns of fertility control. Interestingly, some blocks such as Dinhata-I and Dinhata-II report a relatively even distribution across multiple spacing categories, suggesting heterogeneity in reproductive behaviors within these populations. On the other hand, blocks like Sitai show a clustering in the 2-3 year (46.67%) and 3-4 year (20.00%) categories, potentially reflecting a prevailing community norm regarding birth intervals. The minimal number of respondents reporting childbirth intervals shorter than one year; restricted to a handful of blocks such as Koch Bihar-I (1.56%) and Dinhata-I (3.64%); is a positive public health indicator. It suggests that the region has largely moved away from extremely short birth intervals, which historically posed significant health risks. Nonetheless, the presence of any such cases warrants continued monitoring and targeted counseling, especially in rural or underserved areas where awareness and access might still be limited.
7.8 Married life satisfaction
Table 11 presents the distribution of married life satisfaction among respondents across different CDBs of Koch Bihar district. Overall, the findings indicate a predominantly positive perception of married life among the respondents. More than half of the respondents (50.44%) reported being satisfied with their married life, while nearly one-fourth (23.20%) stated that they were very satisfied. Together, these categories account for over 73% of the total respondents, reflecting a generally favourable marital experience in the study area. However, a notable proportion of respondents (20.21%) reported being neither satisfied nor dissatisfied, suggesting the presence of marital ambivalence, possibly influenced by socio-economic pressures, health conditions or household responsibilities. A relatively smaller share of respondents (6.15%) expressed dissatisfaction with their married life, though variations are evident across CDBs. Higher levels of dissatisfaction were observed in blocks such as Sitalkuchi and Dinhata-I, whereas blocks like Haldibari and Tufanganj-II recorded comparatively lower dissatisfaction levels. Inter-block variation in satisfaction levels highlights the influence of local socio-economic, cultural and health-related factors on marital well-being. Overall, the table underscores that while marital satisfaction is generally high, a significant minority experiences neutrality or dissatisfaction, warranting focused policy and intervention measures to improve family well-being and quality of life.
Table 10. Spacing of child births of the respondents
|
CDBs
|
Women having children
|
Birth Interval
|
|
1 year
|
1-2 years
|
2-3 years
|
3-4 years
|
˃4 years
|
|
Nos.
|
%
|
Nos.
|
%
|
Nos.
|
%
|
Nos.
|
%
|
Nos.
|
%
|
|
Haldibari
|
26
|
0
|
0.00
|
7
|
26.92
|
10
|
38.46
|
7
|
26.92
|
2
|
7.69
|
|
Mekhliganj
|
58
|
0
|
0.00
|
10
|
17.24
|
20
|
34.48
|
22
|
37.93
|
6
|
10.34
|
|
Mathabhanga-I
|
47
|
0
|
0.00
|
0
|
0.00
|
10
|
21.28
|
18
|
38.30
|
19
|
40.43
|
|
Mathabhanga-II
|
49
|
0
|
0.00
|
16
|
32.65
|
13
|
26.53
|
11
|
22.45
|
9
|
18.37
|
|
Koch Bihar-I
|
64
|
1
|
1.56
|
2
|
3.13
|
16
|
25.00
|
21
|
32.81
|
24
|
37.50
|
|
Koch Bihar-II
|
54
|
0
|
0.00
|
7
|
12.96
|
20
|
37.04
|
15
|
27.78
|
12
|
22.22
|
|
Tufanganj-I
|
39
|
0
|
0.00
|
3
|
7.69
|
16
|
41.03
|
16
|
41.03
|
4
|
10.26
|
|
Tufanganj-II
|
23
|
0
|
0.00
|
3
|
13.04
|
5
|
21.74
|
10
|
43.48
|
5
|
21.74
|
|
Dinhata-I
|
55
|
2
|
3.64
|
10
|
18.18
|
19
|
34.55
|
15
|
27.27
|
9
|
16.36
|
|
Dinhata-II
|
55
|
0
|
0.00
|
4
|
7.27
|
17
|
30.91
|
23
|
41.82
|
11
|
20.00
|
|
Sitai
|
30
|
0
|
0.00
|
2
|
6.67
|
14
|
46.67
|
6
|
20.00
|
8
|
26.67
|
|
Sitalkuchi
|
28
|
0
|
0.00
|
6
|
21.43
|
10
|
35.71
|
10
|
35.71
|
2
|
7.14
|
|
Total
|
528
|
3
|
0.57
|
70
|
13.26
|
170
|
32.20
|
174
|
32.95
|
111
|
21.02
|
Table 11. Level of married life satisfaction of the respondents
|
CDBs
|
Total Respondents
|
Married Life Satisfaction Level
|
|
Very Satisfied
|
Satisfied
|
Neither Satisfied nor Dissatisfied
|
Dissatisfied
|
|
Nos.
|
%
|
Nos.
|
%
|
Nos.
|
%
|
Nos.
|
%
|
|
Haldibari
|
30
|
8
|
26.67
|
16
|
53.33
|
5
|
16.67
|
1
|
3.33
|
|
Mekhliganj
|
65
|
15
|
23.08
|
36
|
55.38
|
11
|
16.92
|
3
|
4.62
|
|
Mathabhanga-I
|
50
|
12
|
24.00
|
27
|
54.00
|
9
|
18.00
|
2
|
4.00
|
|
Mathabhanga-II
|
52
|
16
|
30.77
|
25
|
48.08
|
8
|
15.38
|
3
|
5.77
|
|
Koch Bihar-I
|
69
|
15
|
21.74
|
31
|
44.93
|
18
|
26.09
|
5
|
7.25
|
|
Koch Bihar-II
|
60
|
14
|
23.33
|
29
|
48.33
|
13
|
21.67
|
4
|
6.67
|
|
Tufanganj-I
|
40
|
10
|
25.00
|
20
|
50.00
|
8
|
20.00
|
2
|
5.00
|
|
Tufanganj-II
|
26
|
7
|
26.92
|
13
|
50.00
|
5
|
19.23
|
1
|
3.85
|
|
Dinhata-I
|
58
|
12
|
20.69
|
26
|
44.83
|
15
|
25.86
|
5
|
8.62
|
|
Dinhata-II
|
59
|
13
|
22.03
|
30
|
50.85
|
12
|
20.34
|
4
|
6.78
|
|
Sitai
|
31
|
6
|
19.35
|
18
|
58.06
|
5
|
16.13
|
2
|
6.45
|
|
Sitalkuchi
|
29
|
4
|
13.79
|
16
|
55.17
|
6
|
20.69
|
3
|
10.34
|
|
Koch Bihar
|
569
|
132
|
23.20
|
287
|
50.44
|
115
|
20.21
|
35
|
6.15
|
7.9 Psychological health conditions
Table 12 provides a comprehensive overview of respondents’ perceptions regarding mental health conditions across various CDBs within the study area. Based on data derived from a field survey conducted in 2024, the table categorizes perceptions into four evaluative dimensions: very good, good, poor and very poor. A majority of respondents displayed a favorable disposition toward mental health conditions, with 59.40% rating their perception as “good” and 30.05% as “very good”.
These positive assessments indicate an encouraging trend of mental health awareness and potentially greater acceptance or destigmatization in the general population. The predominance of favorable perceptions was particularly evident in blocks such as Mathabhanga-I (42.00% very good and 46.00% good), Dinhata-II (25.42% very good and 66.10% good), and Sitalkuchi (31.03% very good and 58.62% good), suggesting these areas may have benefited from greater outreach or exposure to mental health information. Notably, the block of Koch Bihar-II exhibited the highest percentage of respondents who rated mental health conditions as “poor” (15.00%), although it also had a majority rating of “good” (55.00%). Similarly, Dinhata-I recorded the highest proportion of respondents (20.69%) who assessed mental health conditions negatively as “poor,” reflecting a possible persistence of misconceptions, stigma, or inadequate access to mental health resources in that area. Moreover, Tufanganj-II, though smaller in size, had the highest share of respondents perceiving mental health conditions as “very poor” (7.69%), suggesting the presence of significant gaps in understanding and awareness. Across all blocks, the cumulative percentage of “poor” and “very poor” perceptions remained relatively low, at 8.96% and 1.58%, respectively. However, the presence of any negative perception, even in smaller proportions, is indicative of lingering stigma and a critical need for targeted mental health education and outreach programs. Blocks like Mathabhanga-II (5.77% poor and 1.92% very poor), Koch Bihar-I (4.35% poor), and Dinhata-II (8.47% poor) represent areas that may benefit from intensified sensitization campaigns. The perceptual landscape across the blocks reflects a complex interplay of socio-cultural, educational and possibly infrastructural factors influencing community attitudes. The dominance of “good” and “very good” ratings is promising and reflects a growing recognition of the importance of mental health in rural and semi-urban settings. However, the persistence of some negative evaluations underscores the need for a sustained, multifaceted approach to mental health literacy, which combines public education, integration of mental health services into primary care and the reduction of associated stigma through community engagement.
Table 13 presents the percentage distribution of respondents’ perceptions regarding thinking about life across different CDBs of Koch Bihar district. Overall, the findings reveal a predominantly positive outlook among the respondents. At the district level, more than half of the respondents (52.37%) reported a positive perception, followed by 20.39% who expressed a very positive perception. Together, nearly three-fourths of the respondents demonstrate a favourable orientation towards life, indicating comparatively better psychological well-being. About 22.14% of respondents were somewhat positive, while only a small proportion (5.10%) reported a negative perception. Block-wise variations are evident. Blocks such as Tufanganj-II and Mathabhanga-II recorded relatively higher proportions of very positive responses, whereas Sitalkuchi showed a stronger concentration in the positive category. In contrast, Koch Bihar-I and Dinhata-I exhibited comparatively higher shares of somewhat positive perceptions, suggesting moderate levels of life satisfaction. Across all blocks, the proportion of negative perceptions remains consistently low, rarely exceeding 7-8 percent.
Table 12. Perceptions of the respondents on mental health conditions
|
CDBs
|
Total respondents
|
Perceptions on mental health conditions
|
|
Very good
|
Good
|
Poor
|
Very poor
|
|
Nos.
|
%
|
Nos.
|
%
|
Nos.
|
%
|
Nos.
|
%
|
|
Haldibari
|
30
|
11
|
36.67
|
18
|
60.00
|
1
|
3.33
|
0
|
0.00
|
|
Mekhliganj
|
65
|
22
|
33.85
|
40
|
61.54
|
3
|
4.62
|
0
|
0.00
|
|
Mathabhanga-I
|
50
|
21
|
42.00
|
23
|
46.00
|
4
|
8.00
|
2
|
4.00
|
|
Mathabhanga-II
|
52
|
14
|
26.92
|
34
|
65.38
|
3
|
5.77
|
1
|
1.92
|
|
Koch Bihar-I
|
69
|
24
|
34.78
|
42
|
60.87
|
3
|
4.35
|
0
|
0.00
|
|
Koch Bihar-II
|
60
|
15
|
25.00
|
33
|
55.00
|
9
|
15.00
|
3
|
5.00
|
|
Tufanganj-I
|
40
|
12
|
30.00
|
25
|
62.50
|
2
|
5.00
|
1
|
2.50
|
|
Tufanganj-II
|
26
|
7
|
26.92
|
14
|
53.85
|
3
|
11.54
|
2
|
7.69
|
|
Dinhata-I
|
58
|
13
|
22.41
|
33
|
56.90
|
12
|
20.69
|
0
|
0.00
|
|
Dinhata-II
|
59
|
15
|
25.42
|
39
|
66.10
|
5
|
8.47
|
0
|
0.00
|
|
Sitai
|
31
|
8
|
25.81
|
20
|
64.52
|
3
|
9.68
|
0
|
0.00
|
|
Sitalkuchi
|
29
|
9
|
31.03
|
17
|
58.62
|
3
|
10.34
|
0
|
0.00
|
|
Koch Bihar
|
569
|
171
|
30.05
|
338
|
59.40
|
51
|
8.96
|
9
|
1.58
|
Table 13. Percentage distributions of the respondents based on perceptions on thinking about life
|
CDBs
|
Total Respondents
|
Perceptions on Thinking about Life
|
|
Very Positive
|
Positive
|
Somewhat Positive
|
Negative
|
|
Nos.
|
%
|
Nos.
|
%
|
Nos.
|
%
|
Nos.
|
%
|
|
Haldibari
|
30
|
7
|
23.33
|
18
|
60.00
|
4
|
13.33
|
1
|
3.33
|
|
Mekhliganj
|
65
|
12
|
18.46
|
40
|
61.54
|
11
|
16.92
|
2
|
3.08
|
|
Mathabhanga-I
|
50
|
10
|
20.00
|
29
|
58.00
|
8
|
16.00
|
3
|
6.00
|
|
Mathabhanga-II
|
52
|
13
|
25.00
|
24
|
46.15
|
11
|
21.15
|
4
|
7.69
|
|
Koch Bihar-I
|
69
|
11
|
15.94
|
33
|
47.83
|
21
|
30.43
|
4
|
5.80
|
|
Koch Bihar-II
|
60
|
12
|
20.00
|
31
|
51.67
|
14
|
23.33
|
3
|
5.00
|
|
Tufanganj-I
|
40
|
9
|
22.50
|
22
|
55.00
|
7
|
17.50
|
2
|
5.00
|
|
Tufanganj-II
|
26
|
8
|
30.77
|
12
|
46.15
|
4
|
15.38
|
2
|
7.69
|
|
Dinhata-I
|
58
|
10
|
17.24
|
28
|
48.28
|
17
|
29.31
|
3
|
5.17
|
|
Dinhata-II
|
59
|
14
|
23.73
|
26
|
44.07
|
17
|
28.81
|
2
|
3.39
|
|
Sitai
|
31
|
7
|
22.58
|
16
|
51.61
|
7
|
22.58
|
1
|
3.23
|
|
Sitalkuchi
|
29
|
3
|
10.34
|
19
|
65.52
|
5
|
17.24
|
2
|
6.90
|
|
Koch Bihar
|
569
|
116
|
20.39
|
298
|
52.37
|
126
|
22.14
|
29
|
5.10
|
7.10 Health Index (HI)
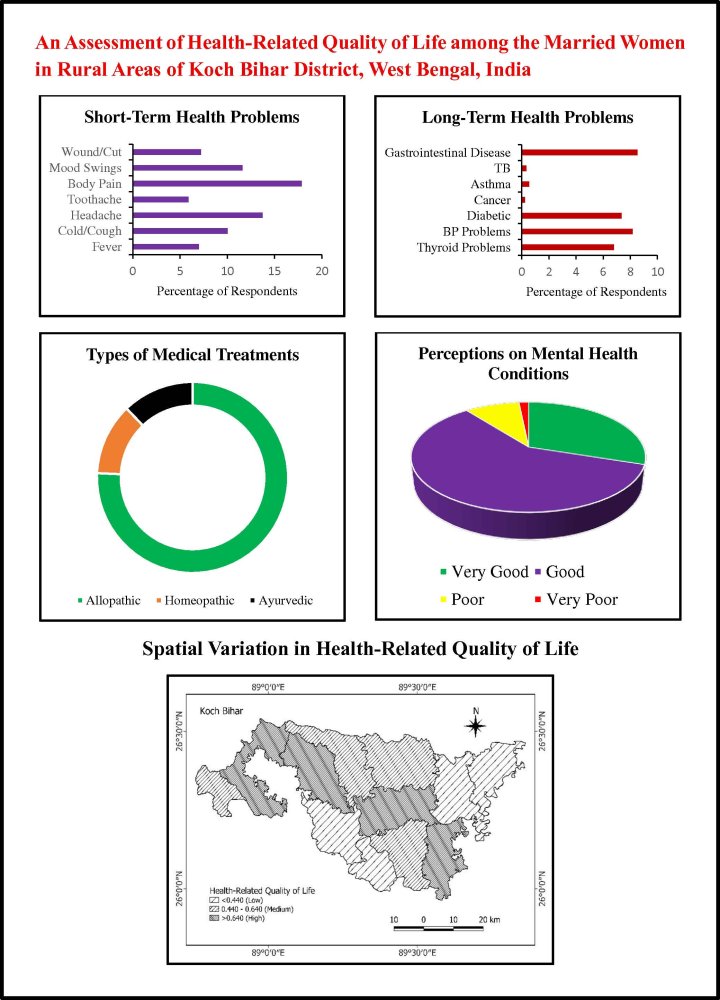
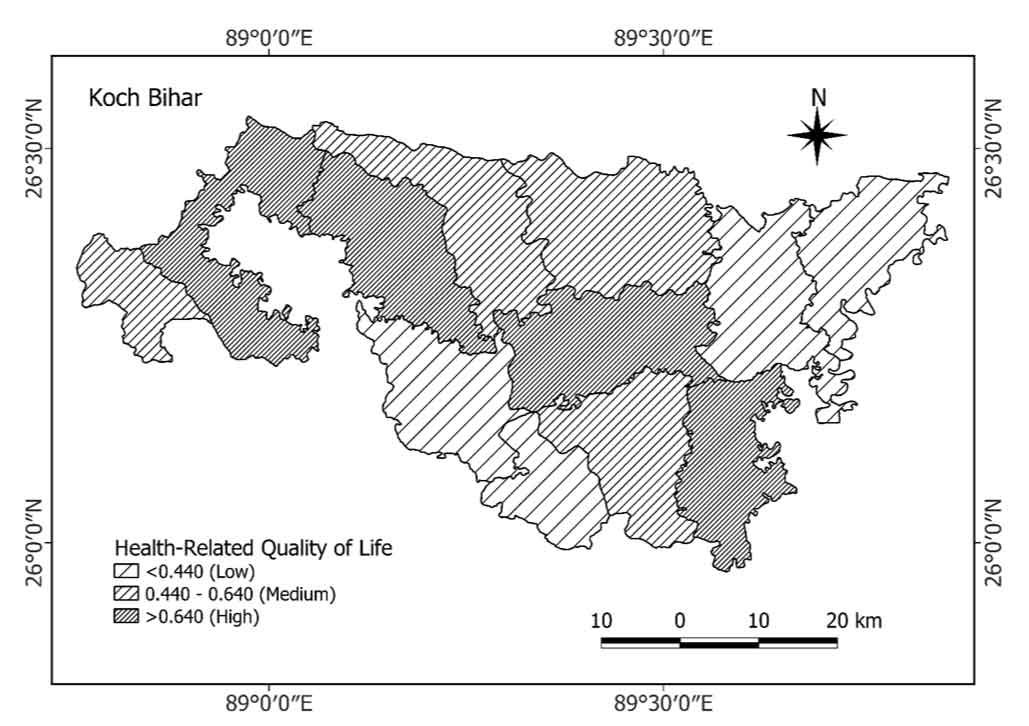
To show the spatial variation in HRQoL of the rural women, a composite health index has been constructed. The value of the index ranges 0-1, value nearing 1 indicates better health related quality of life. The Health Index (HI) scores across the twelve CDBs of Koch Bihar district present a revealing snapshot of the spatial distribution of health system performance in this part of northern West Bengal (Figure 7). The values range from a low of 0.310 in Sitai to a high of 0.724 in Koch Bihar-I, with an overall district average of 0.535 (Table 14). This spread highlights considerable intra-district disparities in healthcare delivery, accessibility, and utilization. Such variation is indicative of broader structural and systemic inequalities that persist across the rural-urban continuum and among differing socio-economic profiles within the district. The relatively high scores observed in blocks such as Koch Bihar-I (0.724), Dinhata-II (0.715), and Mathabhanga-I (0.652) suggest the presence of more established health infrastructure, better human resource deployment and more efficient administrative mechanisms governing public health delivery. These areas may benefit from a combination of favorable geographic accessibility, higher literacy and awareness levels, and better institutional capacity to implement national and state-level health programs effectively. Furthermore, these blocks may be better integrated into district and sub-district level referral systems, thus enhancing access to secondary and tertiary care facilities when required. In contrast, the lower scores recorded in blocks such as Sitai (0.310), Tufanganj-II (0.361), and Sitalkuchi (0.434) reflect persistent challenges that continue to impede healthcare progress in the more remote and underserved regions of the district. These challenges may include a lack of adequate health infrastructure, high vacancy rates of skilled health personnel, poor transportation and connectivity, and socio-cultural barriers to health-seeking behavior. The low index values in these areas could also be symptomatic of broader socio-economic deprivation, which influences not only access to healthcare but also outcomes such as maternal and child health, nutritional status, and prevalence of communicable and non-communicable diseases. The intermediate scores observed in some blocks, notably Mathabhanga-II (0.534), Dinhata-I (0.554), and Koch Bihar-II (0.610), further reflect the heterogeneity in health service delivery within the district. These variations may be the result of uneven implementation of health schemes, differential prioritization by local administrative bodies or disparities in community engagement and awareness. Overall, the data underscores the fragmented nature of health development within the district and calls attention to the need for spatially nuanced and evidence-based planning approaches. Rather than a one-size-fits-all model, there is a pressing need for targeted health interventions that are sensitive to the local context, particularly in low-performing blocks. This includes scaling up investments in primary healthcare infrastructure, addressing human resource shortages, strengthening community-based health outreach, and improving transport and communication networks to connect remote populations with essential services.
Table 14. Spatial variation in HRQoL
|
CDBs
|
Health Index (HI)
|
|
Haldibari
|
0.441
|
|
Mekhliganj
|
0.645
|
|
Mathabhanga-I
|
0.652
|
|
Mathabhanga-II
|
0.534
|
|
Koch Bihar-I
|
0.724
|
|
Koch Bihar-II
|
0.610
|
|
Tufanganj-I
|
0.437
|
|
Tufanganj-II
|
0.361
|
|
Dinhata-I
|
0.554
|
|
Dinhata-II
|
0.715
|
|
Sitai
|
0.310
|
|
Sitalkuchi
|
0.434
|
|
Average
|
0.535
|



 ,
Tarun Das 2
,
Tarun Das 2