4 . METHODOLOGY
4.1 Data and Software
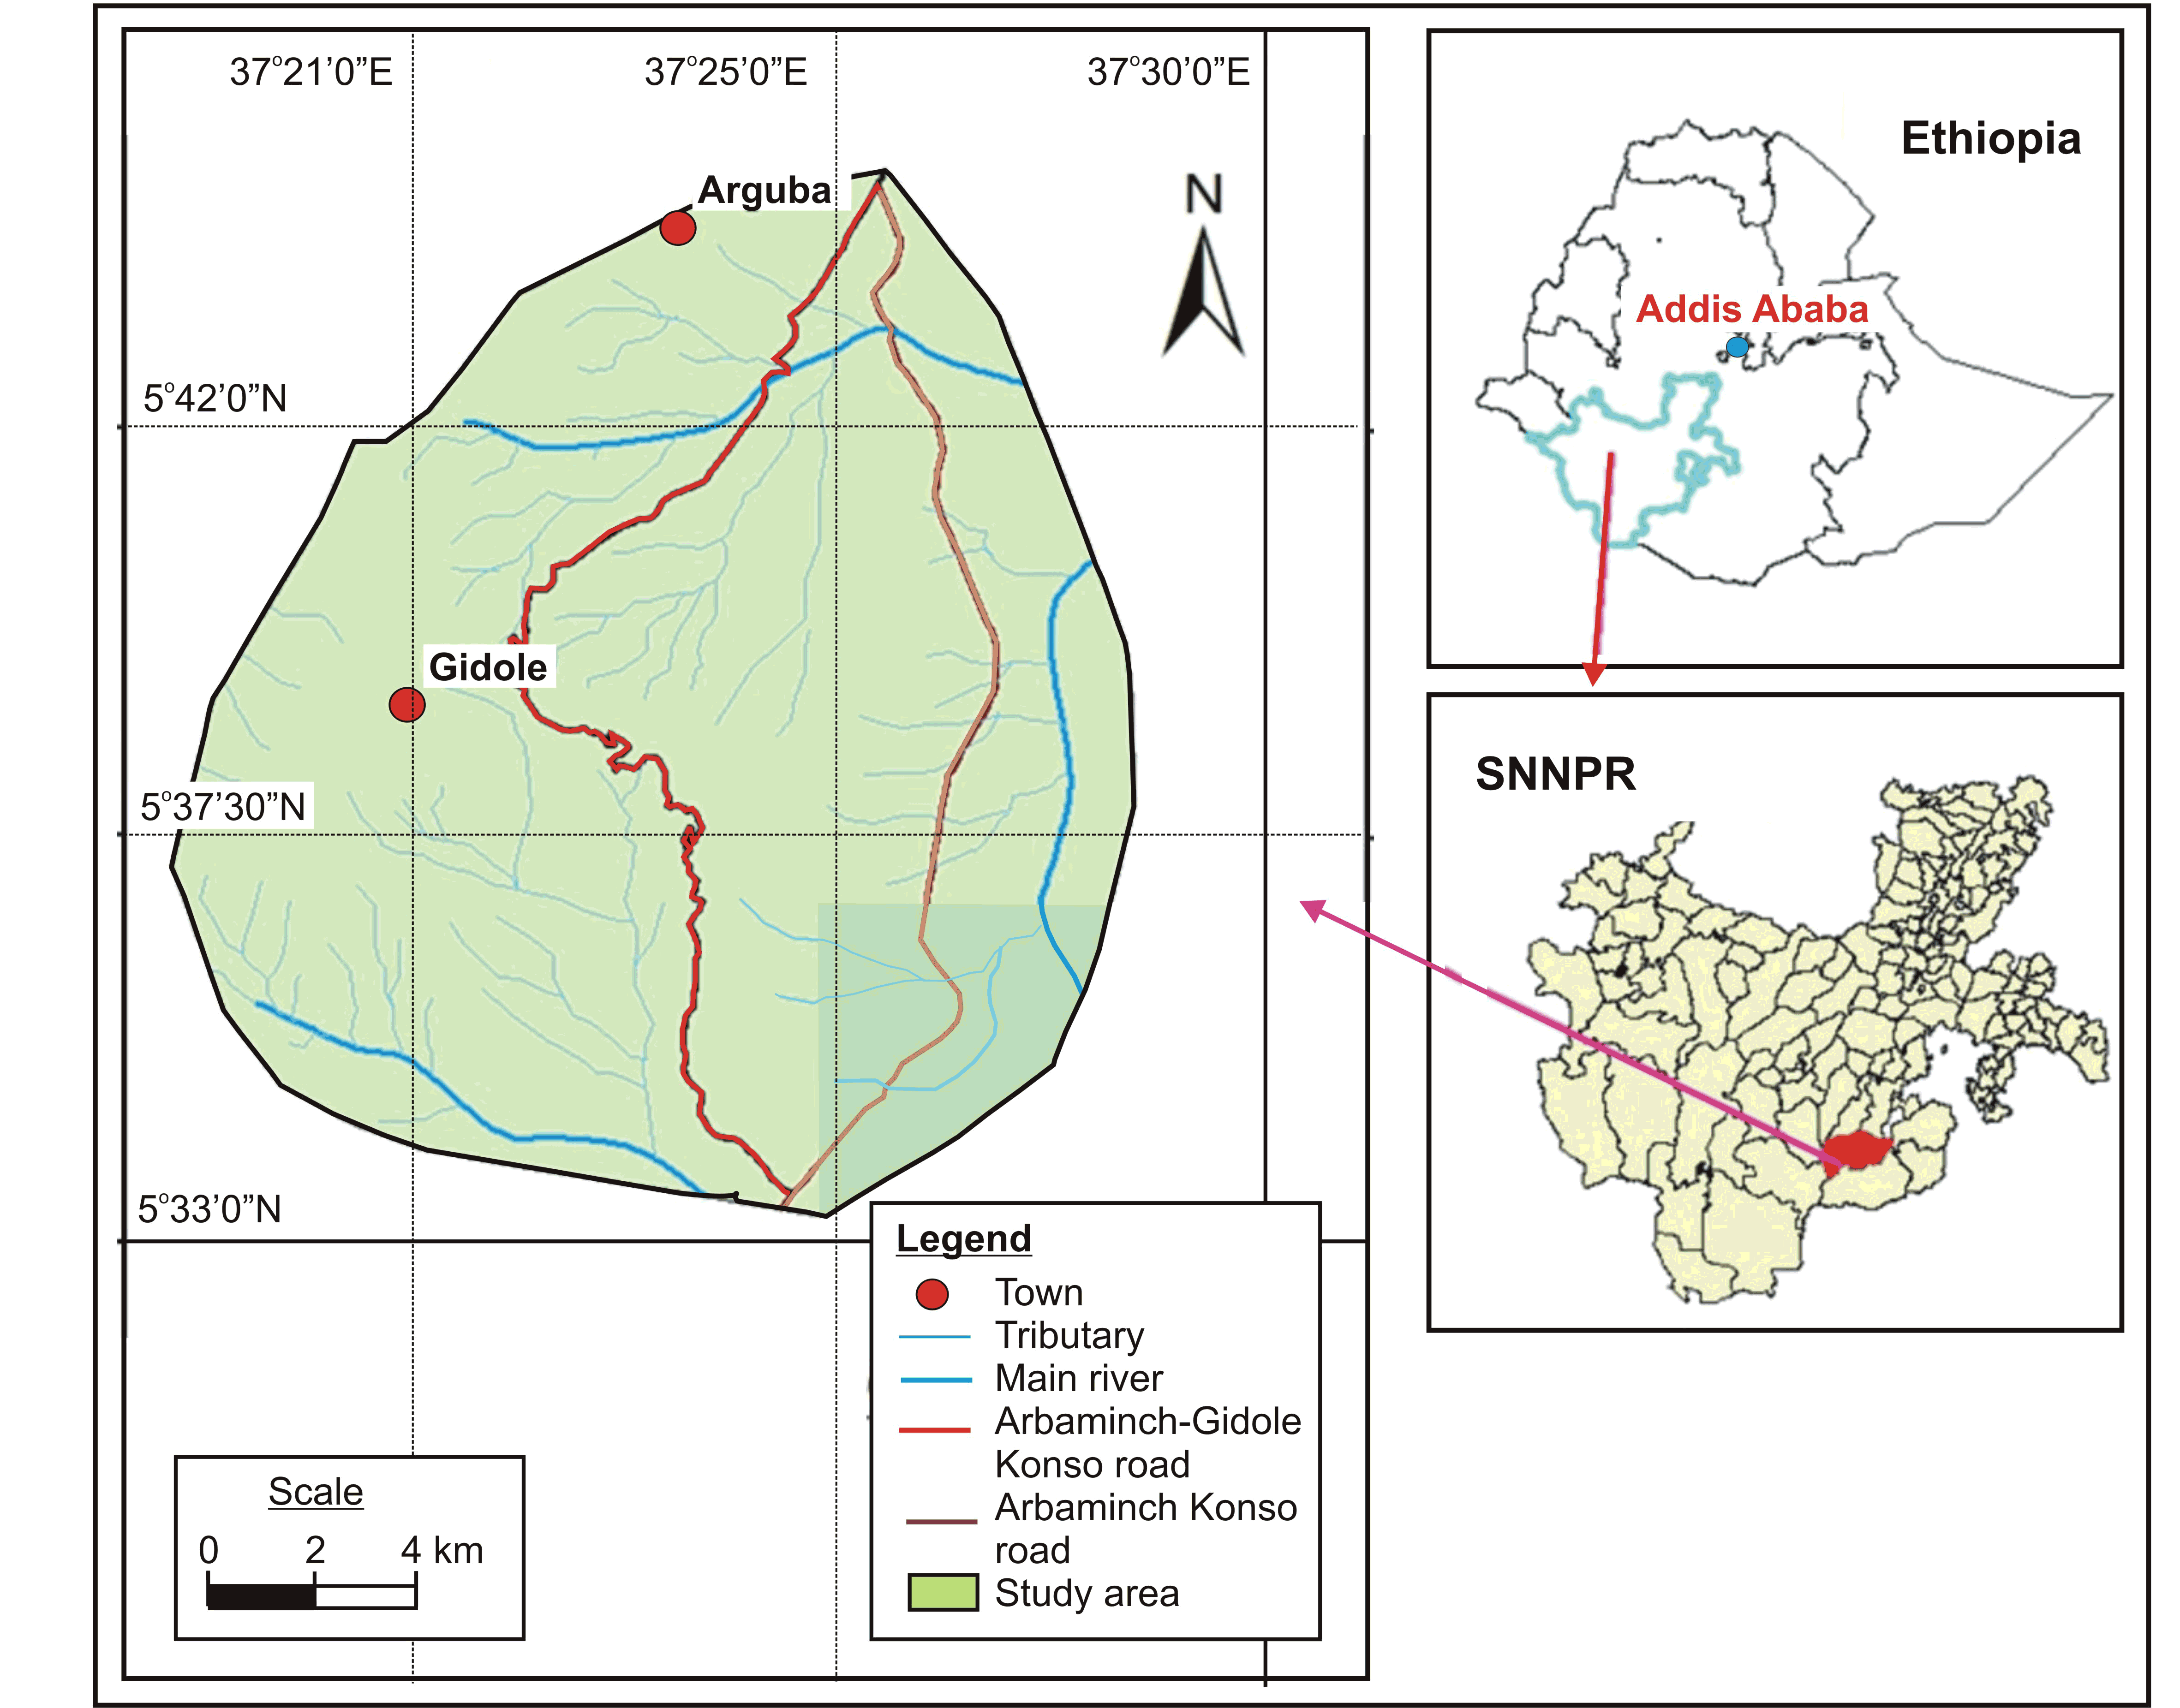
The data used for the landslide hazard zonation (LHZ) and slope instability assessment in the present study includes; a time series satellite data inputs such as Landsat 8, OLI 2017 imagery, acquired from the US Geological Survey National Centre For Earth Resources and the Sentinel 1A (2014-2018) images, acquired from European Space Agency (ESA). Besides, SRTM (30×30m resolution) and Topographic map (1:50,000) were also used to extract Digital Elevation Model (DEM) that facilitated derivation of slope, aspect and Elevation of the study area. Further, in order to validate the observations derived from the remotely sensed data, ground truth points were established at random locations. All the input datasets were geo-referenced to Adindan UTM Zone 37N coordinate system.
For the present study software that were used are; ERDAS imagine (2015) for image processing and image classification, ArcGIS 10.3 used for analysis and LHZ map preparation, eCognition Essential 9.1 used for landslide mapping, which was specifically created as a powerful instrument for object-oriented image analysis and Sentinel application platform (SNAP) for Sentinel-1A image extraction and re-sampling. Besides, ESA SNAP Desktop 5.0, StaMPS v3.3b1, Snaphu-v1.4.2 and MATLAB R2017a were also utilized for various purposes during the present study.
4.2 Information Value Model
In the present study, information values (IV) of causative factors was used to know the possibility of landslide occurrence. The information values were calculated for each subclass of the causative factor based on its presence in the past landslides map. Causative factor maps were combined with landslide map in order to get the weight for each class. For this, each of the causative factors map was overlaid on the past landslides map and landslide density were determined for various causative factor sub-classes. The positive information value suggests strong relation between the causative factor class and the landslide in the area (Yin and Yan, 1988). According to Yin and Yan (1988) weight can be mathematically obtained by using equations, 1 to 4.
\(Conditional \ probablity = {Number \ of \ landslide \ pixels \ with \ in \ factor \ class \over Number \ of \ factor \ class \ pixels}\) (1)
\(Prior \ probablity = {Sum \ of \ landslide \ pixels \ of \ the \ whole \ study \ area \over Sum \ of \ pixels \ of \ the \ whole \ study \ area}\) (2)
\(Weight \ of \ factor \ class = {Conditional \ priority \over Prior \ probability}\) (3)
\(Information \ value \ (IV) = {log(Weight \ of \ factor \ class)}\) (4)
Thus, the obtained Information values were assigned for each of the factor class to prepare the weighted causative factor maps. Later, these causative factor maps were processed by using the raster calculator to determine landslide susceptibility index (LSI) value for each pixel (equation 5):
\(LSI = VI_{Slope \ angle}+VI_{Elevation}+VI_{Aspect}+VI_{Slope \ material}+VI_{NDVI}+VI_{LULC}\) (5)
where, LSI is the landslide susceptibility index, IV is information value, NDVI is Normalized Difference Vegetation Index and LULC is land-use and land-cover.
Finally, the landslide hazard zonation map was prepared based on the LSI values. The landslide hazard was classified into five classes such as very low hazard (VLH), low hazard (LH), moderate hazard (MH), high hazard (HH) and very high hazard zone (VHH).
4.3 Slope Instability Assessment
4.3.1 InSAR Time Series Analysis
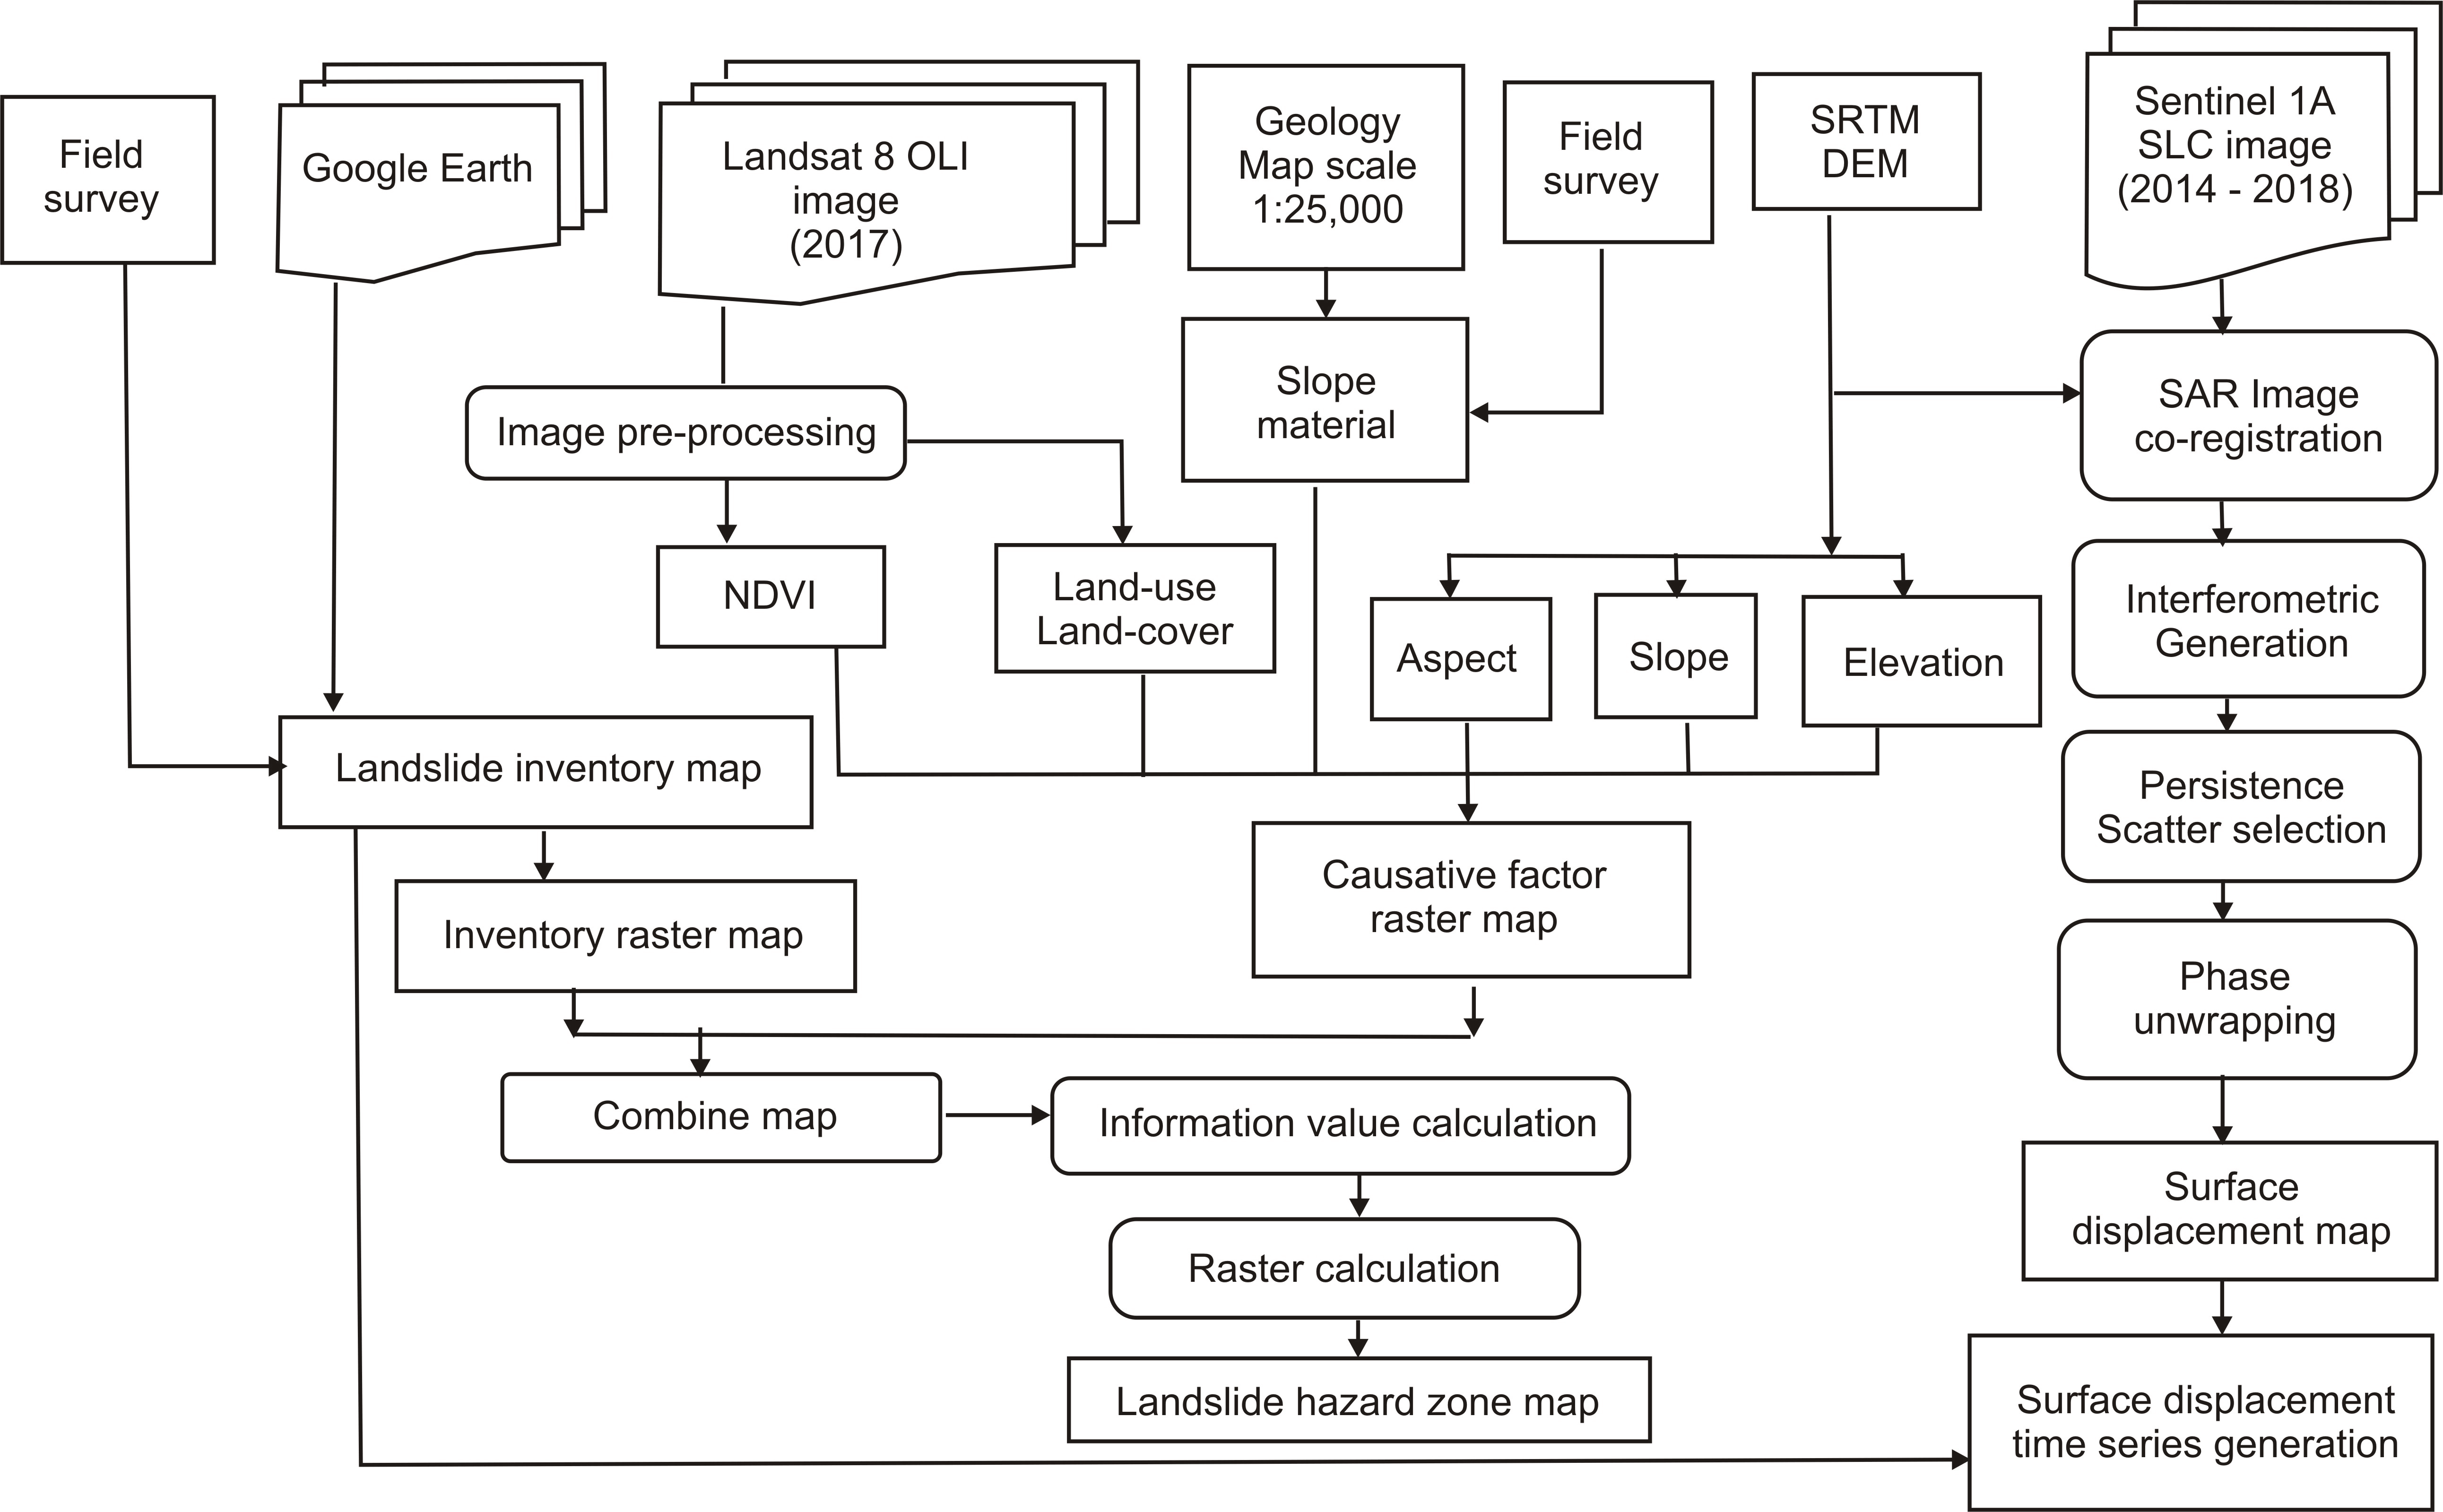
Advanced InSAR methods; such as Persistent Scattered (PS) (Greif and Vlcko, 2012) and Small Baseline Subset (SBAS) (Lanari et al., 2007), can overcome objects from atmospheric noise, spatial and temporal baseline de-correlation. Besides, these methods may be helpful for time-series displacement analysis by utilizing a stack of SAR data set. For the present study PS technique was used for surface displacement time-series analysis at landslide affected areas. For long term deformation monitoring works, a special form of InSAR is used which known as Persistent Scatterer Interferometry Synthetic Aperture Radar (PS-InSAR). PS-InSAR is capable of finding objects in the area of the image that produces a constant and characteristic radar reflection over time in a stack of many radar images. The PS-InSAR technique was originally proposed by Ferretti et al. (2000) which is used to estimate the time series displacement of each of the detected PS pixels. Later, an improved method StaMPS by Hooper et al. (2007) was proposed which is find to be suitable of finding PS pixels in both urban and non-urban areas. Besides, it requires less number of interfrograms to map the surface displacement. Further, PS-InSAR is a multi-temporal differential InSAR technique, which can analyze long temporal stack of satellite SAR data. The technique provides mean velocity and time series of ground deformation on dense grids of point-wise targets, known as Persistent Scatterers (Ferretti et al., 2001). The PS-InSAR basically works by identifying image pixels in a stack of interfrograms that are generated with the same master that persistently backscatter the radar signal over a long time interval. The detailed schematic flow chart of the methodology followed in the present study is presented in Figure 3.
5 . RESULTS
5.1 Landslide Inventory
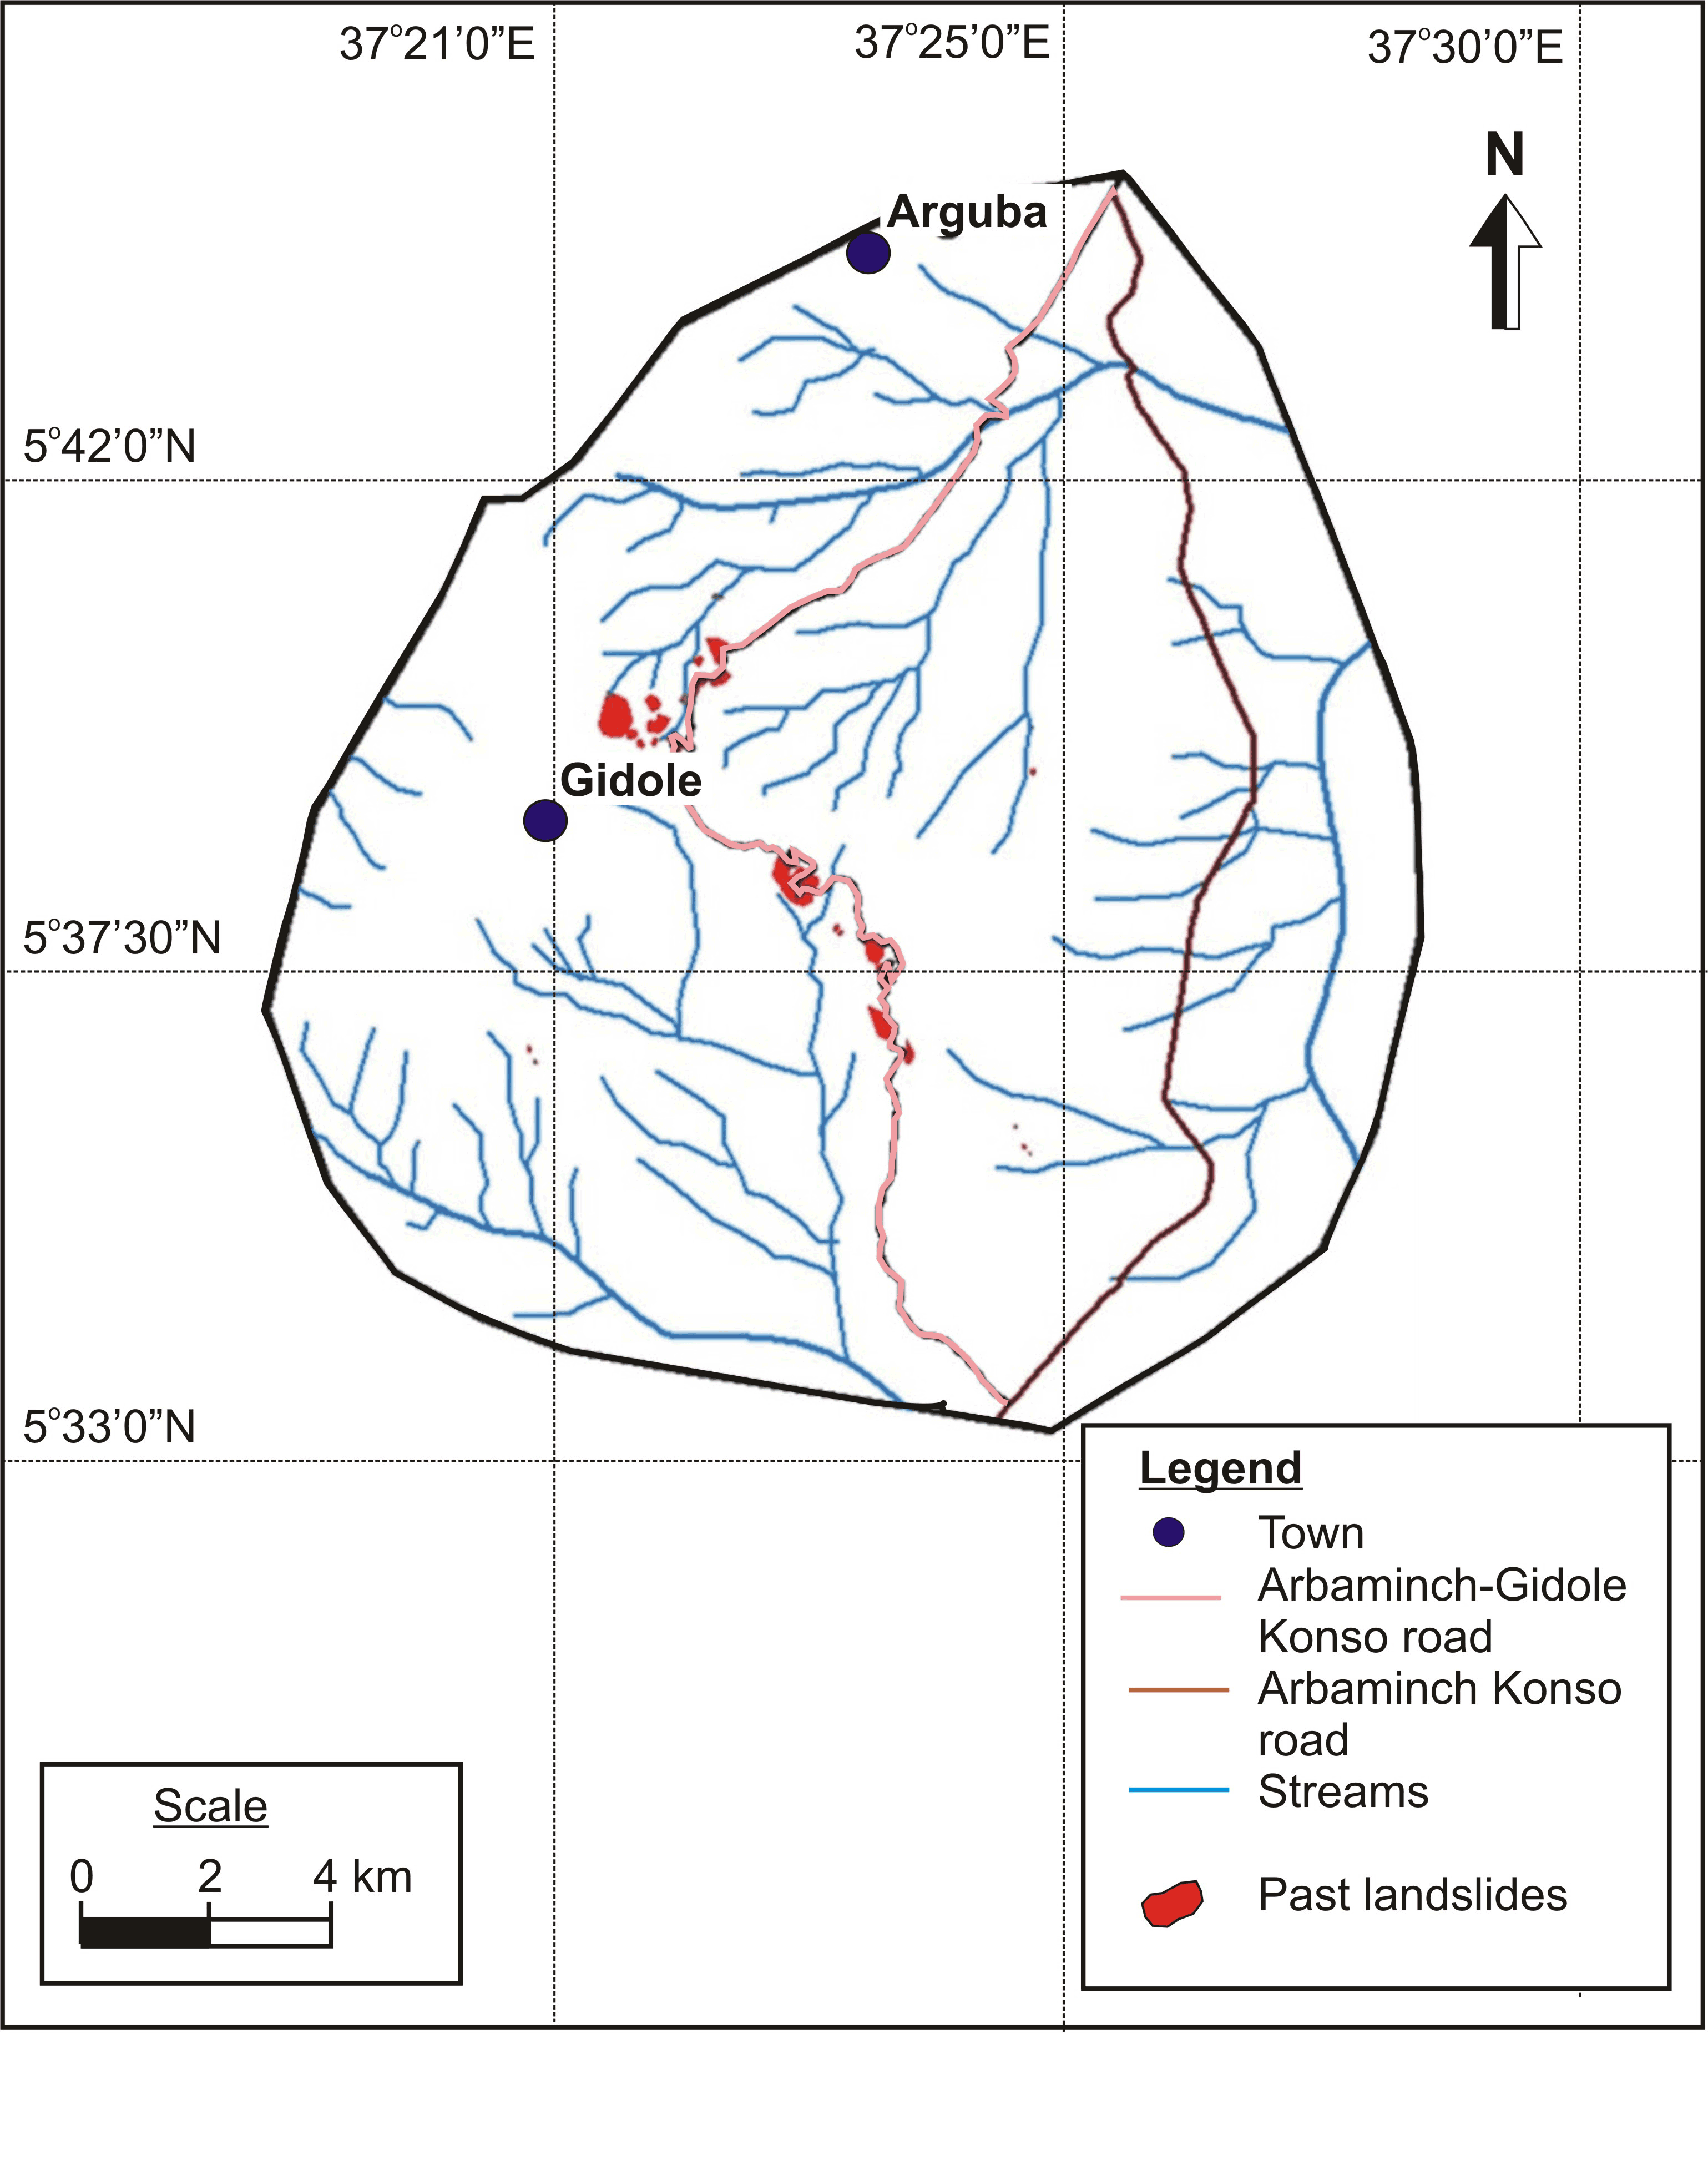
Landslide inventory map of the study area was prepared from the field observations and the Google Earth image (2017) interpretation. In total 39 landslides of different types were recorded. Out of these 37 (94.7%) landslides were found in the Western and Southern parts of the Arbaminch-Gidole-Konso road (Figure 4). These landslides were possibly triggered due to unplanned cutting of the slope sections along the road. The road construction has reactivated some of the old landslides and also it has triggered new landslides in the area. Further, overlay analysis was made between the landslide inventory map and each of the causative factor maps and information values (IV) were computed for respective sub classes of the considered causative factors.
5.2 Causative Factors Influence on Landslides
The environmental factors are the collection of data that are expected to have an effect on the occurrence of landslide, and can be utilized as causal factors in the prediction of future landslides (Raghuvanshi et al., 2014; Van Westen et al., 2008; Anbalagan, 1992). The thematic maps of the causative factors including slope angle, aspect and elevation were prepared from the SRTM DEM at 30m resolution. Slope material layer of the study area was extracted from the geological map of Ethiopia with the scale of 1:25,000 and through the field observations made during the present study. Further, land-use and land-cover and NDVI were prepared from the Landsat 8 OLI 2017 image. Later, all vector maps were transformed into raster data for further analysis. Details of various causative factors layers and the data source that was used to prepare these causative factor maps are presented in Table 1.
Table 1. Details of causative layers and data sources
|
Causative factors
|
Data
|
Data type
|
Data source
|
|
Landslide inventory
|
Google Earth and field observation
|
Polygon
|
Google Earth and field observation
|
|
Elevation
|
SRTM DEM
|
30 m grid
|
USGS
|
|
Slope angle
|
SRTM DEM
|
30 m grid
|
USGS
|
|
Aspect
|
SRTM DEM
|
30 m grid
|
USGS
|
|
NDVI and LULC
|
Landsat 8 OLI 2017 Image
|
30 m grid
|
USGS
|
|
Slope material
|
Geology map 1:25,000
|
Polygon
|
Geological Survey of Ethiopia
|
5.2.1 Slope Material
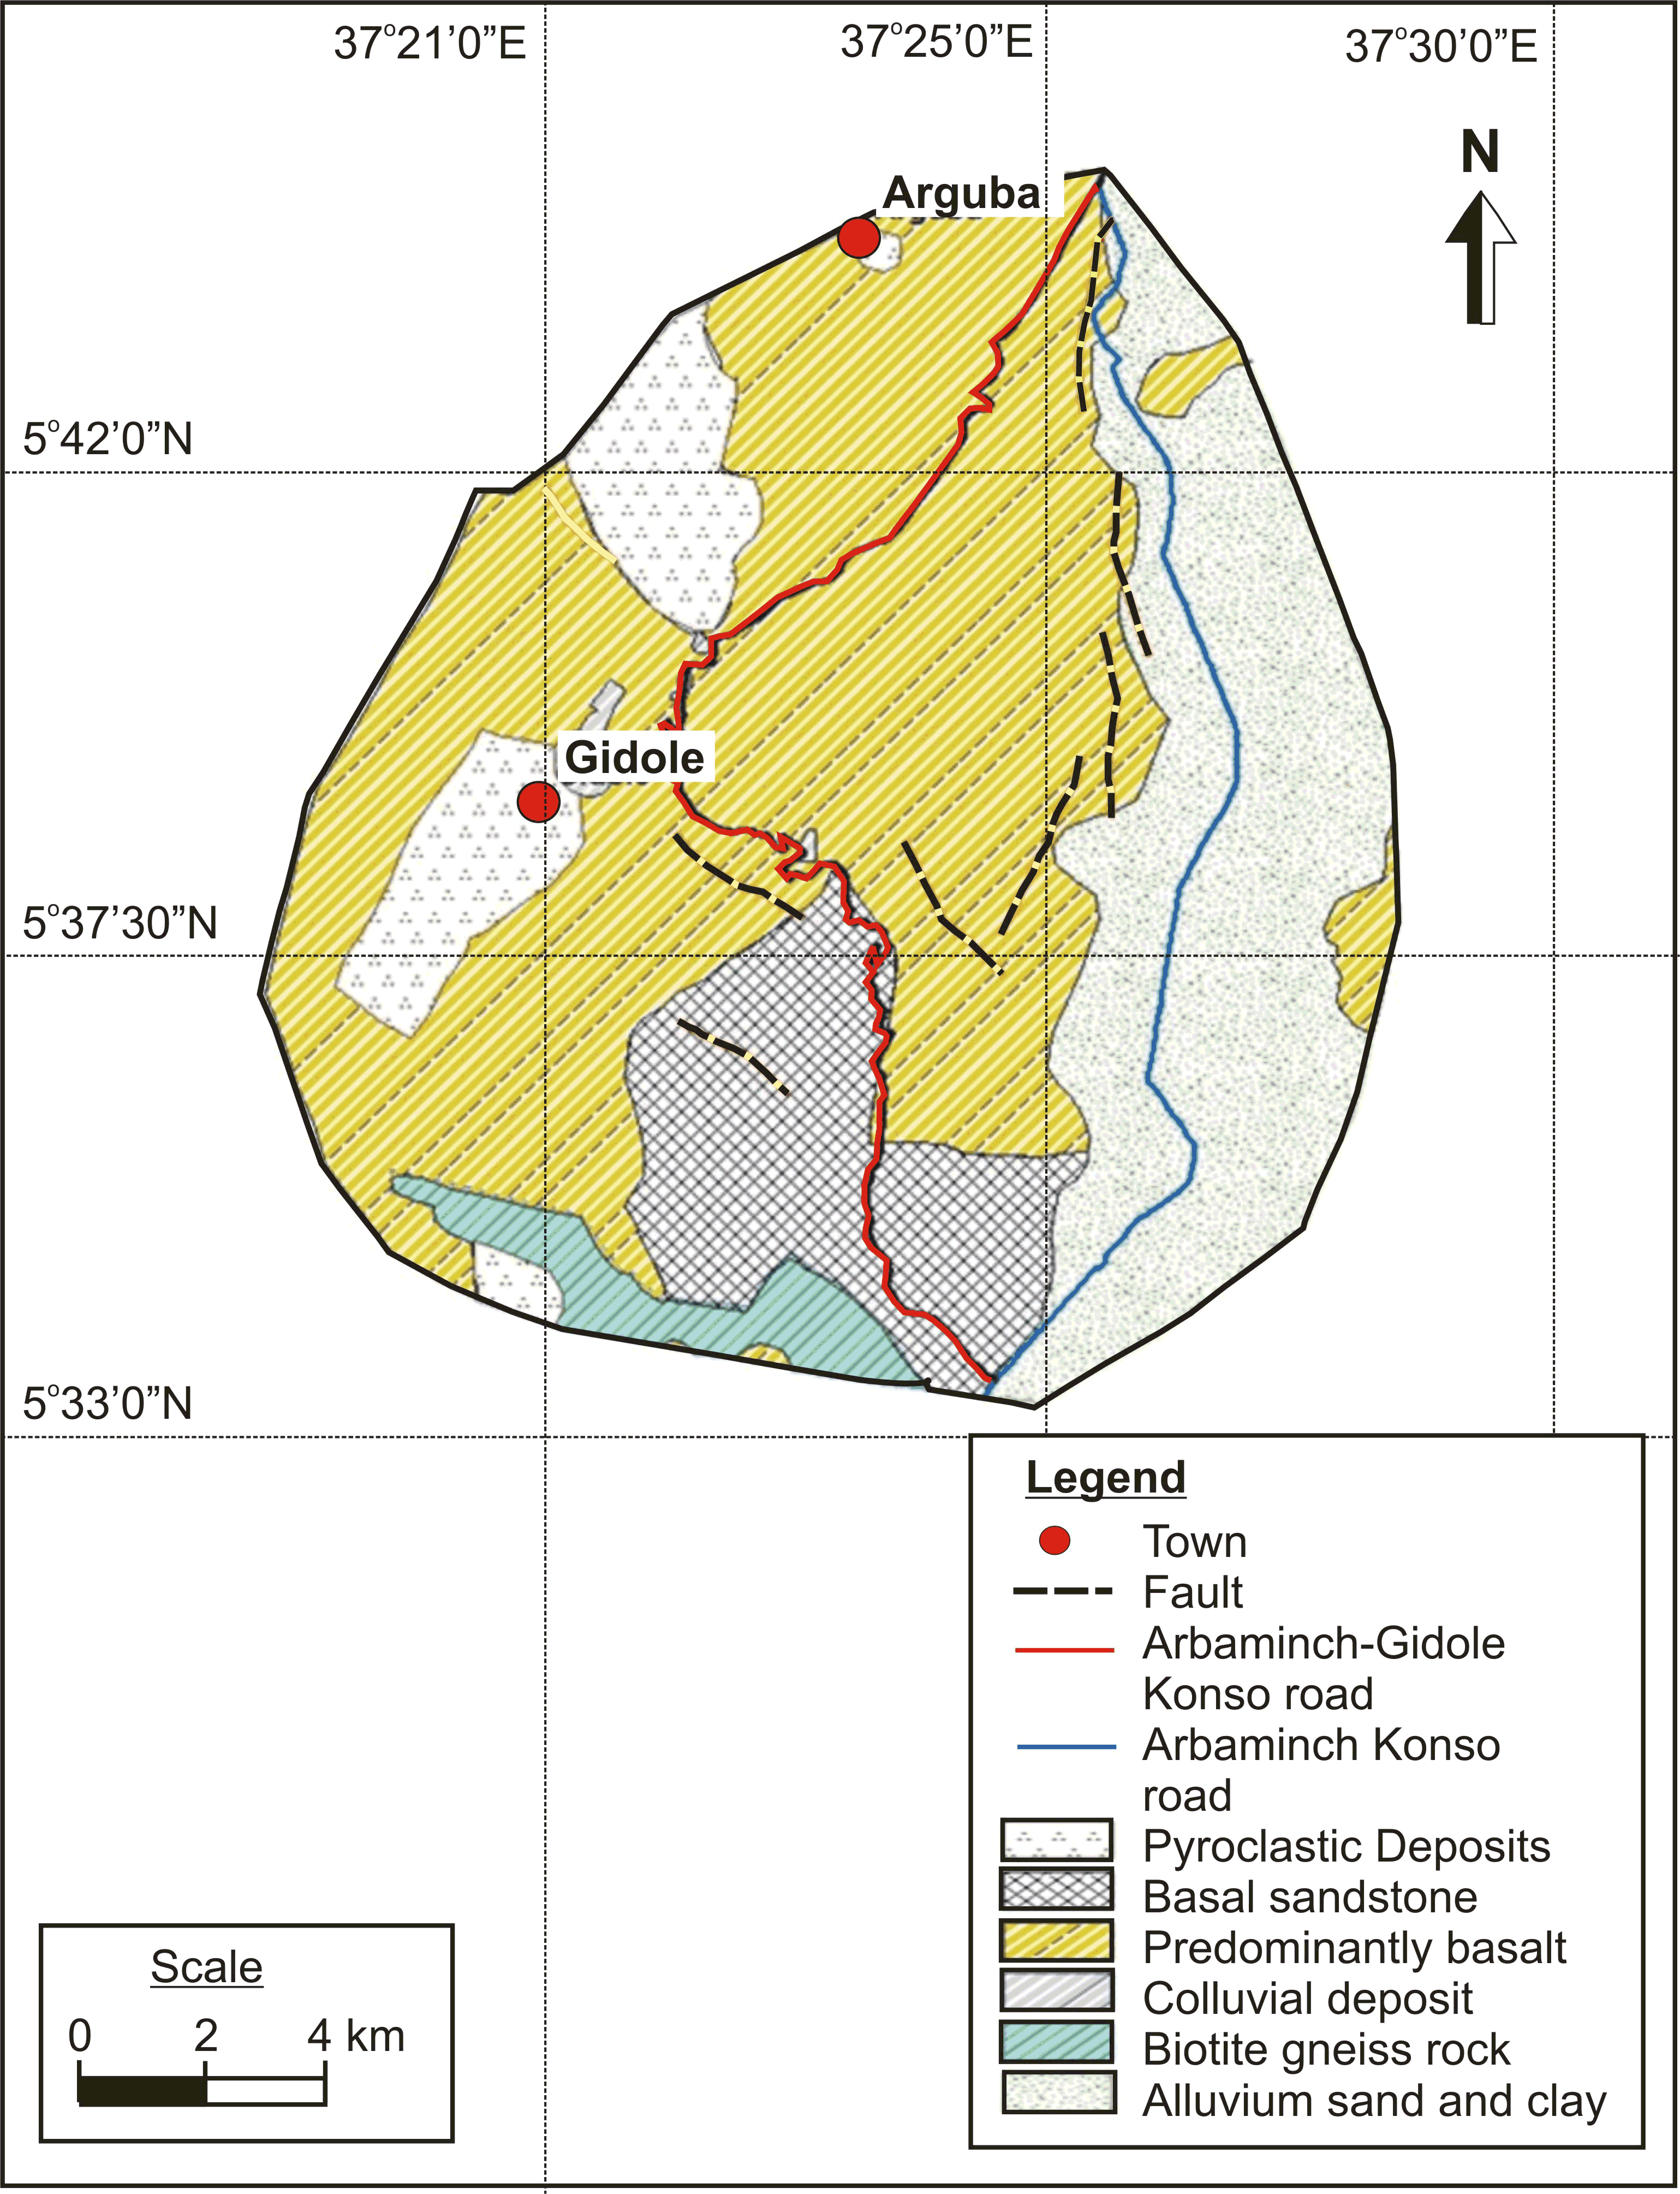
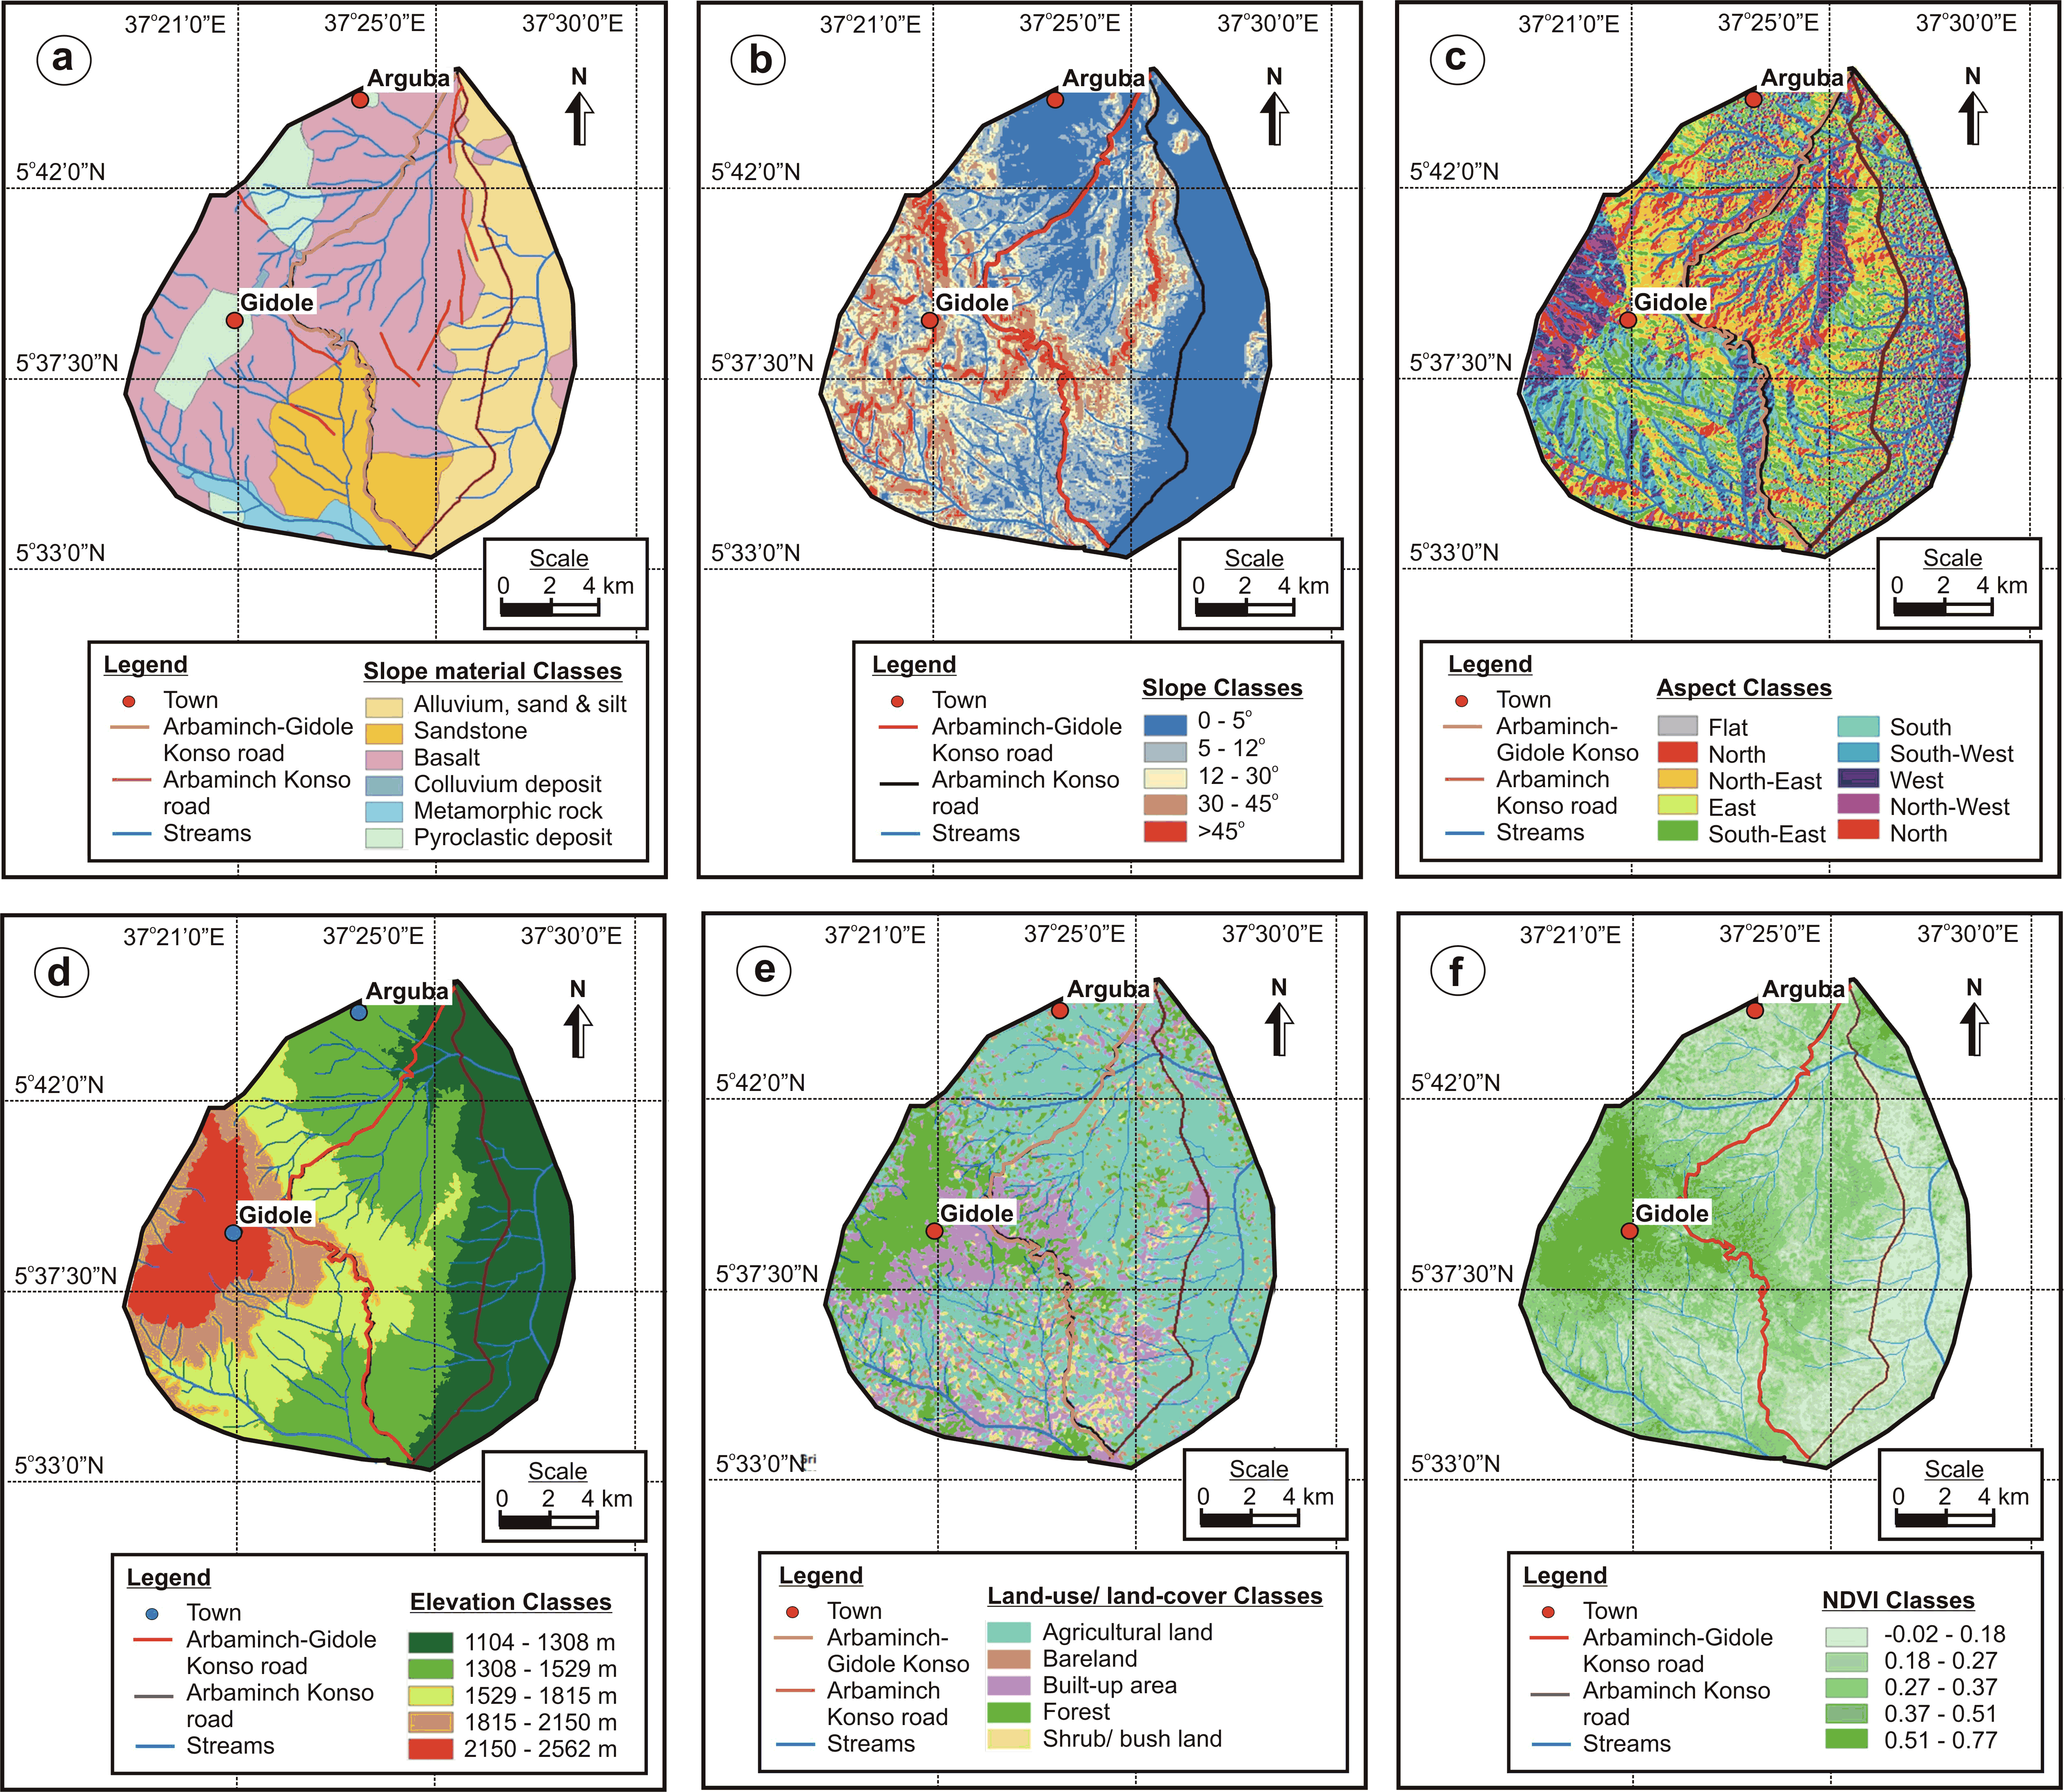
In the present study area, the main rock types which were identified are: basalt, pyroclastic deposit, basal sandstone and biotite gneiss rocks. The main soil types that are present includes: colluvial deposit and alluvium, sand and clay (Figure 5a). The overlay analysis between the past landslides and the slope material clearly shows that 50.2% landslides occurred in basalts, 14.8% in basal sandstone, 15.6% in colluvial deposits and 10.9% in pyroclastic deposits (Table 2). Further, as per information value (IV) computations colluvial deposit which is dominated in the western part of the study area show significant slope instability problems and have highest information value of 0.85. Further, basal sandstone and pyroclastic deposits also demonstrate a higher information value of 0.27 and 0.15, respectively.
Table 2. Information values for various classes of causative factors
|
Causative factor class
|
Factor class in Entire area
|
Factor class Within landslides
|
Conditional probability
|
Prior probability
|
Weight of factor class
|
Infor-mation value
(IV)
|
|
Pixel count
|
Pixels %
|
Pixel count
|
Pixel
%
|
- Slope material
|
|
Pyroclastic deposit
|
18317
|
7.7
|
627
|
10.9
|
0.034
|
0.024
|
1.40
|
0.15
|
|
Basal sandstone
|
19304
|
8.2
|
856
|
14.8
|
0.044
|
0.024
|
1.85
|
0.27
|
|
Basalt
|
127546
|
53.9
|
2901
|
50.2
|
0.023
|
0.024
|
0.95
|
-0.02
|
|
Colluvial deposit
|
5254
|
2.2
|
903
|
15.6
|
0.172
|
0.024
|
7.16
|
0.85
|
|
Basaltic Gneiss rock
|
8627
|
3.6
|
47
|
0.8
|
0.005
|
0.024
|
0.23
|
-0.65
|
|
Alluvium, sand & clay
|
57595
|
24.3
|
440
|
7.6
|
0.008
|
0.024
|
0.32
|
-0.50
|
|
Total
|
236643
|
100.0
|
5773
|
100.0
|
|
|
|
|
- Slope
|
|
0−5o
|
51383
|
21.7
|
377
|
6.5
|
0.007
|
0.024
|
0.31
|
-0.51
|
|
5−12 o
|
98669
|
41.7
|
1784
|
30.9
|
0.018
|
0.024
|
0.75
|
-0.12
|
|
12−30 o
|
78732
|
33.3
|
3263
|
56.5
|
0.041
|
0.024
|
1.73
|
0.24
|
|
30−45 o
|
7529
|
3.2
|
348
|
6.0
|
0.046
|
0.024
|
1.93
|
0.28
|
|
>45 o
|
330
|
0.1
|
0
|
0.0
|
0.000
|
0.024
|
0.00
|
0.00
|
|
Total
|
236643
|
100.0
|
5773
|
100.0
|
|
|
|
|
- Aspect
|
|
Flat
|
92
|
0.0
|
0
|
0.0
|
0.000
|
0.024
|
0.00
|
0.00
|
|
North
|
16378
|
6.9
|
480
|
8.3
|
0.029
|
0.024
|
1.22
|
0.09
|
|
North East
|
41952
|
17.7
|
1146
|
19.8
|
0.027
|
0.024
|
1.14
|
0.06
|
|
North West
|
18719
|
7.9
|
270
|
4.7
|
0.014
|
0.024
|
0.60
|
-0.22
|
|
South
|
28507
|
12.0
|
860
|
14.9
|
0.030
|
0.024
|
1.26
|
0.10
|
|
South East
|
38694
|
16.4
|
725
|
12.6
|
0.019
|
0.024
|
0.78
|
-0.11
|
|
South West
|
23247
|
9.8
|
875
|
15.2
|
0.038
|
0.024
|
1.57
|
0.20
|
|
West
|
21352
|
9.0
|
420
|
7.3
|
0.020
|
0.024
|
0.82
|
-0.09
|
|
East
|
47703
|
20.2
|
996
|
17.2
|
0.021
|
0.024
|
0.87
|
-0.06
|
|
Total
|
236643
|
100.0
|
5773
|
100.0
|
|
|
|
|
- Elevation
|
|
1104−1308 (m)
|
68251
|
28.8
|
0
|
0.0
|
0.000
|
0.024
|
0.00
|
0.00
|
|
1308−1529 (m)
|
70886
|
30.0
|
47
|
0.8
|
0.001
|
0.024
|
0.03
|
-1.56
|
|
1529−1815 (m)
|
47284
|
20.0
|
2349
|
40.7
|
0.050
|
0.024
|
2.07
|
0.32
|
|
1815−2150 (m)
|
26972
|
11.4
|
3377
|
58.5
|
0.125
|
0.024
|
5.22
|
0.72
|
|
2150−2562 (m)
|
23249
|
9.8
|
0
|
0.0
|
0.000
|
0.024
|
0.00
|
0.00
|
|
Total
|
236643
|
100.0
|
5773
|
100.0
|
|
|
|
|
- Land use and land cover
|
|
Forest
|
50686
|
21.4
|
627
|
10.9
|
0.012
|
0.024
|
0.52
|
-0.29
|
|
Built-up area
|
55454
|
23.4
|
848
|
14.7
|
0.015
|
0.024
|
0.64
|
-0.20
|
|
Bare land
|
25318
|
10.7
|
795
|
13.8
|
0.031
|
0.024
|
1.31
|
0.12
|
|
Agricultural land
|
86850
|
36.7
|
2997
|
51.9
|
0.035
|
0.024
|
1.44
|
0.16
|
|
Bush land
|
18335
|
7.7
|
506
|
8.8
|
0.028
|
0.024
|
1.15
|
0.06
|
|
Total
|
236643
|
100.0
|
5773
|
100.0
|
|
|
|
|
- Normalized Difference Vegetation Index
|
|
0.02−0.18
|
33325
|
14.1
|
1123
|
19.5
|
0.034
|
0.024
|
1.40
|
0.15
|
|
0.18−0.27
|
34715
|
14.7
|
1146
|
19.9
|
0.033
|
0.024
|
1.38
|
0.14
|
|
0.27−0.37
|
32133
|
13.6
|
1538
|
26.6
|
0.048
|
0.024
|
1.99
|
0.30
|
|
0.37−0.51
|
69916
|
29.5
|
1547
|
26.8
|
0.022
|
0.024
|
0.92
|
-0.04
|
|
0.51−0.77
|
66554
|
28.1
|
419
|
7.3
|
0.006
|
0.024
|
0.26
|
-0.58
|
|
Total
|
236643
|
100.0
|
5773
|
100.0
|
|
|
|
|
5.2.2 Slope
The slope is considered as to be an important factor for landslide occurrence (Anbalagan, 1992; Raghuvanshi et al., 2014). The study area was classified into five slope classes: 0-5º (21.7% of the study area), 5-12º (41.7%), 12-30º (33.3%), 30-45º (3.2%) and >45º (0.1%) (Figure 5b). The overlay analysis revealed that 56.5% of the landslides occurred in slope class 12-30º and 30.9% of landslides occurred in slope class 5-12º. Further, slope classes 0-5º, 30-45º and >45º showed 6.5%, 6% and no landslides, respectively. The slope classes, 12-30º and 30-45º show highest probability of landslide occurrence with information values of 0.24 and 0.28, respectively (Table 2). The positive information values of the factor class indicates higher probability of landslide occurrence within a respective causative factor class. Further, slope classes 0-5º, 5-12º and >45º show low probability for the landslide occurrence as the computed information values (IV) for these classes are -0.51, -0.12 and 0, respectively (Table 2).
5.2.3 Aspect
Slope aspect in the present study area has also played an equally important role in landslide occurrence. The overlay analysis showed that 19.8% landslides occurred in slopes that are oriented towards Northeast, 17.2% occurred in slopes that are oriented towards East, 15.2% occurred in slopes that are oriented towards Southwest, 14.9% occurred in slopes that are oriented towards south and 12.6% occurred in slopes that are oriented towards Southeast direction (Table 2, Figure 5c). Further, based on the information value (IV) it can be noticed that slopes that are oriented towards Southwest, South, North and Northeast have higher probability of landslide occurrence as the information values for these classes are 0.20, 0.10, 0.09 and 0.6, respectively.
5.2.4 Elevation
Landslides have a strong correlation with the elevation (Chimidi et al., 2017; Hamza and Raghuvanshi, 2017). The elevation were classified into five classes viz., 1104-1308m, 1308-1529 m, 1529-1815 m, 1815-2150 m and 2150-2562 m (Figure 5d). Further, overlay analysis clearly showed that 58.5% of landslide occurred in elevation class 1815-2150 m whereas, 40.7% landslides occurred in elevation class 1529-1815 m. The remaining 0.8% landslides occurred in elevation class 1308-1529 m (Table 2). No landslides were observed in elevation classes 1104-1308 m and 2150-2562 m. Based on the Information value (IV) it can be noticed that elevation classes 1815-2150 m and 1529-1815 m shows higher probability for landslide occurrence as the information value (IV) for these classes are 0.72 and 0.32, respectively (Table 2).
5.2.5 Land-use and Land-cover
The land-use and land-cover has significant influence on the landslide occurrence. The areas which have good vegetation cover are relatively stable whereas improper land-use practices may induce slope instability (Anbalagan, 1992). The area was classified into five categories viz., forest, built-up area, bare land, agricultural land and bush/shrub land. From the overlay analysis it was found that 51.9% landslides occurred in agricultural land, 14.7% in built-up area, 13.8% in bare land, 10.9% in forest land and 8.8% in bush land (Table 2, Figure 5e). The higher concentration of landslides in agricultural land (51.9%) in the present study area is related to un-planned irrigation practices and the presence of unconsolidated unstable colluvial and alluvial soils on gentle slopes. The colluvial and alluvial soils possess low shear strength and are susceptible to instability when they are saturated (Raghuvanshi et al., 2014; Hamza and Raghuvanshi, 2017). Further, information value of 0.16 also suggests that agricultural land in the study area show higher probability for landslide occurrence. Also, bare land and bush land are more susceptible for slope instability as the Information values for these classes are 0.12 and 0.06, respectively (Table 2). Further, forest and built-up area with Information values -0.29 and -0.2, respectively show less probability for landslide occurrence.
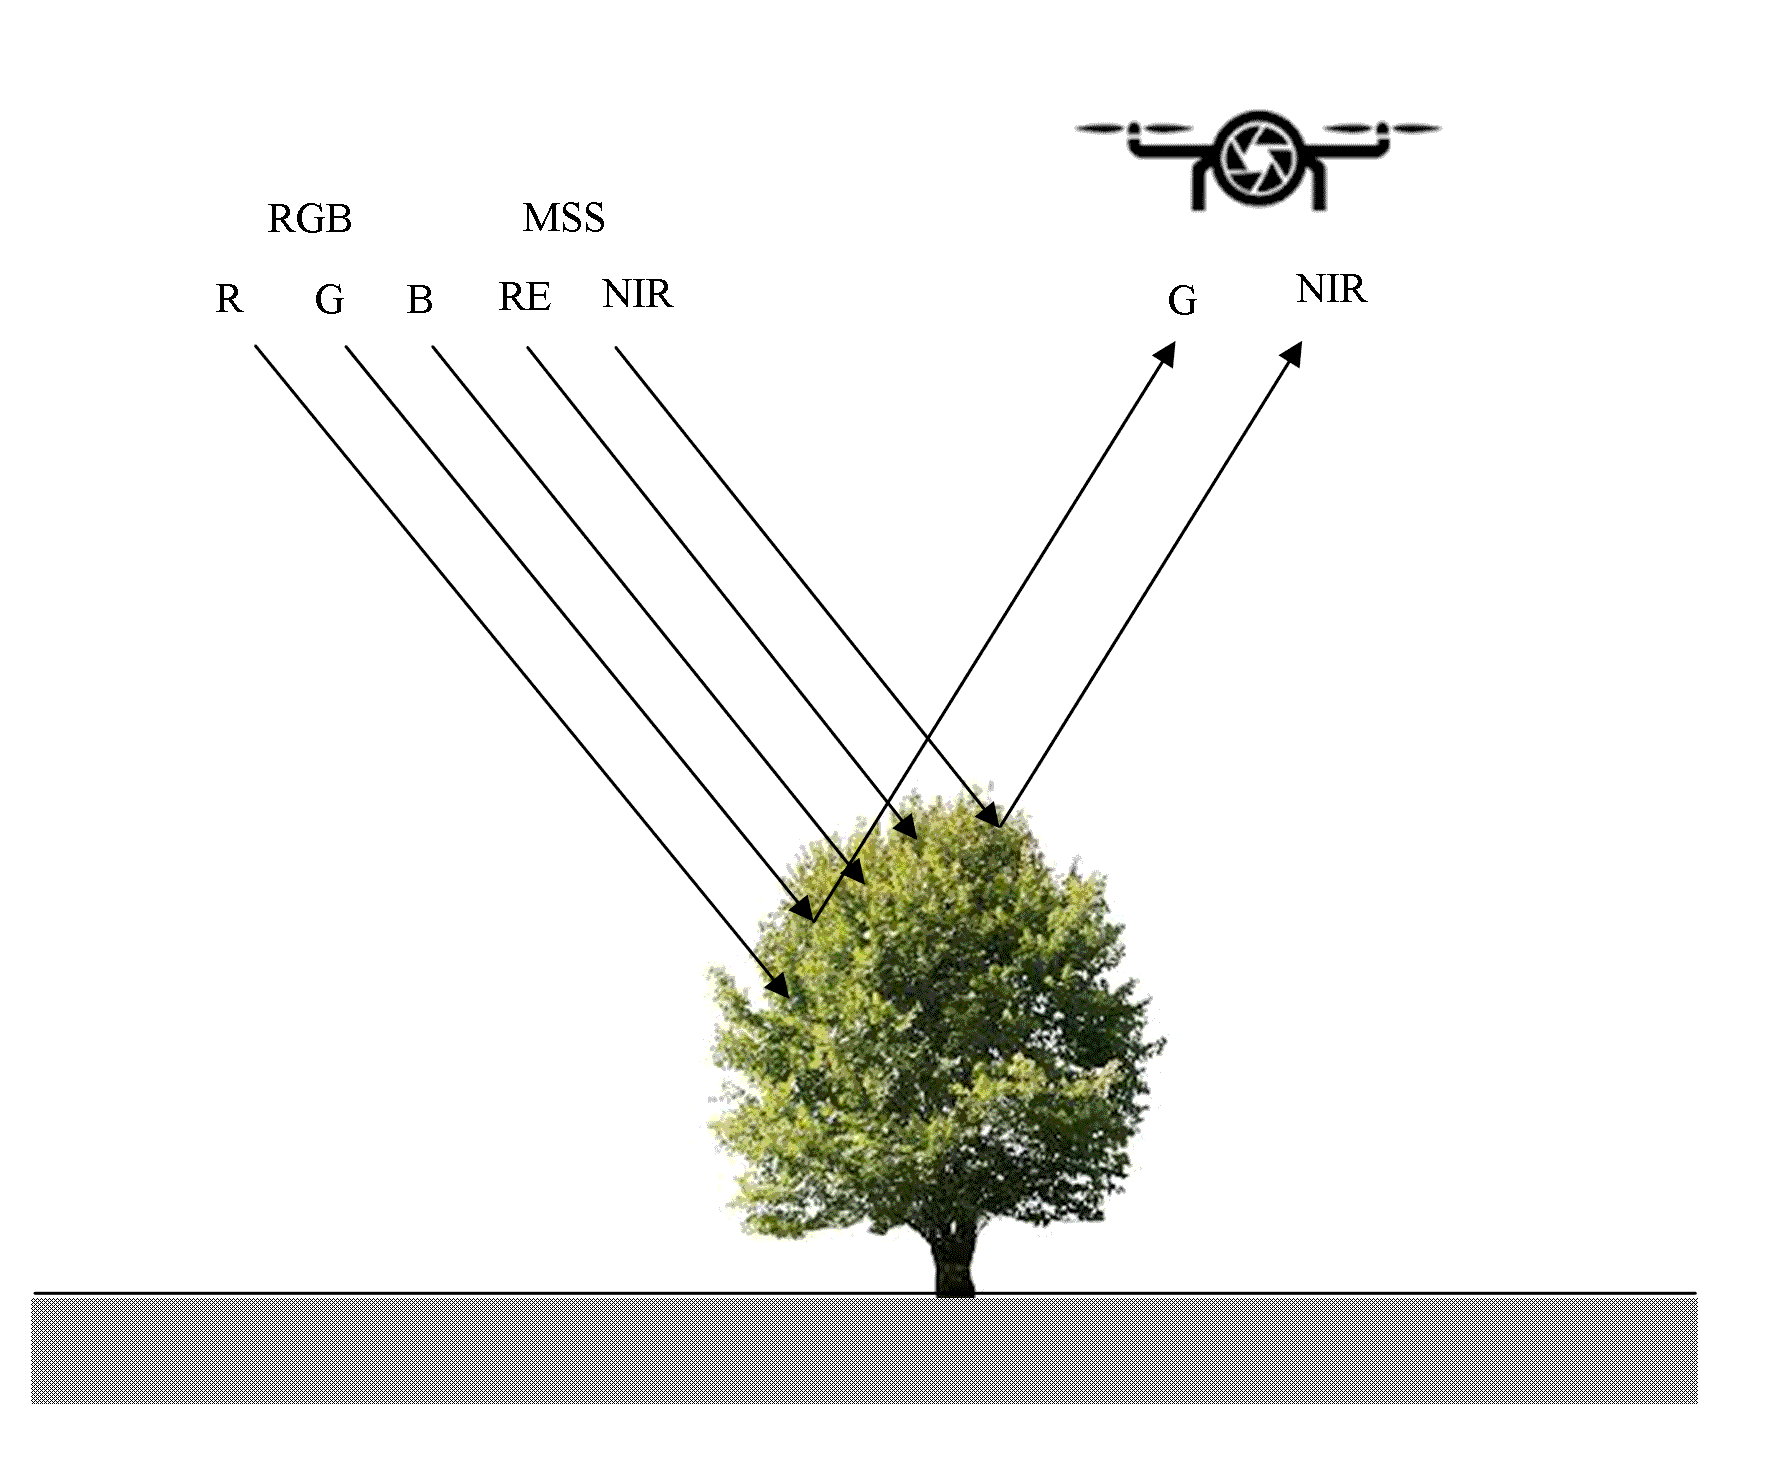
5.2.6 Normalized Difference Vegetation Index (NDVI)
Vegetation in general improves the stability of the slope (Anbalagan, 1992; Raghuvanshi et al., 2014). The NDVI value in general reflects the vegetation coverage in the area. Higher NDVI values indicate dense green vegetation which is resulted due to low reflectance in red band due to high chlorophyll. In contrast, sparse vegetation results into low NDVI due to less chlorophyll (Rouse, 1974). For the present study NDVI was determined from Landsat 8 OLI image acquired in 2017. Thus, by using data for multispectral sensor working in the visible and NIR region of the electromagnetic spectrum, NDVI was calculated. The results (Table 2) clearly indicates that higher information values (IV) (0.14 to 0.30) are distributed for NDVI classes falling between 0.02 to 0.37, which generally corresponds to built-up area, agricultural land and shrub/bush lands (Figure 5f). From Information values (IV) it may be realized that as the NDVI value become higher (>0.37), probability of occurrence of landslide is lower. From this it can be realized that as the NDVI increase the Information value (IV) in general decreases and the probability of landslide occurrence decreases. However, in the present study the relation between the past landslide occurrence and NDVI do not show dominance of any particular NDVI class. In fact past landslides are fairly distributed in all NDVI classes, except NDVI class 0.51-0.77 where relatively fewer landslides (7.3%) were observed.
5.3 Landslide Hazard Evaluation and Zonation
In the present study, main factors that are possibly responsible for landslide occurrence are slope material, slope angle, aspects, elevation, land-use and land-cover and NDVI. It is believed that combination of various factor classes might have resulted into landslide in the area. The evaluation of these factors based on statistical correlation with the past landslides formed the basis to delineate the study area into various landslide potential classes. Therefore, for the landslide hazard evaluation spatial relationship between the occurrence of landslides and each landslide causative factor class was derived. The distributions of landslide occurrence over each factor maps have been obtained using the information value (IV) model. The information values are assigned to each class to obtain weighted factor map. Each factor maps were summed up by using raster calculator to calculate the landslide susceptibility index (LSI) for each pixel.
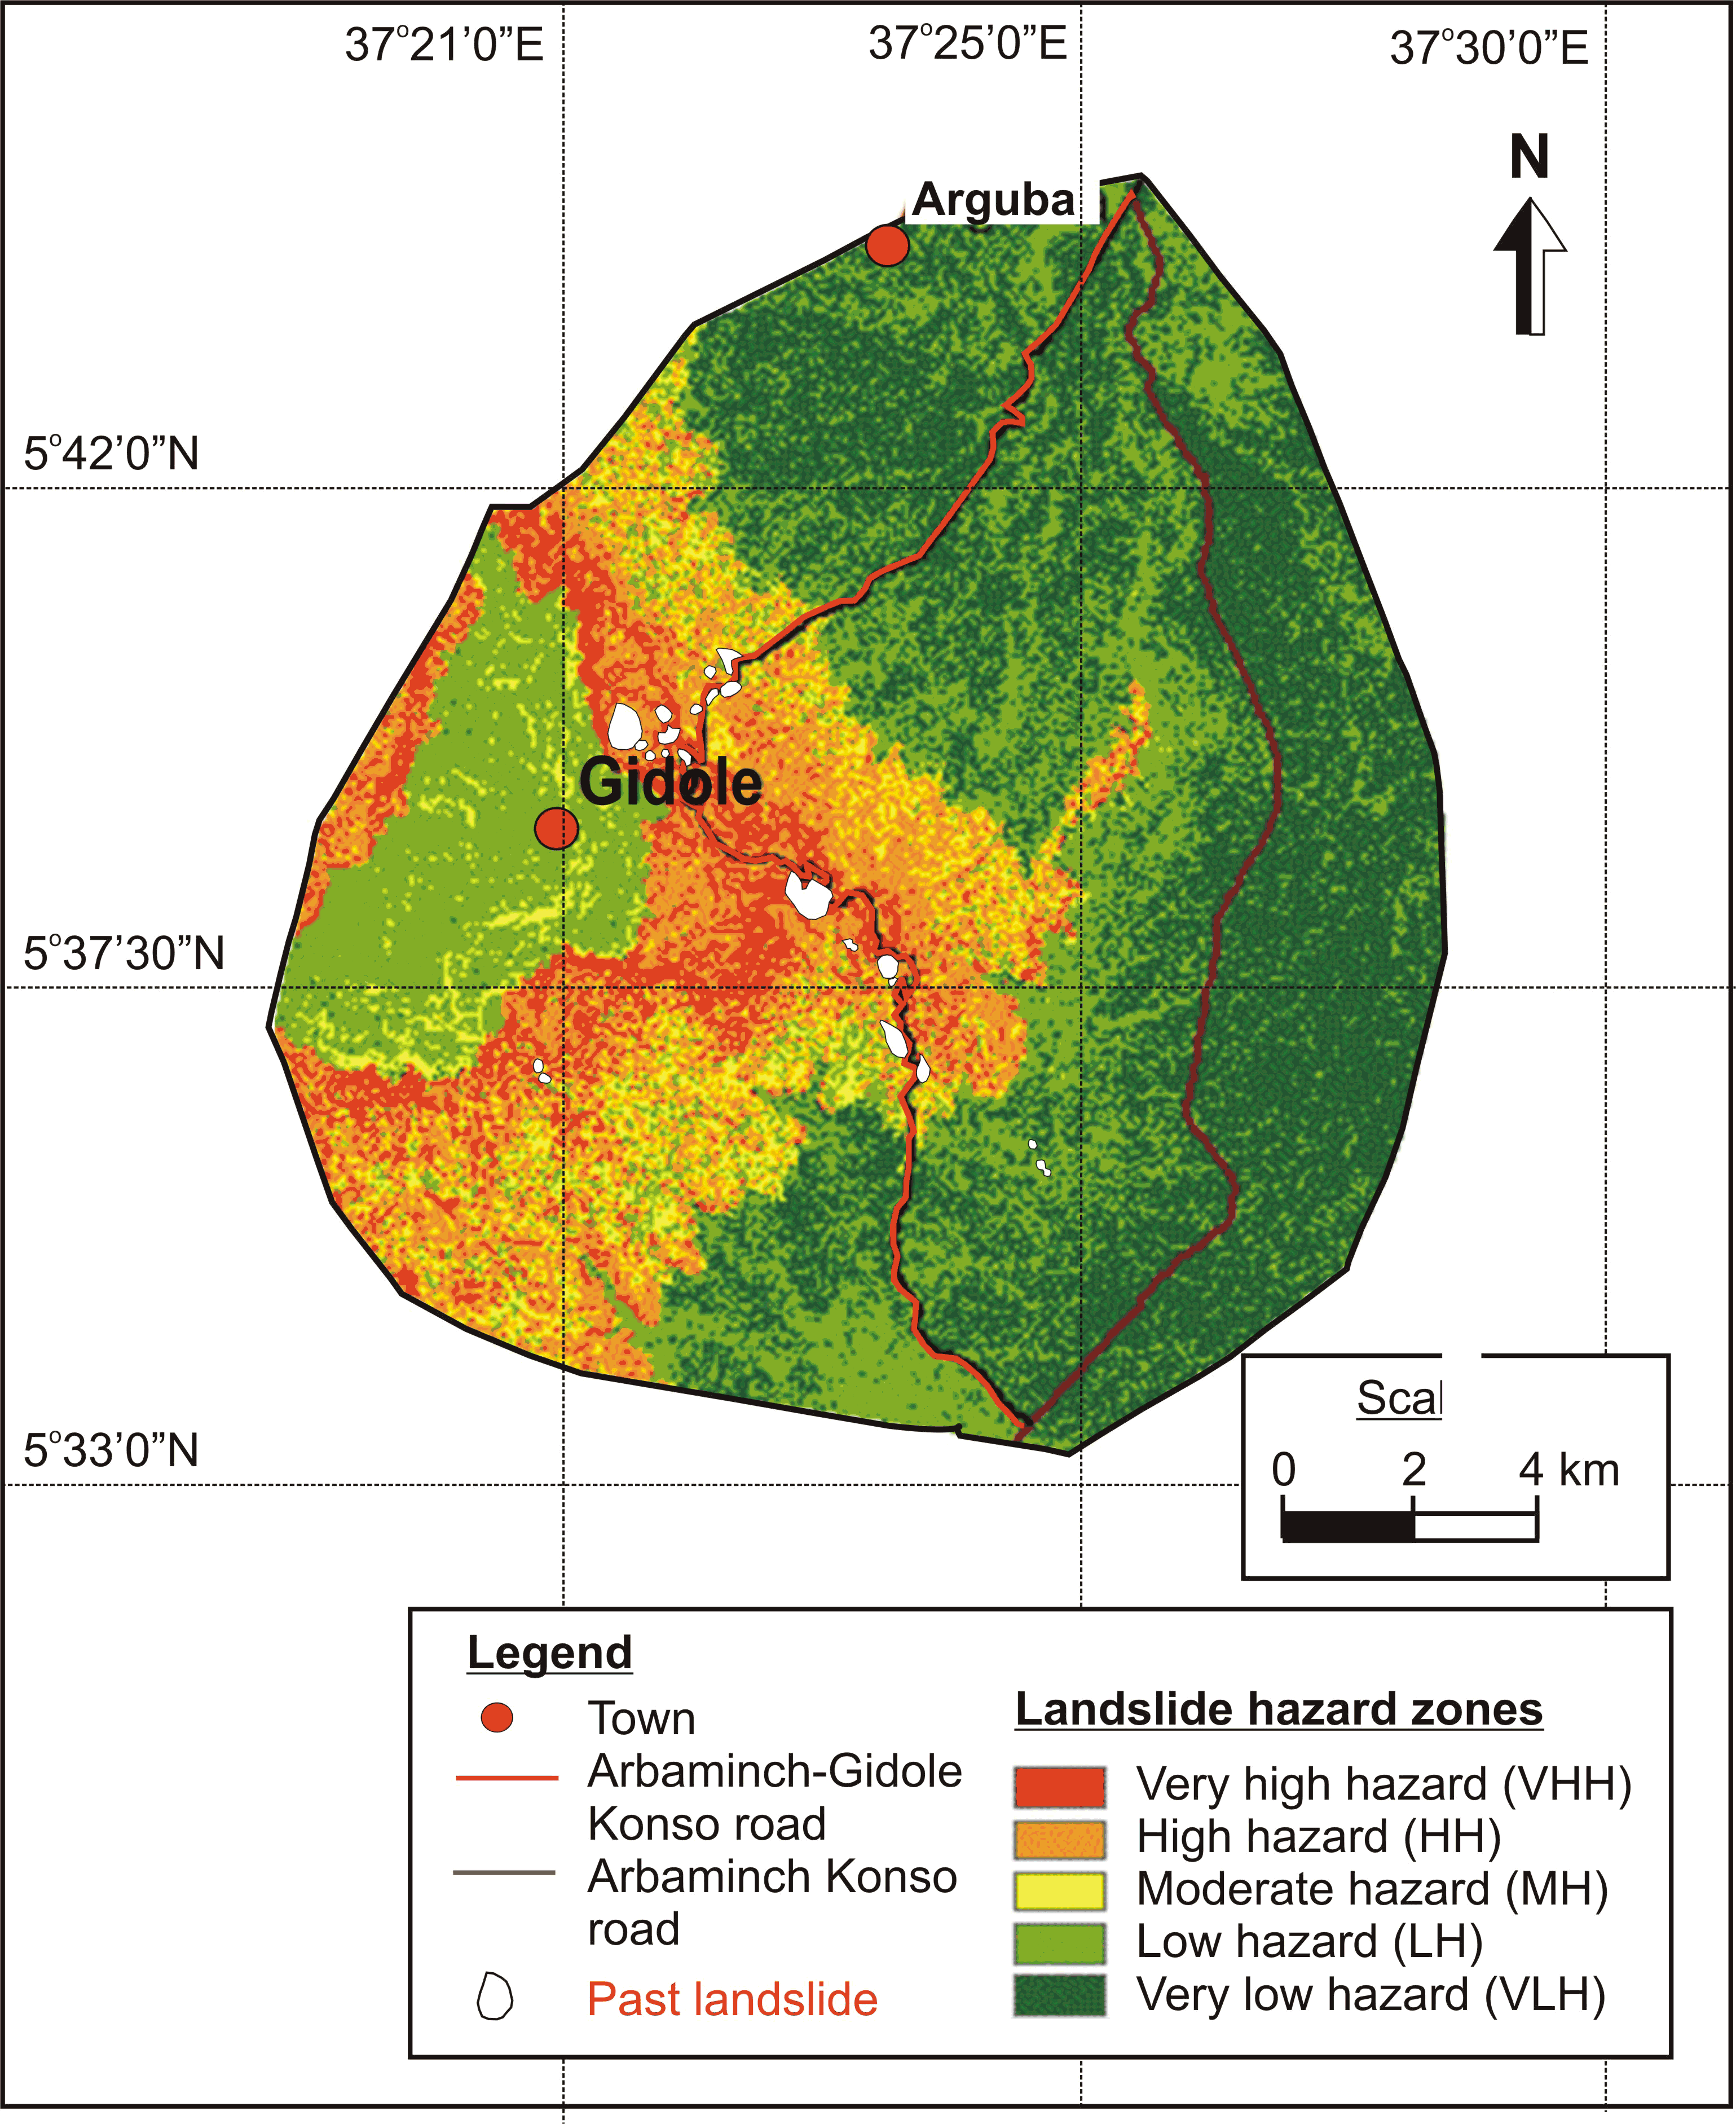
The relation analysis is the information value of the area where landslides occurred to the total area, if the value is higher relative to other classes, it shows a higher correlation; if lower, it indicates a lower correlation. The least LSI value obtained for the study area is -2.37 and the maximum being 1.26. Based on the LSI distribution the landslide hazard in the present study area was divided in to five classes; very high hazard (VHH), high hazard (HH), moderate hazard (MHH), low hazard (LH) and very low hazard (VLH) zone. Further, on trial basis LSI values were distributed into different hazard classes and landslide hazard zonation (LHZ) map was prepared. For each of such attempt the prepared LHZ map was validated with the past landslide data. Thus, the best hazard zonation classes obtained by this procedure are presented in Table 3 and the LHZ map thus prepared is presented in figure 6.
Table 3. Landslide hazard zonation classes based on landslide hazard susceptibility index
|
Landslide hazard zone
|
LSI
value range
|
Landslide hazard class coverage
|
Past landslide coverage
|
|
Pixel count
|
Area
(%)
|
Area
(km2)
|
Pixel count
|
Area
(%)
|
|
Very high
|
1.26 −0.64
|
15691
|
6.63
|
14.12
|
3404
|
58.97
|
|
High
|
0.64 −0.13
|
36351
|
15.36
|
32.72
|
1924
|
33.33
|
|
Moderate
|
0.13 –0
|
17669
|
7.47
|
15.9
|
296
|
5.12
|
|
Low
|
0 − (-0.26)
|
80940
|
34.2
|
72.85
|
149
|
2.58
|
|
Very low
|
-0.26 − (-2.37)
|
85992
|
36.34
|
77.4
|
0
|
0
|
A perusal of LHZ map (Figure 6) clearly shows that the majority of the study area 77.40km2 (36.34%) fall within very low hazard (VLH) zone and 72.85km2 (34.2%) of the area fall within low hazard (LH) zone. Perusal of results further showed that 14.12 km2 (6.63%), 32.72 km2 (15.36%) and 15.9 km2 (7.74%) of the area falls into very high hazard (VHH), high hazard (HH) and moderate hazard (MH), respectively.
5.4 Landslide Hazard Zonation Model Validation
In order to check the validity of LHZ map, an overlay analysis was performed between the LHZ map and the past landslide inventory map. The results revealed that 3404 pixels (58.97%) falls in the very high hazard (VHH) zone, 1924 pixels (33.33%) in the high hazard (HH) zone, 296 pixels (5.12%) in the moderate hazard (MH) zone and 149 pixels (2.58%) in the low hazard (LH) zone (Table 3, Figure 6). This shows that 92.3% of the past landslides fall in the very high hazard (VHH) and high hazard (VHH) zones of the prepared LHZ map. Thus, it can be concluded that the hazard zones delineated in the present study has reasonably validated with the past landslide data and the potential zone depicted can safely be applied for the safe planning of the area.
5.5 Slope Instability Assessment
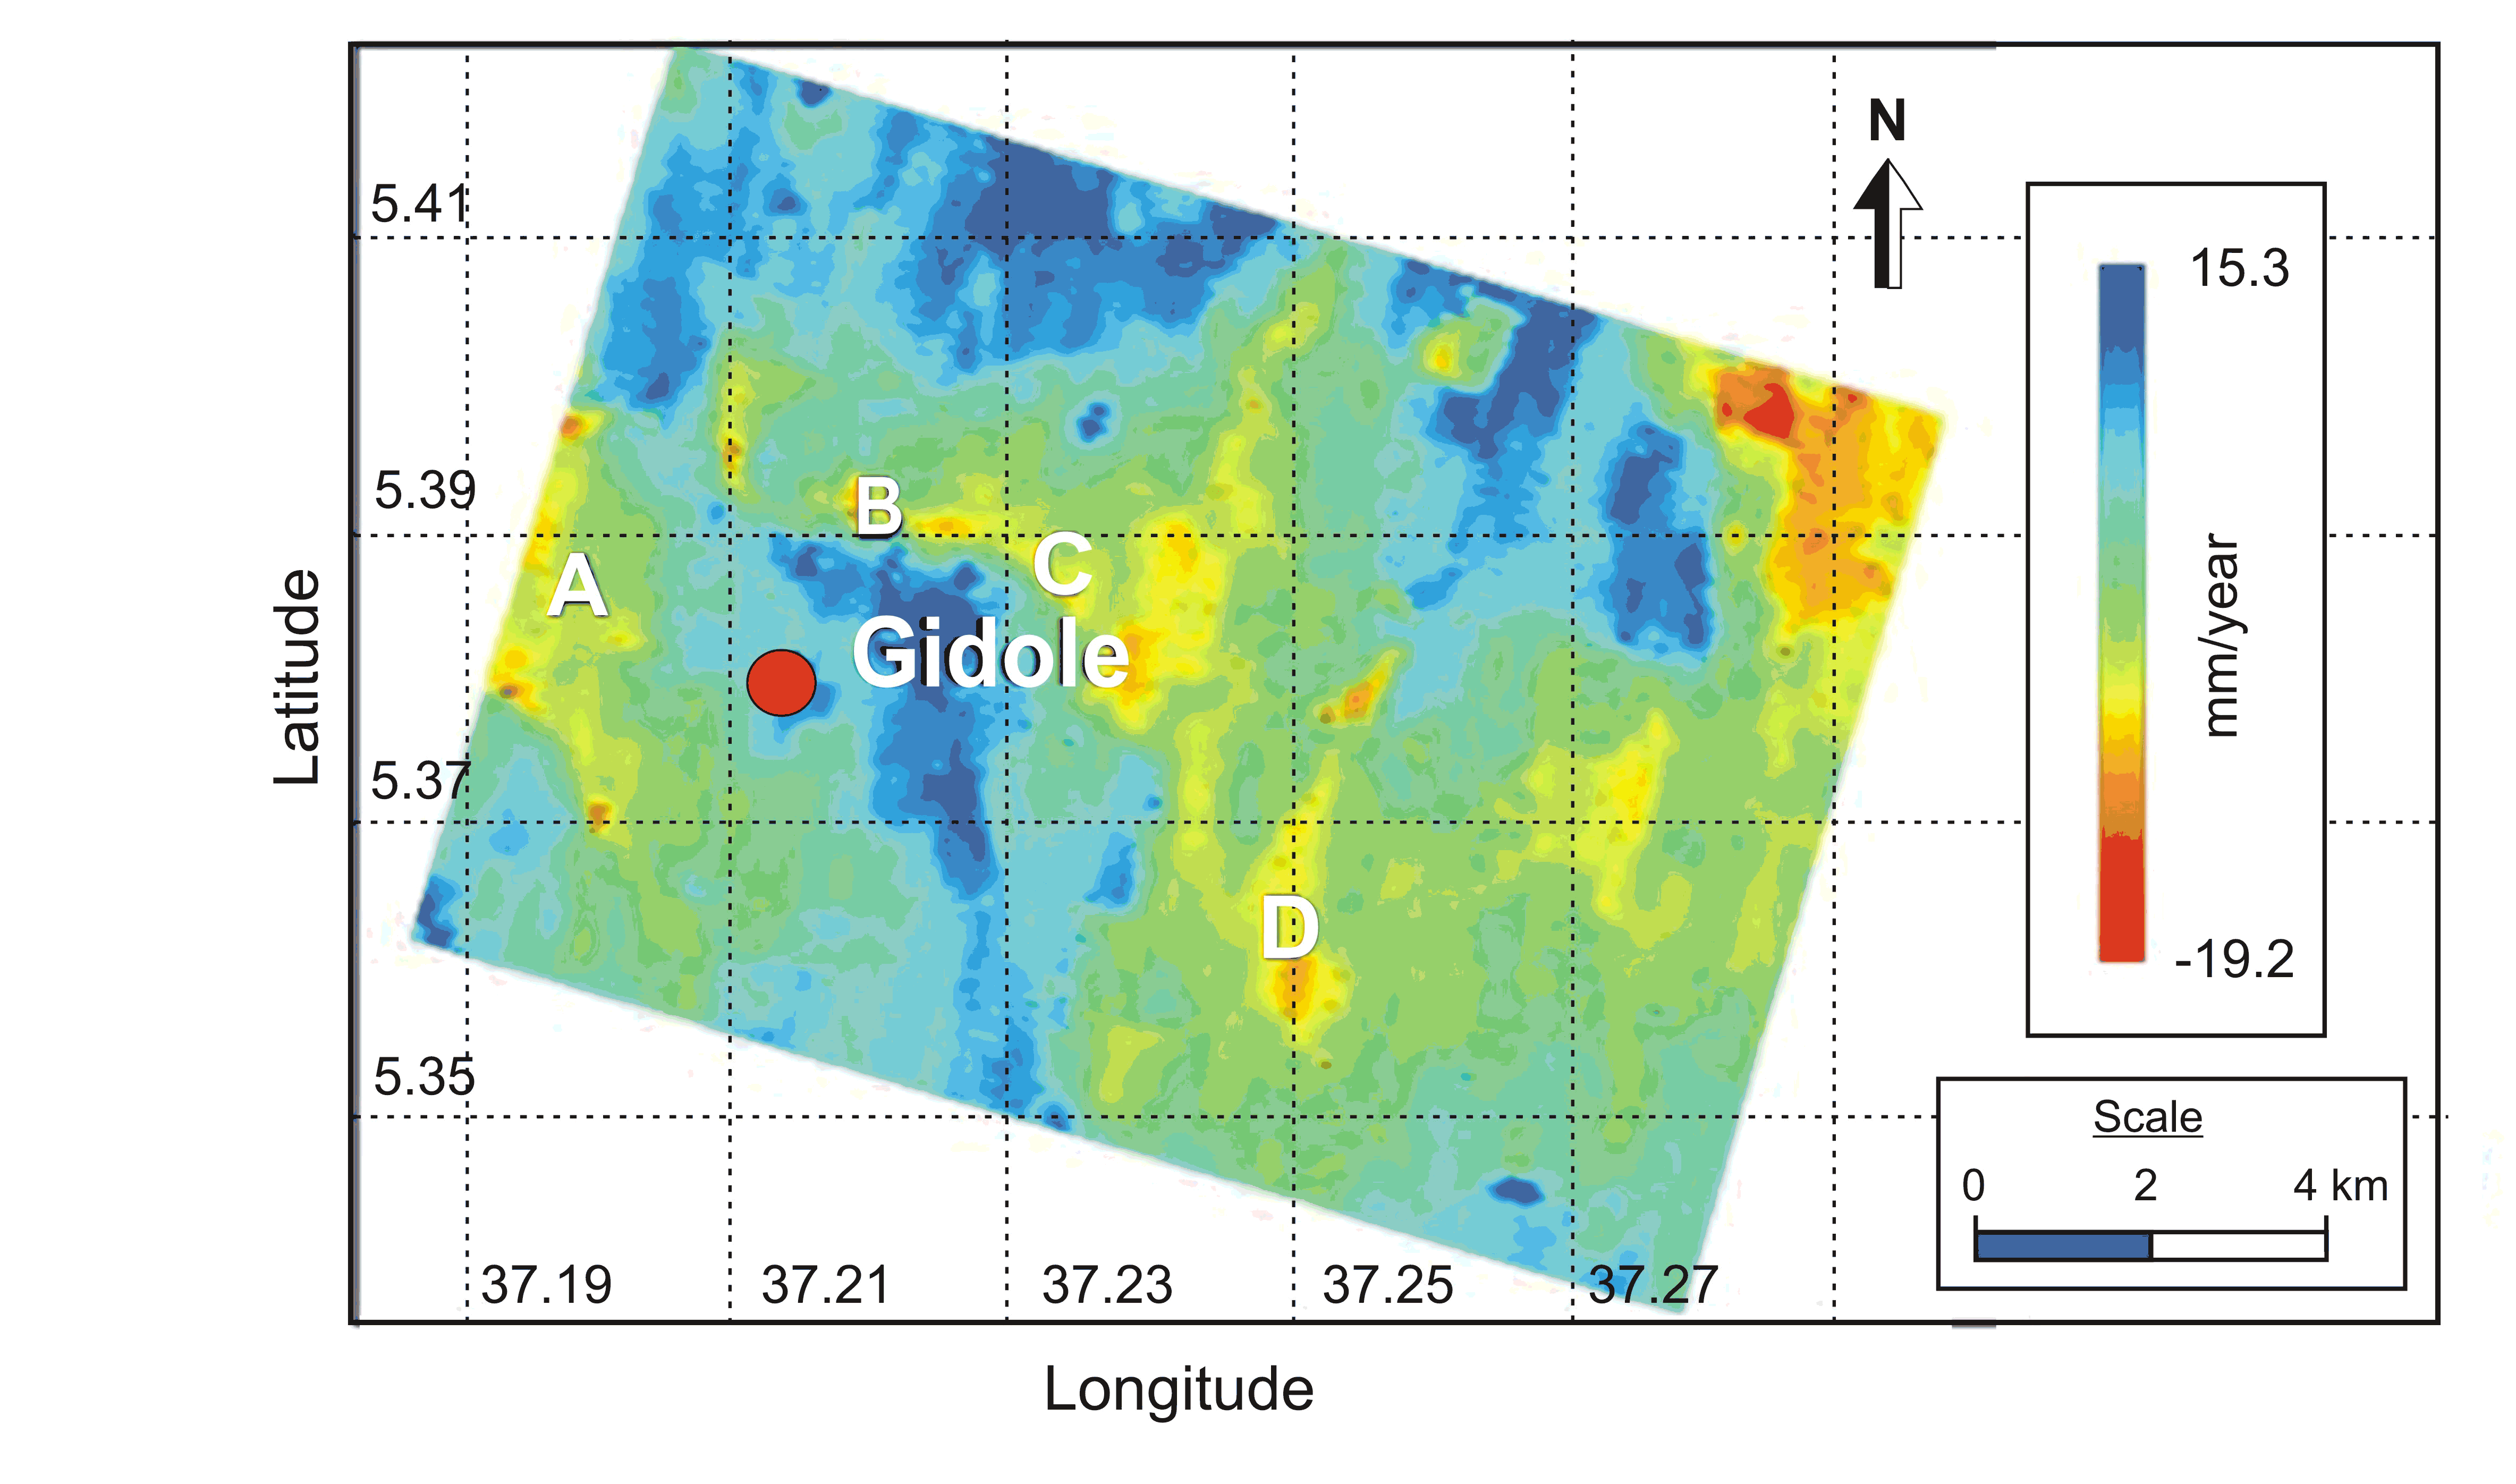
PS-InSAR processing by using six single master interfrograms has showed a total of 165,263 PS candidates that are based on the Dispersion Amplitude Index value. The displacement as observed in the study area has gradually increased starting from 15.3 mm/yr to -19.2 mm/yr shown in (Figure 7). The displacement phase, as derived from the interfrograms is a measure of surface displacement with respect to the satellite’s Line of Sight (LOS). The results are represented in terms of a vertical displacement that is basically a projection of a LOS displacement with respect to the vertical axis. Negative displacement indicates that the land surface is moving away from the LOS of a satellite whereas the positive sign indicate that the area is moving toward the LOS of a satellite.
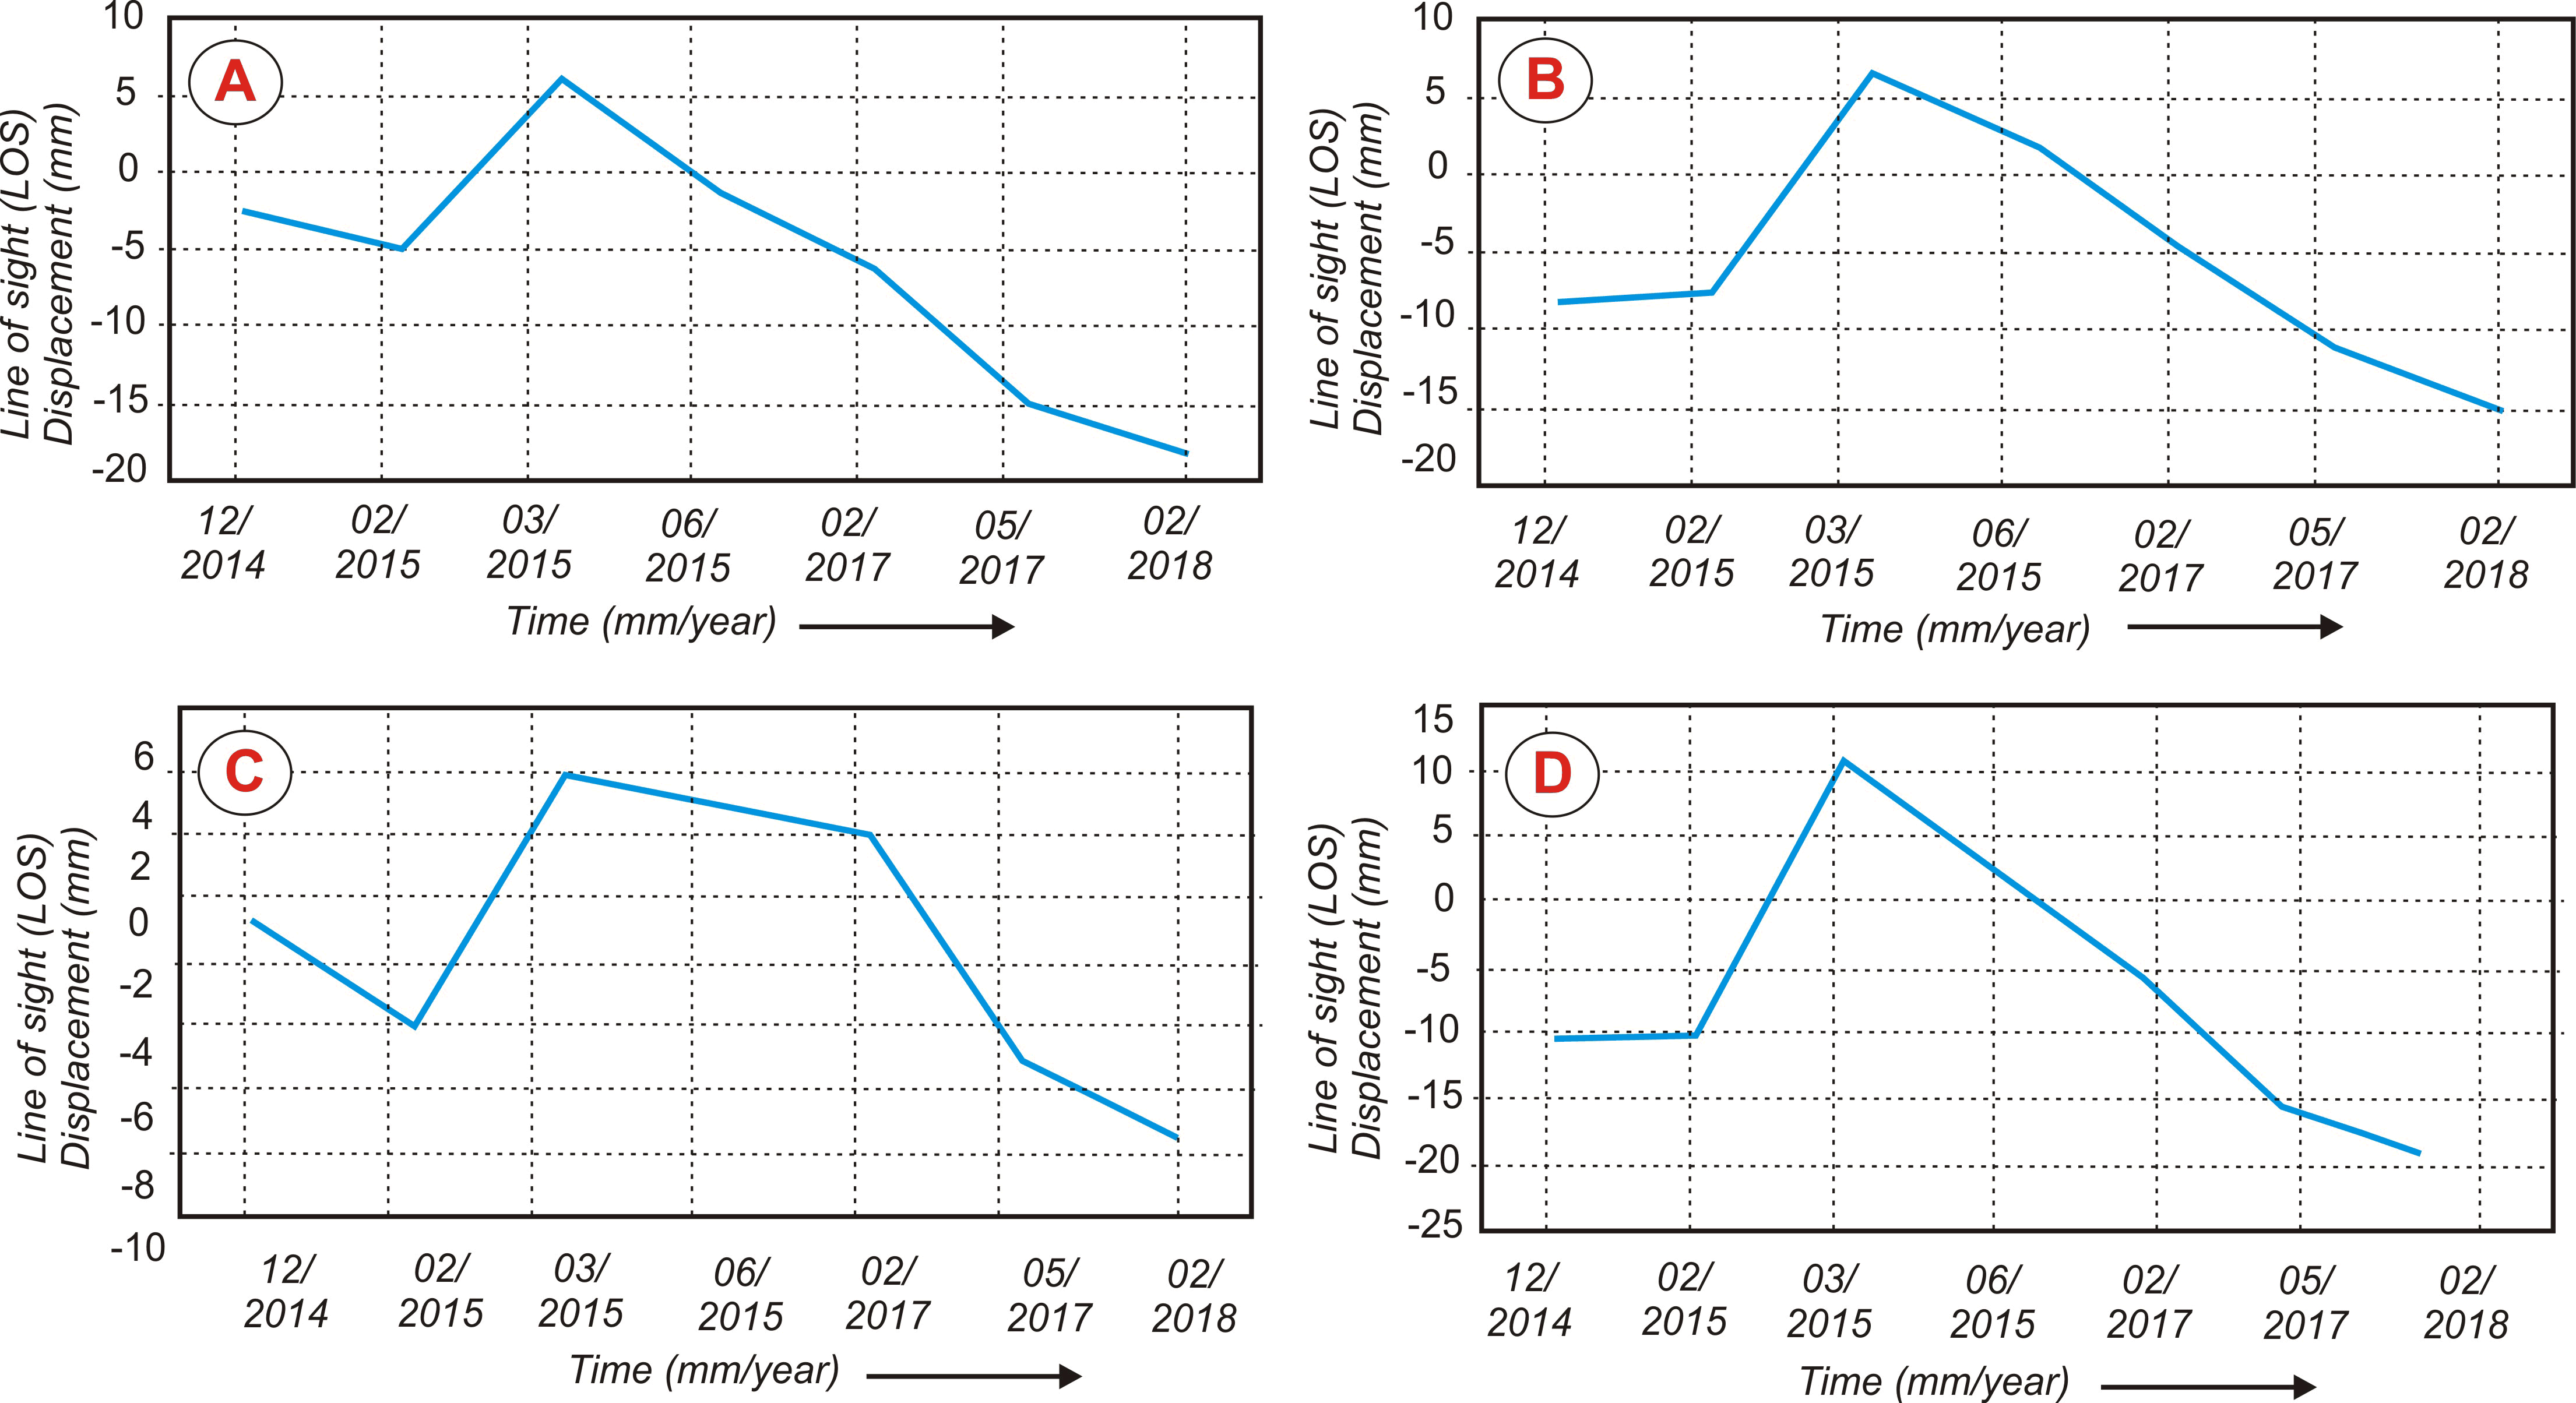
To better illustrate the time evolution of a surface displacement, four points were selected on the landslide inventory map and later their respective time series were plotted (Figure 7). These points were located in the Western, Southern and the Central parts of the study area. The line-of-site displacement of selected PS points (A, B, C, D) during the years 2014−2018 is shown in (Figure 8). The line-of-sight displacement time series in general, indicates the downward movement and the magnitude of this movement ranges from 15.3 mm/yr to −19.2 mm/yr (2014-2018). Later, dynamics of the observed movement was further differentiated with respect to the area being affected by the landslides.
The result of LOS displacement over the time period, 2014-2018 has indicated that the area covered by the landslides in the study area has increased considerably. Further, the time series plot for four selected points (A, B, C and D) (Figure 8) shows a typical trend in LOS displacement. The line-of-sight displacement at all four points showed change in direction of movement to positive trend starting from February 13, 2015 to March 09, 2015. The uplift rate is about 8-19 mm/yrs at all selected persistence scattered points. This change in the direction of movement may possibly be related to the increase in the ground water table. However, from mid of March, 2015 the line-of-sight displacement showed negative trend and the rate of displacement has increased considerably. Further, attempt was made to correlate the line-of-sight displacement with the average monthly precipitation of the area. The results clearly showed that the observed signals do correlate with the average monthly precipitation. The rate of displacement in general increases with increase in the average monthly precipitation at all the selected persistence scattered points.
6 . DISCUSSION
Landslides, in general are considered to be the most widespread and damaging events. Landslides result in loss of life and property, damage to natural resources such as vegetation, land, soil and they in general, hamper the development and performance of projects such as; bridges, roads and communication lines (Chimidi et al., 2017; Hamza and Raghuvanshi, 2017; Raghuvanshi et al., 2015). The inventory data collected during the present study has showed that majority of the landslides in the study area has occurred in basalts, followed by basal sandstone, colluvial and pyroclastic deposits. Most of these landslides occurred along the Arbaminch-Gidole-Konso road in the central part of the study area. The unplanned slope cutting along the road side has possibly triggered the landslides and also some of the old landslides were reactivated. Further, the information value showed that colluvial deposits, basal sandstone and pyroclastic deposits are susceptible for landslides.
The slope angle is considered as an important factor in inducing instability to the slope (Haeri and Samiei, 1996; Raghuvanshi et al., 2015). It was found that about 87% of the past landslides in the study area have occurred in the slope classes 5-12º and 12-30º. Also, the information values (IV) showed that slope classes 12-30º and 30-45º are more susceptible for instability.The possible reason for the dominance of the past landslides in 5-12º and 12-30º slope classes is related to the poor characteristics of the slope material within these slope classes. The slope materials, which predominantly occupy these slope classes, are weathered basalt, colluvial and pyroclastic deposit. Such slope materials are highly disintegrated and have poor shear strength, high porosity and are relatively more permeable (Raghuvanshi et al., 2015). Thus, slopes which are formed by weakly consolidated masses are more susceptible for instability (Shadfar et al., 2005).
Majority of the landslides in the study area have occurred in the slopes that are oriented towards south-west, South and Southeast directions. Further, based on the IV it is found that slopes that are oriented towards Southwest, South, North and Northeast are susceptible for instability. This may be possibly related to the hydro-geological factor and the presence of disintegrated slope material. Further, it is a known fact that the aspect of the slopes control microclimatic factors such as dry and wet conditions prevailed on the slopes, rainfall intensity and the general exposure of the slope to the sun shine. These factors may ultimately affect the properties of the slope material (Cevik and Topal, 2003).
Elevation has an important influence on the occurrence of the landslide (Ahmed 2009; Girma et al., 2015; Raghuvanshi et al., 2015). In the present study area landslides are more dominant in the elevation class 1815-2150m. Apart from influence of other causative factors, one major reason for dominance of landslides in this elevation range is related to the fact that much of the slopes in this elevation class are occupied by agricultural land. Results of the present study also showed that highest numbers of past landslides in the area were recorded within agricultural land. Based on the IV, it can be noticed that elevation classes 1815-2150 m and 1529-1815 m shows higher probability for landslide occurrence. The agricultural lands in the study area are generally located on the gentle slopes and are mostly occupied by the colluvial material. Poor irrigation and frequent plowing practices makes such colluvial material loose and saturated, which reduces the shear strength considerably (Raghuvanshi et al., 2015). Thus, such material becomes more prone for instability. The relation of NDVI with past landslides does not show any significant dominance of any particular NDVI class. In general, past landslides are more or less distributed in all NDVI classes, except NDVI class 0.51-0.77 where relatively fewer landslides were observed.
A perusal of LHZ map (Figure 6) clearly shows that about 14.12km2 (6.63%) of the area falls into very high hazard (VHH) and 32.72km2 (15.36%) of the area falls into high hazard (HH) zone. The VHH and HH zones are mainly dominated in the Central, Central Western, Southwestern and Northwestern parts of the study area. The VHH and HH zones are mainly occupied by the elevation class 1815-2150m, slopes that are inclined between 5 to 30º and slopes that are oriented towards South, Southeast and Southwest directions. Further, 15.9km2 (7.74%) of the area, falls into moderate hazard (MH) zone. The MH zones are scattered in the Central, Central Western, Southwestern and Northwestern parts of the study area. This zone is occupied mainly by 1529 - 1815m elevation class. The slopes which demonstrate MH zones are inclined at gentle and moderately steep slope angles and in general are oriented towards the South and Southwest directions. The MH zone mainly comprises of disintegrated weathered basalt, sandstone, pyroclastic materials and colluviums deposits. Further, majority of the study area 77.40km2 (36.34%) fall within very low hazard (VLH) zone and 72.85km2 (34.2%) of the area fall within low hazard (LH) zone. These zones are dominated in Northern, Eastern, Southern and the Southeastern parts of the study area. The VLH and LH zones are found in slopes that are mainly occupied by alluvium sand and clay, disintegrated basalts and sandstones. The slopes within these zones are gentle which fall within an elevation range of 1104-1529 m and are mostly covered by agricultural land.
In this study, PS-InSAR was applied to Sentinel 1A SLC data to assess the surface instability in the study area. The result in general indicates instability of the study area. The line-of-sight displacement time series indicates the downward movement and the magnitude of this movement ranges from 15.3 mm/yr to -19.2 mm/yr (2014-2018). The area is sparsely populated, thus, the landslides do not pose major threat to human life and animals. However, Kubaya and Wolayite villages are partly surrounded by potentially dangerous landslides, which can affect the infrastructure, agricultural land and may cause primarily material damage. The current instability of Gidole landslide might have resulted from a combined effect of unstable slope material, steep slope excavation during road construction, high precipitation rate and relatively high relative relief.


 ,
K. V. Suryabhagavan 1
,
K. V. Suryabhagavan 1
 ,
Tarun Kumar Raghuvanshi 1
,
Tarun Kumar Raghuvanshi 1