COVID-19 is an increasingly pandemic disease which haunts social life on a daily basis.
GIS can support the fight against infectious diseases caused by outbreaks and epidemics of COVID-19.
Distribution patterns of disease transmission are illustrated by the GIS tool and predict future confirmed cases.
Distribution and trend analysis shows support for decision-making in the transmission and prevention of epidemics.
This analysis may provide valuable information to support the government's monitoring and forecasting of the spread of the virus across small and large areas.
Spatial analysis may be used to identify threats to disease, patterns of time and space epidemics and hotspot infections.
Abstract
COVID-19 Coronavirus is now one of the most contagious diseases of the recently discovered and spread across the China in 2019 and has received global attention. In most COVID-19-infected individuals, respiratory symptoms should be mild to moderate and improve without the need for medical care. The risk of serious disease is higher for senior citizens and people with serious health problems, such as heart disease, diabetes, severe respiratory disease, and cancer. The World Health Organization (WHO) has formally declared the outbreak of COVID-19 to be a global pandemic. As on 11th April 2020 in India the largest number of persons testing positive for COVID-19 since the outbreak earlier month with samples of people, mostly contacts of already confirmed patients, rendering positive. In India total confirmed cases 7364, 633 are cured/discharged, with 240 deaths had been reported by the Ministry of Health and Family Welfare Government of India. The aim of the research is to analyze the spatial distribution of COVID-19 and its trends with the help of GIS software. At this time, there are no precise antibiotics or treatment options for COVID-19. Besides, several ongoing clinical studies are assessing effective treatments. The best way to protect and sluggish transmission should be well advised about the current COVID-19 virus, the disease it triggers and also how it continues to spread. Therefore, monitoring active ties using GIS spatial analysis is very important to control such as a COVID-19 virus spreading problem.
Keywords
Spatial Distribution , India , GIS , COVID-19 , Coronavirus
1 . INTRODUCTION
A group of pneumonia cases, triggered by recently discovered β-coronavirus, happened in Wuhan, China, in December 2019. This coronavirus was at first called the 2019 novel coronavirus (2019-nCoV) by WHO on 12 January 2020. WHO officially referred to as coronavirus disease 2019 (COVID-19) and Coronavirus Study Group (CSG) of the International Committee suggested that the current coronavirus be named SARS-CoV-2, both issued on 11 February 2020. The Chinese researchers quickly isolated SARS-CoV-2 from the patient within such a short timeframe on 7 January 2020 and issued the SARS-CoV-2 genome sequence (Lu et al., 2020). Since 1 March 2020, a total of 79,968 cases of COVID-19 have been reported in China, including 2873 deaths (WHO, 2020). The results of the study stated that the basic replication number (R0) of SARS-CoV-2 was approximately 2.2 (Riou et al., 2020) or more (range from 1.4 to 6.5) (Liu et al., 2020) and that the pneumonia clusters (Chan et al., 2020) add to the scientific evidence of a continuous increase in human-to-human transmission of the COVID-19 epidemic.
SARS-CoV-2 is a β-coronavirus enclosed with an un-segmented positive-sensing RNA virus (subgenus arbecovirus, orthocoronavirinae subfamily) (Zhu et al., 2020). Coronaviruses (CoVs) were separated into four genera, with α-/β-/γ-/δ-CoVs. α- and β-CoV are capable of infecting animals, whereas γ- and δ-CoV appear to infect animals. Earlier, six CoVs were indeed well-known as living organism-sensitive viruses, including α-CoVs HCoV-229E, HCoV-OC43, HCoV-NL63, and β-CoVs HCoV-HKU1 and with minimal pathogenicity, triggering mild breathing problems analogous to common colds. The other two recognized β-CoVs, SARS-CoV and MERS-CoV, resulted in serious and possibly fatal respiratory infections (Yin and Wunderink, 2018). It has been discovered that the SARS-CoV-2 gene sequence tends to be 96.2% similar to the CoV RaTG13 bat, even though it shares the SARS-CoV, 79.5% identity. Based on the results of virus genetic sequences and genetic analysis, bats are suspected to be a normal host of virus provenance, and SARS-CoV-2 could be transferred from bats to human beings through unidentified intermediate contestants. It is now clear that SARS-CoV-2 might use angiotensin-converting enzyme 2 (ACE2), a receptor called SARS-CoV (Zhou et al., 2020), to spread the disease.
The first outbreak of unidentified acute respiratory infections occurred in Wuhan, China, on 12 December 2019, possibly linked to the seafood market. Numerous research has proposed that the bat might be a potential pool of SARS-CoV-2 (Giovanetti et al., 2020; Paraskevis et al., 2020). Moreover, there is no current evidence that the source of SARS-CoV-2 originated in the seafood market. Somehow, bats are natural pollutants of a wide range of CoVs, such as SARS-CoV-like and MERS-CoV-like viruses (Hampton, 2005; Banerjee et al., 2019; Li et al., 2005). Not only on the genome of the virus, but COVID-19 has also been investigated throughout the genome of Bat CoV RaTG13 and reveals 96.2% of the aggregate genome sequence identity (Zhou et al., 2020), proposing that CoV bat and human SARS-CoV-2 may discuss a certain ancestor, even though bats were not commercially available in the above seafood market (Wu et al., 2020). In addition, the orientation of carbohydrate sequences and phylogenetic analysis (Liu et al., 2020) has also shown that closely related receptor residues have been identified in several species, offering additional possibilities for appropriate optimal hosts, such as pangolins and snack foods.
Human-to-human transmitter, SARS-CoV-2 emanates primarily around families, along with friends and relatives who have been in direct contact with patients. It should be noted (Guan et al., 2020) that 31.3% of patients have recently travelled to Wuhan and 72.3% of patients have been able to contact Wuhan among several non-Wuhan patients. Transmission around healthcare professionals was recorded in 3.8% of COVID-19 patients received by the National Health Commission of China on 14 February 2020. On the other hand, the transmission of SARS-CoV and MERS-CoV has been shown to arise primarily through nosocomial propagation. Health workers illnesses in 33-42% of SARS cases and distribution around patients (62-79%) have become the most prevalent pathway of disease in MERS-CoV cases (Chowell et al., 2015; Kang et al., 2017). Physical contact with optimal host animals or the use of animals has already been assumed to be the main route of propagation of SARS-CoV-2. Moreover, the sources and transmission routines of SARS-CoV-2 remain a mystery. Recent research on epidemiology, pathogenesis and clinical features of COVID-19 and ongoing treatment and scientific advances in the fight against the novel coronavirus epidemic (Guo et al. 2020), which has the potential to cause toxic encephalopathy.
Geographic Information Systems (GIS) and spatial mapping are emerging global health tools, but the degree to which they have been implemented in India for COVID-19 research is unclear. To inform researchers and program developers, this mapping review presents the scope and depth of the GIS and Spatial Analysis Studies conducted by COVID-19 in India. In particular, GIS and spatial analysis can be essential tools for knowledge, prevention, and treatment of diseases. For example, GIS technology can be used as a visualization help to map the geographical distribution of the disease, the potential risk factors and the resources available for treatment and prevention. In relation to the spatial analysis of certain information, it is possible to evaluate the risks of disease, trends in outbreaks over time and space, and hotspots of infection (Lyseen et al., 2014; Kandwal et al., 2009). Similar to each other, such methods may relate to the design, planning, and distribution of international health resources for treatment and prevention facilities and may help mitigate the impact of interference. The aim of this research is to analyze the spatial distribution of COVID-19 and its trend to predict the spread of diseases with the help of GIS software.
2 . DATA AND METHODS
This study reviewed peer-reviewed research papers prepared on COVID-19 in India and concerning GIS or spatial assessment. COVID-1 related issues, except for the incidence of COVID-19, COVID-19 specific cardiovascular disease, COVID-19 health conditions, and COVID-19 preventive facilities. Research papers expressly based in India or in other parts of the world have been included. Spatial analysis approaches and the use of GIS were ambiguously defined for the uses of this analysis in order to obtain a diversity of emerging activities, i.e. they included research papers using any specialized GIS software or explicitly implementing any spatial analysis techniques (Kawo and Shankar, 2018; Shankar and Kawo, 2019; Balamurugan et al., 2020). The data used in this study is the number of COVID-19 disease patients in state-wise in India from February to 11th April obtained from the health department of India. In the present research work, distribution pattern of disease transmission is illustrated with GIS tool and forecasts the number of patients each day the aid of Inverse Distance Weighted (IDW) and Kriging interpolation techniques.
Inverse Distance Weighted (IDW) is developed as one of the most widely known interpolation techniques. It is used to predict the values for any undetermined destination by calculating the predicted zone of the adjacent areas (Childs, 2004). It is mainly based on two inferences: first, the impact of the unknown value of a point is specifically extended to the point of close control rather than to the point of the range. Second, the extent of the impact is directly related to the inverse of the range between the points. The following equation used for the analysis (Bartier et al., 1996; Huang et al., 2011).
where, \(Z_p\) refers to the interpolated value of the unknown point, the weighting function which controls the significance of the control point \(Z_i\) and \(Z_i\) is the value observed at the control point i which represents the nearest neighborhood of the interpolated point produced and ranges from 20 to 30, n is the nearest vicinity of the control points which is usually required to consume time, dip refers to the interpolated point, \(p\) is a weighting absolute value that is an arbitrary positive real number, \(p\) is equal to 1 in inverse distance weighting (Guan and Wu, 2008).
3 . STUDY AREA
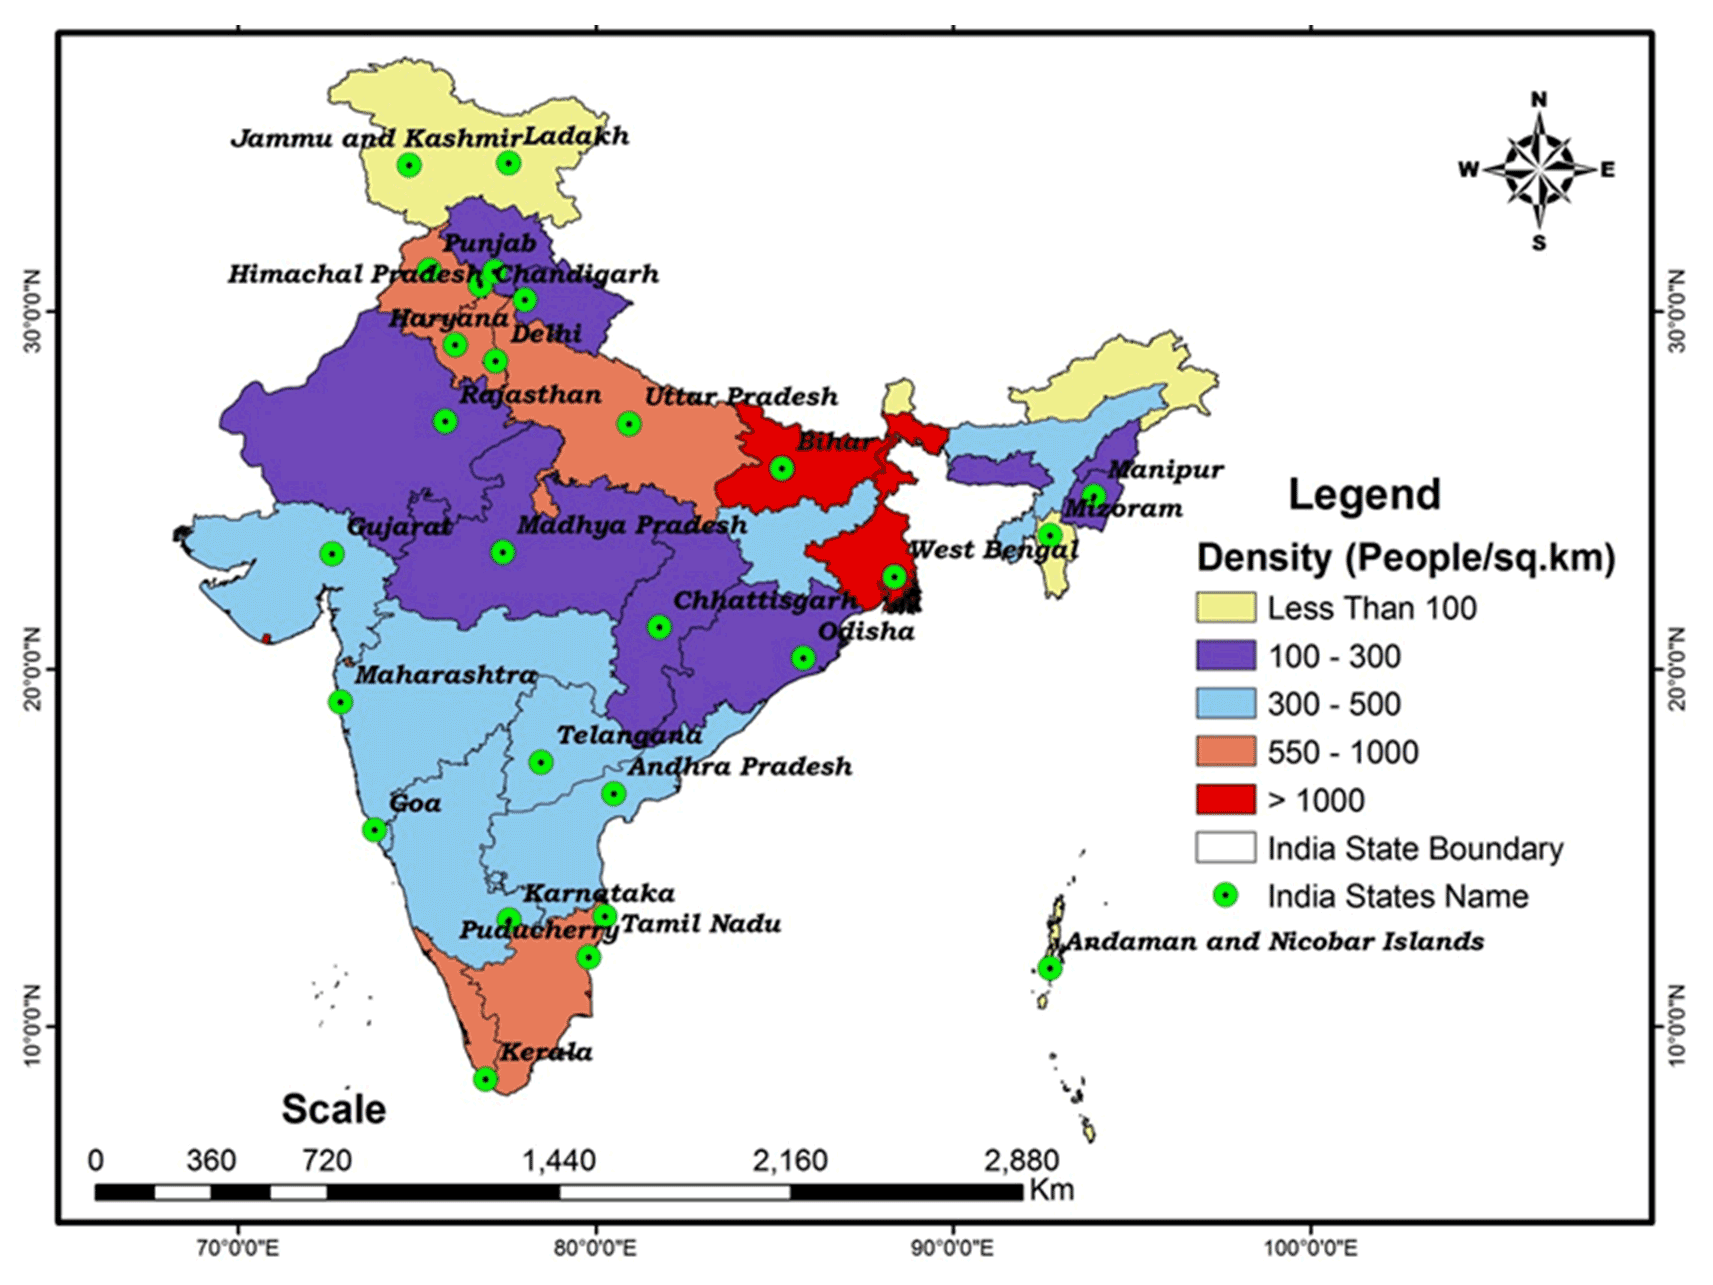
India is located in South Asia, bordered to the north by the highest mountain chain in the world, bordering the central and southern Bay of Bengal and the Arabian Sea, between Burma and Pakistan. Geographic coordinates are from 8°4' N to 37° 6' N latitude and 68° 7' E to 97° 25' E longitude, with a total area of 3287590 km2. The capital of India is New Delhi, and the major cities in the nation are Mumbai, Delhi, and Kolkata. India is the 7th largest country in the world. India’s population is one billion, making it the second-most densely populated nation after China (Figure 1 and Table 1). It is more than three times the population of the US, but only about a third of its area. The most populous state in India is Uttar Pradesh and the least populous state in India is Sikkim, with the population map shown in figure 1 and table 1. India is the biggest democratic country in the world. The country is mainly an agricultural nation, although it has a huge iron and steel industry and supplies all kinds of manufactured goods.
Figure 1. Distribution of population
Table 1. State-wise population (2011)
Sr. No
Name of state/UT
Population
Sr. No
Name of state/UT
Population
1
Jammu and Kashmir
12548926
19
Lakshadweep
64473
2
Andaman and Nicobar
380581
20
Madhya Pradesh
72597565
3
Andhra Pradesh
49386799
21
Maharashtra
112372972
4
Arunachal Pradesh
1382611
22
Manipur
2721756
5
Assam
31169272
23
Meghalaya
2964007
6
Bihar
103804637
24
Mizoram
1091014
7
Chandigarh
1055450
25
Nagaland
1980602
8
Chhattisgarh
25540196
26
Orissa
41947358
9
Dadra and Nagar Haveli
585764
27
Pondicherry
1247953
10
Daman and Diu
585764
28
Punjab
27704236
11
Delhi
16787941
29
Rajasthan
68621012
12
Goa
1457723
30
Sikkim
607688
13
Gujarat
60383628
31
Tamil Nadu
72138958
14
Haryana
25353081
32
Tripura
3671032
15
Himachal Pradesh
6864602
33
Uttar Pradesh
199812341
16
Jharkhand
32966238
34
Uttarakhand
10116752
17
Karnataka
61130704
35
West Bengal
91347736
18
Kerala
33387677
36
Telangana
35286757
4 . RESULTS AND DISCUSSIONS
4.1 Current Status
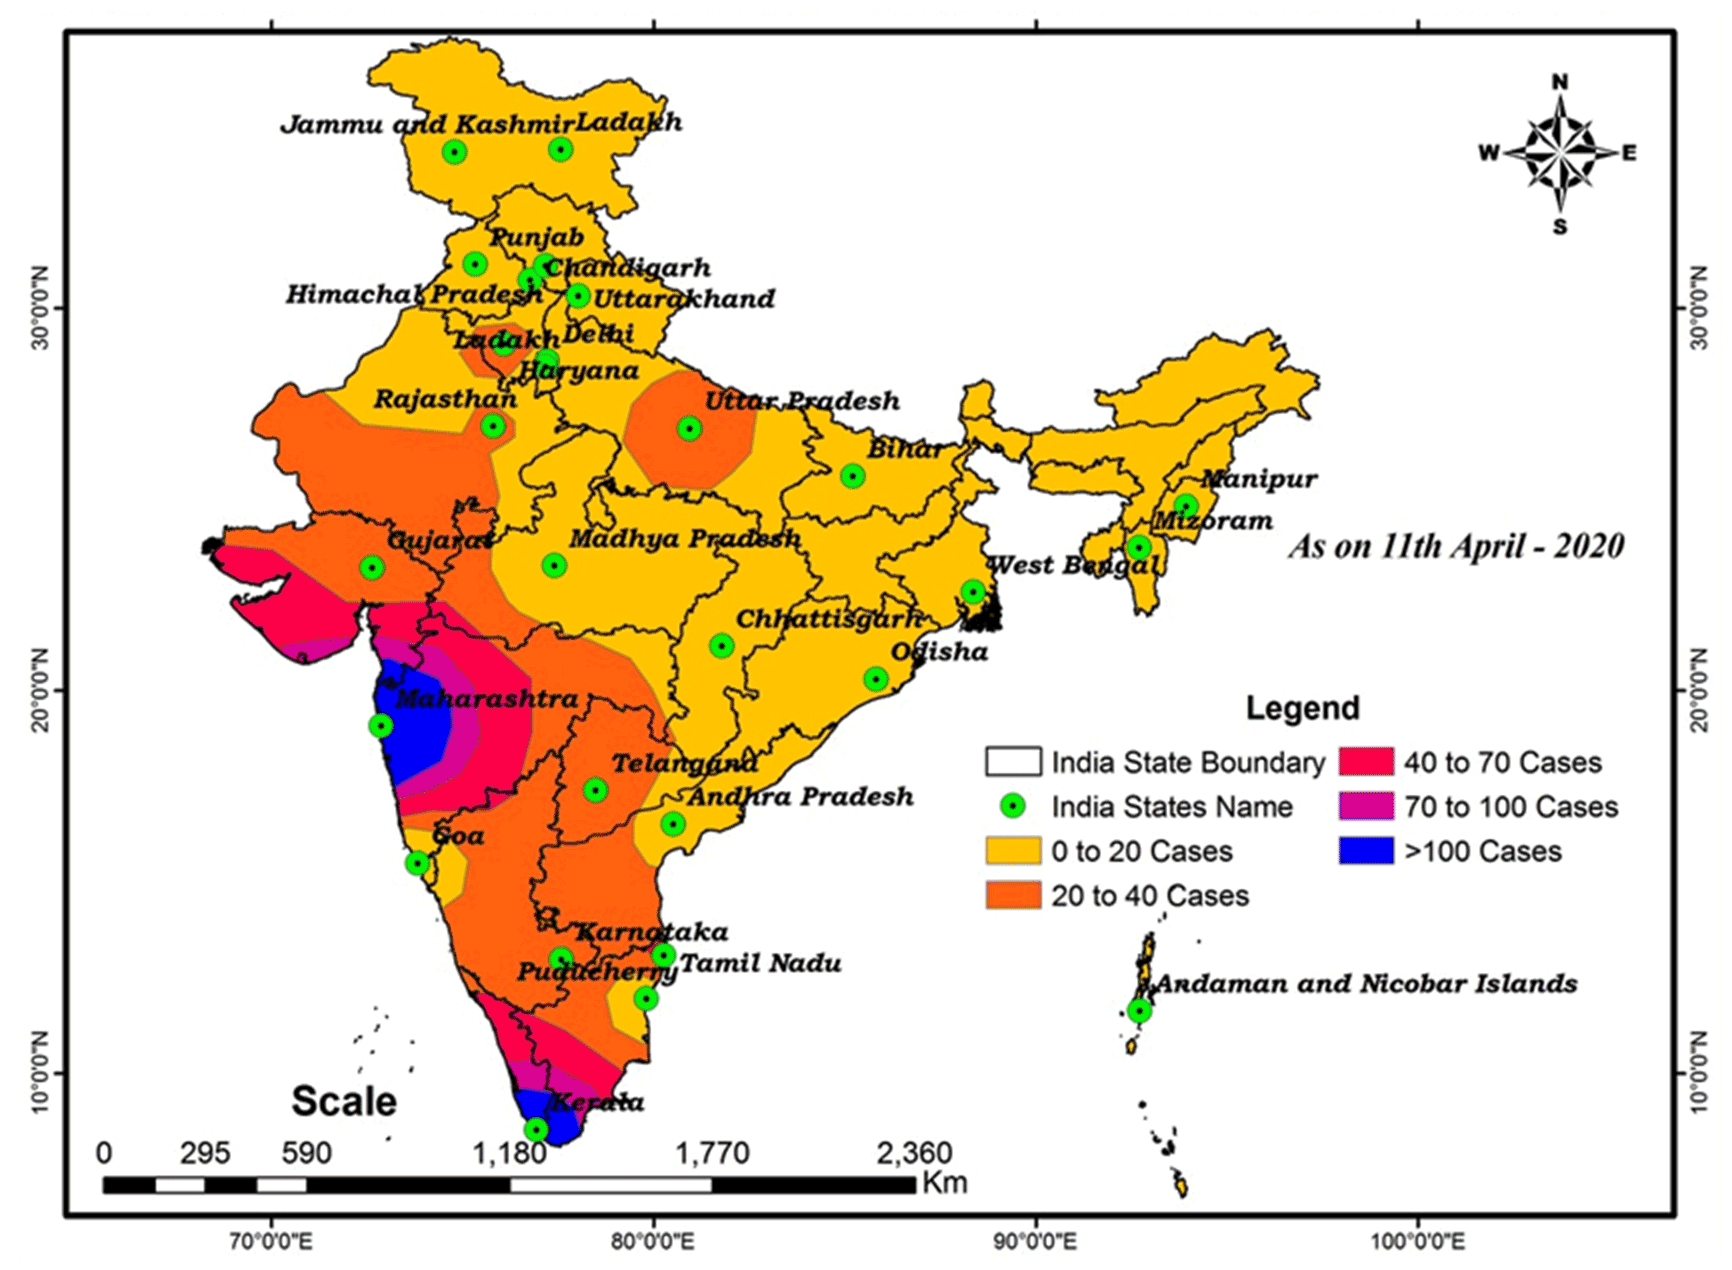
Novel Coronavirus or COVID-19 cases in India are well over 7364 as of 11th April 2020 (Table 2). The state-wise confirmed COVID-19 cases in India shown in this table. The first three cases reported by India in Kerala appear to be every student returning from Wuhan, China. The number of reported cases in the world increased during March, mostly due to people with travel records to the affected locations. The number of cases in the world as a whole has increased. On 10th March, the total number of cases increased to 50. The first survivor of the virus in Saudi Arabia was a 76-year-old man on 12th March, who crossed more than one hundred on 15th March, five hundred on 24th March, one thousand one hundred and seventeen on 30th March, and seven thousand three hundred and sixty four on 11th April (Table 2). The total number of recently confirmed cases augmented rapidly from March 30 to April 11, 2020. Maharashtra is followed by Delhi, Tamil Nadu with a maximum number of cases of coronavirus. As of 11th April the death and discharge (cured) given in Table 2. Maharashtra having 110, Madhya Pradesh 33, Gujarat 19, and Delhi 13 deaths and cured cases are 188 in Maharashtra, 123 cases in Kerala and 44 in Tamil Nadu.
Table 2. State-wise breakdown of total confirmed cases of COVID-19 in India
Sr. No
Name of state/UT
Confirmed cases
Cured/discharged
Death
1
Jammu and Kashmir
207
6
4
2
Andaman and Nicobar
11
0
0
3
Andhra Pradesh
363
7
6
4
Arunachal Pradesh
1
0
0
5
Assam
29
0
1
6
Bihar
60
0
1
7
Chandigarh
18
7
0
8
Chhattisgarh
18
9
0
9
Dadra and Nagar Haveli
0
0
0
10
Daman and Diu
0
0
0
11
Delhi
903
25
13
12
Goa
7
1
0
13
Gujarat
308
31
19
14
Haryana
117
29
3
15
Himachal Pradesh
28
6
1
16
Jharkhand
14
0
1
17
Karnataka
207
31
6
18
Kerala
364
123
2
19
Lakshadweep
0
0
0
20
Madhya Pradesh
435
0
33
21
Maharashtra
1574
188
110
22
Manipur
2
1
0
23
Meghalaya
0
0
0
24
Mizoram
1
0
0
25
Nagaland
0
0
0
26
Orissa
40
2
1
27
Pondicherry
5
1
1
28
Punjab
132
5
11
29
Rajasthan
553
21
3
30
Sikkim
0
0
0
31
Tamil Nadu
911
44
8
32
Tripura
1
0
0
33
Telangana
473
43
7
34
Uttar Pradesh
431
32
4
35
Uttarakhand
35
5
0
36
West Bengal
116
16
5
Total
7364
633
240
* Ministry of Health, India (11th April 2020).
4.2 Spatial Distribution COVID-19
In this work, interpolation using Inverse Distance Weighted (IDW) makes clear the conclusion that objects similar to each other are more similar than those further apart. IDW uses the calculated values (cases) of the prediction site to estimate the value for each undetermined site. The values determined nearest to the location of the forecast have a greater impact on the expected value than those further away. IDW assumes that each measured point imposes a time-decreasing local effect. Using values from nearby weighted locations, the IDW approach calculates the average value for unsampled locations. The weights were commensurate with the proximity of the points sampled to the non-sampled location and the IDW power coefficient could be specified.
4.3 Prediction of COVID-19 Disease Spread Pattern
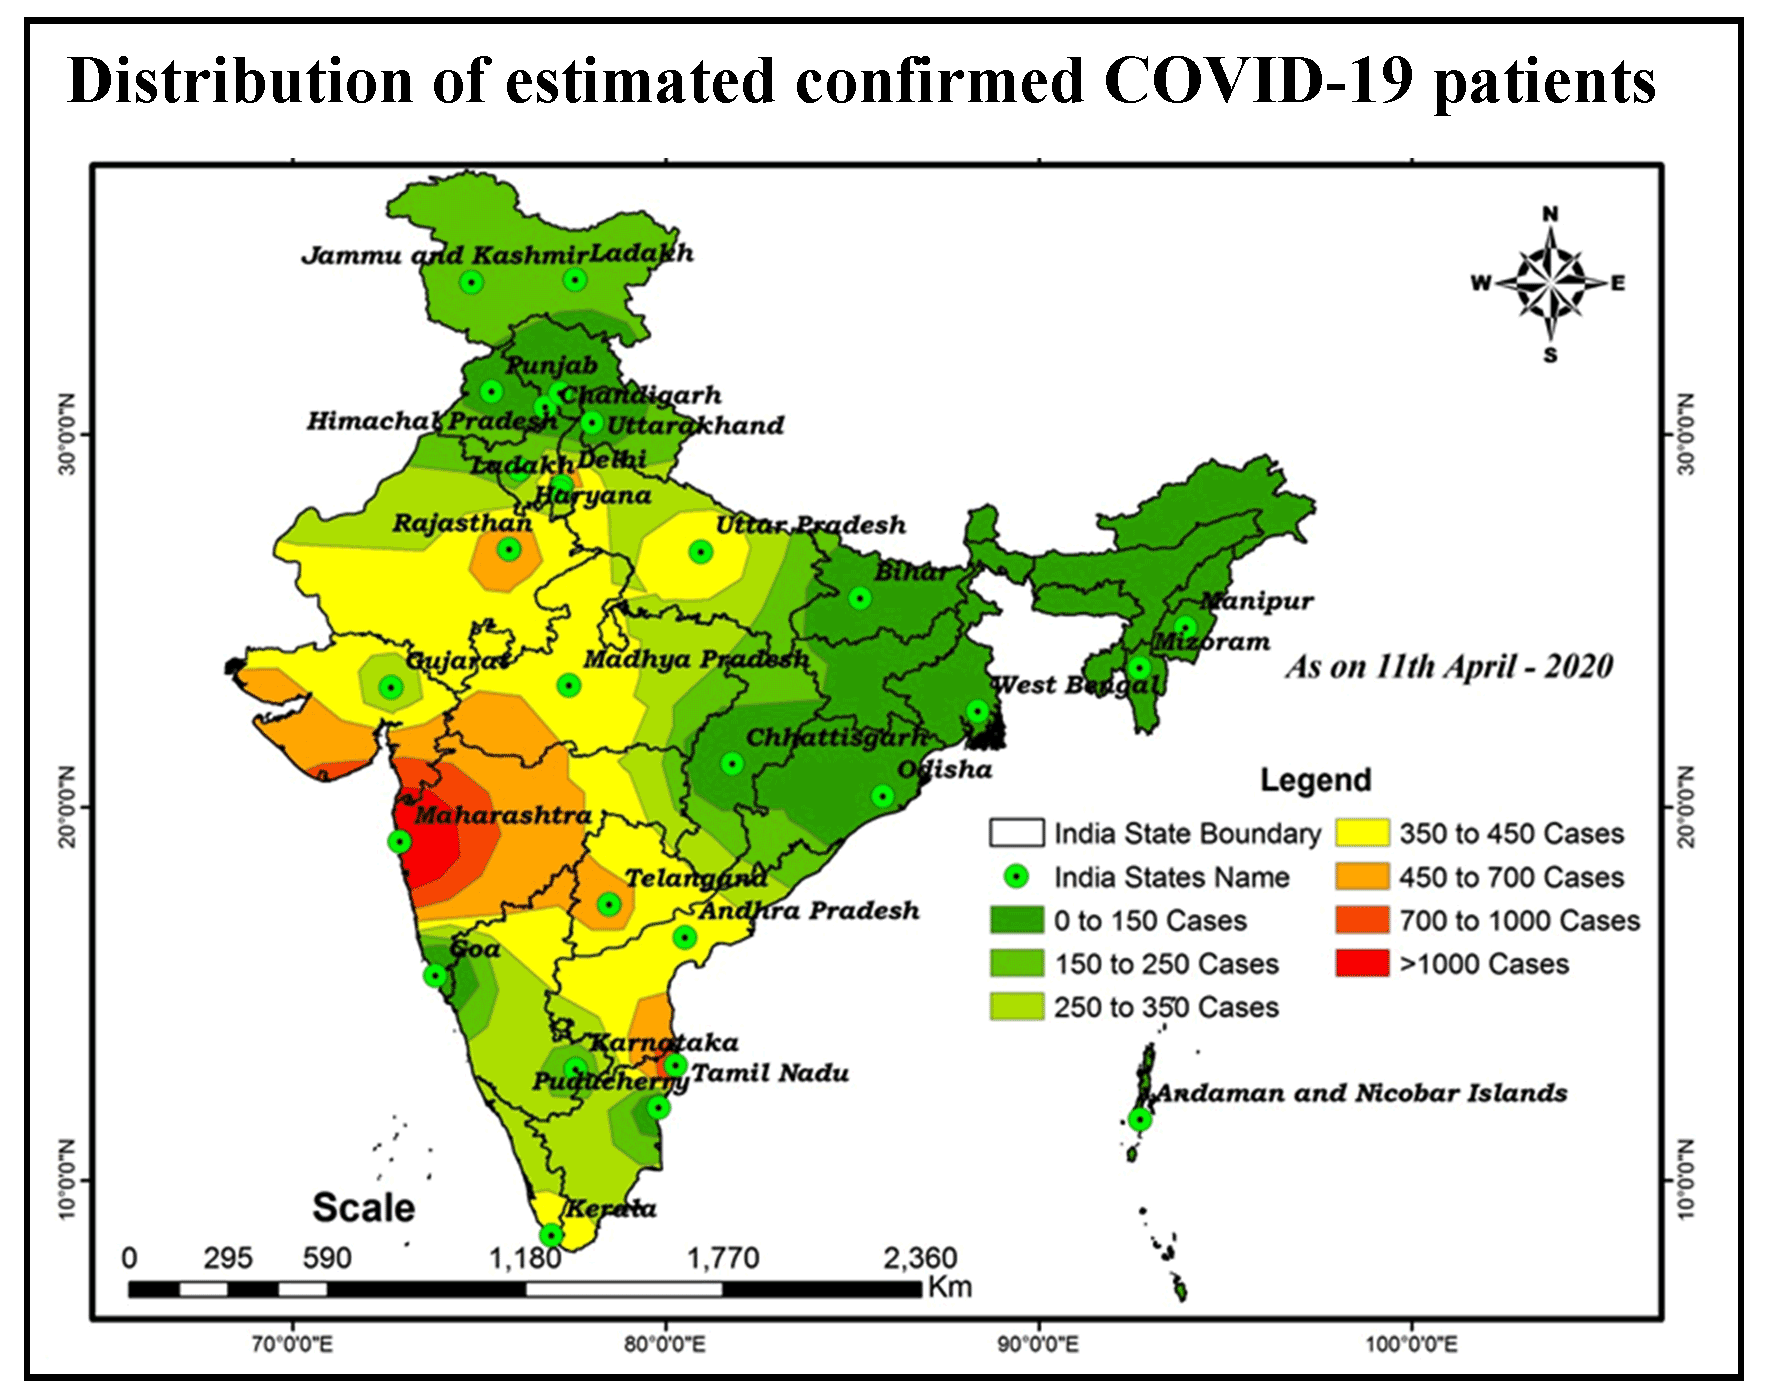
Interpolation using IDW has been obtained with the aim of predicting the spread of disease in India. This map shows the number of patients and the extended disease zone across the country. As per IDW, the pattern of COVID-19 diseases in the seven classes is 0 to 150, 151 to 250, 251 to 350, 351 to 450, 451 to 700, 701 to 1000 and > 1000 shown in Figure 2. These classes are at risk of exposing the spatial spread of the disease in relation to different states, based on population and environmental factors that may control the distribution of the patient. The highest number of patients returning on board, including families, friends, and relatives in close contact with incubation carriers, is reported daily as an observational analysis.
Figure 2. COVID-19: Distribution of estimated confirmed patients
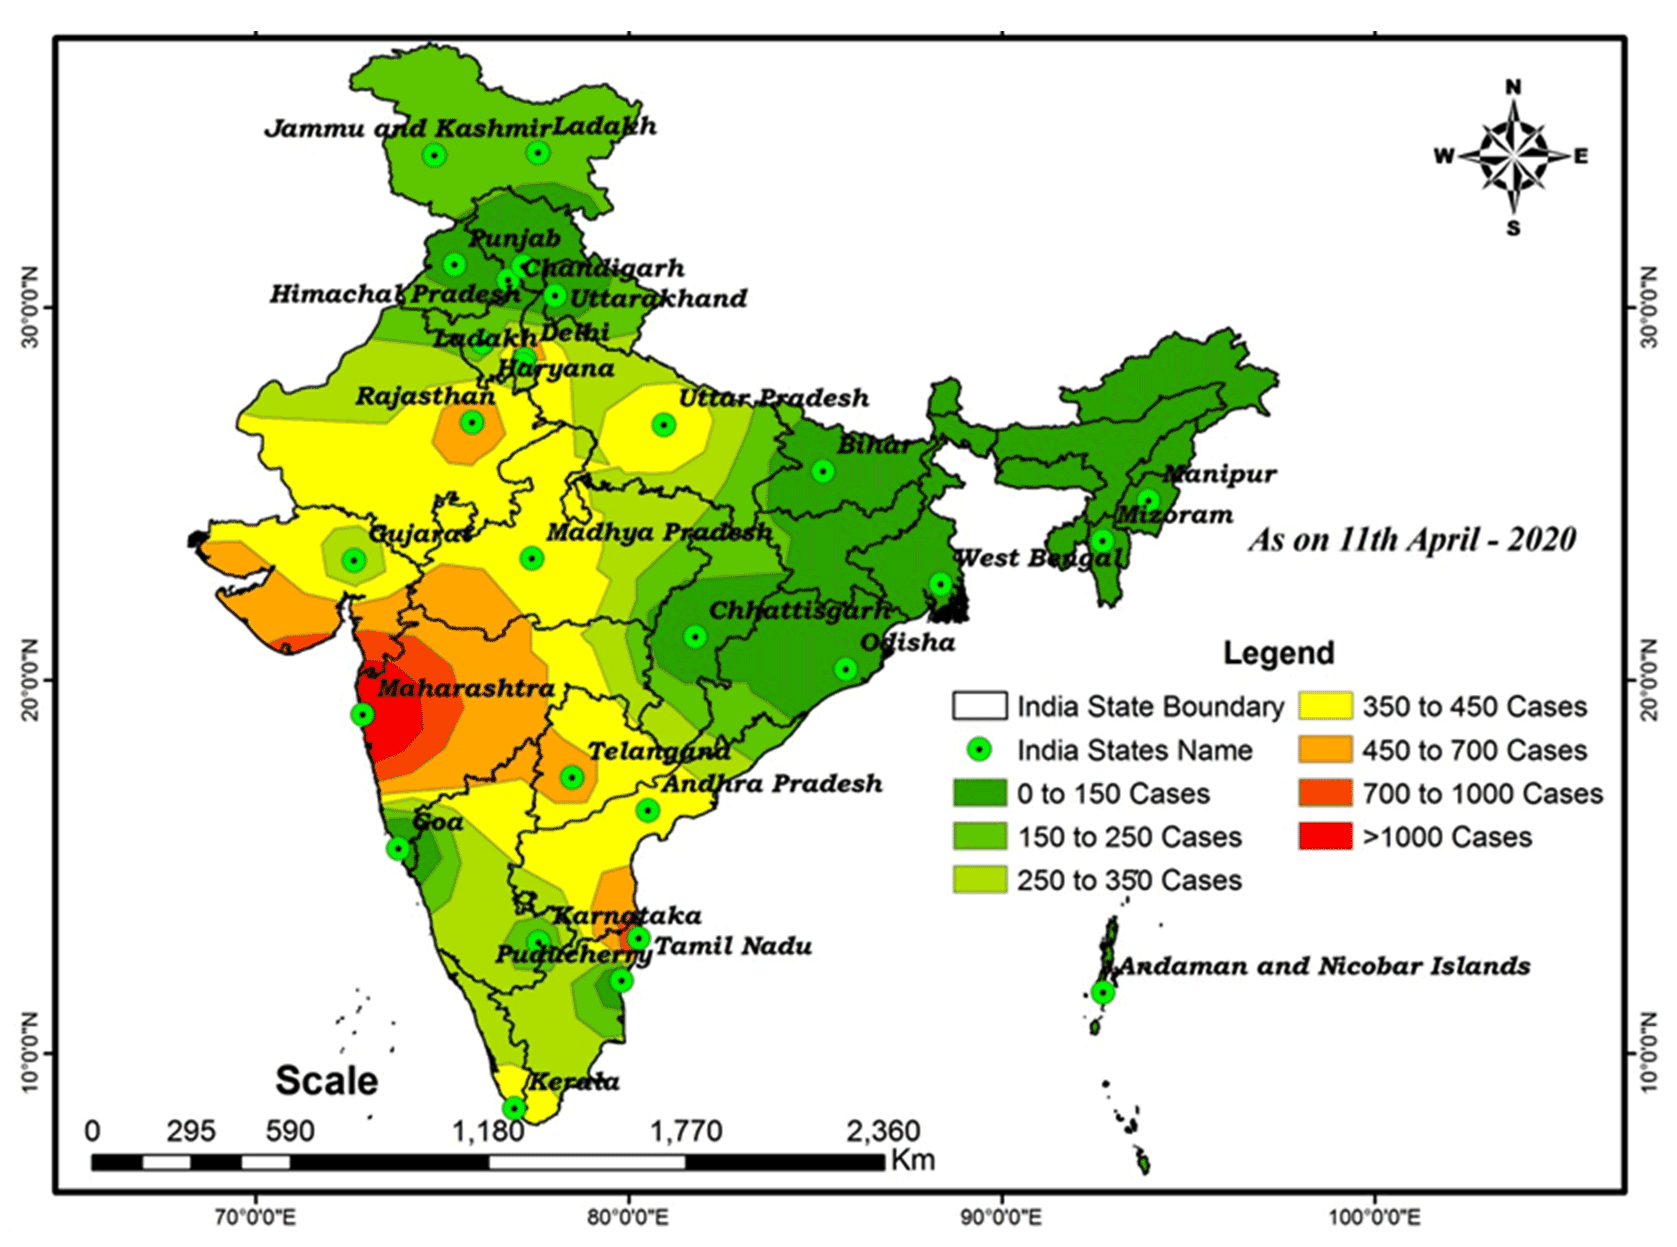
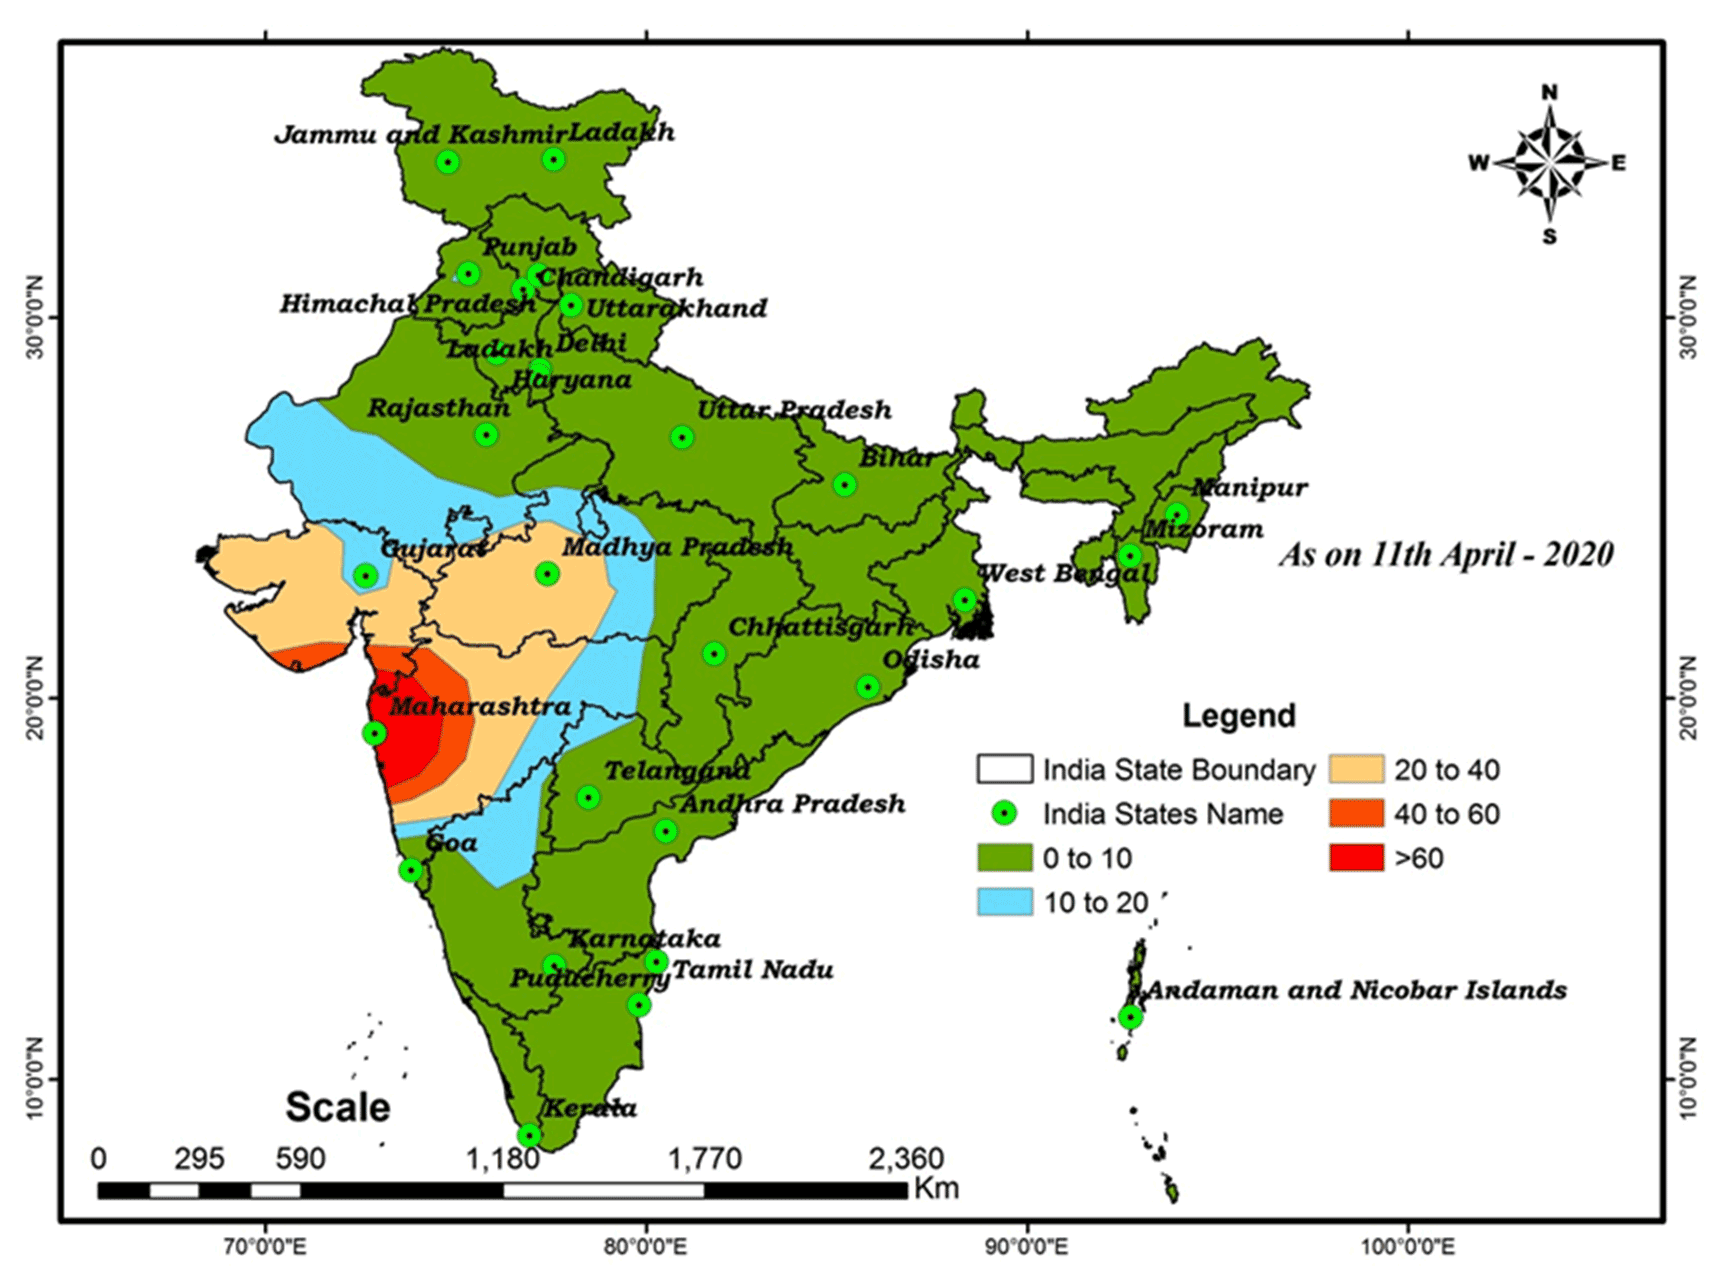
India could be the next global hotspot for infectious diseases of the COVID-19 virus. For this research COVID-19 prediction IDW map suggests that extreme cases will be conforming next two months >1000 cases in the following states are Maharashtra and Tamil Nadu. Maharashtra is the largest urbanization in the country, close to the Mumbai financial center and the stock market. The largest spread of infectious disease with COVID-19 cases has been increased daily. Where the observed increase in patients is concentrated primarily in these states, there is a need for more prevalence, with some major distributions ranging from 451 to 1000 being Delhi, Gujarat, Telangana, Uttar Pradesh (city) and Rajasthan (city). The moderate range of spread ratio is observed in the following states: Karnataka, Kerala, Andhra Pradesh, Madhya Pradesh, with a range of 251 to 450 might to be affected more cases in future. The lowest range 0 to 250 is observed in Odisha, Manipur, Haryana and Jammu & Kashmir, Bihar, Chhattisgarh, Chandigarh and Mizoram for patients in the center of the city. The death and cured prediction distribution of the COVID-19 map in India as shown in Figure 3 and 4, respectively. In cases of death, the area around Maharashtra is more extremely dangerous and the area around Madhya Pradesh and Gujarat is moderately risky and the rest of the states are less than 20. In cases of healing, the area around Maharashtra, Kerala, and South Tamil Nadu is more healing and the areas around Telangana, Karnataka, Uttar Pradesh, Ladakh, and Gujarat are moderately cured and the cases are less cured in the center of Tamil Nadu and the rest of the states. Some diseases move quickly between people. However, the exposure behavior of each disease differs from another depending on regional or space factors, environmental conditions, etc. No specific drugs for the prevention or treatment of coronavirus disease (COVID-19).
Figure 3. COVID-19: Distribution of estimated deaths
Figure 4. COVID-19: Distribution of estimated cured/discharged patients
This analysis may be provide valuable information to support government monitoring and predicting spread of virus across small and large areas. The WHO announced that the outbreak of Novel Coronavirus Disease (COVID-19) was a pandemic and reiterated its call for immediate action by governments to step up their response to diagnose, identify and mitigate spread to save lives. In this context, the Government of India will take all necessary precautions to ensure that we are well prepared to face the challenge and threat posed by the growing pandemic of COVID-19 Corona Virus.
5 . CONCLUSIONS
This study was conducted on diseases that have spread to the pattern of spatial distribution in India. GIS-based spatial techniques provided a perspective for simplifying and measuring the outbreak status of COVID-19 diseases in particular areas and provided a basis for future surveys of environmental factors responsible for the imminent threat of disease. Analysis of spatial distribution patterns may provide valuable information to support government monitoring and the predicting spread of the virus across small and large areas. As a result, a GIS-based spatial distribution using the IDW method was performed in this article to identify potential disease risk assessments in India. The IDW analysis of the spatial interpolation layers and the apparent weight of the conditioning factors were also prepared. Validation results revealed the strength and effectiveness of the proposed method for detecting and predicting the potential for disease risk assessment in India. The results of this study may be appropriate for the associated agencies to carry out a comprehensive assessment of the spread of the virus and environmental control in the study area. In addition, the method not only prohibits the predictive mapping of satisfactory zones for different parts of the country, but also permits the demonstration of the level of uncertainty in the forecast that could be directly applicable to other countries with associated distance and density characteristics.
Tables
Figures
Conflict of Interest
The authors declare that they have no conflict of interest.
Acknowledgements
The authors are grateful to the Ministry of Health and Family Welfare Government of India for supporting data in this research. We are grateful to the Editor-in-Chief and two anonymous reviewers for their meticulous comments and suggestions which helped us to improve the manuscript.
Abbreviations
2019-nCoV: Novel Coronavirus-2019; ACE2: Angiotensin-Converting Enzyme 2; COVID-19: Coronavirus Disease-2019; CSG: Coronavirus Study Group; GIS: Geographic Information System; HCoV: Human Coronavirus; IDW: Inverse Distance Weighting; MERS-CoV: Middle East Respiratory Syndrome Coronavirus; SARS-CoV-2: Severe Acute Respiratory Syndrome Coronavirus-2; UT: Union Territory; WHO: World Health Organization.


 ,
SHANKAR KARUPPANNAN 2
,
SHANKAR KARUPPANNAN 2
 ,
Alemayehu Tenaw Mengistie 3
,
Alemayehu Tenaw Mengistie 3