A GIS-based site suitability analysis using the AHP model is useful for policymakers to make proper planning.
Five criterions: land use, population, water-, drainage- and road network were used for the analysis.
Score values were assigned based on expert opinions and previous studies.
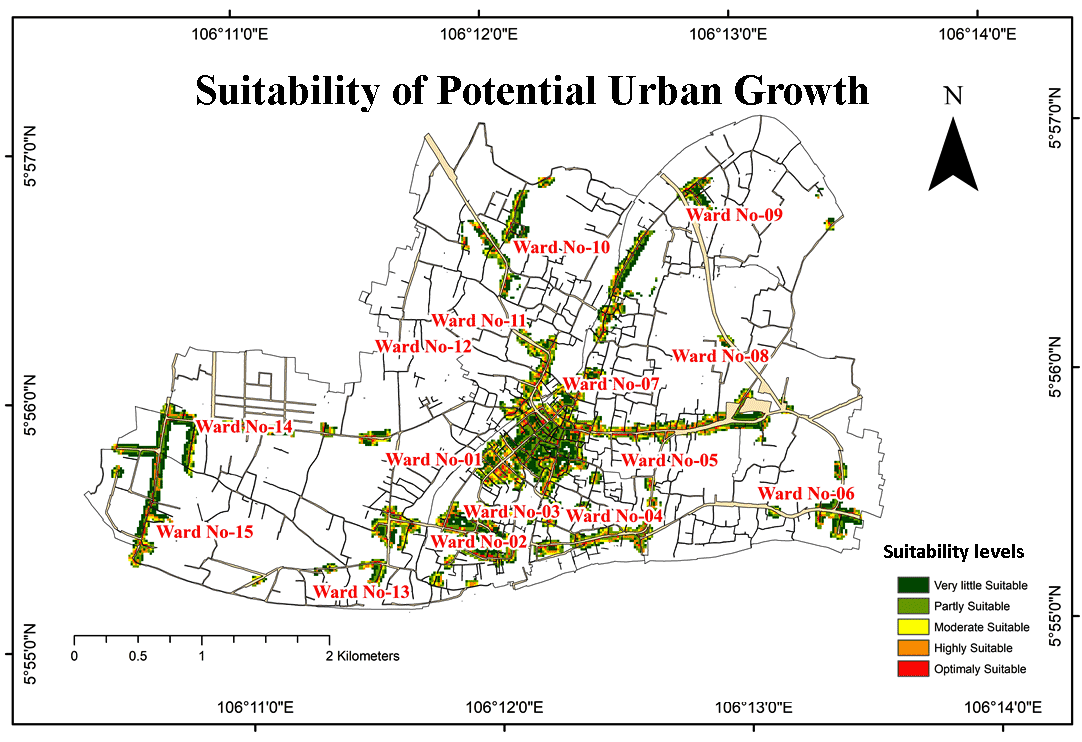
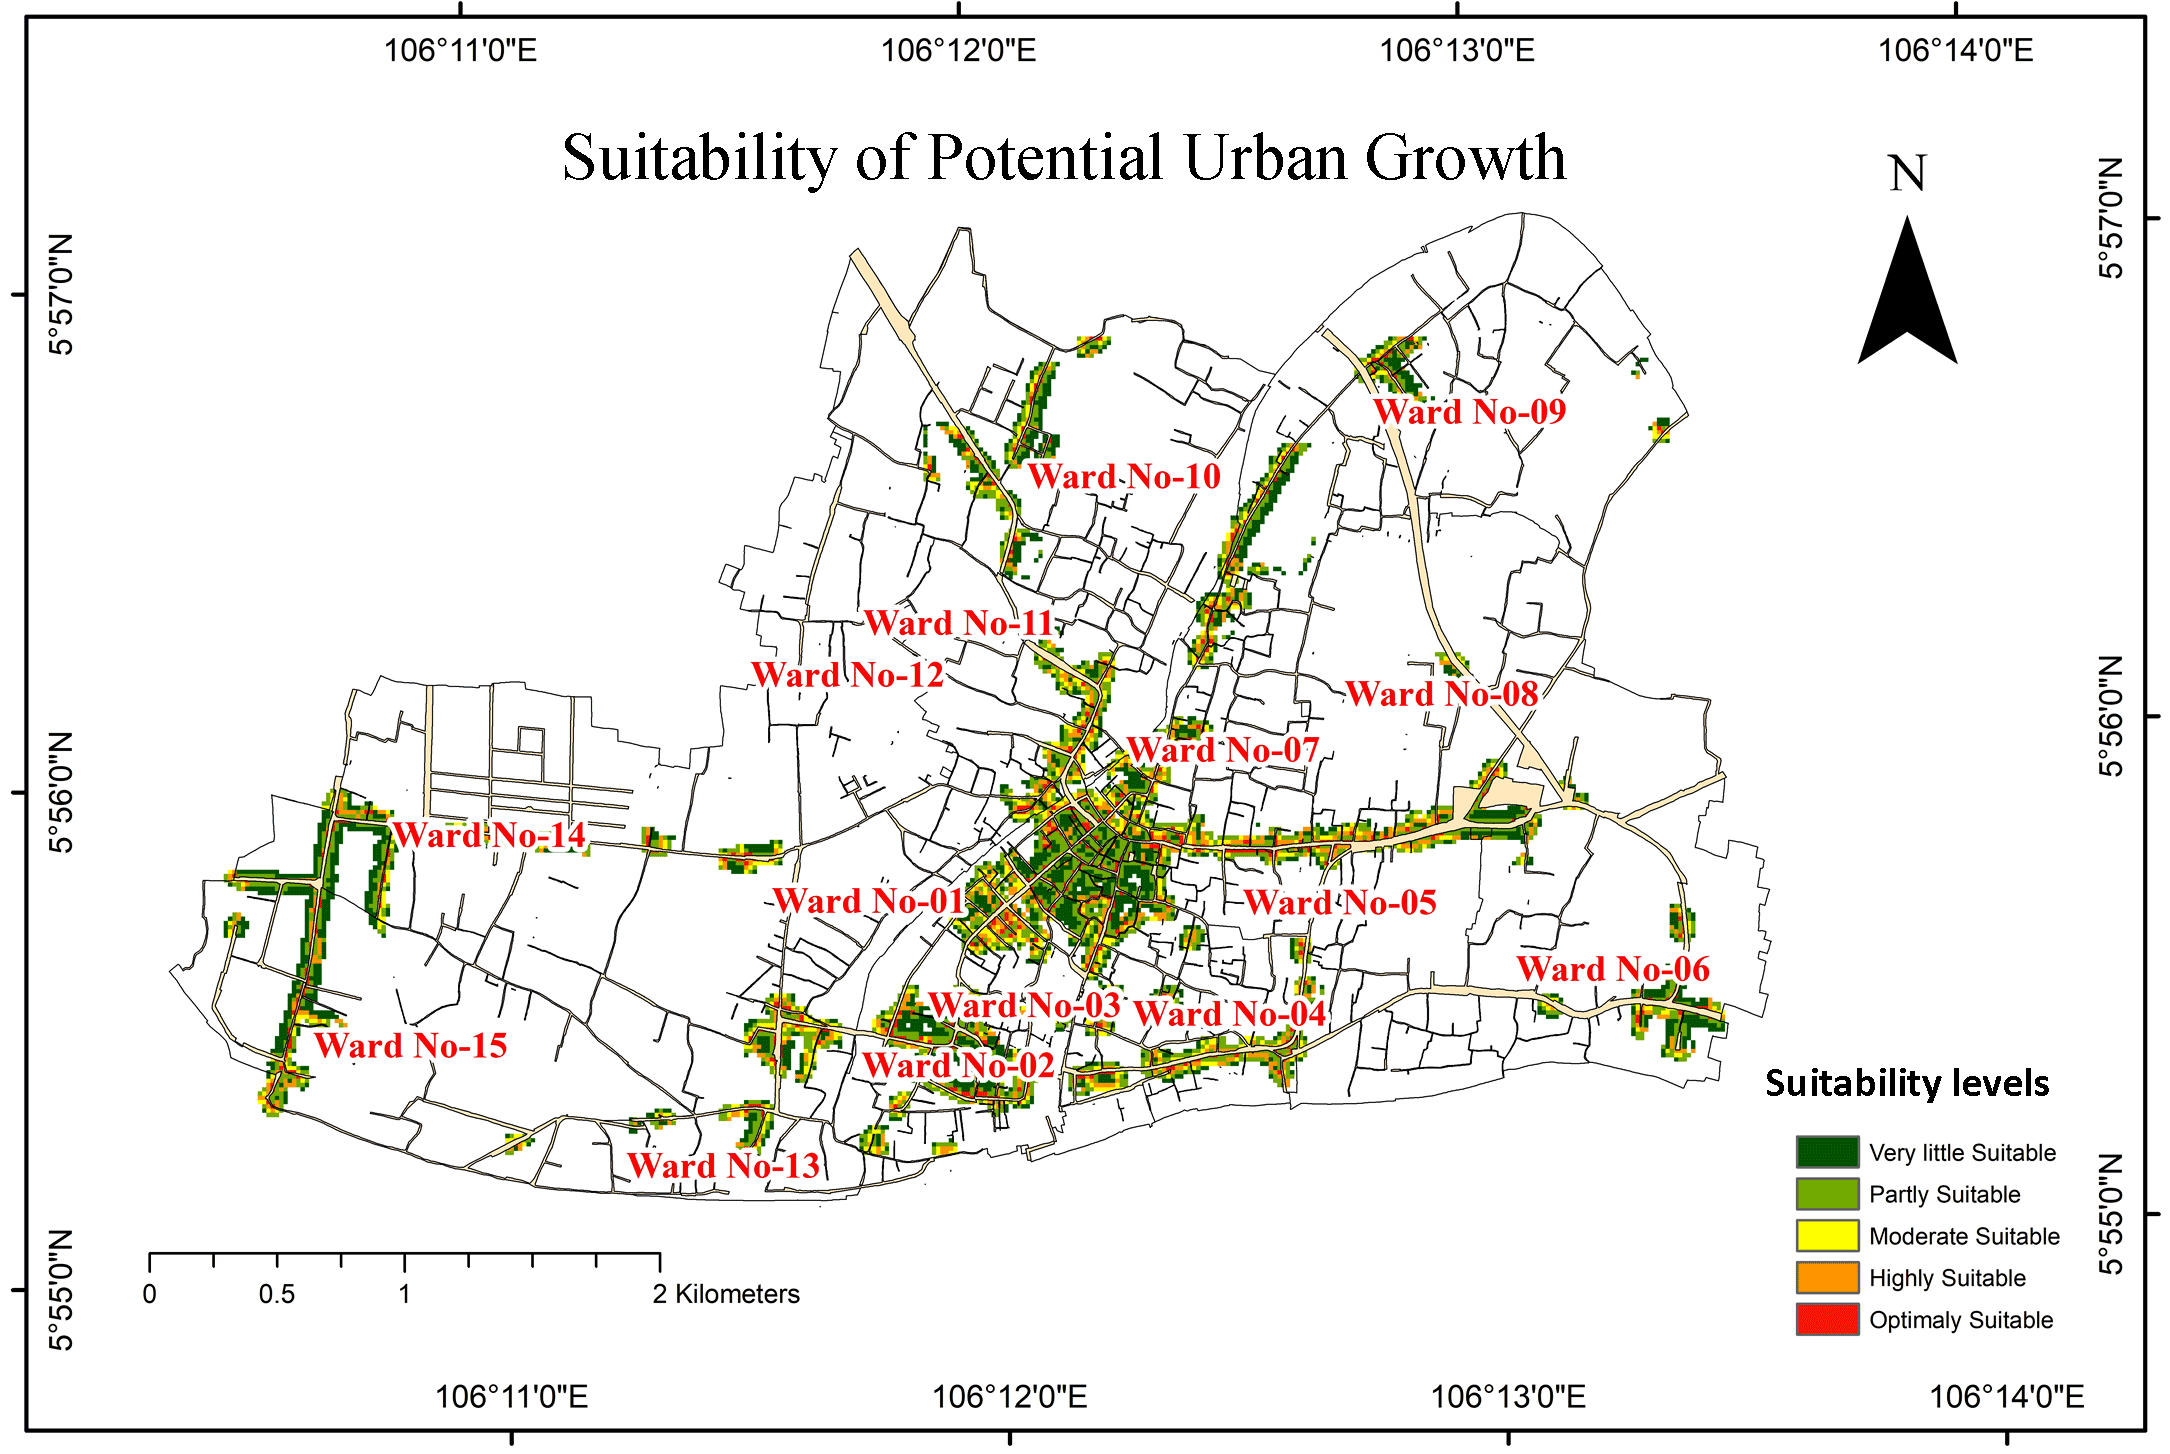
Urban land was classified into: Optimally suitable, mostly suitable, moderate suitable, partly suitable and very little suitable sites for potential urban growth in the Pabna municipality Area.
Abstract
For a long prior time, planning is being deprived of resulting unplanned urban growth that happen consequences the urban problems. A GIS-based site suitability analysis using the AHP model is performed with criterion: land use, population distribution, water network, drainage network and road network. The suitable growth sites are determined through expert opinion, pair-wise comparison matrix and finally determining the weighted value. This paper found out the potential urban growth mainly in ward no. 2, 7, and 6. Optimally suitable places are those sites where future urban development can easily occur and have all the required facilities with available commercial, industrial, and official land use, moderate and highly suitable places need some facilities e.g., water supply, drainage management, road network and rearrangement of land use. Very few and partly suitable sites need major involvement of facilities and revisions of present land use for potential urban development. This information can be useful for policy makers for planning processes as an acceptable scientific process for site suitability analysis in the municipality area for avoiding the urban problems and ensuring sustainable development.
Bangladesh is one of the fastest-growing countries with a high rate of urban growth. At present, mutually developed and developing countries have experienced an unprecedented expansion of urbanization due to economic development, industrialization, massive migrations as well as natural population growth (Sabbar et al., 2015). The fastest urbanization and consequent haphazard increase of towns bring about deterioration of infrastructure facilities, scarcity of water supply, agricultural land, open areas, and many changes in the micro-climatic scenario. This unparalleled evolution in the urban population put stress on urban services and led to their irregular distribution (Parry et. al., 2018). This improvement originates generally on the outlay of agricultural land and led in a few nations to the state of insecurity of food (Eldar et al., 2013). Serious negative effects on the suburban dwellers and their environment cause because of the unplanned and uncontrolled rapid growth (Chadchan and Shankar, 2012). Consequently, ample attention has been paid to deal with the problem of urbanization and its wicked consequence on the environment and socio-economic conditions. Sustainable improvement needs to be experienced through each evolved and developing countries (Raddad and Samat, 2010). Therefore, urban growth would give large deliberation to preservation matters such as landscape disintegration and environmental deprivation (Fekade, 2000).
Pabna municipality is the largest municipality in the Pabna District of Bangladesh. The projected population in 2022 will be 168125 (BBS, 2011). This is a plain area with a dense population in the municipality township area. Pabna is one of the fastest-growing cities in Bangladesh. About 26 % area is observed in urban-rural mixed character, with time, these areas will be converted into the township for all practical purposes. So, urban growth is increasing day by day in the Pabna municipality area (MIDP, 2008).
Major thoughts intricate GIS abilities to obtain, stock, save, operate, and investigate data while AHP based Multi-Criteria Decision Analysis competences with the geographic information through the decision maker’s preferences into alternate decisions (Munyao, 2010).
The study quantified the spatial and functional dynamics of land-use changes and identified potential areas for future development. In this study, the use of GIS and AHP based Multi-Criteria Decision Analysis was preferred as a possible way of making optimal decisions in selecting a suitable site for potential urban growth. The main objective of the paper is to find out the potential urban growth sites and helps to the planning sector of Bangladeshi grass root level and aiming at solving the urban problems. The results reported in the paper would be helpful for controlling future unplanned growth of the second town and avoid future urban haphazard with the help of suitable policies.
2 . FACTORS FOR SUITABLE POTENTIAL URBAN GROWTH
GIS doesn’t have competencies to include all selection factors related to land suitability valuation on its own, although it has authority in spatial analysis. Rather, it needs to be combined with supplementary assessment and evaluation tools, e. g., AHP Multi-Criteria Decision Analysis methods. AHP Multi-Criteria Decision Analysis has physical appearance and functionalities (Triantaphyllou, 2000). Various components and consistent standards have been properly-notion-out within the desire of an appropriate selection for ability of urban development. Each of the weights is well-defined in a while. Data became as quickly as collected for ranking necessities from field observation completed current and projected ability urban development section mainly constructed on AHP. It’s far one of the methodological tactics that may be applied to clear up distinctly complicated selection-making issues regarding more than one situation, standards, and elements. Hypotheses, a ratio scale connected to the significances for the numerous items to be as associated. In his initial method of AHP, Saaty projected a four-step method including modeling, estimate, ranking, and combination. (Madurika and Hemakumara, 2017). Essential care of decision theory is a way to derive weights for a hard and fast of sports in step with status. The significance is commonly adjudicated in keeping with several standards. Each criterion may be collective by using some or utilizing all the sports. The standards may, as an instance, be goals wherein the activities were devised to meet. This is a manner of a couple of criterion choice making which we study here through an idea of size in a hierarchical shape (Saaty, 1977). Inside the gift study, ratings for sub-criteria have been assigned based on expert evaluations, correlation analysis and literature review (Zolekar, 2018). Only the outcome of outer need can be considered in the AHP. However, besides outer-dependence, correlation is a communal effect between norms which cannot be accounted for the AHP. AHP is cast-off to originate the weights of norms when they are independent and outer dependent by the upper-level norms (Liu et al., 2014). Five criterions (land use, population distribution, water-, road- and drainage networks) were selected for suitability analysis. Land use was classified into commercial, industry and official area based on data from MIDP, Pabna. The second criterion was population. The ward-wise projected population data provided by BBS of the Pabna municipality was used. The third criterion was water network and the data of the water network was collected form land survey data of MIDP. The data on drainage and road network was also collected from MIDP Pabna and used as a criterion for suitability analysis.
3 . MATERIALS AND METHODS
3.1 Study Area
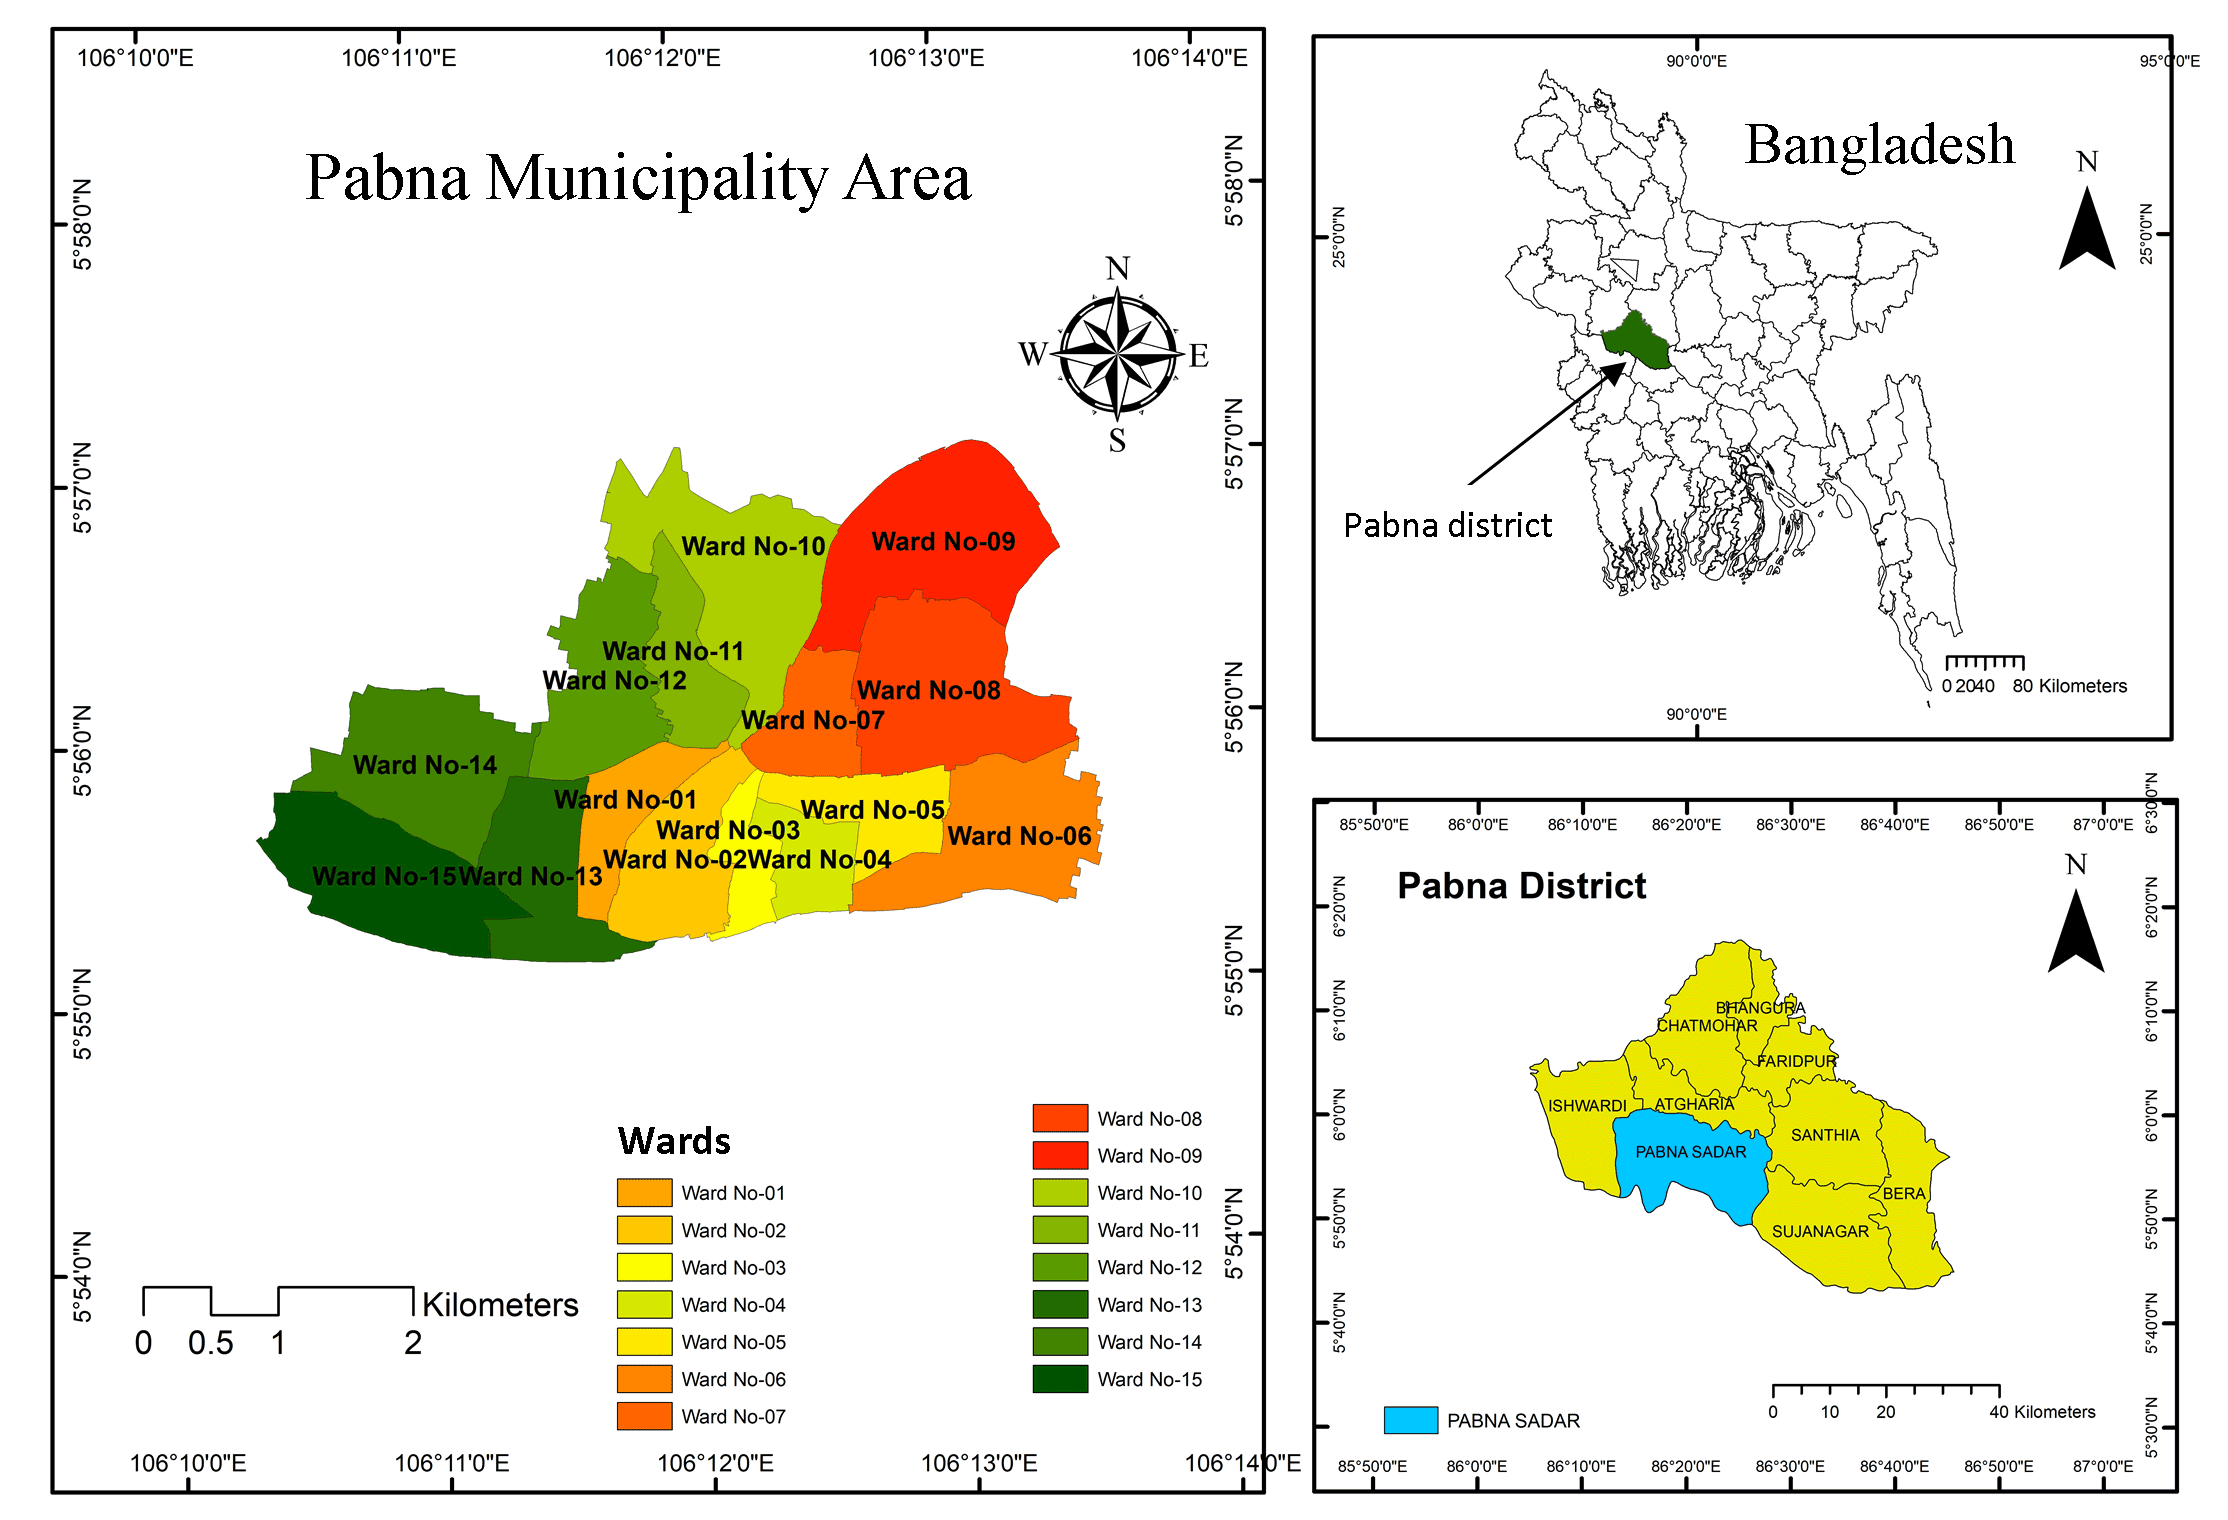
It is the Pabna municipality which is one of the oldest municipalities in Bangladesh and it was established in 1876 (Figure 1). In 1868, Pabna Town Committee was established before the Pabna Municipality establishment. Pabna municipality was upgraded to ‘A’ Category municipality in 1989. It is situated at 161km Northwest of Dhaka city and 110 km East of Rajshahi city. The area of the municipality is about 16 km2 with population of 133403. The area is distributed between 23º53" N and 24º 05" N latitude and 89º 09"E and 89º 25" E longitudes. There are 15 wards consist of the Pabna Municipality (MIDP, 2008). The total land earmarked for commercial use stands at 2.51% of the total urban area along with industrial land covered only 4.44%, total land earmarked for educational category stands at 4.45%, the total land under transportation use has been found 6.85% and office use 2.11% (ADB, 2014).
Figure 1. Study area
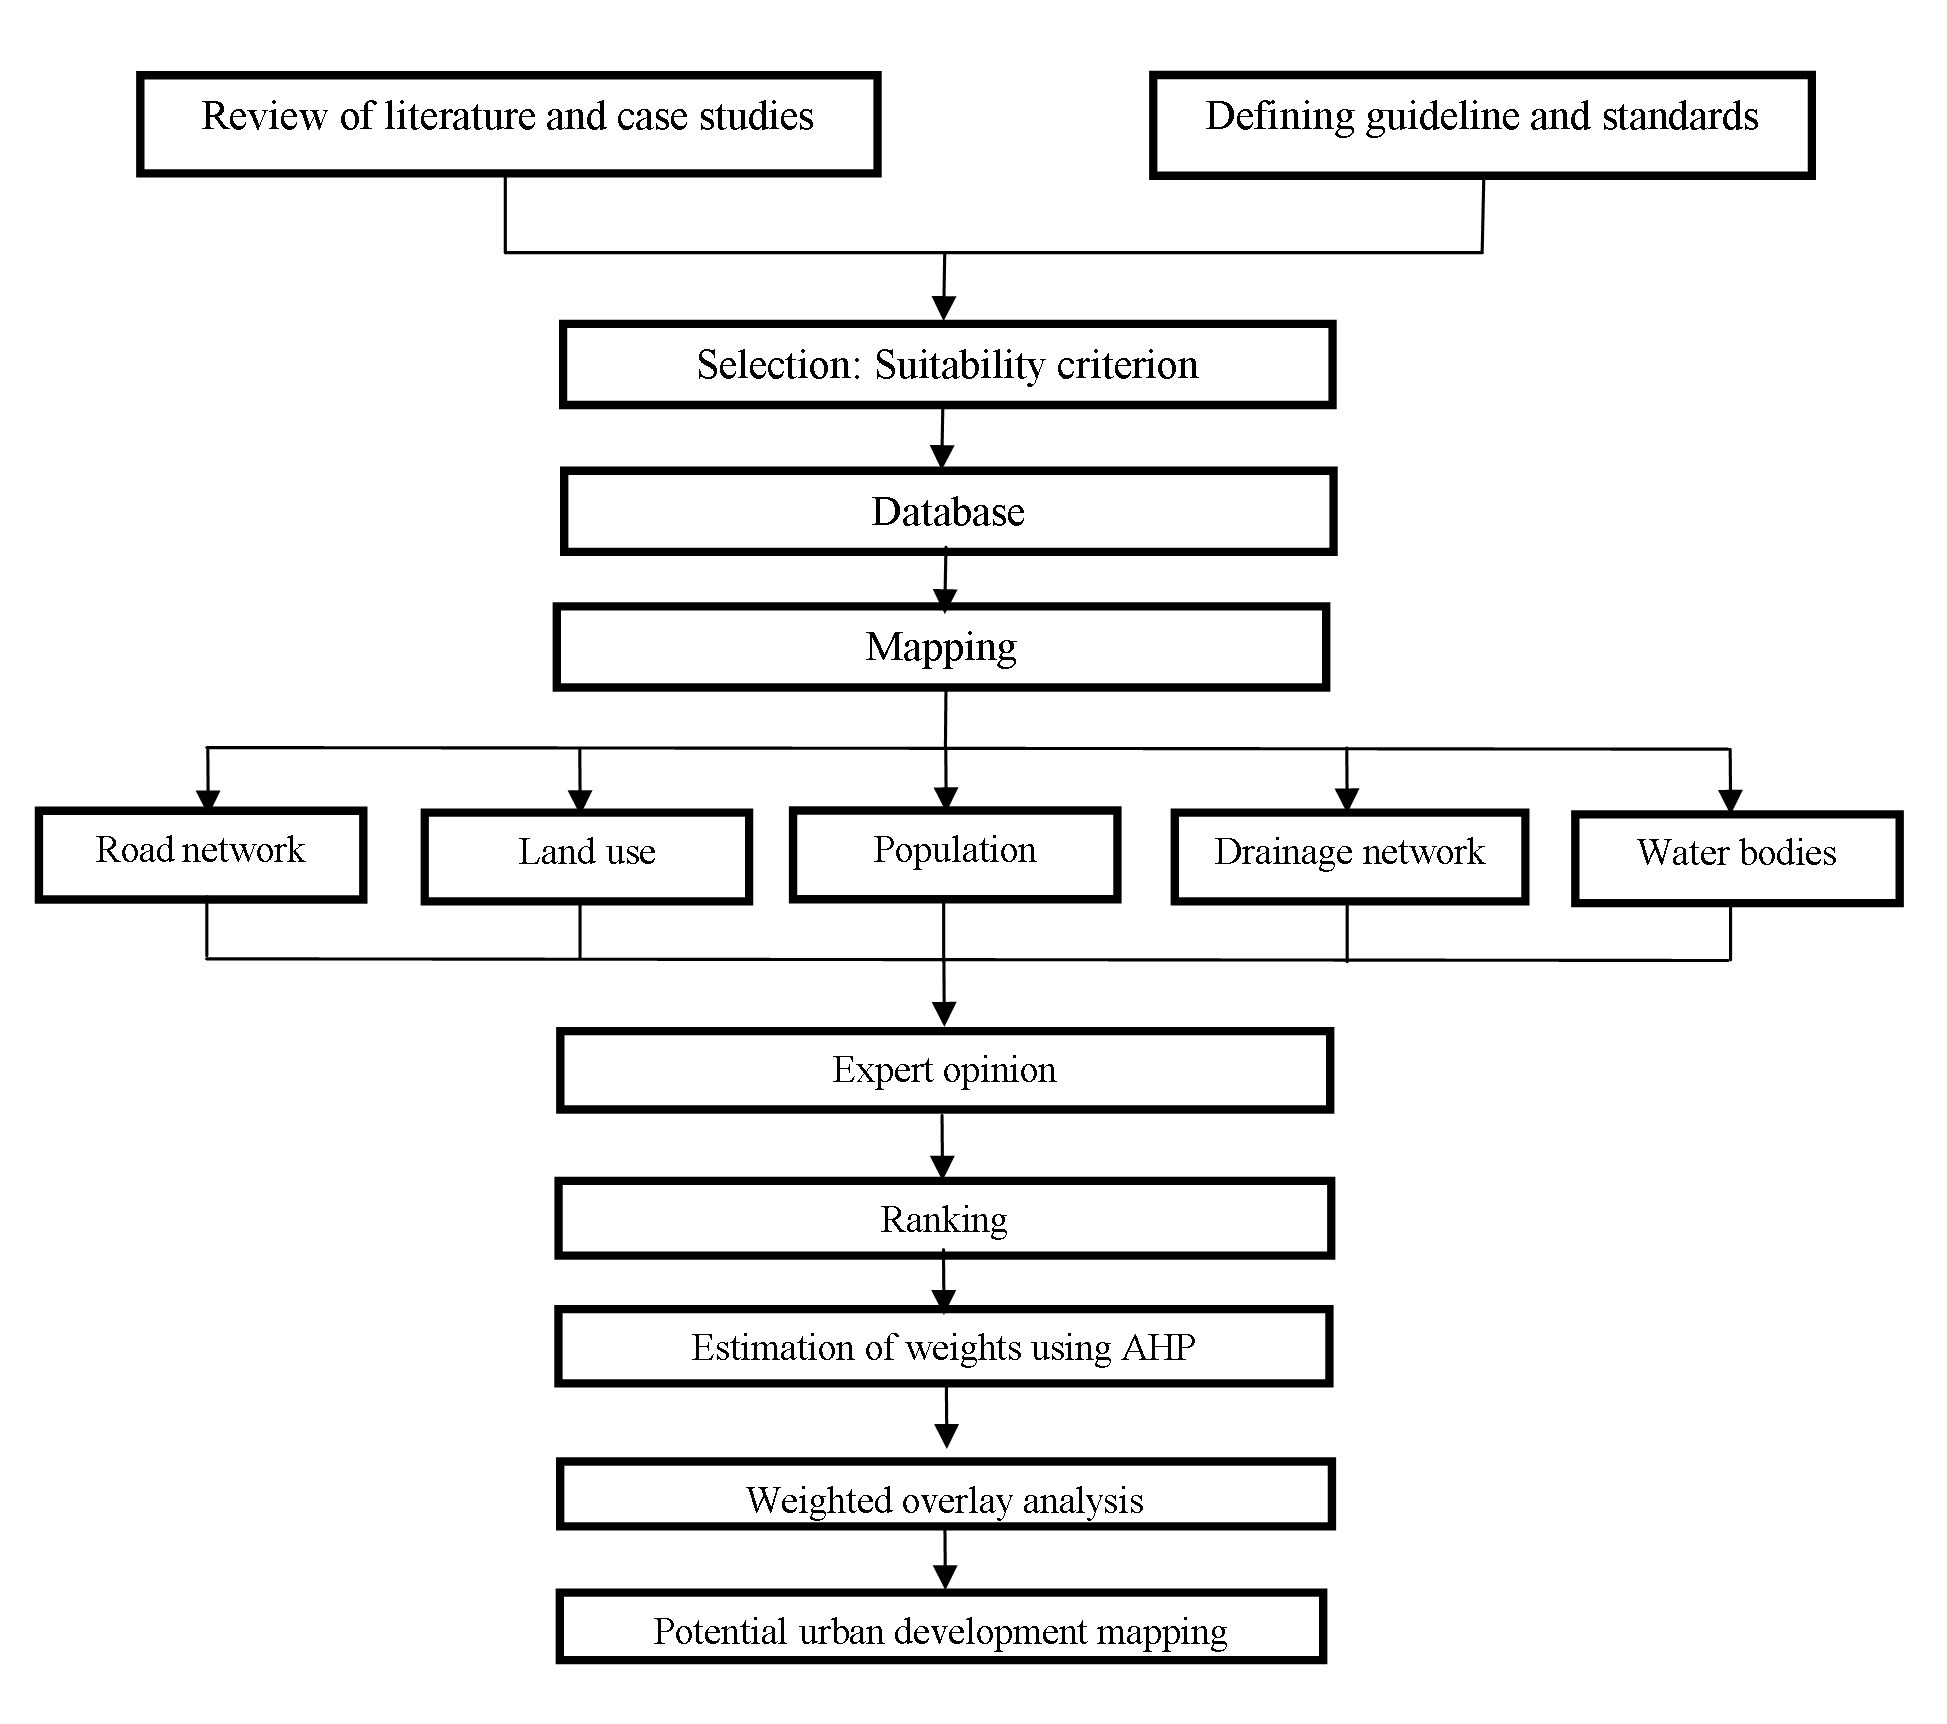
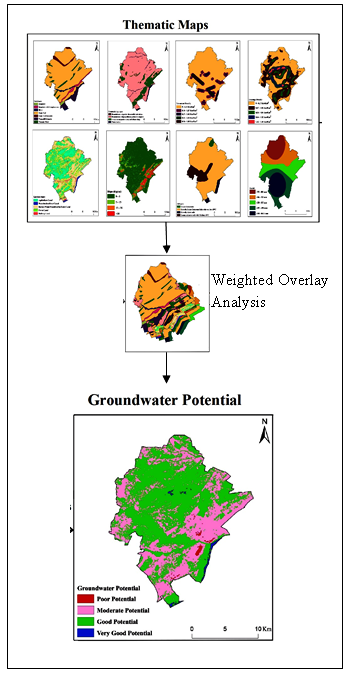
4.2 Methodology
Multi-standards selection evaluation included right into GIS surroundings to determine suitable sites for functionality of urban growth. The methodology was determined in four phases. Segment one worried about making plans and unique crucial logistics before venture implementation. In the segment, all vital records had been gathered primarily based on the massive style of well-known approach. Appropriate attributes for every criterion had been installed in phase three, and the impact of every criterion changed into furthermore determined on the use of AHP multi-standards choice analysis. In the very last section, the values systematized as layers have been assorted using a weighted overlay assessment to yield a suitability map (Njiru and Siriba, 2018). The AHP has been static in that they have used numbers and derived numbers to represent priorities (Saaty, 1977). To generate priorities, we need to make comparisons and need a scale of numbers that indicates how many times more important one element is over another element concerning the criterion or property they are compared. The AHP is a theory of measurement through pairwise comparison. The comparisons are made using a scale of absolute judgments that represents how much more; one element dominates another concerning a given attribute. The derived priority scales are synthesized by multiplying them by the priority of their parent nodes and adding for all such nodes (Parry and Bhat, 2018).
Table 1. Arithmetical appearance and relative scales of suitability
OWA functions as an instrument to implement those diversities of combinations. Here this approach is established further by because of situations in which the specific criteria have significance associated with them. MCDA and GIS are used to afford more precise choices for decision-makers to appraise the actual factors of environmental science.
One of the wider systems of the multi-criteria analysis is Ordered Weighted Averaging (OWA) (Mokarram and Hojati, 2017). Land suitability is mostly scrutinized by Multi-Criteria Evaluation (MCE) methods such as OWA. It involves homogenizing and allocating the comparative rank of weights the maps of suitability. Next, the weights and weighted suitability maps are united to subtract the comprehensive suitability slash. Each suitability analysis standard was reclassified constructed on its suitability for appropriate map creation, after unindustrialized the decision hierarchy (Figure 2).
Figure 2. Methodology
Numerous studies have been conducted in the literature to detect the suitable sites (Parry et. al., 2018; Zabihi et al., 2019; Madurika and Hemakumara, 2017; Njiru and Siriba, 2018; Mokarram and Hojati, 2017). Most of these studies use different criteria for suitability analysis but some of them have used the expert opinion for the criteria and weighting. For example, seven criteria were used with the opinion of experts for dam site selection suitability (Njiru and Siriba, 2018). Therefore, five criterions and their ranking were determined based on the analysis of the previous studies and consulting with the experts (Figure 2).
4.3 Calculation of Consistency Ratio
To assess the constancy of the pair-wise comparison matrix, an arithmetical index called Consistent Ratio (CR) (equation (1)) is cast-off (Njiru and Siriba, 2018).
\(CR = {CI \over RI}\) (1)
\(CI = {(\lambda_{max}-n)/(n-1) \over RI}\) (2)
here, λmax signifies the maximum value, and the number of influences is expressed by n, while RI represents the mean average consistency index. The suitability of the AHP and higher consistency results as signified by the pertinent index should be lower 0.10 (Zabihi et al., 2019). This value is compared with the similar established as a median over a massive variety of equal conditions of the same order whose accesses are random. Consistency ratio (CR) from random mediums is provocatively minor, carefully specified to be about 10% or less (Saaty, 1990). In which a taken into consideration constant ratio values below zero, suggests a ratio that labels a rational degree of uniformity in the pair-wise appraisal with the aid of an expert decision in AHP. The random index is represented using RI, which is the consistency index of a casually produced matrix of pair-sensible comparison (Zabihi et al., 2019). The RI used to hinge on the sum of norms (Njiru and Siriba, 2018). Here, there are five criterions and the estimated RI value is 1.12 (Table 2).
Table 2. RI mean average consistency index values
n
1
2
3
4
5
6
7
8
9
10
11
12
13
14
15
RI
0
0
0.58
0.90
1.12
1.24
1.32
1.41
1.45
1.49
1.51
1.48
1.56
1.57
1.59
4.4 Weightage Analysis
Mediums of pairwise assessments are designed both with the aid of offering verdicts to approximation ascendancy using absolute numbers from the 1 to 9 vital scale of the AHP or employing at once construction the pairwise dominance ratios using real extents (Saaty, 2007). The technique is primarily built on the answer of an eigenvalue problem. The outcomes of the pair-wise comparisons are arranged in a matrix. The primary standardized proper eigenvector of the matrix stretches the ratio scale known as weighting; the eigenvalue regulates the consistency ratio (BPMS, 2017). An evaluation of the relative significance of each criterion with one another within a scale of one to five turned into used. This permits for the equitable assessment of intensities of suitability, with 1 being elements of equal desire and 5 being the elements with excessive choice over the other as proven in (Table 1). From earlier studies on urban growth, combined with the expert opinion on factors affecting the urban growth site selection, the order of rank of each norm is as showed in Table 3.
Table 3. Ranking
Factor
Drainage
Population
Water Network
Land Use
Road
Ranks
1
5
3
7
5
To estimate the weight of apiece issue, pair-wise comparison changed into used as defined in Table 4. A matrix changed into given wherein associated with its significance, a criterion becomes in comparison with the other on a scale of 1 to 5.
Table 4. Estimated weights
Suitability
Drainage network
Population
Water network
Land use
Road network
Drainage network
1
5
3
7
5
Population
0.2
1
0.33
3
0.5
Water network
0.3
3
1
5
3
Land use
0.14
0.3
0.2
1
0.2
Road network
0.2
2
0.33
5
1
Total
1.87
11.3
4.87
21
9.7
All criteria using the fundamental scale are applied with the pairwise comparison shown in table 1, which was proposed as part of AHP. The intensity of importance is assigned to criteria i when related to criteria j and the joint value is allocated to criteria j as the passion of rank. When comparison between all possible criteria pairs is done, the weight of criteria i, which is used in later analysis for suitability analysis, is calculated using equation (3).
where, \(P_{ij}\) designates comparative rank in a pairwise comparison of criteria i associating to norms j (Dai, 2016).
Values are solid-off for pair-wise comparison ordinarily substance at the impartial selection which must result in arbitrary effects with bias. To assess the consistency of the pair-wise evaluation matrix, a numerical index known as the consistency ratio (CR) is used as indicated in equation (1). CR indicates the ratio of the consistency index (CR) to the common consistency index, recognized as the random index (RI) (Table 5).
Table 5. Pair-wise evaluation matrixes for calculated standards weights
Criterion
Land use
Population
Road network
Water network
Drainage network
Weight
Land use
0.53
0.61
0.43
0.44
0.30
0.462
Population
0.17
0.20
0.30
0.26
0.25
0.236
Road network
0.131
0.06
0.10
0.17
0.26
0.144
Water network
0.10
0.06
0.15
0.08
0.14
0.106
Drainage network
0.07
0.04
0.02
0.02
0.05
0.042
Total
1
1
1
1
1
1
4 . RESULTS AND DISCUSSIONS
Inputs of overlay are all the layers standardized right into a usual scale of 1 to 5, with 5 being the most useful as confirmed in table 6. With the useful resource of the weighted sum tool in arc-GIS, every input raster is improved through the use of the special weight. It then overlays all enter raster layers together to prepare the suitability map (Figure 4) and reclassified into 5 suitability classes. A table showing relies upon pretty several suitability ranges (%) turned into once furthermore produced (Table 7)
Table 6. Estimated AHP weighted influence
Criterions
AHP weighted influence (%)
Land use
47
Population
23
Road network
15
Water network
11
Drainage network
4
A recent look at indicates, the analysis formed a map of numerous training: low-slung, slight, or high suitability for town development. The ultimate suitability map built by way of a linear aggregate approach represented areas characterized by way of one-of-a-kind potentials for city development assigned that rank between one and five (Mohammed et al., 2016).
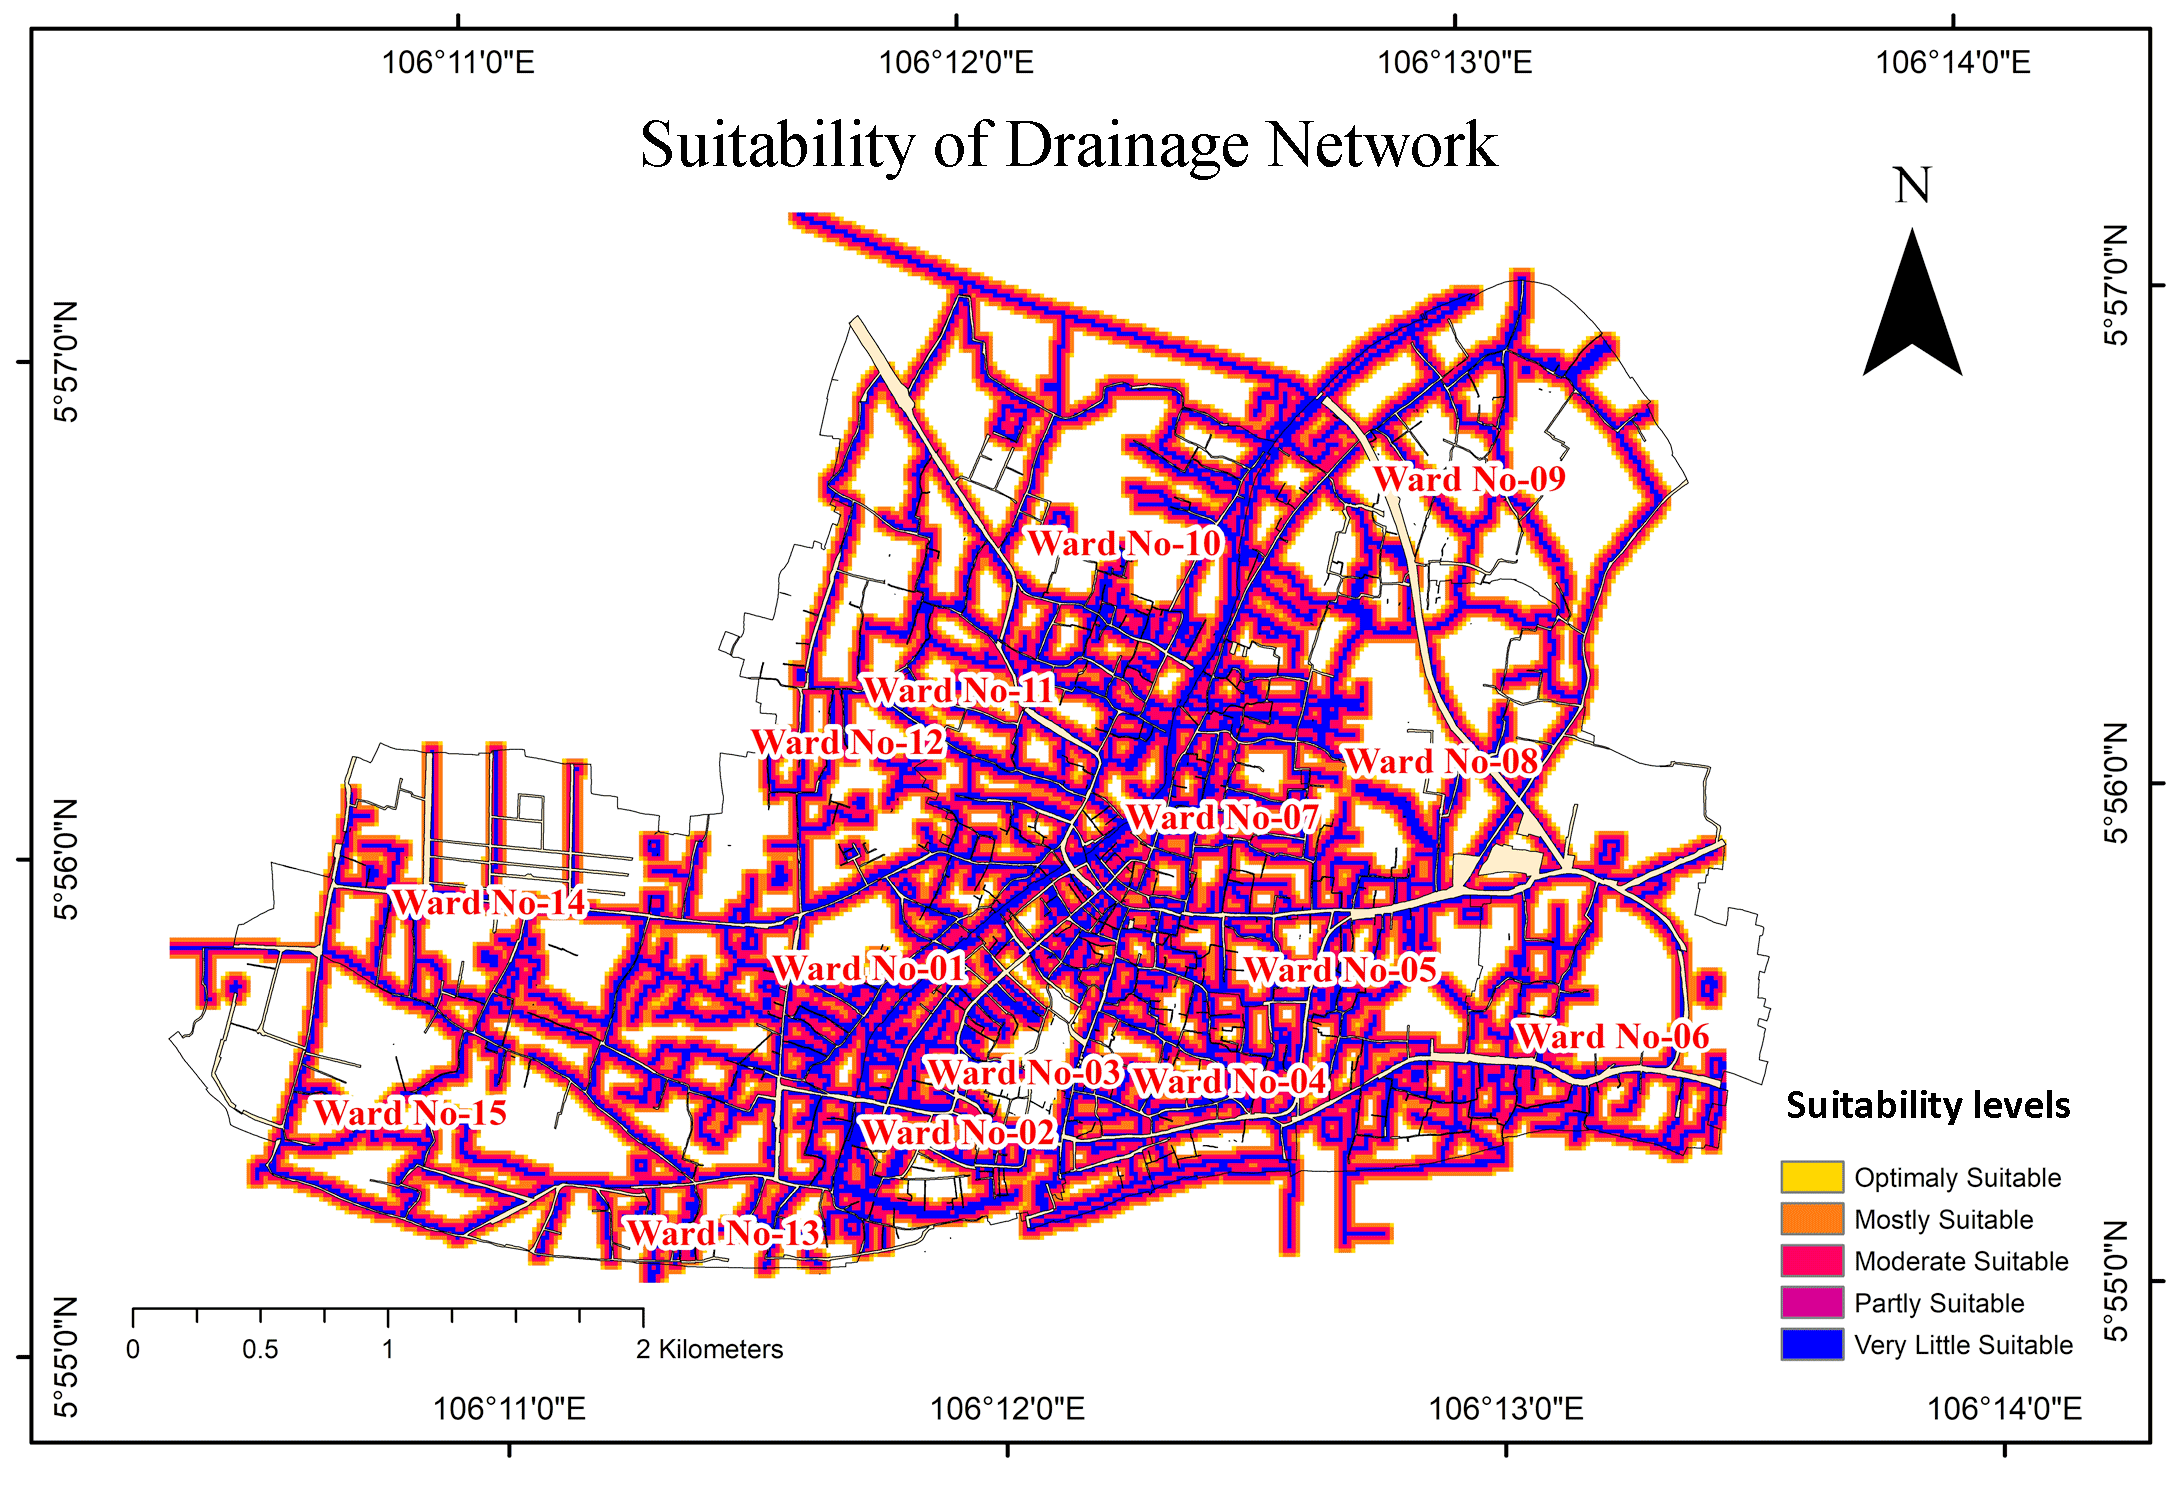
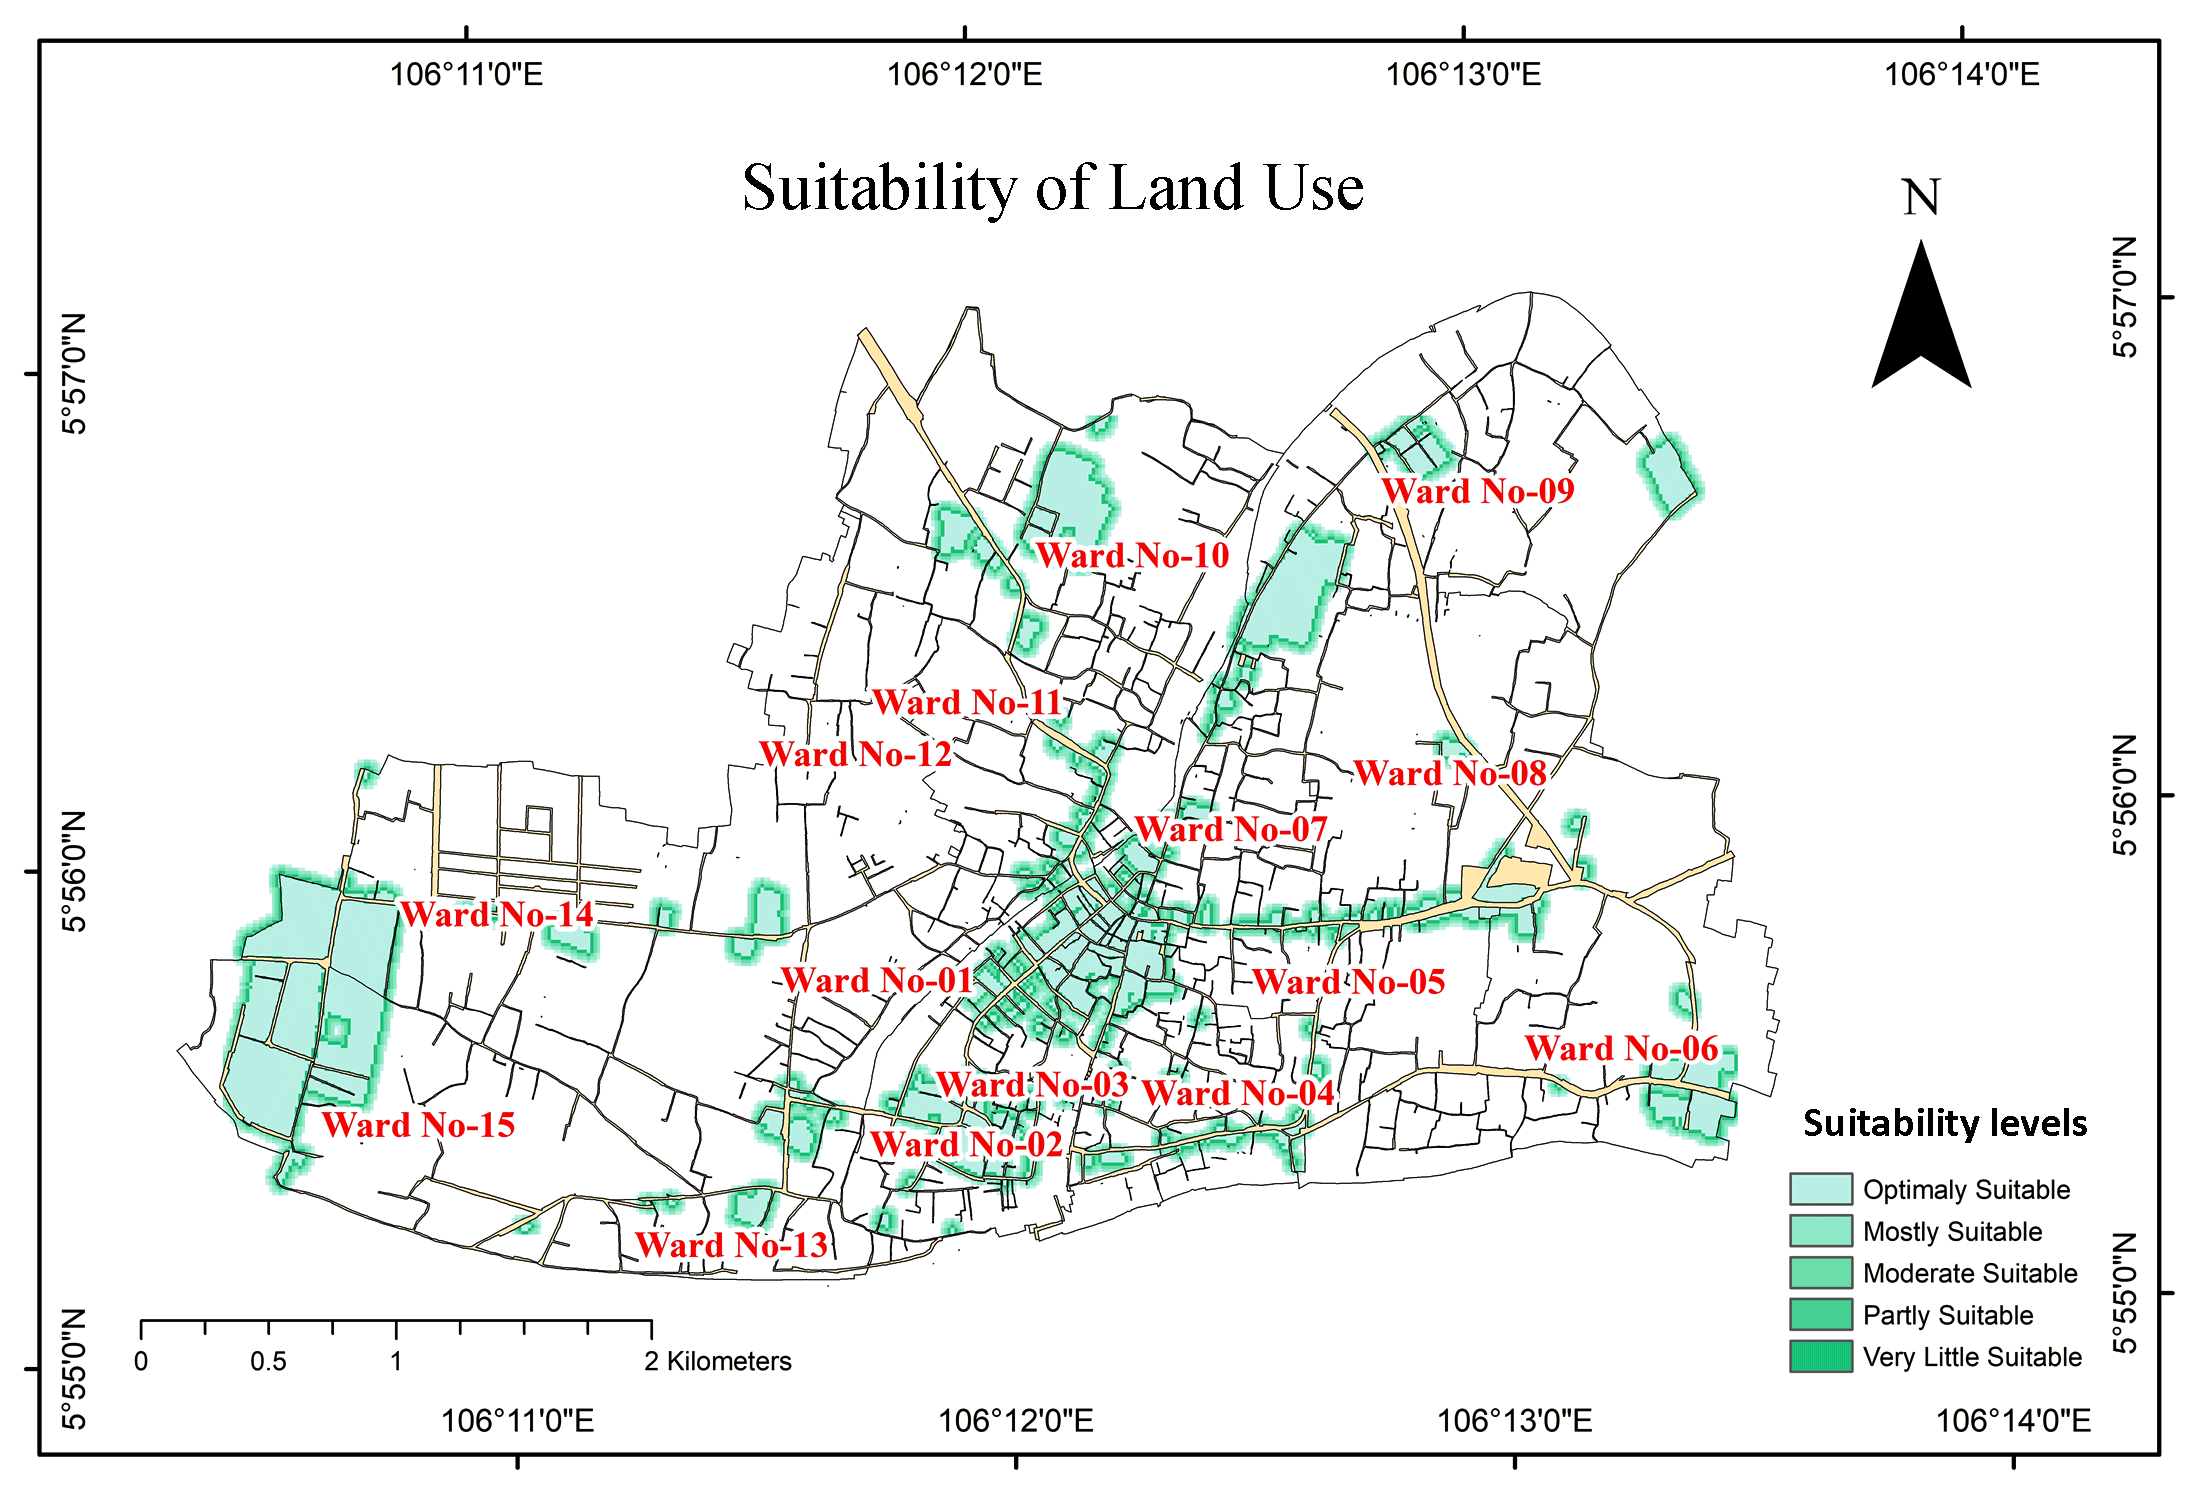
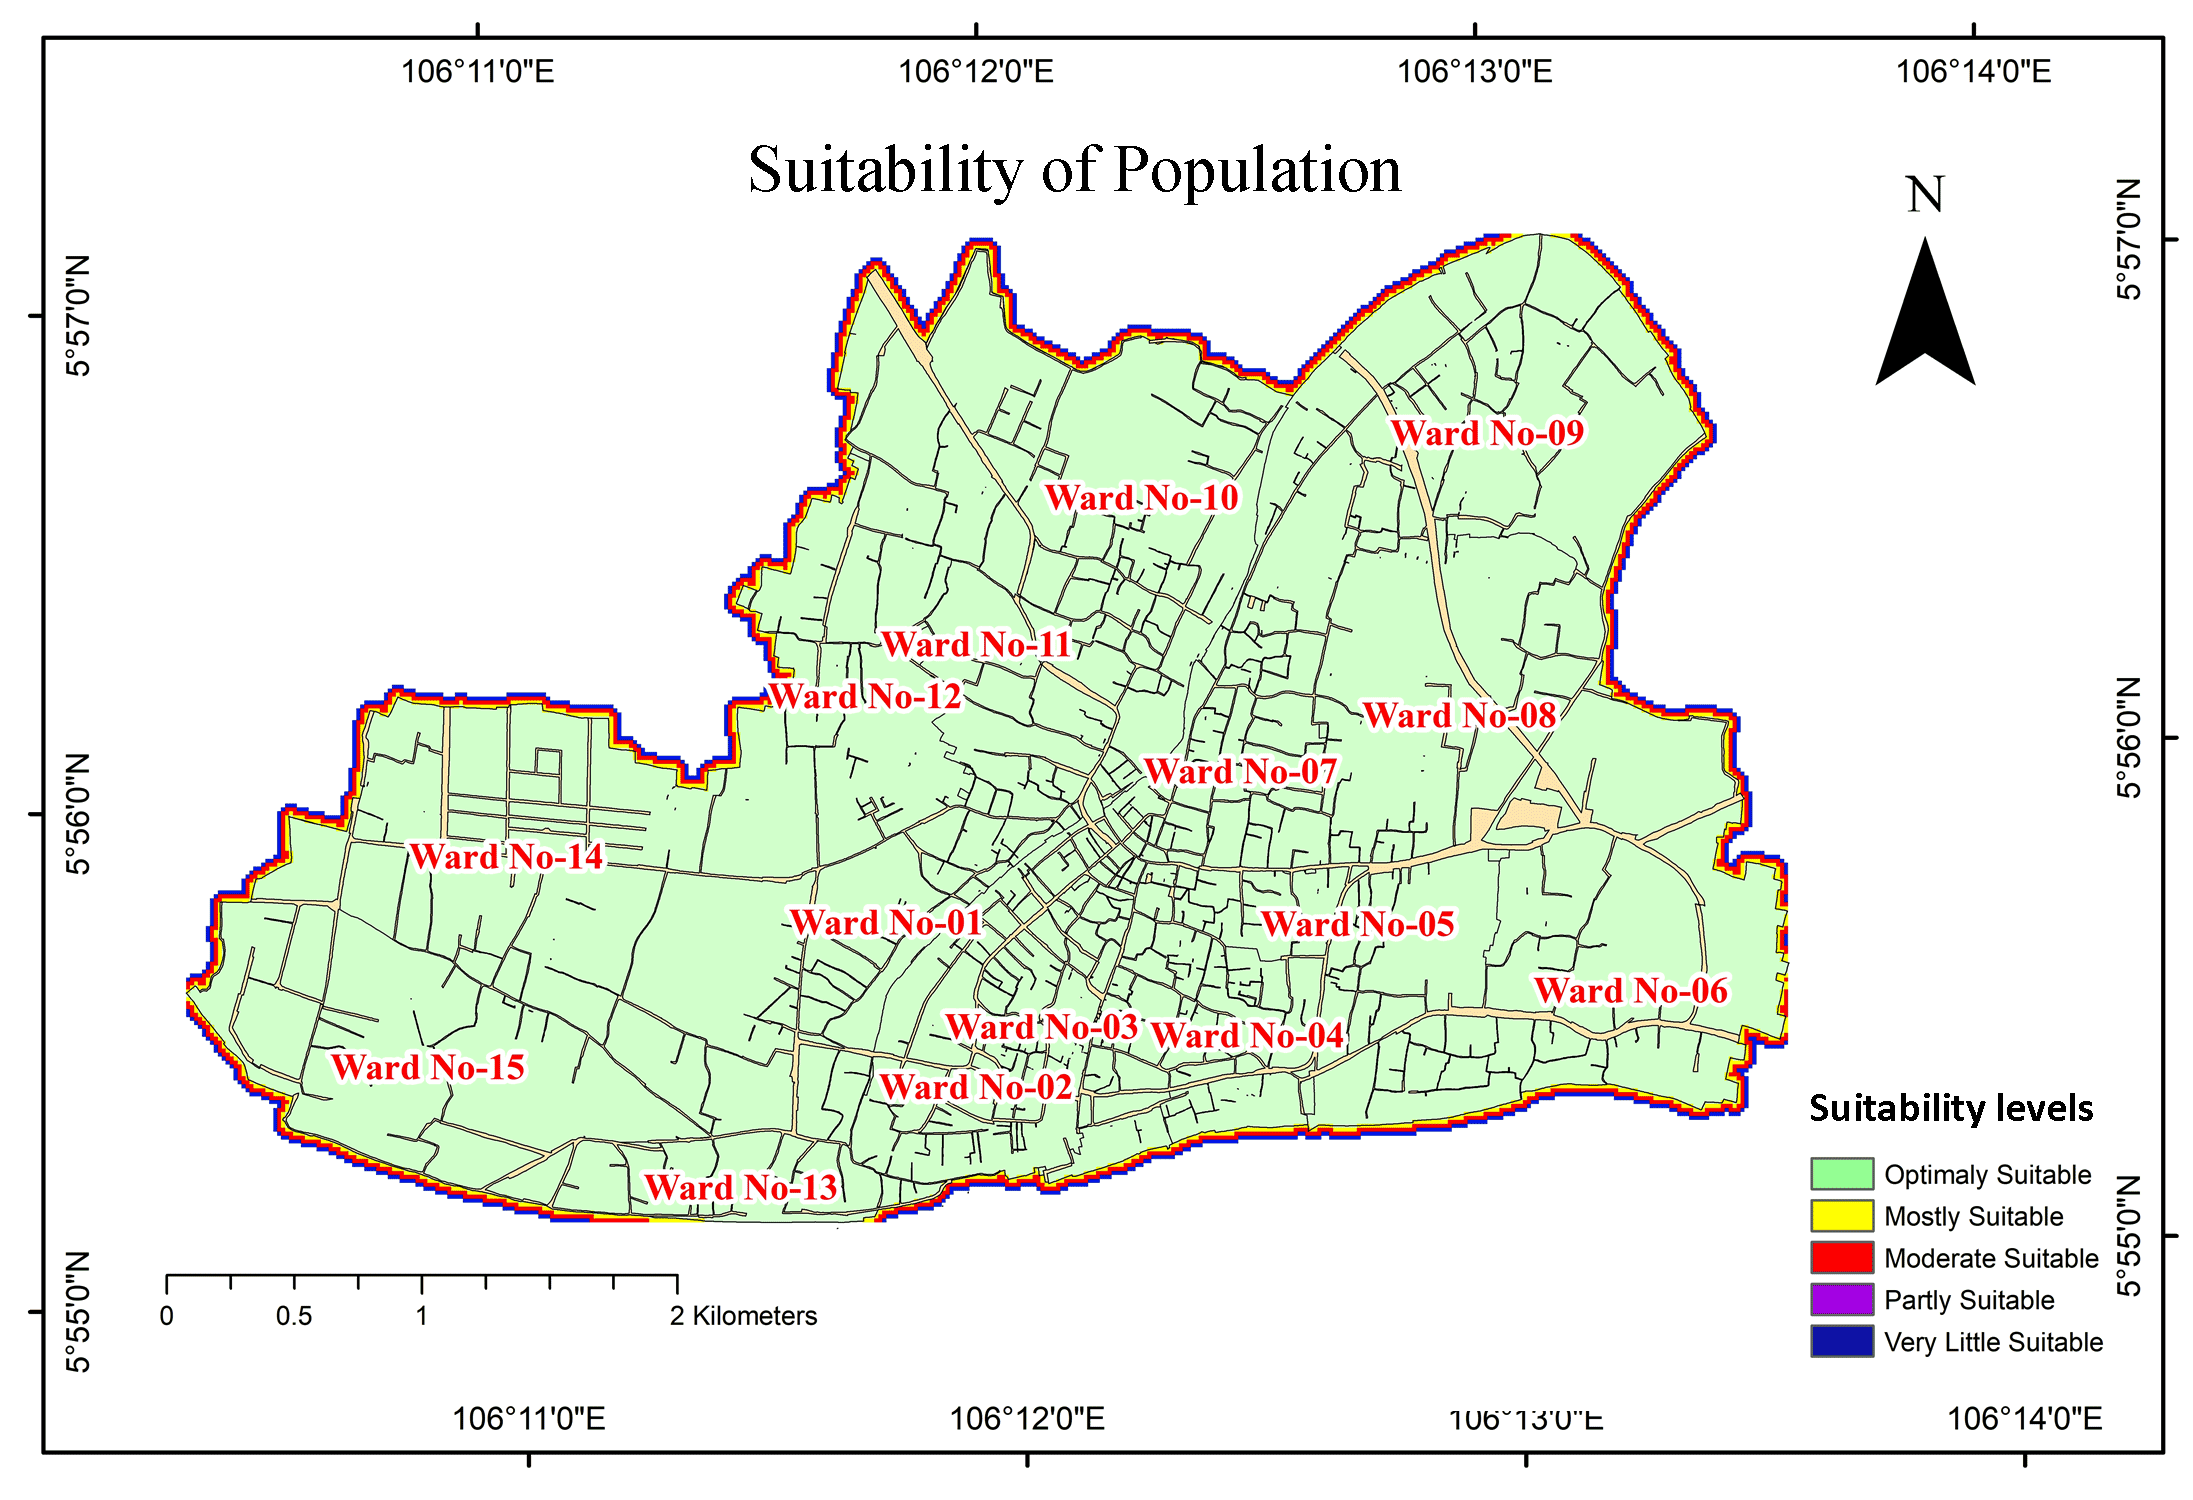
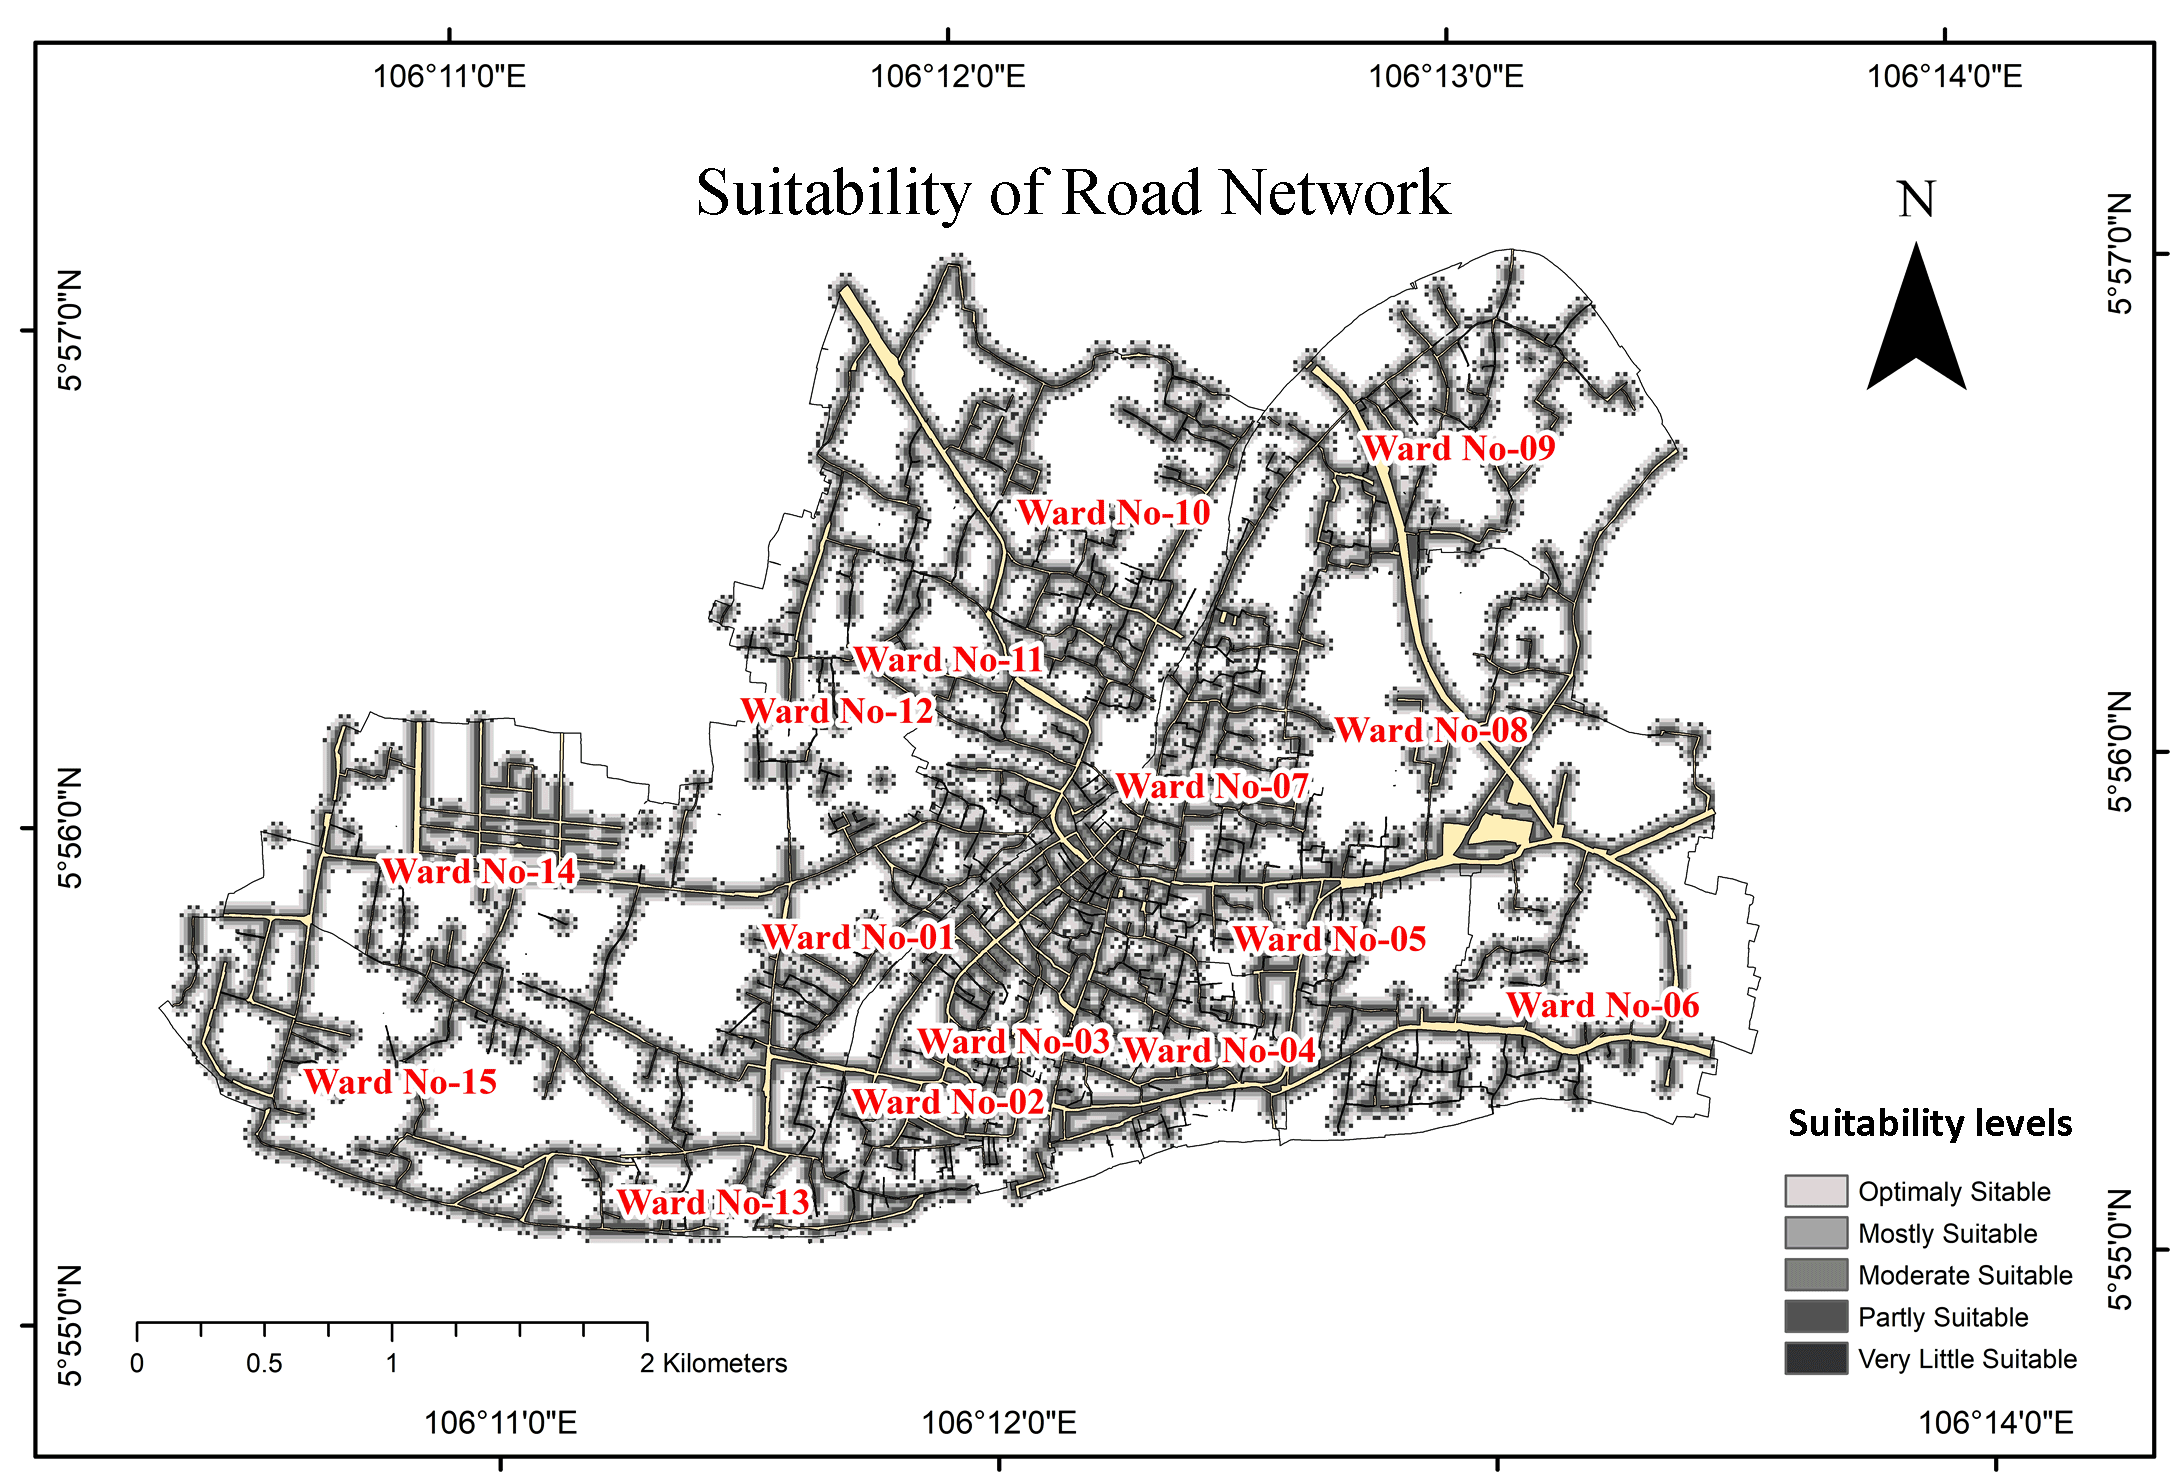
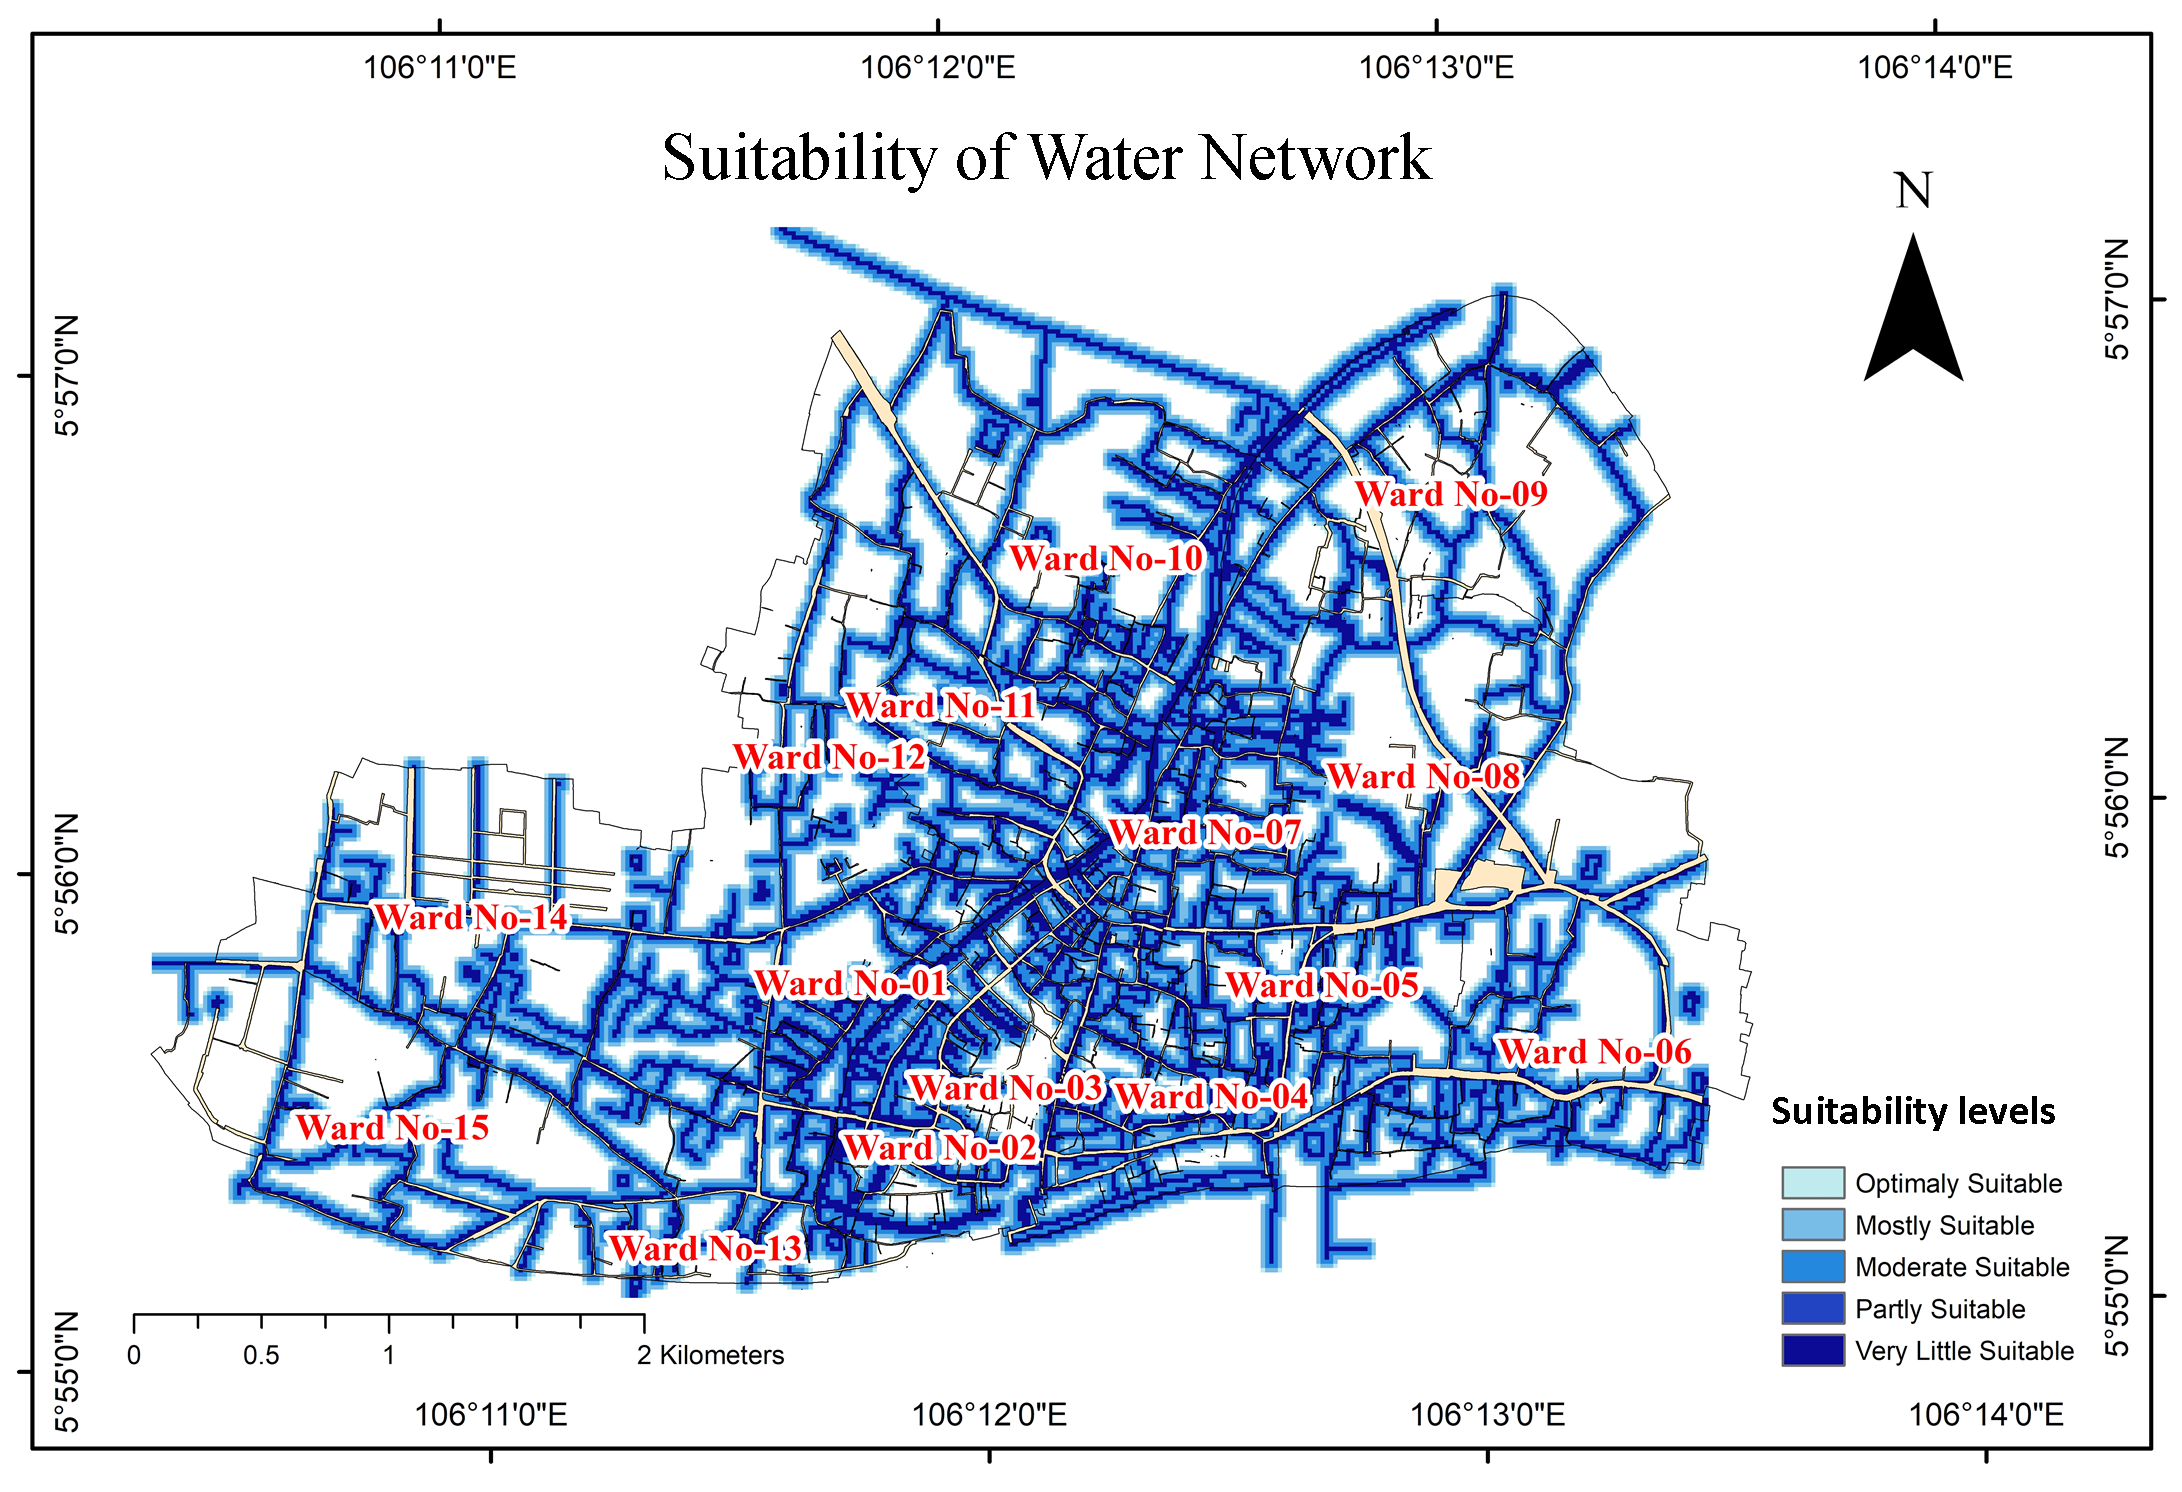
The individual suitability map for land-use, water network, population, drainage, and road network are shown in Figure 3. 200-meter buffer is taken for individual cases and then the Euclidean distance is covered up, then they were reclassified as the most suitable place and a less suitable place. On the map, most of the places are found out not suitable, and very few places are being found out suitable for potential urban growth. Finally, all the maps are being integrated and a final coverage has come out. Optimally appropriate places are the one’s spots wherein future city development can without difficulty arise and feature all the required centers with available business and authentic land use, slight and exceptionally suitable locations want some centers e. g., water delivery, drainage, road network and rearrangement of land use.
Figure 3a. Standardized layer: Suitability of drainage network
Figure 3b. Standardized layer: Suitability of land use
Figure 3c. Standardized layer: Suitability of population distribution
Figure 3d. Standardized layer: Suitability of road network
Figure 3e. Standardized layer: water network
Only a few and partially appropriate spots need essential involvement of facilities and revisions of modern land use for turning into ability urban development sites. It is seen that most of the suitable place for urban growth is in ward no-7, has the most suitable place for urban growth in ward no-2 and word no 6 has optimal potential urban growth and another region has less potential urban growth. It is seen that among the rank of suitability: 1) very few suitable sites are 1838, 2) very suitable sites are 739, 3) partly suitable sites are 2458, 4) moderate suitable sites are 967 and 5) mostly suitable sites are 1172 (Table 7). Among the all reviewed 7174 sites, 26.5% sites are found very little suitable, 34. 26% is partly suitable, 13. 47% is moderate suitable, 33% is mostly suitable and 10.30% is optimally suitable.
As a secondary township with a huge amount of increasing population, Pabna municipality is having a great potential urban growth rate. This determined places can be useful for the future urban growth and the policymakers and planners can use this suitable places for making a proper plan by which urban problems (e.g. price hike of land, urban haphazard, pollution, solid waste problem, ribbon development, traffic jam, waterlogging and so on) can be eradicated and a proper city can be easily built with leads toward sustainable development of a city.
Figure 4. Site suitability of potential urban growth
5 . CONCLUSIONS
From the consequences, it is observed that assimilating GIS with AHP multi-standards preference evaluation has been worthwhile in identifying an appropriate attainable town boom spot. Therefore, absolutely everyone is professional and supportive of the choice-making device. The result suggests that the integration of GIS with AHP Multi-Criteria Choice Assessment for appropriate manageable metropolis increases the potential urban growth site decision is feasible and powerful. The study shows the potential urban growth area mainly at a ward no. 2, 6, and 7. There are potential evidence of land use (e.g., commercial, industrial, and office), road network, water supply, and drainage system. Other wards need vital revision in land use and these facilities. Even a lot of areas in the municipality area are not covered by these criterions. So, these areas can be revised and facilities which can be made these sites of potential urban growth area. This study is powered through the way of GIS analytical competencies and geospatial technology, which is opposite to manual strategies of capacity urban growth site using numerous criteria’s which include natural and man-made. This examination gives a reference for destiny GIS-primarily based city growth decision specifically with multi-criteria choice based evaluation for an urban growth choice to be carried out and help the policymakers to build a proper planned secondary township and avoid the potential urban problems.
Tables
Figures
Conflict of Interest
The authors confirm no conflict of interest.
Acknowledgements
Authors would like to acknowledge the Department of Urban and Regional Planning both Pabna University of Science and Technology (PUST) and Bangladesh University of Engineering and Technology (BUET). Special thanks go to Md. Sohel Rana, Chairman, Department of Urban and Regional Planning, Pabna University of Science and Technology and Meher Nigar Neema, Assistant Professor, the Department of Urban and Regional Planning, Bangladesh University of Engineering and Technology.
Abbreviations
AHP: Analytic Hierarchy Process; BBS: Bangladesh Bureau of Statistics; BPMS: Business Performance Management Singapore; MCDA: Multi-Criteria Decision Analysis; MCE: Multi-Criteria Evaluation; MIDP: Municipality Infrastructure Development Plan; OWA: Ordered Weighted Averaging.
Raddad, S. and Salleh, A., Samat, N., 2010. Determinants of agricultural land-use change in palestinian urban environment: Urban planners at local governments perspective. American-EurasianJournal of Sustainable Agricultural, 4, 30-38.


 ,
Shormi Islam 2
,
Shormi Islam 2