1 . INTRODUCTION
‘Morphometry may be defined as the measurement and mathematical analysis of the configuration of the earth’s surface and of the shape and dimensions of its landforms’ (Clarke, 1966). Drainage basins are the fundamental units of the fluvial landscape and a great amount of research has focused on their geometric characteristics, which include the topology of the stream network and quantitative description of drainage texture, pattern, shape, and relief characteristics (Abrahams, 1984; Huggett and Cheesman, 2002). A quantitative morphometric characterization of a drainage basin is considered to be the most satisfactory method for the proper planning of watershed management because it enables us to understand the relationship among different aspects of the drainage pattern of the basin, and also to make a comparative evaluation of different drainage basins developed in various geologic and climatic regimes (Zende and Nagrajan, 2011). Fluvial morphometric study of a drainage basin includes the consideration of linear, areal and relief aspects, where the linear aspect deals with the hierarchical orders of streams, numbers and length of stream segments, etc. The areal aspect includes the analysis of basin parameters, basin shape both geometrical and topological (Stream frequency, Drainage density) and the relief aspect includes, the study of absolute and relative relief ratios, average slope, dissection index (Singh, 1998; Khakhlari and Nandy, 2016).
Morphometric parameters mainly depend upon lithology, bed rock and geological structures. Hence, the information of geomorphology, hydrology, geology, and land use pattern is highly informative for reliable study of drainage pattern of the watershed (Astras and Soulankellis, 1992). For quantitative analysis of the watershed involving various components such as stream segments, basin perimeter, basin area, elevation difference, slope and profile of land has been responsible for the natural development of basin (Horton, 1945). Pioneer work on basin morphometry analysis was carried out by Horton (1932, 1945). Then, Horton’s laws were subsequently modified and developed by several geomorphologist and geohydrologist, which was highly appreciable most notably by Strahler (1952), Schumm (1956), Leopold and Miller (1956), Morisawa (1957), Melton (1957), Strahler (1957), Shreve (1967), Muller (1968), Evans (1972), Gregory and Walling (1973), Chorley et al. (1984). In recent decades, the morphometric analysis of the various River basins, have been done by many researchers and scientist (Topaloglu, 2002; Moussa, 2003; Pareta, 2005; Mesa, 2006; Esper, 2008; Magesh et al., 2011; Bhagwat et al., 2011; Wilson et al., 2012; Singh et al., 2014; Sujatha et al., 2014; Meshram and Sharma, 2017; Rai et al., 2017). Gaikwad and Bhagat (2017) have analyzed morphometric parameters for watershed prioritization using multi-criteria analysis with AHP and influence approaches.
Morphometric analysis of River basins using conventional methods is very time consuming, laborious, and cumbersome also. Remote Sensing and GIS is accepted to be powerful geospatial techniques in preparing the drainage map and understanding the watershed’s morphometric parameters (Rao et al., 2011). To evaluate the morphometric analysis using Geographical Information Systems (GIS) was attempted by several researchers (Srinivasa et al., 2004; Markose et al., 2014; Das, 2014; Kaliraj et al., 2015; Gajbhiye, 2015; Sahu et al., 2016; Pande and Moharir, 2017; Rai et al., 2017; Chandniha and Kansal, 2017).
Morphometric analysis of streams is an important aspect for characterization of watershed. Proper planning and management of watershed is very necessary for sustainable development (Chandniha and Kansal, 2017). In the present study, an attempt is made to understand the morphometric characteristics of Adula River Basin, a tributary of Pravara River flowing through the Maharashtra using GIS and RS.
4 . RESULTS AND DISCUSSION
4.1 Linear Aspects
4.1.1 Stream order (u)
The designation of stream order is the first step in morphometric analysis of a drainage basin, based on hierarchy (Strahler, 1952). The classification of streams based on the number and type of tributary junctions, has proven to be a useful indicator of stream size, discharge, and drainage area (Strahler, 1957). Strahler’s method of stream ordering has been adopted and it was found that the Adula River basin is a 4th order drainage basin (Figure 3). The 1st order streams are generally flow during the wet season. Results shows the maximum stream order frequency of the Adula River is observed in case of first-order streams and then for second order.
4.1.2 Stream number (Nu)
Number of streams is also described as total counts of stream segments of different order separately and is inversely proportional to the stream order (Chandniha and Kansal 2017). Stream numbers of 1st, 2nd, 3rd and 4th order streams are 89, 19, 2 and 1, respectively. The number of streams segments gradually decrease with increase in stream order. High number of 1st order streams some time responsible for sudden flash floods after heavy rainfall.
4.1.3 Stream length (Lu)
Total length of stream segment in a particular order is represented as stream length (Lu). The each stream length is measured from source to mouth with the help of ArcGIS 10.1, arc tool on the basis of Horton’s law of stream length (Horton, 1945) ( Table 2).
Table 2. Morphometric analysis: linear aspects
|
Stream orders (u)
|
Stream numbers (Nu)
|
Stream length (Lu) in km
|
Mean stream length (Lsm) in km
|
Bifurcation ratio (Rb)
|
Mean bifurcation ratio (Rbm)
|
|
I
|
89
|
115.75
|
1.30
|
---
4.68
9.5
2
|
5.36
|
|
II
|
19
|
43.30
|
2.28
|
|
III
|
2
|
10.15
|
5.08
|
|
IV
|
1
|
41.01
|
41.01
|
4.1.4 Mean Stream Length (Lsm):
Mean stream length (Lsm) is a characteristic property related to the drainage network components and its associated basin surfaces (Strahler, 1964). It has been calculated by dividing the total stream length of each order by the total number of streams segments in that particular order. In the case of Adula River, the Lsm values exhibit the variation from 1.30 to 41.01.
4.1.5 Bifurcation ratio (Rb)
The bifurcation ratio is the ratio of the number of stream segments of given order to the number of segments of next higher order (Schumn, 1956). It is a dimensionless property and shows the degree of integration prevailing between streams of various orders in a drainage basin (Magesh et al., 2013). The results showed that the bifurcation ratio is not same for all orders. Geological and lithological development of the drainage basin may be the reason for these variations (Strahler, 1964). Low bifurcation ratio value indicates poor structural disturbance and the drainage patterns have not been distorted (Strahler, 1964), whereas the high bifurcation ratio value indicates high structural complexity and low permeability of the terrain (Magesh et al., 2013). Bifurcation ratio shows only a small variation for different regions on different environment except where powerful geological control dominates (Strahler, 1957). The value of bifurcation ratio of Adula River varies from 2 to 9.5 (Table 2).
4.1.6 Mean Bifurcation Ratio (Rbm)
Mean Bifurcation Ratio is the average of bifurcation ratios of all stream orders of a drainage system. Here, the mean bifurcation ratio of Adula River is 5.36 which indicates that there have some strong structural and morphological control over the drainage development (Table 2).
4.2 Areal Aspects
4.2.1 Form Factor (Ff)
Form factor is the numerical index which is commonly used to represent different basin shapes (Horton, 1932). The value of form factor is generally varies between 0.1-0.8. Smaller the value of form factor indicates elongated nature of the basin while higher value is the characteristics of a circular type basin. A near perfect circular basin has a form factor value of near to 0.8. In the case of River Adula the form factor value is 0.16 (Table 3), which indicating elongated shape of the basin.
Table 3. Morphometric analysis: areal aspects
|
Morphometric Parameters
|
Result
|
|
Basin area
|
265.18 (km2)
|
|
Basin perimeter
|
131.61 (km)
|
|
Form factor (Ff)
|
0.16
|
|
Elongation ratio (Re)
|
0.46
|
|
Circularity ratio (Rc)
|
0.19
|
|
Drainage density (Dd)
|
0.79 (km/km2)
|
|
Stream frequency (Fs)
|
0.42/ km2
|
|
Leminiscate ratio (K)
|
0.08
|
|
Drainage texture (R)
|
0.84
|
|
Constant of channel maintenance (Cc)
|
1.26 (km2/km)
|
|
Infiltration number (If)
|
0.33
|
|
Length of overland flow (Lg)
|
0.63
|
4.2.2 Elongation Ratio (Re)
Schumm (1956) defined it as the ratio between the diameter of the circle of the same area as the drainage basin and the maximum length of the basin. The value of elongation ratio ranges from 0 to 1. Values close to ‘1’ have very low relief with circular shape while values close to ‘0’ associated with high relief and steep slope with elongated shape. The elongation ratio of Adula River is 0.46 which indicates basin to be moderately elongated with moderately high relief and steep slope.
4.2.3 Circularity ratio (Rc)
It is the ratio of the basin area to the area of a circle having circumference as the perimeter of the basin. Circularity ratio is dimensionless and expresses the degree of circularity of the basin (Miller, 1953). Its value ranges between 0 to 1 and values close to 1.0 represent the more or less circular shape of the basin with structurally controlled. The circulatory ratio is mainly concerned with the length and frequency of streams, geological structures, land use land cover, climate, relief and slope of the basin. It is a significant ratio that indicates the dendritic stage of a watershed. Low, medium and high values of circularity ratio show the young, mature, and old phases of the life cycle of the tributary watershed (Wilson et al., 2012; Rai et al., 2017). The value of circularity ratio of Adula River basin is 0.19, which is the indication of elongated shape of basin with highly permeable homogenous geologic materials.
4.2.4 Drainage Density (Dd)
Drainage density is one of the important indicators of the landform element and provides a numerical measurement of landscape dissection and runoff potential (Chorley, 1969). It is defined as the total stream length in a given basin to the total area of the basin (Strahler, 1964). The drainage density in the study area is critically low (Figure 4). The drainage density of the study area has been classified into nine different textures. Comparatively high drainage density (>1.28 km/km2) was found at the central and the eastern most part of the basin. The main localities under this category are Samsherpur, Tahakari, Hivargaon etc. Low and moderate texture drainage density was found at the both northern and southern most part of the basin.
4.2.5 Stream Frequency (Fs)
The total number of stream segments of all orders per unit area is known as stream frequency (Horton, 1932). Stream frequency shows a positive association with drainage density suggesting an increase in stream population with increasing drainage density. The total number of stream segments of all orders per unit area is known as stream frequency (Horton, 1932). Stream frequency shows a positive association with drainage density suggesting an increase in stream population with increasing drainage density. Stream frequency mainly depends on the lithology of the basin and reflects the texture of the drainage network, infiltration capacity, vegetation cover, relief, nature and amount of rainfall and subsurface material permeability (Parveen et al., 2012; Damilola, 2016). The stream frequency has been classified into eight different classes (Figure 5). The mean stream frequency for the whole Adula River basin is 0.42/km2, which indicates low stream frequency. The low stream frequency indicates low degree of dissection and vice versa.
4.2.7 Leminiscate Ratio (K)
Leminiscate ratio expresses the sloping characteristics of a River basin. Generally Lower value of Leminiscate ratio indicates lower intensity of runoff and vice-versa. Low values represent basin nearly rounded and prevailing vertical and lateral erosions, which refer to geomorphic stage of development for a basin (Ashour and Torab, 1991). The calculated leminiscate ratio of the Adula River basin is 0.08, which indicate the runoff was critically low in the basin.
4.2.8 Drainage Texture (R)
Drainage Texture (R) is one of the significant concept in River morphometry which means that the relative spacing of stream lines. Drainage texture is the product of number of stream and drainage perimeter. Low drainage density is the indication of coarse drainage texture while high drainage density indicates fine drainage texture. Drainage texture of Adula River basin is 0.84, which is indication of coarse texture river basin.
4.2.9 Constant of channel maintenance (Cc)
The constant of channel maintenance indicates the relative size of landform units in a drainage basin and has a specific genetic connotation (Strahler, 1957). It is depending on different types of geomorphological characteristics like, rock type permeability, climatic regime, vegetation etc. Constant of channel maintenance of Adula river basin is 1.26 km2/km.
4.2.10 Infiltration Number (If)
Infiltration number (If) of a River basin is the product of drainage density and stream frequency, which helps to understand the infiltration characteristics of the basin. It provides a significant idea about the infiltration characteristics of River basin area. It is inversely proportional to the infiltration capacity of the basin. The higher the infiltration number, the lower will be the infiltration and the higher run-off (Rai et al., 2017). The infiltration number of Adula River basin is 0.33, which indicating that the infiltration capacity is very high resulting in very low runoff.
4.2.11 Length of Overland Flow (Lg)
Length of overland flow (Lg) is one of the most vital self-governing variables affecting hydrologic and physiographic development of drainage basin (Horton, 1932; Javed et al., 2011). It is inversely proportional to half of reciprocal of drainage density and is the length of water over the ground before it gets concentrated into definite stream channels (Horton, 1945). The length of overland flow of the Adula River basin is 0.63 (Table 3), which shows moderately low surface runoff of the basin.
4.3 Relief Aspects
4.3.1 Absolute relief
Absolute relief contains maximum altitude at each point. Absolute relief of entire Adula River basin is divided into five categories (Figure 6). High absolute relief (>997m) was found in the western most part of the basin, basically in the upper catchment area. The absolute relief is gradually decrees towards the mouth of the river. Central portion of the basin and some small pockets shows the moderate type of absolute relative relief.
4.3.2 Aspect map
Aspect map generally refers to the direction to which a mountain slope faces. The aspect map is a very important parameter to understand impact of sun on local climate of the area. Generally west facing slope showing the hottest time of day in the afternoon and in most cases a west-facing slope will be warmer than sheltered an east-facing slope (Singh et al., 2014). Aspect has significant effects on growth and type’s vegetation distribution of an area. The aspect map of the Adula River Basin was derived from ASTER DEM. The slope aspects of entire basin is divided into ten categories: Flat-1, North- 0-22.50, Northeast- 22.5-67.50, East- 67.5-112.50, Southeast- 112.5-157.50, South- 157.5-202.50, Southwest- 202.5-247.50,West- 247.5-292.50, Northwest- 292.5-337.50, North- 337.5-360. Principal stream of the area is flowing from north-west to south-east direction. Aspect map (Figure 7) of Adula River basin indicates that the west to south-west facing slope are dominant along the left bank of the principal.
4.3.3 Relative relief (Rr)
The relative relief (Rr) represents actual variation of altitude in a unit area with respect to its local base level. The relative relief does not take into account the dynamic potential of the terrain but as it is closely associated with slopes and it is more expressive and also useful in understanding the morphogenesis of this region (Bhunia et al., 2012). Relative relief of entire study area is divided into five categories (Figure 8). High relative relief (>205m) was found in the upper most part of the basin and some small pockets of high relative relief were also illustrated in the western and central part of the basin. Moderately relative relief (158 -205m) found in the central and western most part of the basin. Lowest relative relief (<105m) was found in the eastern most part of the basin.
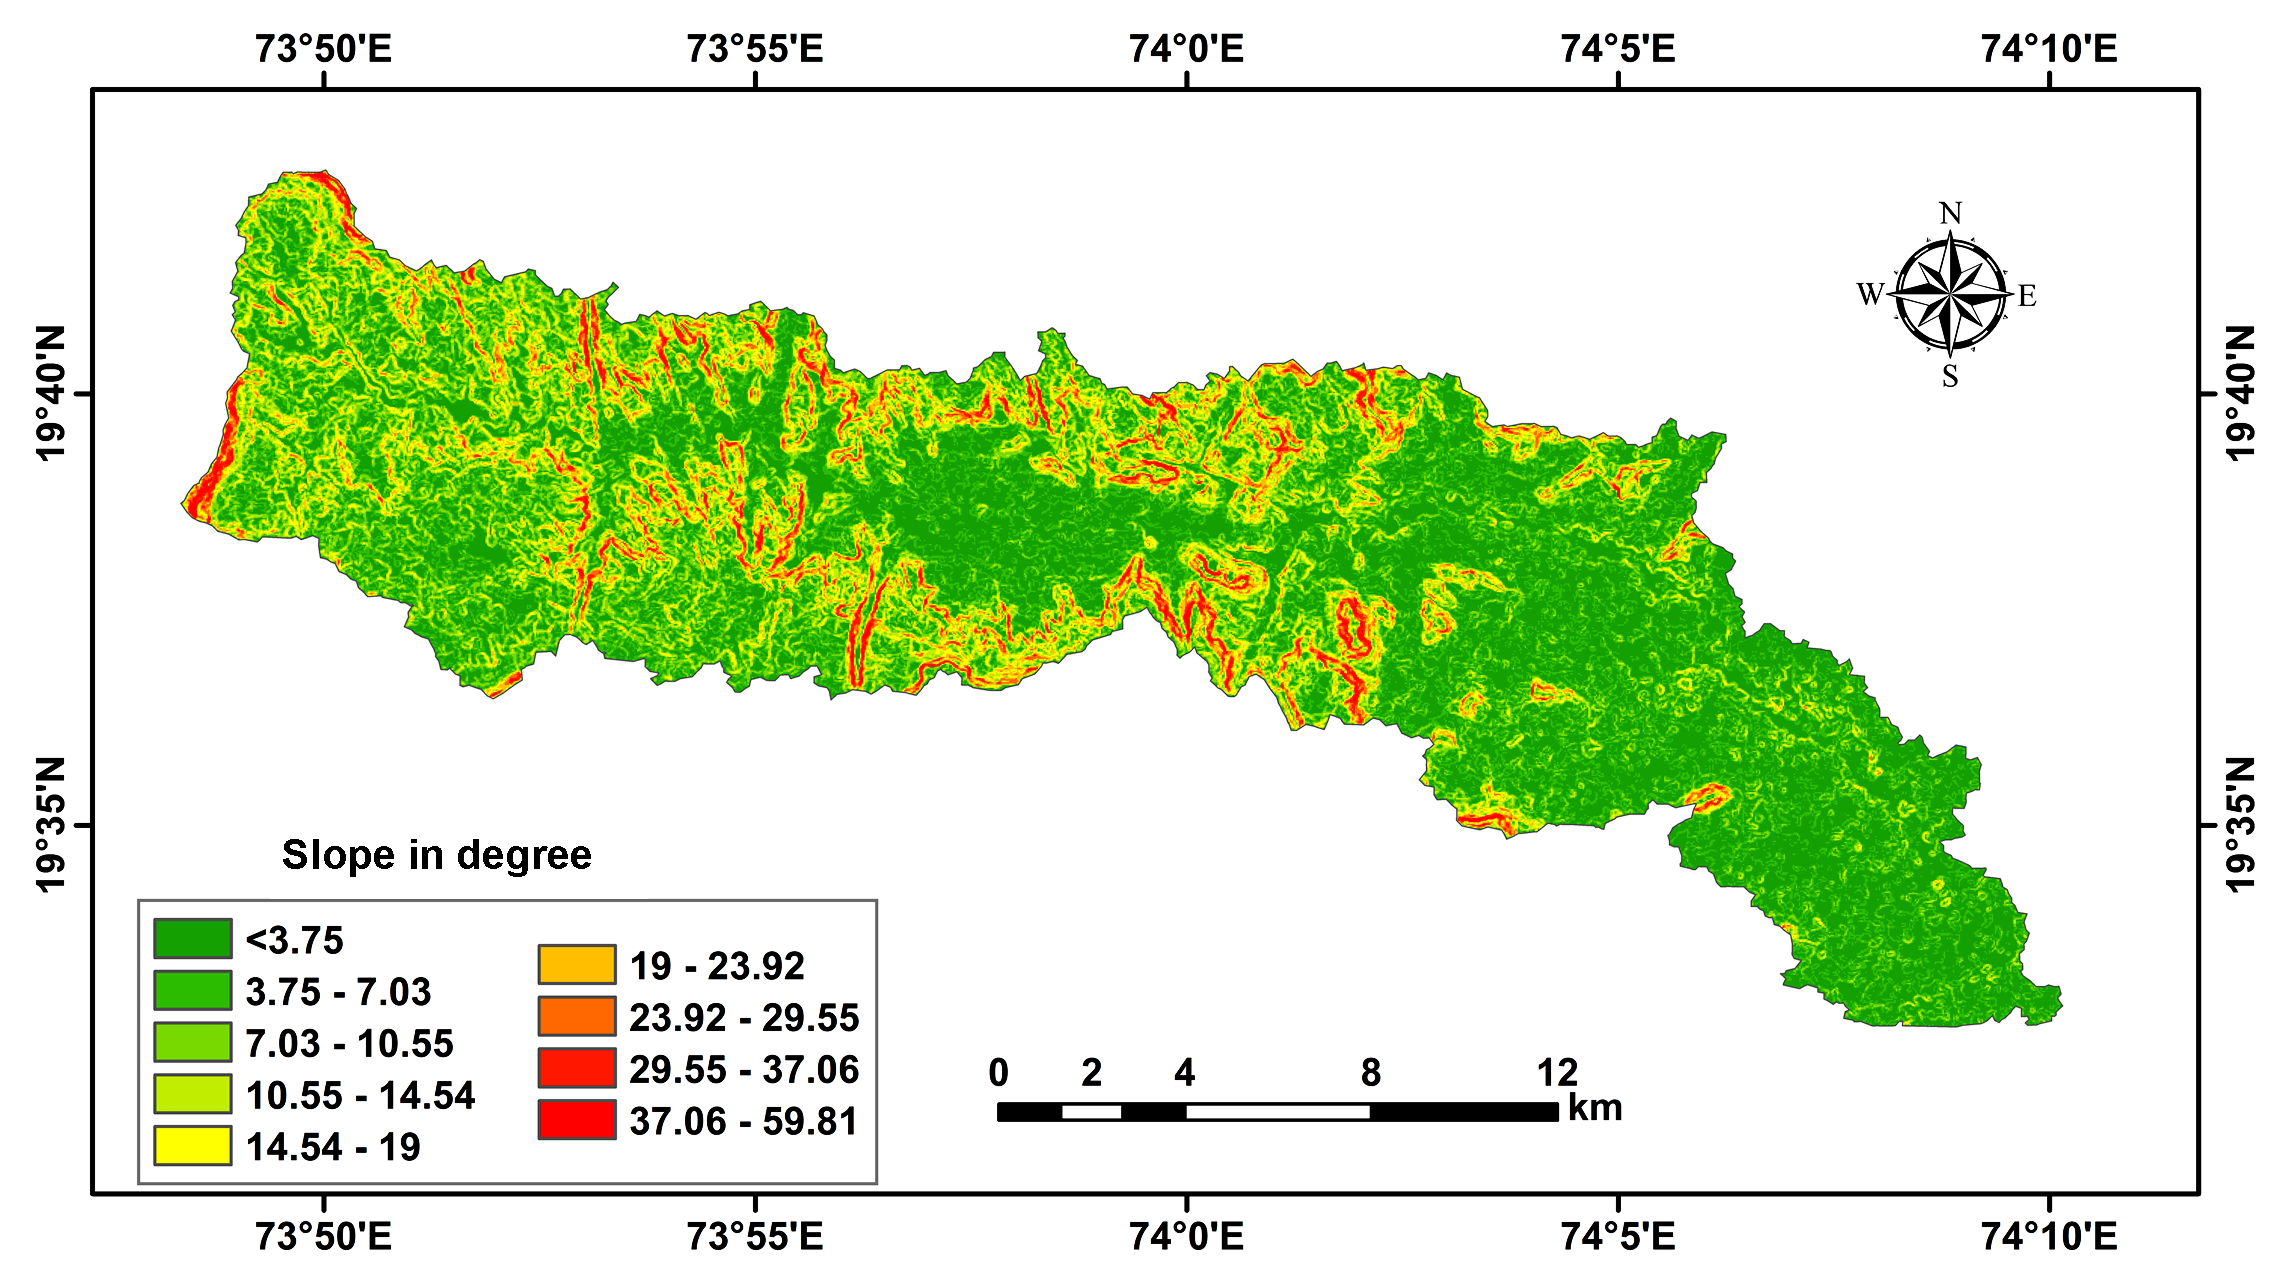
4.3.4 Slope
The slope angle indicates the magnitude of the component of the gravitational surface acting to produce movement of solid bodies, water or soil particles down a slope (Strahler, 1956). Slope is a significant morphological parameter which directly controls infiltration and runoff of any terrain. The slope map for Adula River basin (Figure 9) was developed with the help of DEM using Arc GIS Spatial Analyst tools. About 83.83% area of Adula River basin comes under gentle and moderate slope (<14.54), which indicates nearly flat terrain and most favorable for infiltration.
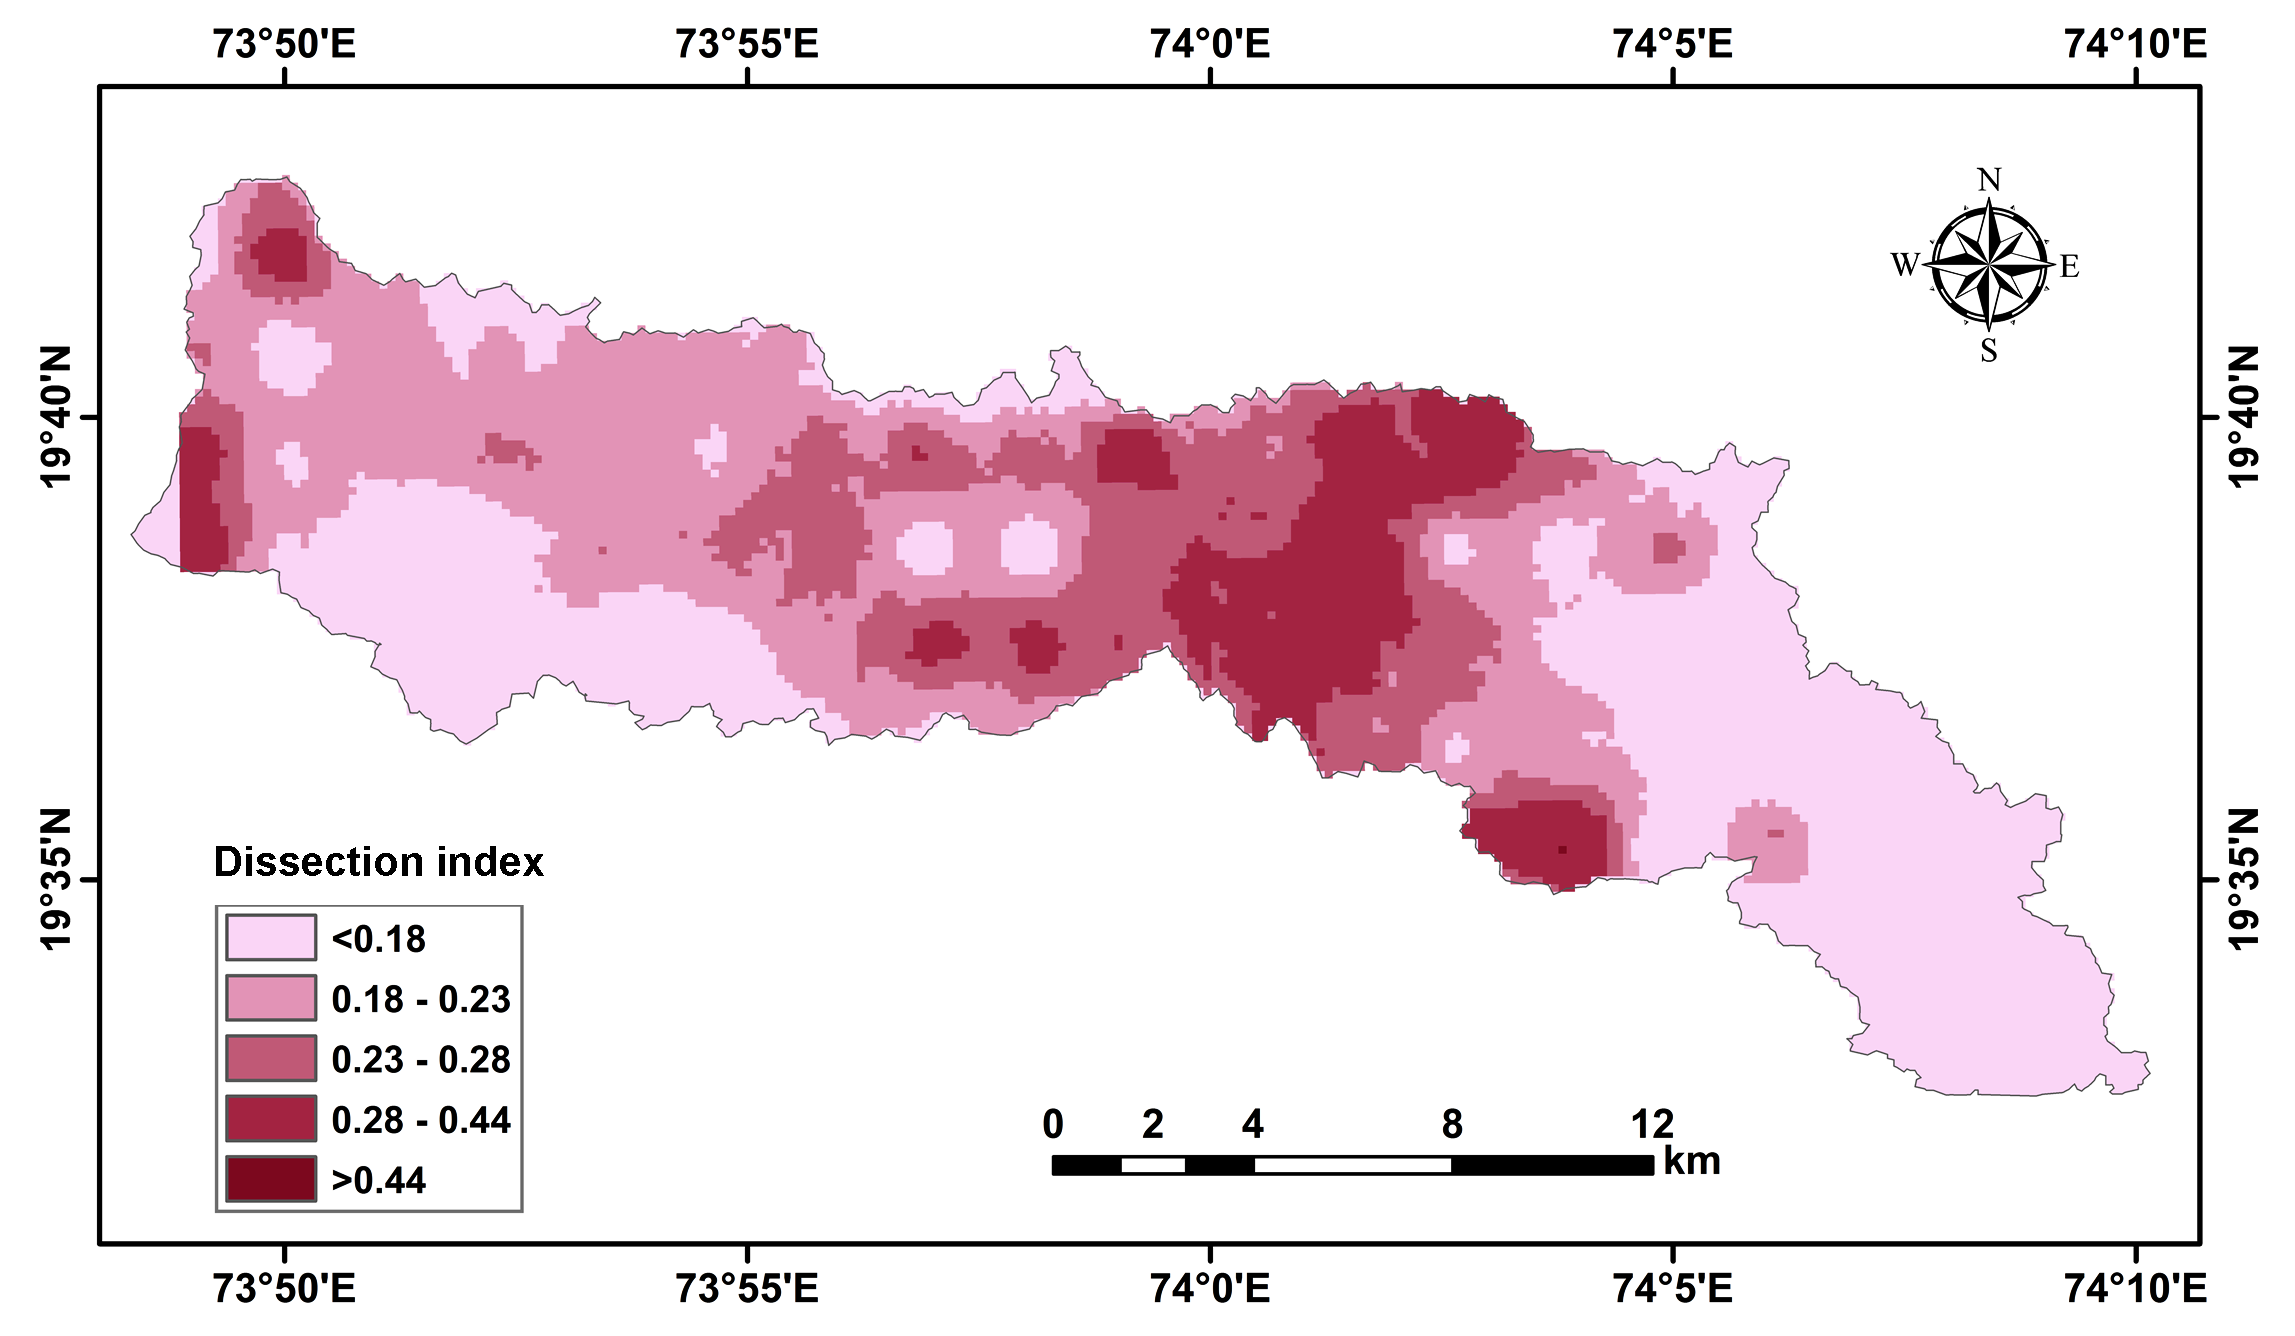
4.3.5 Dissection Index (Di)
Dissection index (Di) is expressing the ratio of the maximum relative relief to maximum absolute relief. It is an important morphometric indicator of the nature and magnitude of dissection of terrain (Singh, 2000). The value of dissection index varies from zero to one, where zero indicates complete absence of dissection and one indicates vertical cliff. Generally, low ‘Di’ corresponds with the subdued relief or old stage, and with low relative relief. Conversely, the areas with high ‘Di’ indicate high relative relief where slope of the land is steep (Deen, 1982). The dissection index, for the study are varies from 0.18 to 0.49. It has been classified into five categories (Figure 10). Very low (<0.18) dissection index has been found mostly in the eastern part of the basin i.e. Chikhali, Rajapur, Biroba wasti, Dongargaon area. Moderate to moderately high (0.18-0.28) dissection index was found Northwestern part of the basin. High dissection index (>0.44) found at the central and the western most part of the basin. The main localities under this category are Deothan, Kokanwadi, Chandgirwadi, etc.
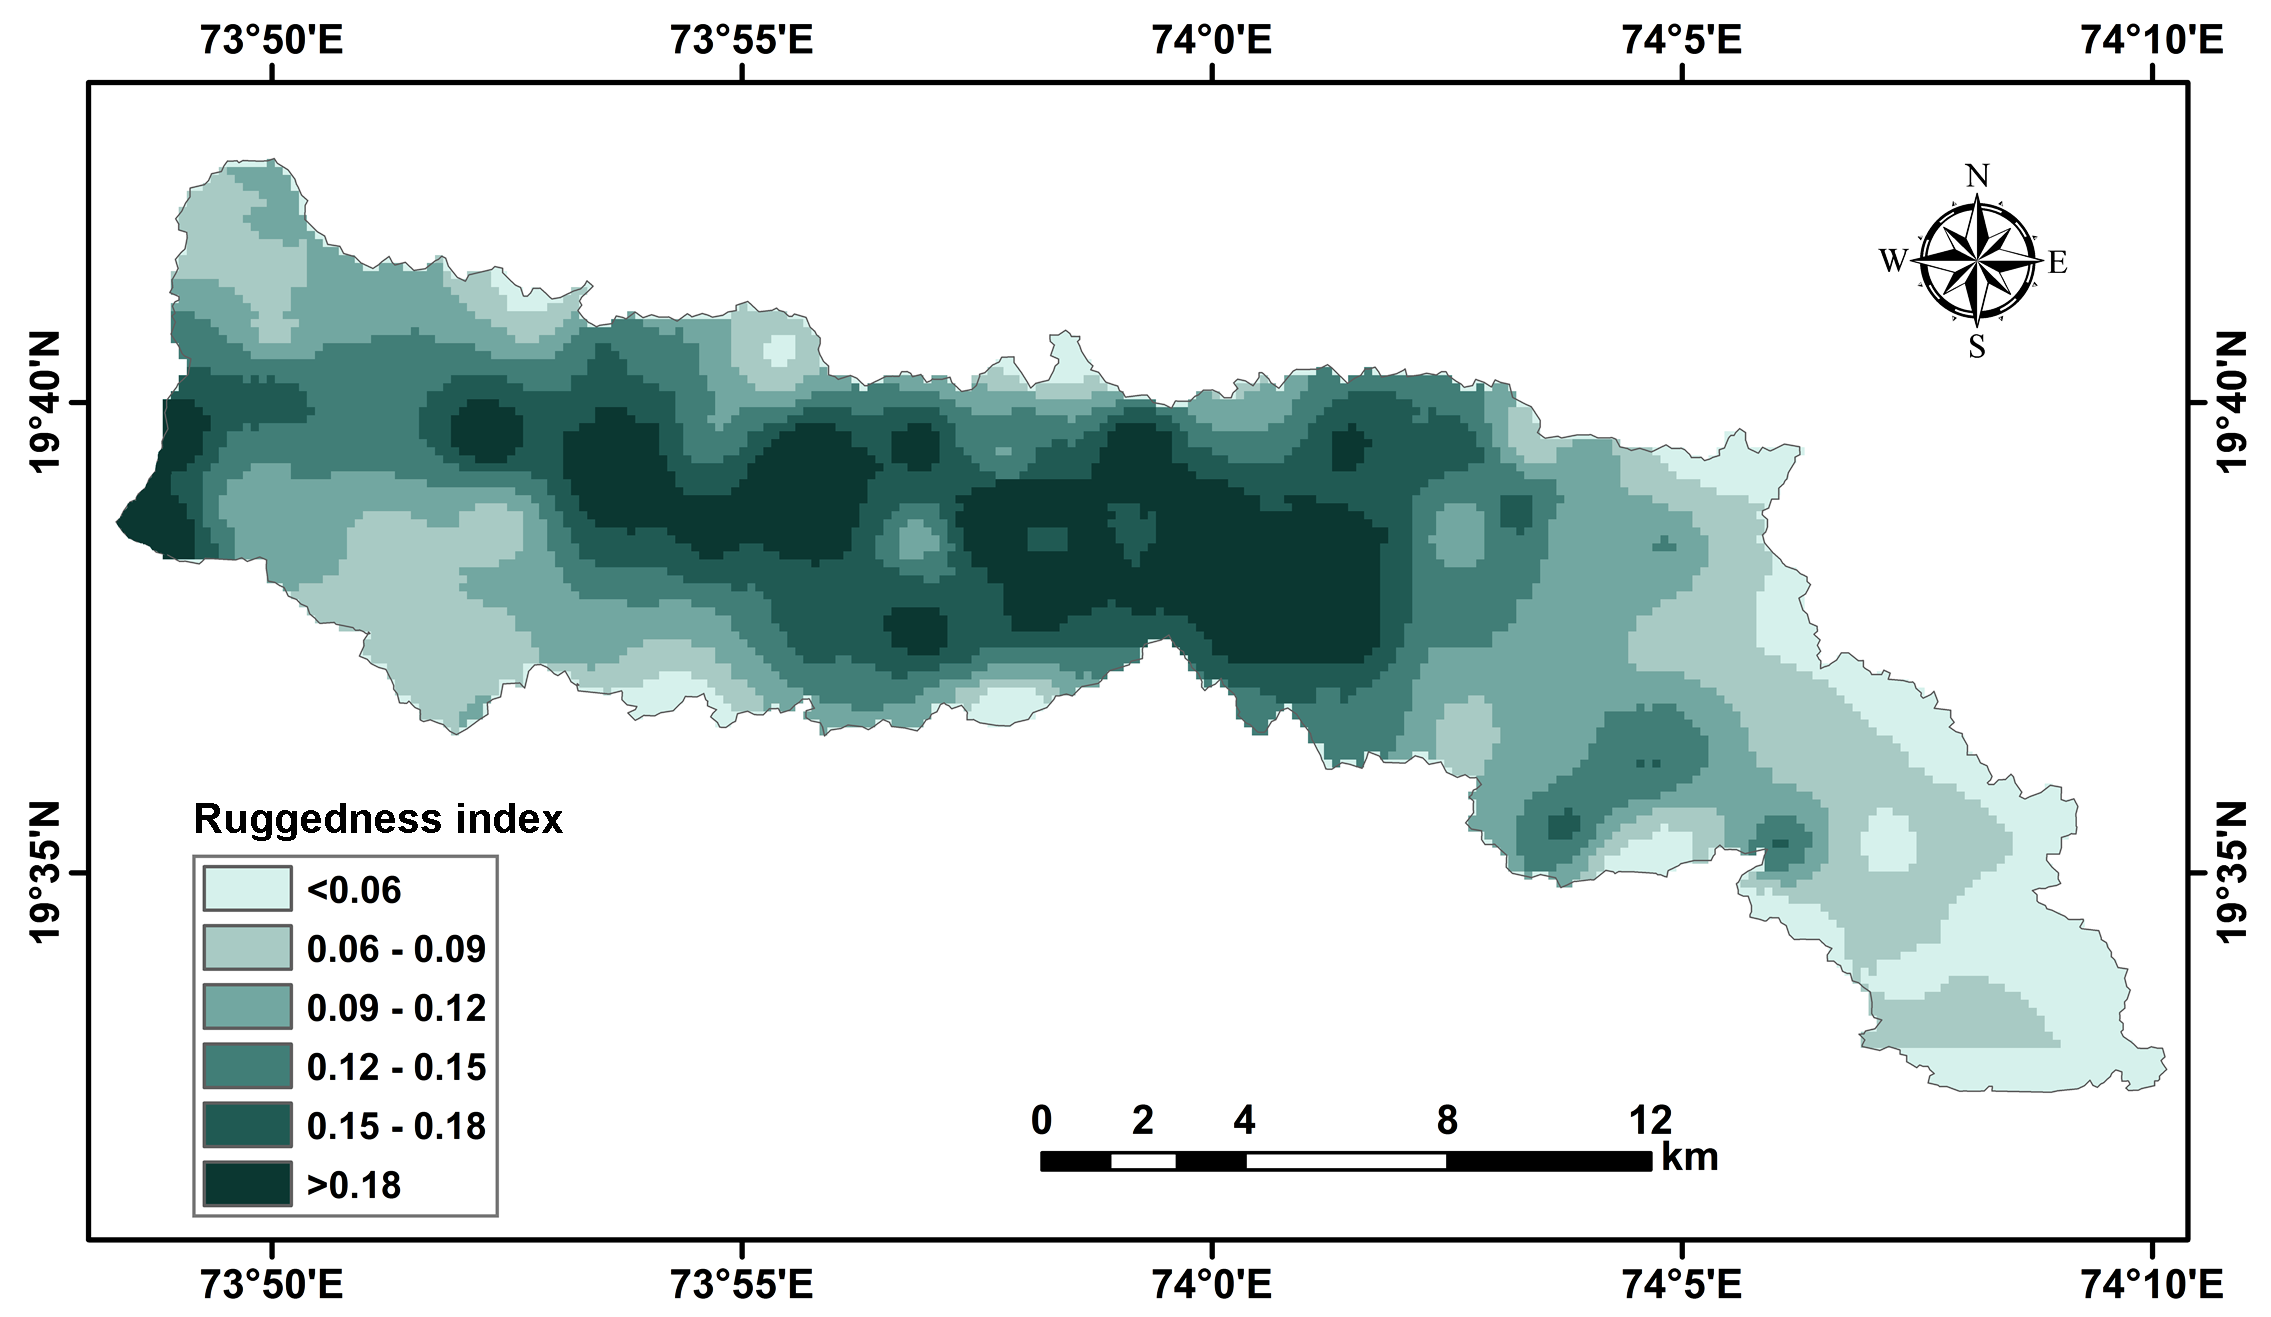
4.3.6 Ruggedness Index
Ruggedness Index indicates roughness of the terrain and the degree of dissection of topography where drainage has considered as an important parameter. This index is being widely used by the earth scientists in connection with the morphological studies of terrain and it leads to better understanding of the surface configuration evolved under complex geomorphic processes. This index reflects the combined effects of evolutionary rhythmic processes in the development of relief (Prakasam and Biswas, 2012; Mukhopadhyay, 1984). Ruggedness index (Figure 11) varies from 0.04 to 0.21.


 ,
Bhabani Prasad Mukhopadhyay 1
,
Bhabani Prasad Mukhopadhyay 1