Abstract
Most of the people infected in Morocco are triggered by the outbreak of COVID-19. The number of affected cases is currently rising day by day. As of July 16th, 2020, In Morocco, 15,165 cases were tested positive for COVID-19, including 239 deaths and 11,417 patients cured the highest number of Corona virus cases reported as Ministry of Health Department in Morocco. The COVID-19 virus threatens the health, economy, development and social life of individuals. The city needs to be conscious of the fight against this epidemic. GIS technology has played an important role in many aspects, including geospatial perception, geostatistical simulation and spatial knowledge enabling decision-making, mitigation and prediction including COVID-19. GIS has evolved reasonably rapidly and has a full technical route for data processing, modeling and map creation. However, in the battle against the popular endemic, the key challenge is to find ways of controlling conventional technological methods and to increase the quality and accuracy of the knowledge provided for social management. As a consequence, IDW and computational approaches are used to forecast potential cases in the region. Prediction of different parameters existing confirmed events, death and recovery of COVID-19. See reports have been used to take proactive measures in order to penetrate regions. The suggested method of understanding is effective within a certain context and would be a valuable tool for both governments and health authorities.
1 . INTRODUCTION
Since December 31, 2019, the Centers for Disease Control and Prevention and Chinese health authorities have complied with the emergence of the new coronavirus of unknown origin in Wuhan, China. The disease has been named by Coronavirus Disease “Covid-19” (CDC, 2020). Epidemiologists, infectiologists and biologists are analyzing the data collected from the first diseases in China. They have detected that this virus manifests itself as a pneumonic syndrome (Bouaré, 2020; CCDCP, 2020). On February 28, 2020, the UN Secretary General called on governments to take preventive measures against the spread of COVID-19, which continues to spread throughout the world, it has contaminated more than 13,604,293 people and 585,611 decided until July 16, 2020 (WHO, 2020). Infected cases have been registered in all continents; Africa (540,682 cases), Americas (7,149,551 cases), Eastern Mediterranean (1,346,708 cases), Europe (3,008,439 cases), South-East Asia (1,306,832 cases) and Western Pacific (252,081 cases). Most of the recorded deaths are in the United States of America (135,807 deaths), Brazil (74,133 deaths), The United Kingdom (45,053 deaths) and Italy (34,997 deaths). In Morocco, 15,165 cases were tested positive for COVID-19, including 239 deaths and 11, 417 patients cured (MMH, 2020).
In recent years, Geographic Information System (GIS), mapping and geostatistics have been used to assist in the interpretation and analysis of the geographic distribution of diseases in areas at risk. These tools play a very important role in the prevention and control of spread of epidemic (Jerrett et al., 2010; CAICT, 2020; Maged et al., 2020; Zhou et al., 2020). GIS plays a very important role in the field of health, monitoring the spread of a disease in a region and the spatial and temporal follow-up of this transmission (Ding et al., 2011; Shaw, 2012; Cheng et al., 2012; Bhunia et al., 2013). Specialists and GIS experts have confirmed that there is complementarity and congruence between health data and map processing (Brooker et al., 2009). GIS facilitates the representation, analysis and characterization of the spatial (spatiotemporal) component of health phenomena. In general, GIS technology is opening up new opportunities for epidemiologists to study and identify health black spots (Helene et al., 2010; Bagyaraj et al., 2020). They also hold a huge array of resolution options, which can be beneficial for prevention and health empowerment initiatives, disease care and proper adjustment (Lyseen et al., 2014). Spatial geostatistics has been applied in various fields such as, hydrology (Schreider et al. 1997; Kawo and Karuppannan, 2018), climatology (Kurtzman and Kadmon, 1999; Anis and Saeed, 2006), agriculture (Robinson and Metternicht, 2003; Quenum, 2009) and more recently in epidemiology (Jayakumar and Malarvannan, 2013; Qayssar et al., 2018; Bagyaraj et al., 2020). Spatial interpolation methods can be broadly classified into two categories:
1. Deterministic/empirical methods (Willmott and Matsuura, 1995; Kurtzman and Kadmon, 1999): These are based on purely mathematical properties that express either a weighting factor for training values or a trend surface: The Inverse Distance Weighted (IDW), Global Polynomial Interpolation (GPI), Radial Basis Functions (RBF) and Local Polynomial Interpolation (LPI).
2. Probabilistic methods (Bronowicka et al., 2019): Stochastic methods (geostatistics), they are based on the principle of spatial autocorrelation which recommends that close observations in space have similar characteristics, they are distinguished by the calculation of associated estimation errors (Krige, 1966; Matheron, 1963; Holdaway, 1996; Laborde, 2000)- Kriging and Cokriging; Areal Interpolation (AI); Empirical Bayesian Kriging (EBK).
The purpose of this work is to demonstrate the contribution of GIS and geospatialization to the distribution and mapping of COVID-19 using ArcGis and the geostatistical analyst extension.
2 . DATA AND METHODS
Historical data of COVID-2019 infected persons (16 July 2020) were collected and used in this study, from the official website of the Johns Hopkins University. (Benvenuto et al., 2020) and from the official coronavirus monitoring website in Morocco (WHO, 2020; MMH, 2020).
Inverse distance weighting (IDW) method is the most widely used in the GIS program to map and spatialize the spread of vector-borne diseases. This modern approach helps decision makers in surveillance since the IDW method is accurate and more precise (Childs, 2004; Katharina et al., 2011; Kheirandish et al., 2012; Bhunia et al., 2013; Bao et al., 2014; Kawo and Karuppannan, 2018; Qayssar et al., 2018; Bagyaraj et al., 2020). The main factor affecting the accuracy of the IDW is the value of the power p (Burrough and McDonnell, 1998). Thus, the relevance and accuracy of the IDW is influenced by neighborhood size and the number of neighbors.
The IDW is expressed mathematically (equation 1) according to Johnston et al. (2001):
\(Z_0 = {\sum^N_{i=1}Z_i.d_i^{-n} \over \sum^N_{i=1} d_i^{-n}}\) (1)
where,
\(Z_0\) is the estimation value of variable z in point 1;
\(Z_i\) is the sample value in point 1;
\(d_i\) is the distance of sample point to estimated point;
N is the coefficient that determines weigh based on a distance;
n is the total number of predictions for each validation cases.
4 . RESULTS AND DISCUSSIONS
4.1 Evolution of COVID-19 Disease
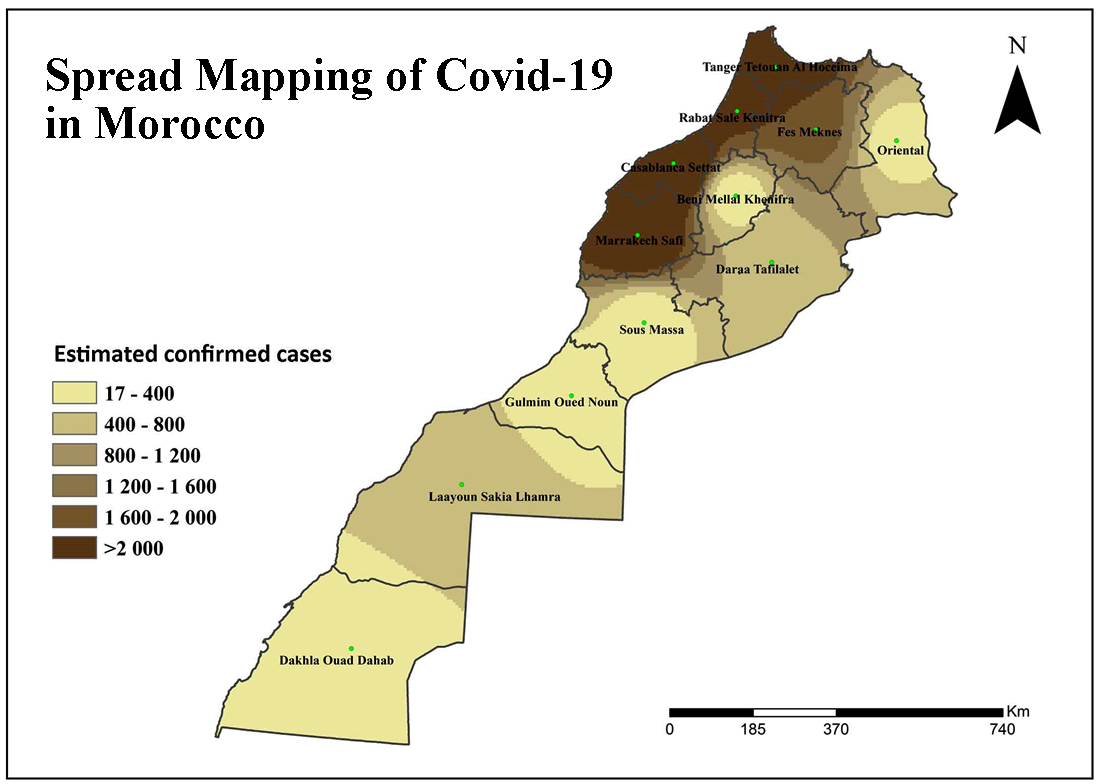
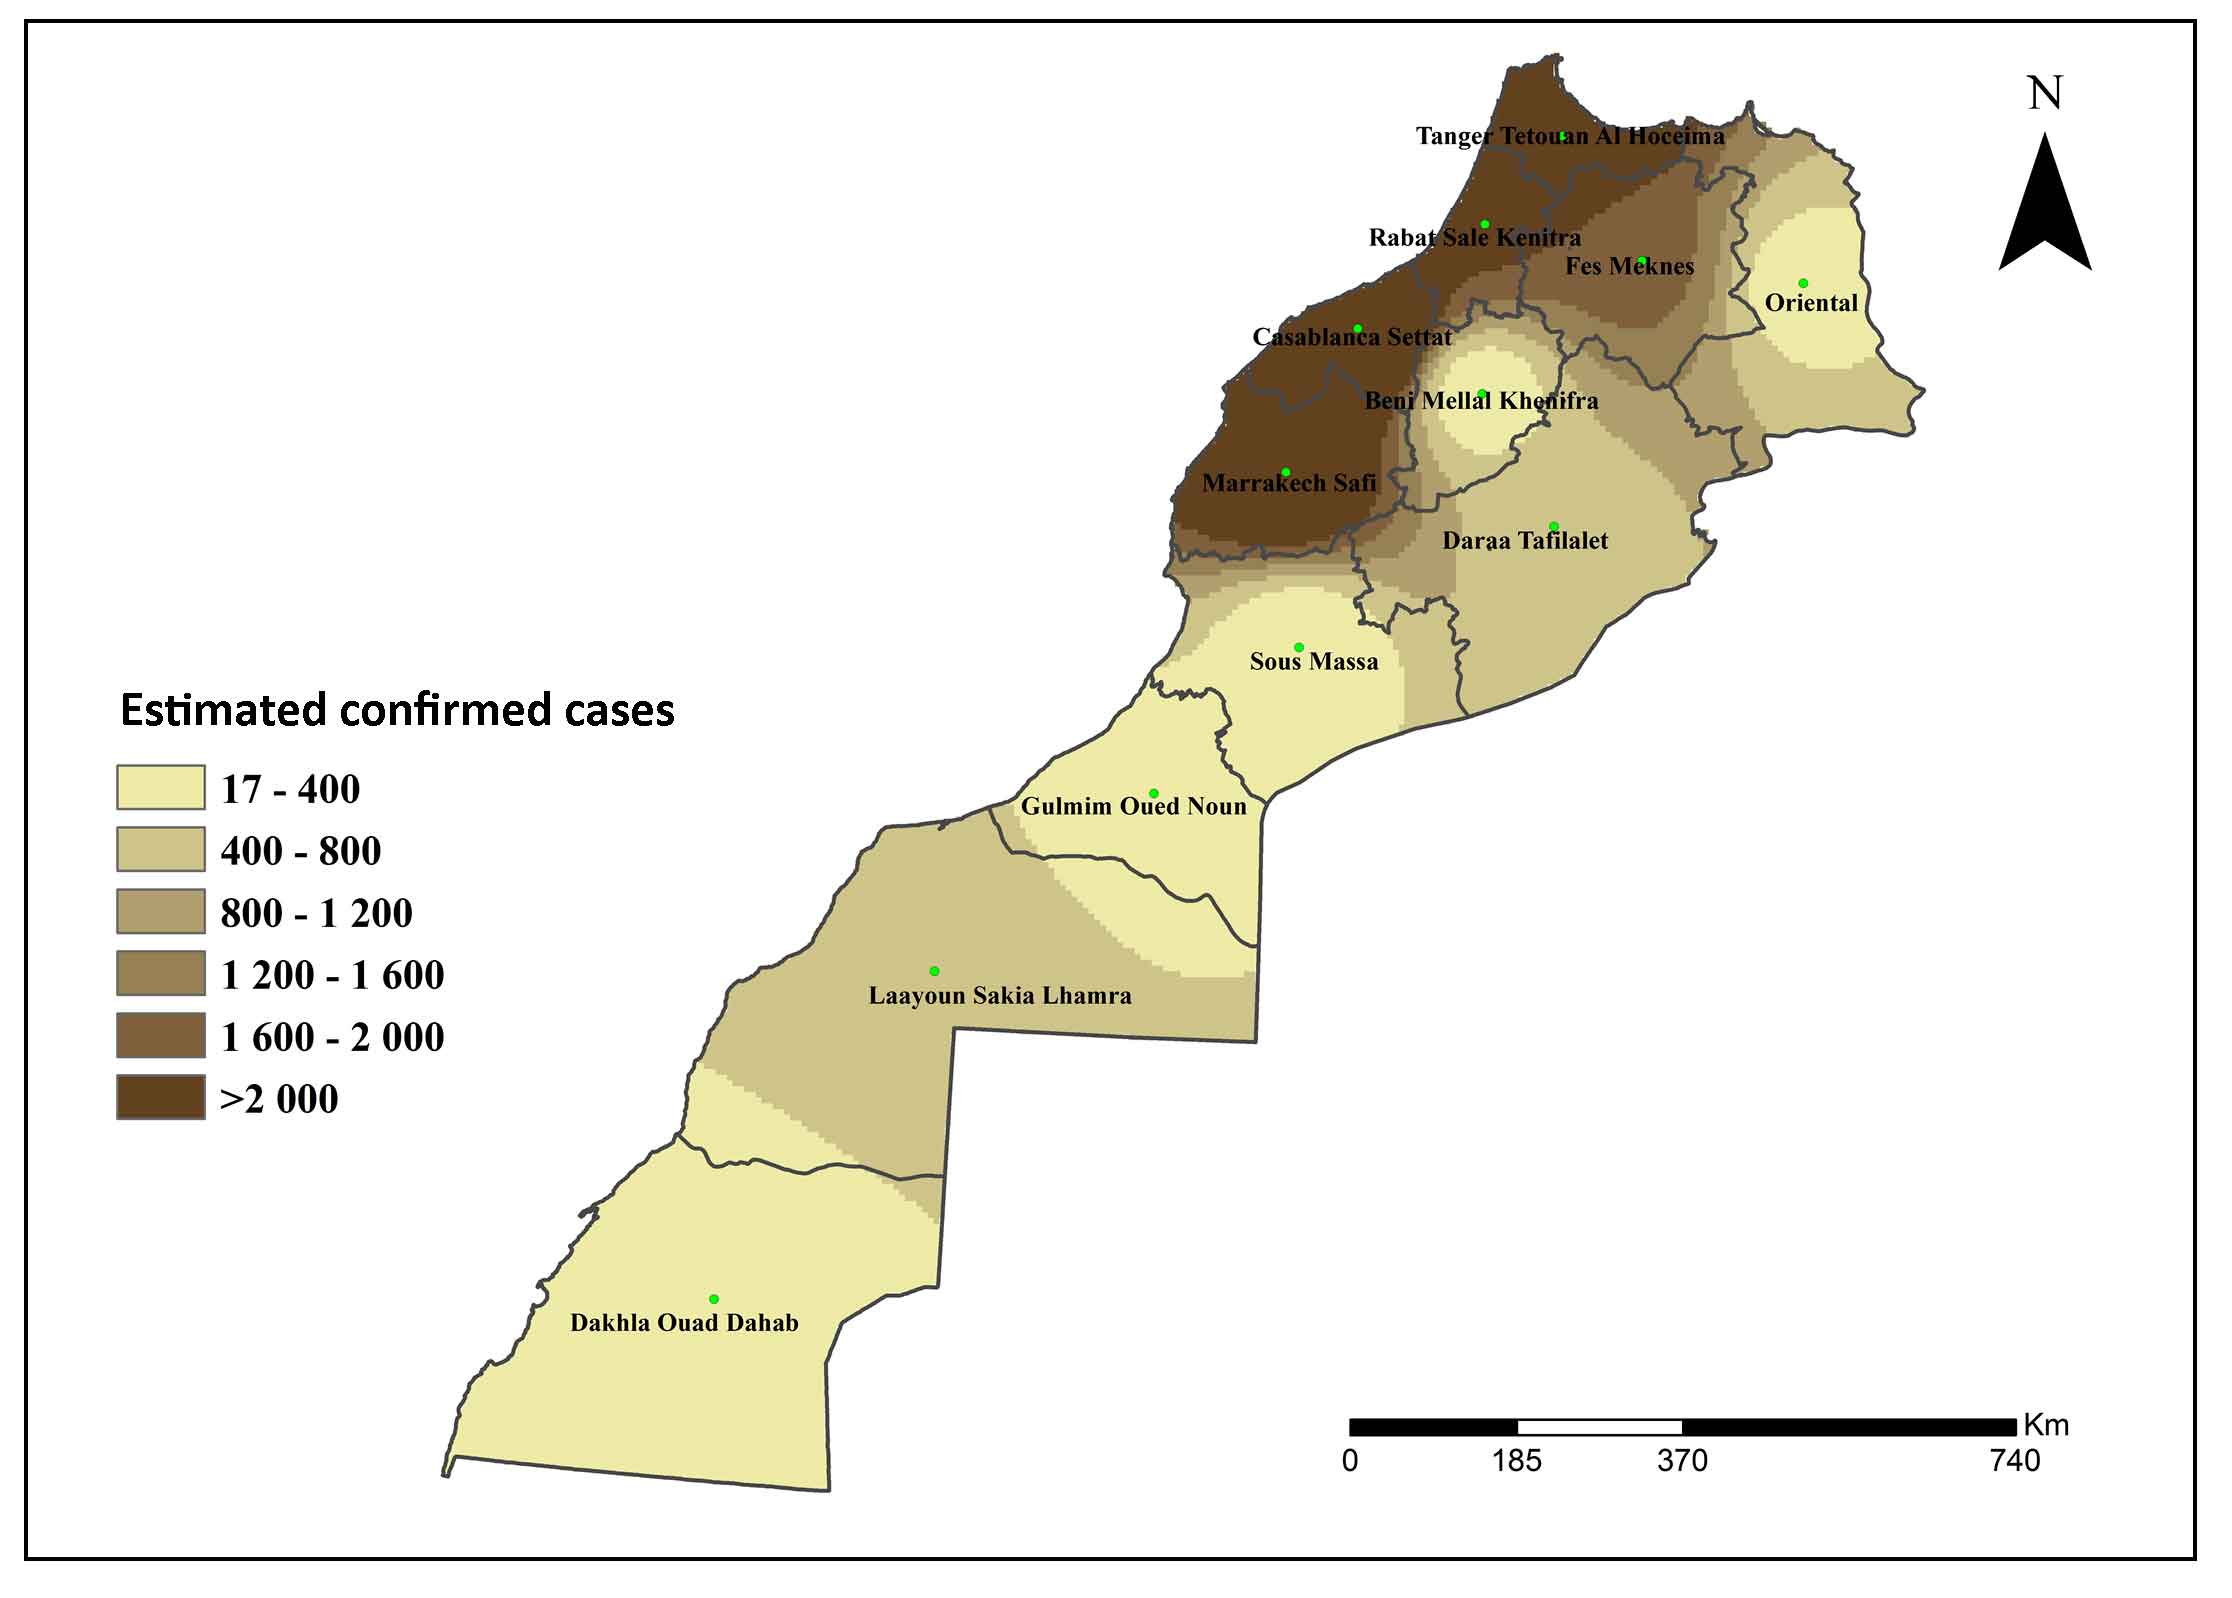
Morocco has recorded 15,165 cases of COVID-19 contamination since the beginning of the pandemic on 2 March 2020, including 239 deaths and 11, 417 people cured, while the number of cases excluded after negative results amounts to 940,132 (Table 2) (MMH, 2020). According to the Minister of Health, the two most affected regions remain “Casablanca-Settat”, “Marrakech-Safi” and “Tanger-Tetouan-Al Hoceïma”, “Rabat-Sale-Kenitra”, with more than 75.34% of confirmed cases.
Table 2. Distribution of confirmed cases, decided and recoveries of COVID-19 in Morocco
|
Name of the region
|
Cases
|
|
Confirmed
|
Decided
|
Recovered
|
|
Tanger-Tétouan-Al Hoceïma
|
2966
|
56
|
2269
|
|
L'Oriental
|
248
|
8
|
184
|
|
Fès-Meknès
|
1697
|
29
|
1264
|
|
Rabat-Salé-Kénitra
|
2032
|
12
|
1864
|
|
Béni Mellal-Khénifra
|
165
|
7
|
101
|
|
Casablanca-Settat
|
3713
|
53
|
2628
|
|
Marrakech-Safi
|
2714
|
58
|
1960
|
|
Drâa-Tafilalet
|
586
|
5
|
586
|
|
Souss-Massa
|
97
|
7
|
85
|
|
Guelmim-Oued Noun
|
135
|
3
|
72
|
|
Laâyoune-Sakia El Hamra
|
795
|
1
|
394
|
|
Dakhla-Oued Ed-Dahab
|
17
|
0
|
10
|
Source: Ministry of Health, Morocco (16th July 2020)
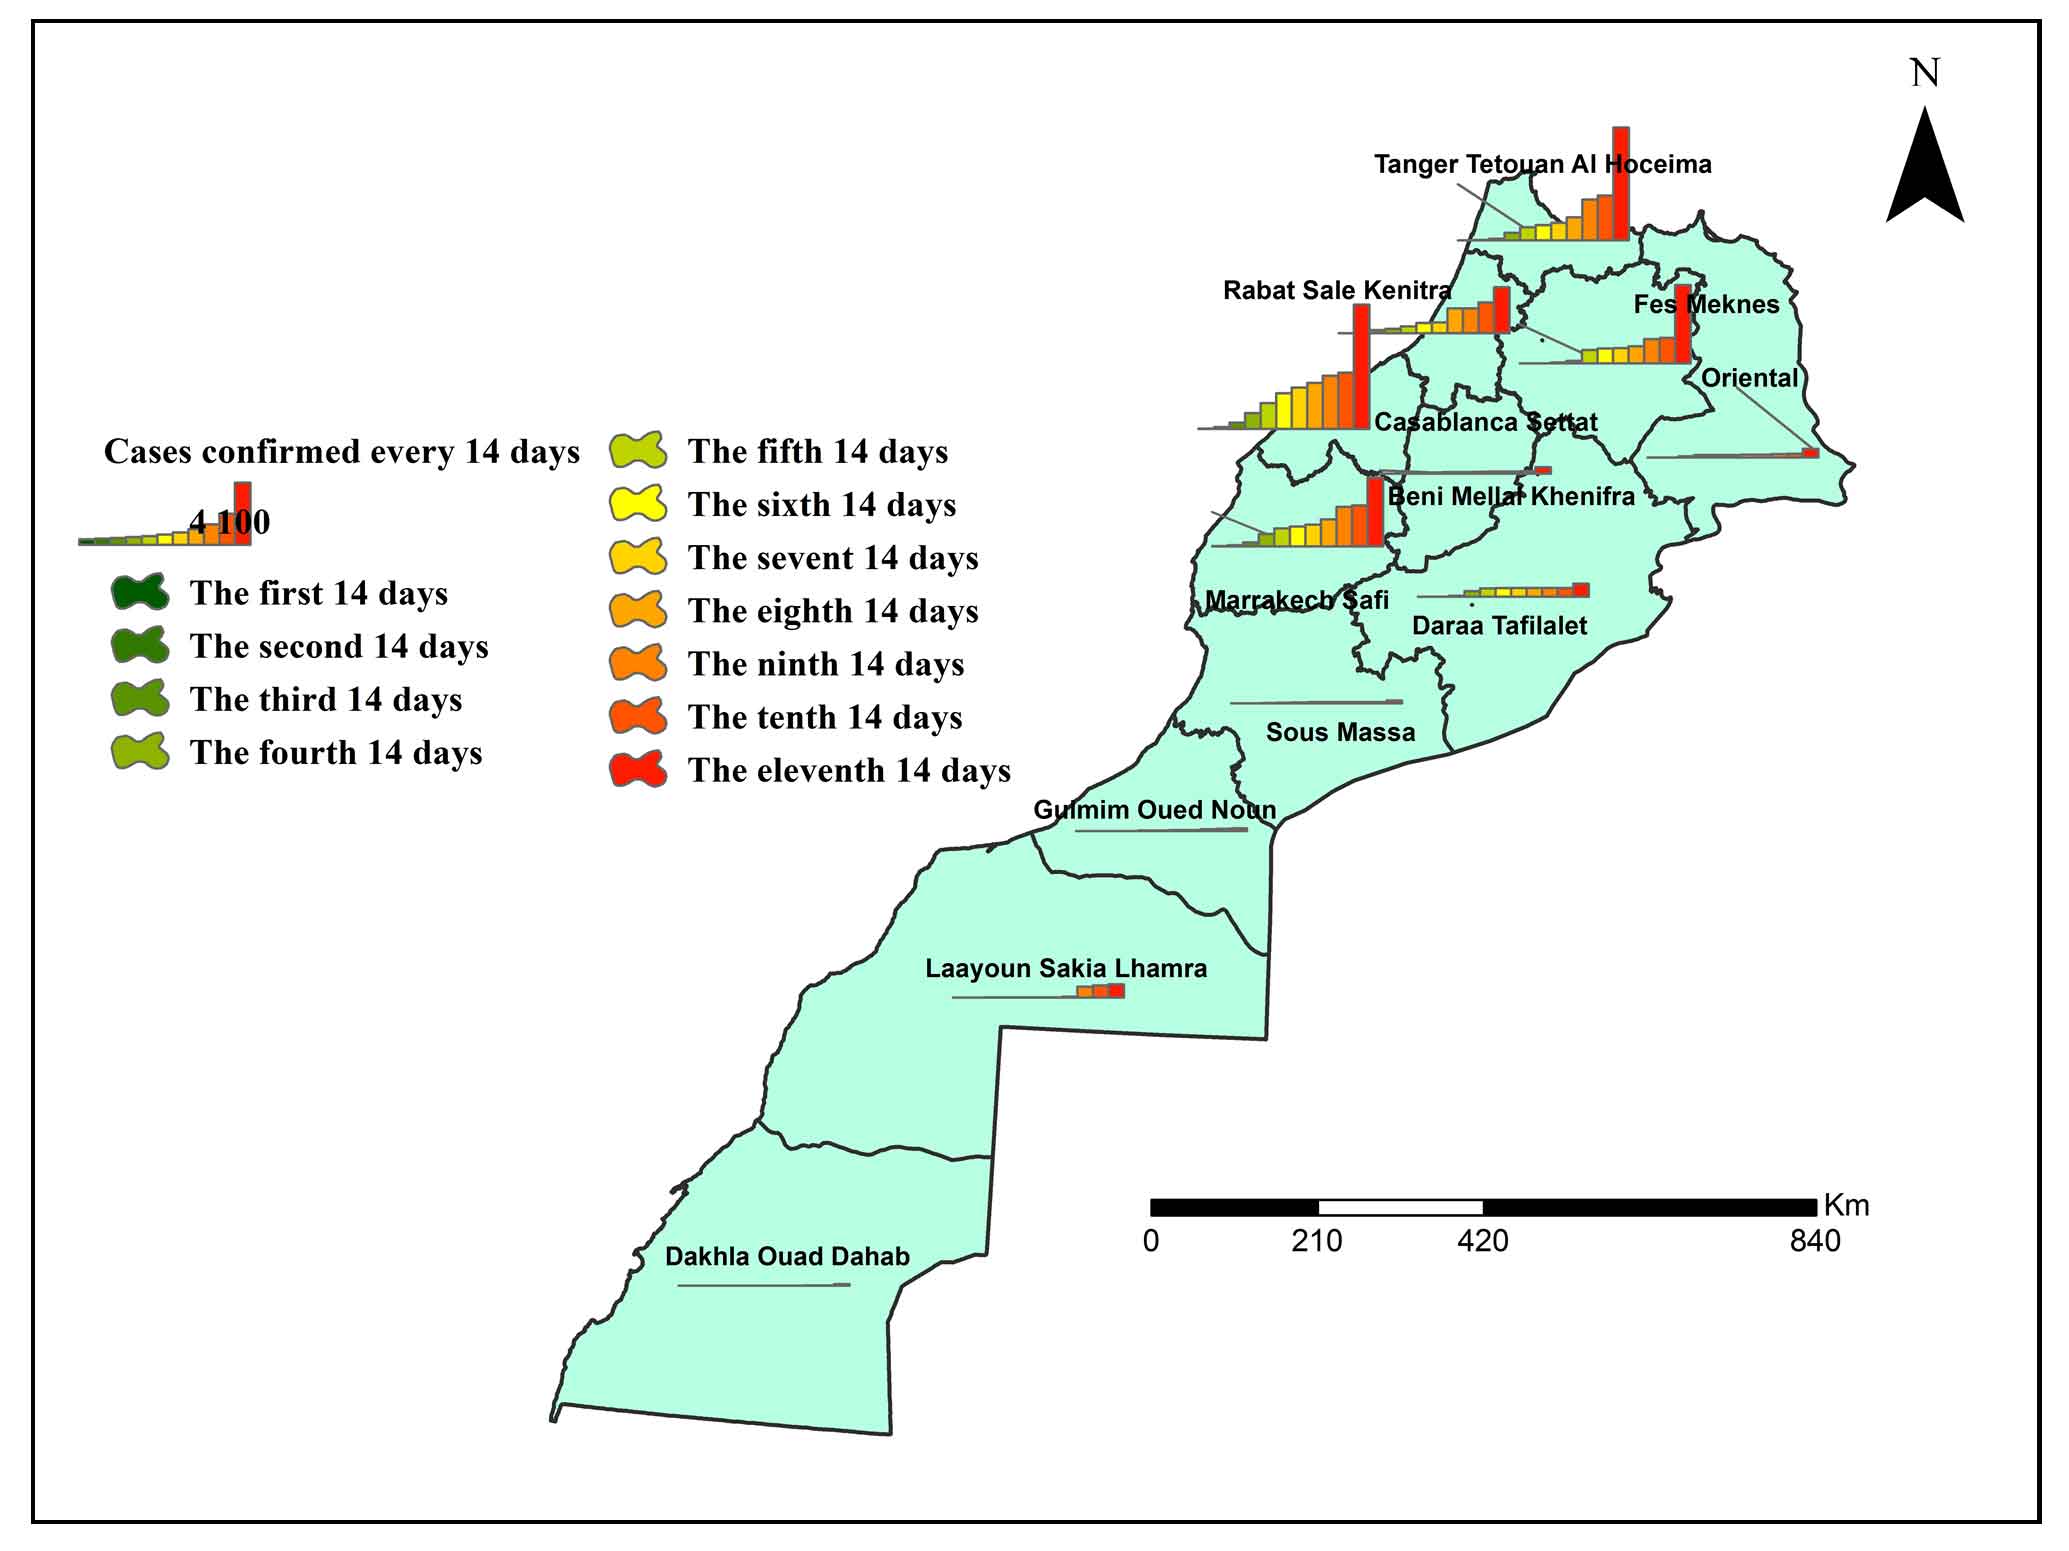
4.2 Evolution of COVID-19 for Every 14 Days
People can become infected with Coronavirus disease (Covid-19) because of other people infected with this virus. The disease may not be spread from person to person. The duration of onset of symptoms varies from one day to 14 days (Victor, 2020; Tian et al., 2020; WHO, 2020). The map (Figure 2) shows the evolution of COVID-19 infections every 14 days.
From the map (Figure 4), it can be seen that the evolution of confirmed cases is regular according to the 14 days period notably in the regions of Casablanca-Settat, Marrakech-Safi, Tanger,-Tétouan-Al Hoceïma and Rabat-Sale-Kenitra. On the other hand, the evolution is irregular in the region of Fes-Meknes and Daraa-Tafillat, where the appearance of cases increased intensely during the eighth 14 days period. This can be explained by a sudden lack of compliance with containment in these two regions. Concerning the rest of the regions in Morocco, it is noted that the evolution of the coronavirus is almost stable in fairly low values.
4.3 Exploratory Analysis
According to Table 3, it can be noticed that the distribution of Covid-19 in Morocco is characterized by an asymmetry coefficient (S) equal to (0.65242) which is greater than 0 and therefore an asymmetry towards the right and by a flattening coefficient (K) equal to (1.9468) which is less than 3 and therefore the distribution of Covid-19 is playkurtotic (Zhiqiang et al., 2008).
Table 2. Descriptive Statistics of Covid-19 distribution
|
Count
|
12
|
Skewness
|
0.65242
|
|
Minimum
|
17
|
Kurtosis
|
1.9468
|
|
Maximum
|
3713
|
1-St Quartile
|
150
|
|
Mean
|
1263.8
|
Median
|
690.5
|
|
Standard Deviation
|
1310.3
|
3-rd Quartile
|
2373
|
4.4 Distribution of COVID-19
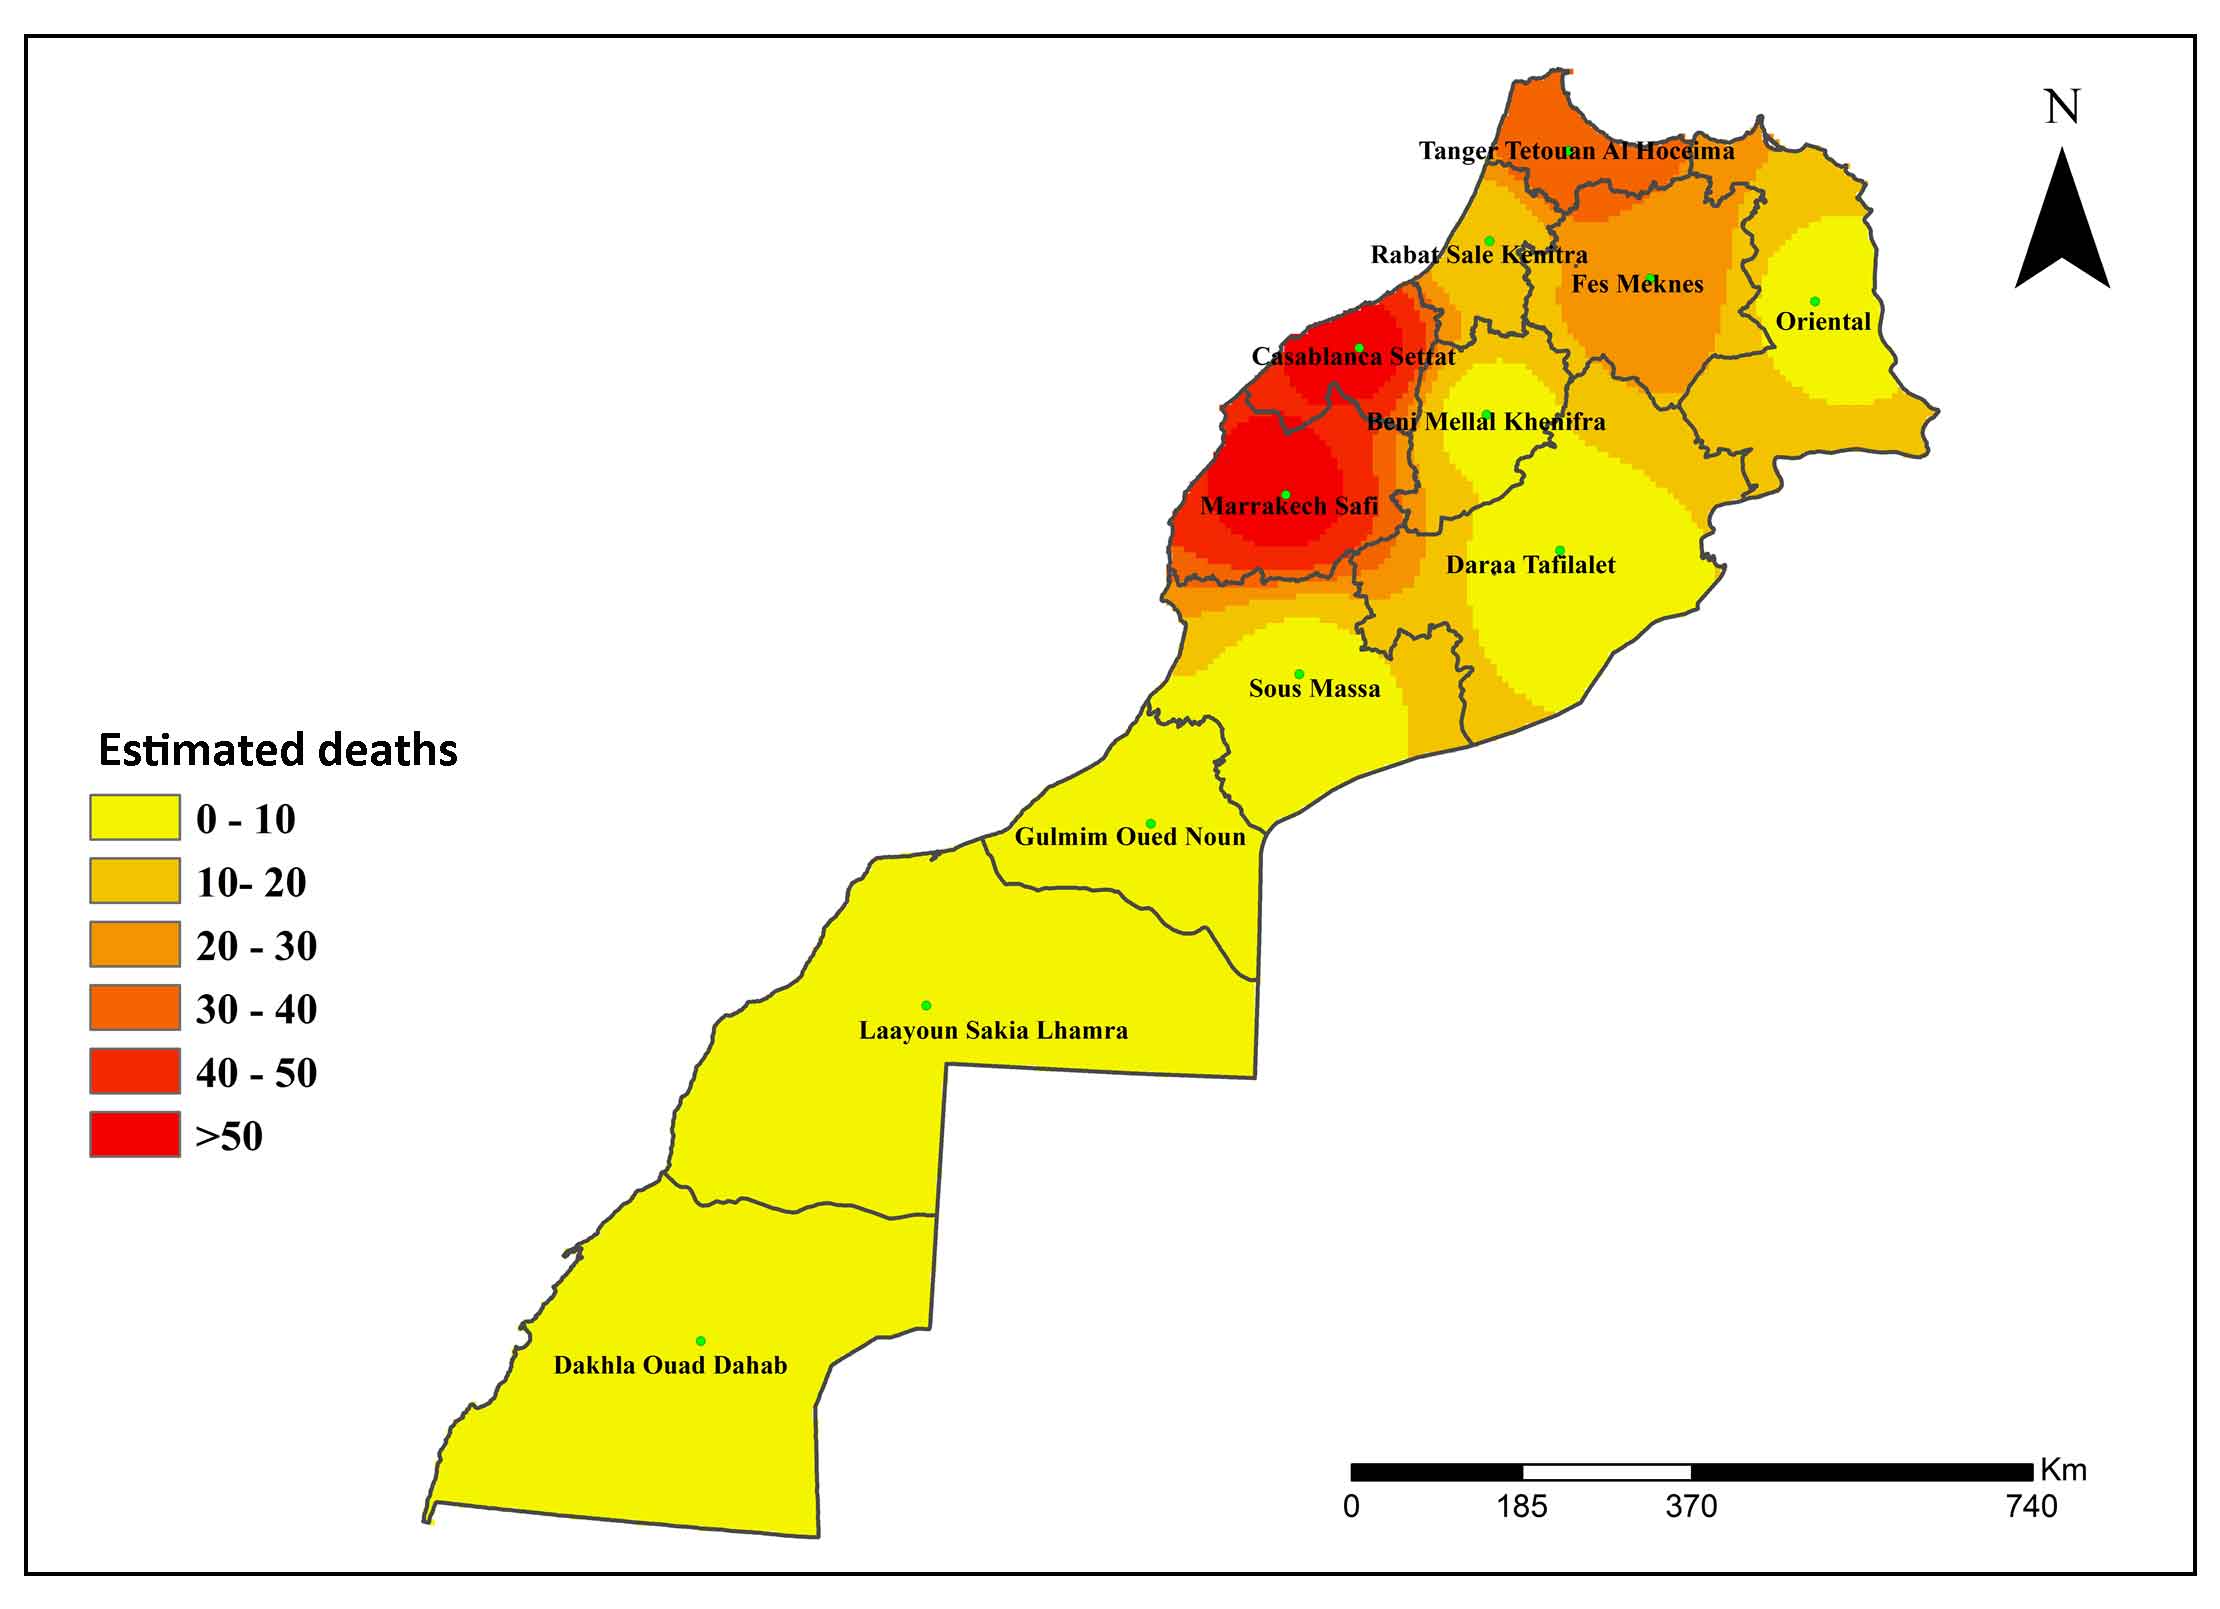
In order to predict the spread of diseases in Morocco, interpolation using the IDW was obtained. The map presented in figure 3 shows the extended disease area in the country. The pattern of COVID-19 diseases in the six classes is as follows: 17 to 400, 400 to 800, 800 to 1200, 1200 to 1600, 1600 to 2000 and > 2000 (Figure 3). It is noted that the areas with a high spread of the virus are the North-West and the North of Morocco. These areas are characterized by a higher population density (Table 1) (CPH, 2014) and the main cities in these regions are Casablanca, Marrakech, Rabat and Tanger, which are characterized by economic and tourist activity. In these regions more care is being taken to control the spread of the disease. On the other hand, the other regions with weak economic activities are characterized by weak evolution of confirmed (Ouhsine et al, 2020). The spread tends towards the West, which is limited by the Atlantic Ocean. In the other part, it is noted that the spread decreased further towards the south of Morocco which has a Saharan character.
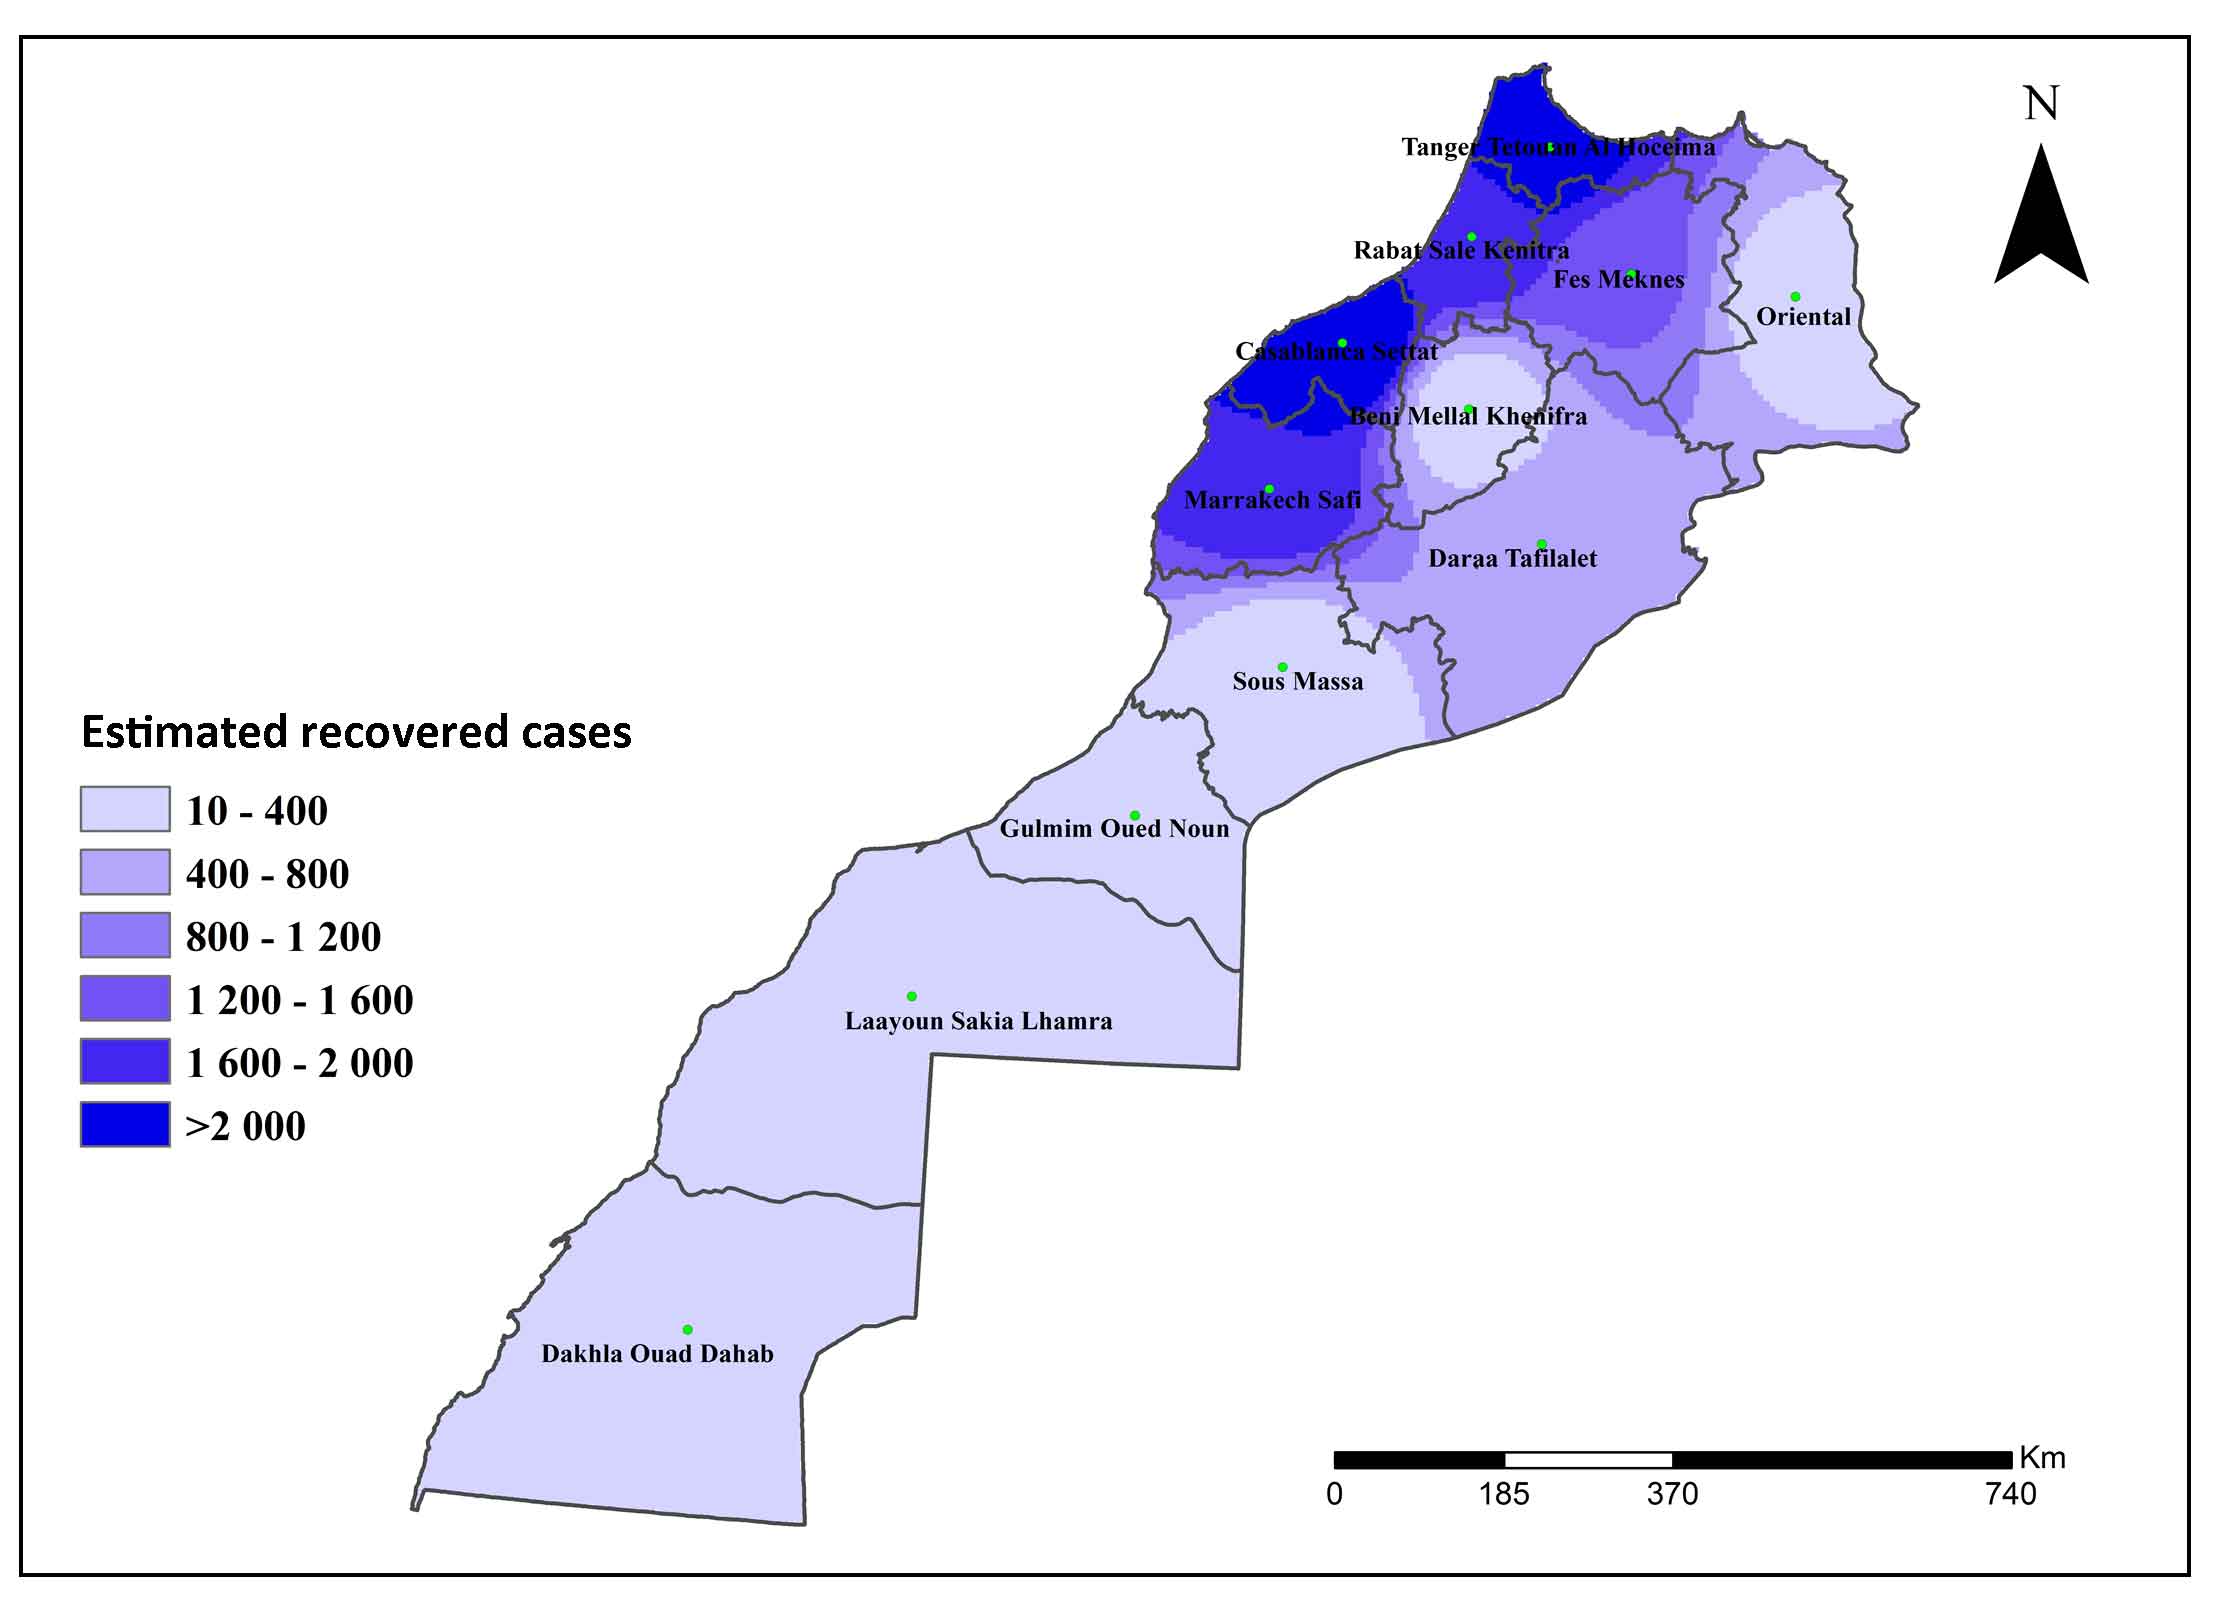
The figure 4 and 5 shows the distribution of the prediction of death and recovery of COVID-19, respectively in Morocco. Regarding deaths, the area around Casablanca and Marrakesh is the most dangerous while the area around the city of Oujda, South and Southeast is the lowest in terms of deaths. Studies show that temperature has an impact on deaths and confirmed patients, indeed temperatures are low in the North of Morocco compared to the South (Shrikant et al., 2020). In terms of curing, the region around Casablanca-Setta and Tanger-Tetouan-Al Hoceïma is the most cured and the central and northeast regions of the country are moderately cured and cases are less cured in the south. The spread of certain diseases depends on several parameters related to physiology and environmental conditions. So far no treatment has been found for COVID-19, therefore such interpolation can help the authorities to take precautionary and preventive measures against this disease. WHO announced that the emergence of the new coronavirus disease (COVID-19) is a pandemic and reiterated its call for immediate action by governments to intensify their response to diagnose, identify and mitigate the spread to save lives. Such a study was conducted in India using the IDW method to prevent the spread and distribution of COVID-19 cases (Bagyaraj et al., 2020). In this context, the Government of Morocco will take all necessary precautions to ensure that we are well prepared to face the challenge and threat posed by the growing corona virus pandemic COVID-19.
5 . CONCLUSIONS
The objective of this study was to describe the spread of Covid-19 in Morocco. The use of spatial technology and GIS play an important role in showing, simplifying and measuring the epidemiological situation of virus disease surveillance and prediction in the study area. The methodology followed in the present research, firstly, data were collected to create a database, and secondly, IDW was chosen to describe the spread of Covid-19, identifying high and low risk areas. Regions of Casablanca-Settat, Marrakech-Safi, Tangier Tetouan Al Houcima, Rabat-Salé-Kenitra and Fes-Meknes were the most affected by COVID-19. On the other hand, the results for the other regions showed that they were less infected thanks to the actions of citizens and respect for lockdown. It was noted that the areas with a high spread of the virus were the North-West and the North of Morocco. Regarding deaths, the area around Casablanca and Marrakesh was the most dangerous while the area around the city of Tanger, South and Southeast is the lowest in terms of deaths.


 ,
Abdellah Ouigmane 2
,
Abdellah Ouigmane 2