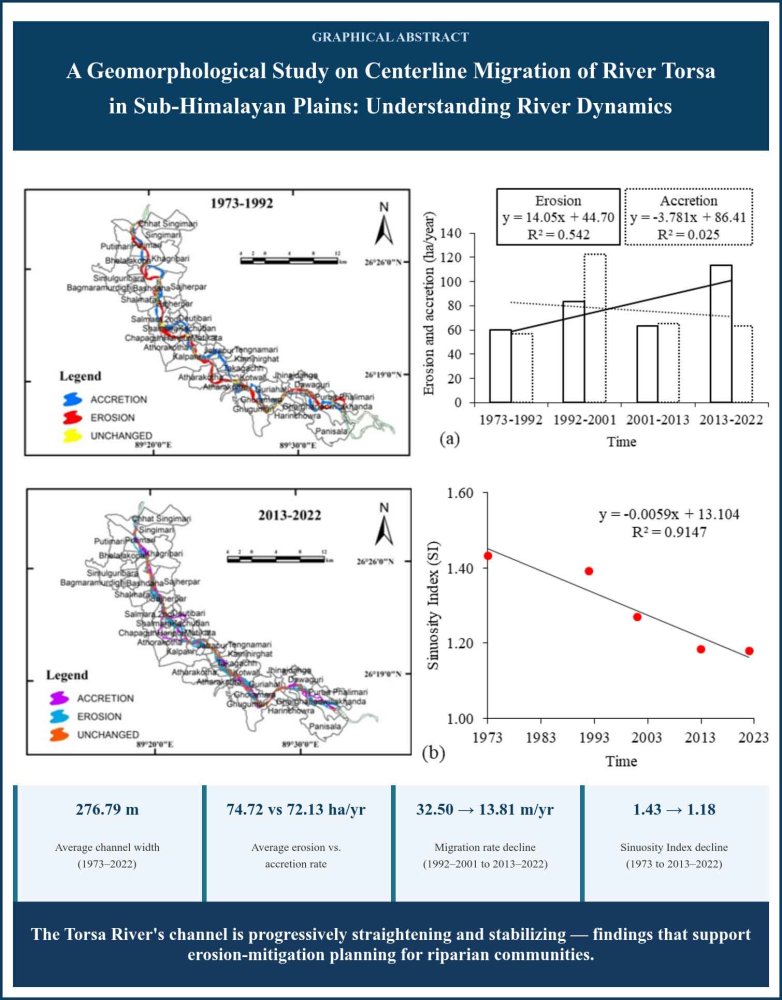
RS-GIS–based analysis of River Torsa's centerline migration in Koch Bihar Sadar subdivision, 1973–2022.
Channel width increased gradually over the 49-year period, averaging 276.79 m.
Average erosion and accretion rates were 74.72 ha/year and 72.13 ha/year, respectively.
Yearly migration rate declined from 32.50 m/year (1992–2001) to 13.81 m/year (2013–2022), indicating growing stability.
Sinuosity index fell from 1.43 (1973) to 1.18 (2013–2022), showing the channel is progressively straightening.
Findings support erosion-mitigation planning for riparian communities along the Torsa River.
Abstract
River channel centerline migration indicates the lateral movement of a river's central path across its floodplain over time in an alluvial river system situated in tectonically active areas, such as the Sub-Himalayan foothill region, resulting in many socioeconomic and environmental problems. This study analyses Channel Centerline Migration (CCM) resulting from bank erosion and accretion along the River Torsa in the Koch Bihar Sadar subdivision between 1973 and 2022 using RS and GIS. We examined four distinct periods (1973-1992, 1992-2001, 2001-2013, 2013-2022) to assess channel centerline migration patterns, rate of bank erosion and accretion, morphological characteristics (sinuosity index), and rates of width variations using Landsat MS, TM, and OLI-TRIS data. Results indicate gradual increase in channel width, channel stability and reduce channel meandering along stretch over time. The average erosion and accretion rates were found 74.72 ha/year and 72.13 ha/year along both banks. These results are significant for the prediction of channel migration rates in the context of engineering, planning, and soil-water management.
Keywords
River Torsa , Remote Sensing , GIS , Landsat , Erosion and Accretion , Sinuosity Index
1 . INTRODUCTION
The Torsa River is a trans-boundary river that originates in the Chumbi Valley, situated at an elevation of ~ 5151.12m. The Torsa River, known as the Proma Chu in Tibet and the Amo Chu in Bhutan, flows for ~ 295 km across China, Bhutan, India, and Bangladesh (Dey and Mandal, 2019). Riverbank erosion and centreline migration are serious hazards (Pal et al., 2017), influenced by both natural and anthropogenic factors (Ghosh et al., 2020; Akhter et al., 2019). Variations in discharge, runoff, tectonic activity, soil composition, lithology, vegetative cover, topography, sediment supply, and climate changes are significant natural factors (Naim and Hredoy, 2021; Raj and Singh, 2022). Alterations in land cover, infrastructure development, dam construction, irrigation practices, riverbed excavation, and illegal sand extraction are significant anthropogenic factors (Bordoloi et al., 2020; Raj and Singh, 2022). The Torsa basin experienced severe bank erosion and remarkable lateral channel shifts following the 1954 and 1987 floods (Dey and Mandal, 2019). The lateral shifts cause severe bank erosion and annual loss of fertile land (Thakur et al., 2012; Gogoi and Goswami, 2013). Channel dynamics also impacts water quality, ecosystem, and surroundings (Naim and Hredoy, 2021), affecting agricultural land, LULC and infrastructure like bridges, dams, and embankments (Dey and Mandal, 2019; Dewan et al., 2017). Additionally, administrative boundary disputes arise from these changes (Thakur et al., 2012; Naim and Hredoy, 2021). Thus, assessing morphological changes, especially centerline migration due to erosion and accretion, is crucial for effective alluvial river management (Pal et al., 2017). To understand the significance of the study of river morphology, numerous scholars have investigated spatiotemporal changes, e.g., measurements of river bank erosion and lateral channel shift (Lawler, 1993); the distribution and variation in types of bank erosion (Hooke, 1979); bank erosion, accretion and channel shifting (Lovric and Tosic, 2016; Ophra et al., 2018); river bank erosion trends (Nath et al., 2013); river bank erosion, accretion and bar dynamics (Pal et al., 2017); spatiotemporal changes of channel morphology prediction in Teesta river (Akhter et al., 2019); channel dynamics of Padma river considering seasonal variation (Naim and Hredoy, 2021); river bank erosion analysis and erosion coefficient calculation of Jamuna river (Akter et al., 2017); assessment of channel changes in Ganga-Padma river system (Dewan et al., 2017). In recent years, several studies conducted in India have investigated the spatio-temporal river morphology changes in various rivers using multi-temporal satellite images and GIS techniques, e.g., Brahmaputra river's Channel dynamics (Sarkar et al., 2012); assessing channel shifting hazard of River Torsa (Dey and Mandal, 2019); impacts of channel migration on LULC along Khowai river (Debnath et al., 2017); Plan form changes of river Ganga (Singh et al., 2019; Pal and Pani, 2019); river bank erosion and bank line migration (Gogoi and Goswami, 2013); Analysis of morphological changes and channel shifting of Fulahar River (Momin et al., 2020); river bank erosion hazard analyses of Ganga river (Thakur et al., 2012); River Torsa channel avulsion (Saha and Bhattacharya, 2021); Assessment of river bank erosion and associated probabilities along the Subansiri river (Bordoloi et al., 2020); and river meandering geometry pattern estimation and prediction (Ghosh et al., 2020). The objectives of the study are i) to investigate centreline migration patterns of the River Torsa in the Koch Bihar Sadar subdivision from 1973 to 2022 by using satellite imagery. ii) to examine the rate of erosion and accretion in the study area. iii) to identify the morphological characteristics of the study area (Sinuosity Index). This study quantifies centerline migration and correlates aggradation and degradation across 19 cross-sections in the Koch Bihar Sadar subdivision. Time series of multi-spectral satellite images were used to identify the morphological changes in the river (Ophra et al., 2018). The outcomes will help predict future erosion rates and migration patterns, contributing to development planning to reduce economic losses for riverside communities.
2 . STUDY AREA
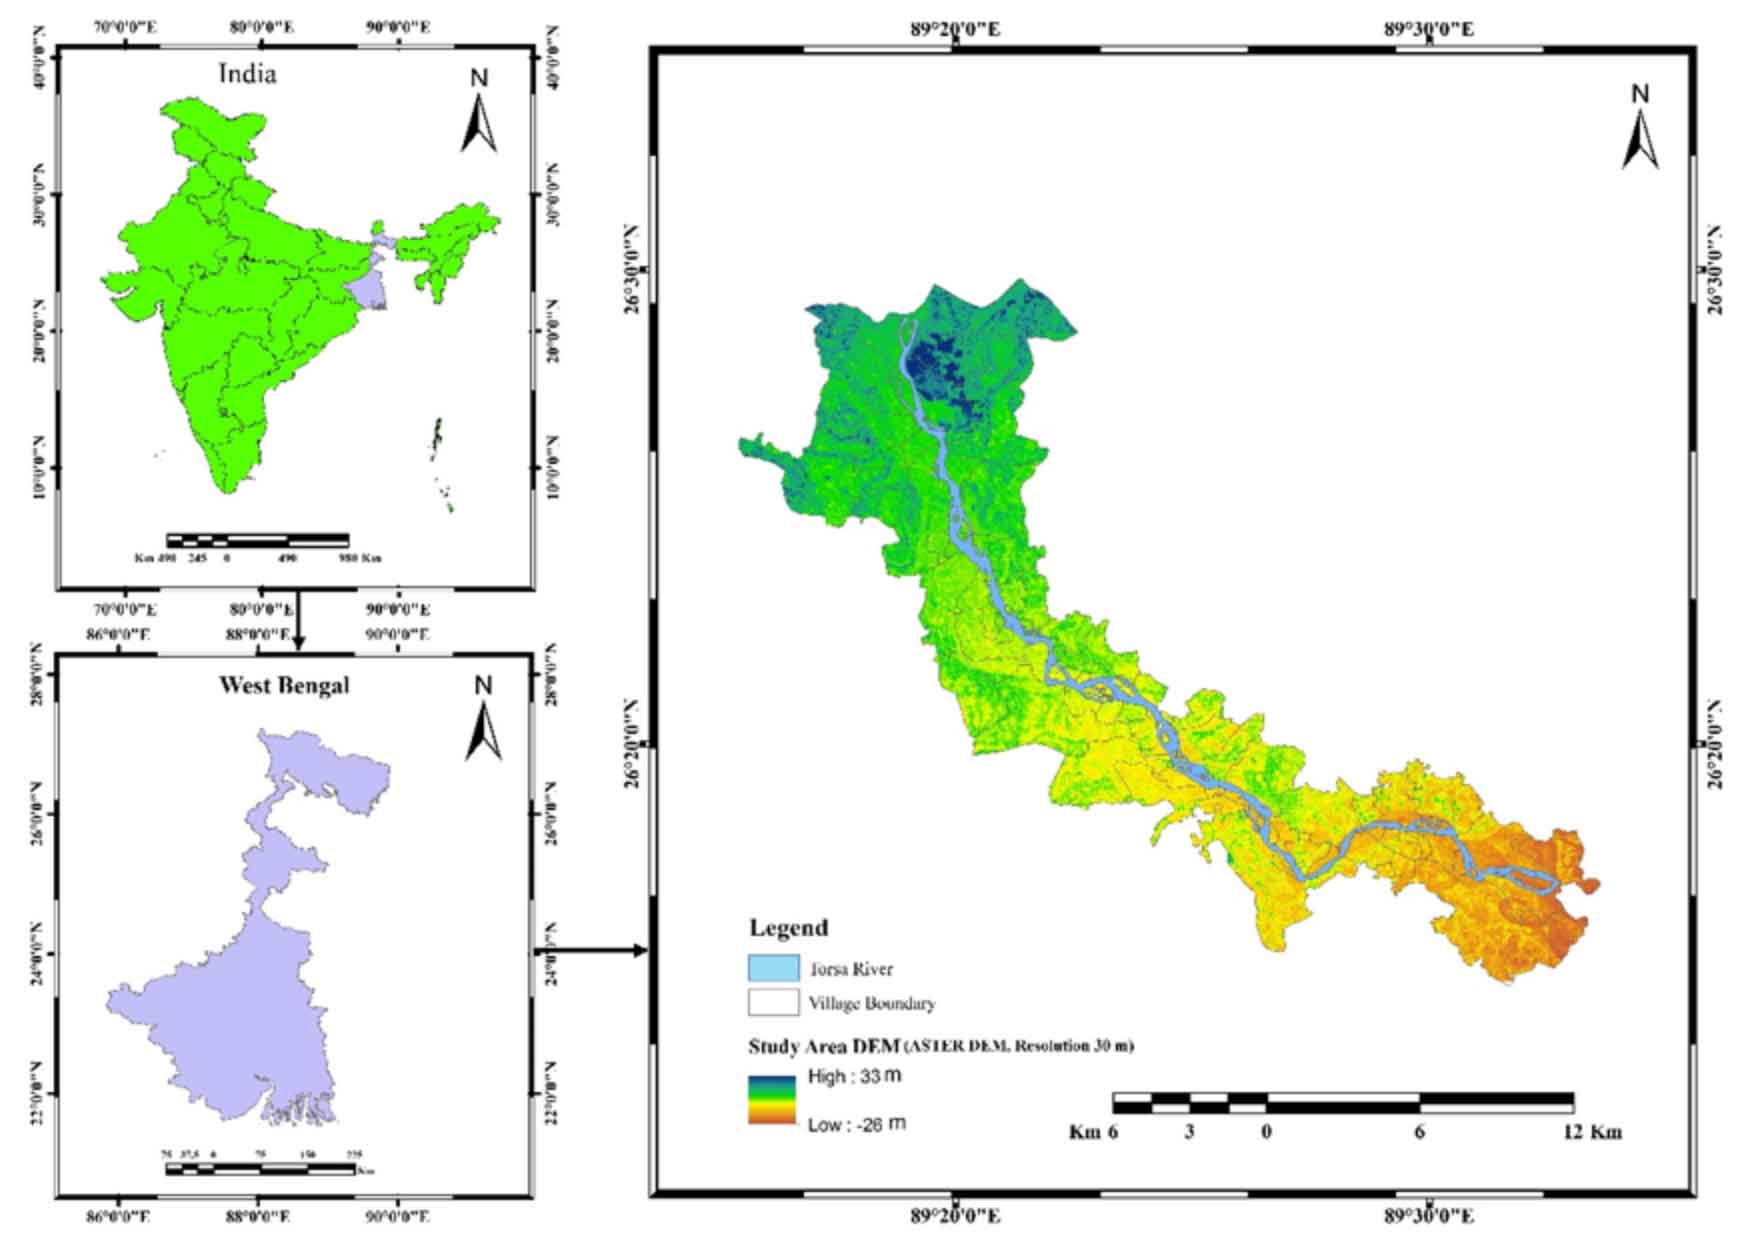
The Sub-Himalayan region is the lowest and outermost zone, includes the Siwalik range of Tertiary rocks next to Indian plains, formed during the most recent upliftment phase of the Himalayan mountain system (Karan, 1966). To the south of the wooded foothills is the Sub-Himalayan piedmont plain referred to as Terai and Duars (Karan, 1966). The River Torsa is a perennial river that flows through the Quaternary alluvial fill basin of Himalayan Foreland Basin (HFB) of the Sikkim-Bhutan Himalaya (Saha et al., 2023) and as the river approaches the mountains Indo-Bhutan border it experiences a notable decrease in gradient (Saha and Bhattacharya, 2021). Torsa is a significant river in the eastern Himalayan foothills of the Duars and Tal region (Dey and Mandal, 2019). It joins the Jamuna River at its westernmost right bank tributary (Bangladesh). The River Torsa basin is demarcated by latitudes 27⁰54'34"N to 25⁰19'34"N latitude and 89⁰02'37"E to 89⁰46'47"E longitudes, covering a total area of 6407 sq.km (Dey and Mandal, 2019). It originates from the Chumbi Valley at an elevation of 5151.12 m. The total length of the river is 295 km, with 99 km flowing through West Bengal, India. It is called “Toyrosa” (meaning “sorrow of river”) in Tibet due to its frequent course changes and the river course shifted substantially during the 1887 flood (Dey and Mandal, 2019). The study area consists of alluvial soil characterized by medium to fine sands, silt and clay soil. The present study focuses on the area between longitudes 89⁰19'18 12´´E to 89⁰32'44.91''E and latitudes 26⁰29'29.08''N to 26⁰16'54.51''N, encompassing two blocks (Koch Bihar I and Koch Bihar II) which have suffered from bank erosion and channel shifts.
Figure 1. Study area
3 . DATA SOURCES AND METHODOLOGY
3.1 Satellite images
The spatiotemporal changes in the morphology of the River Torsa channel in India over the past 49 years were the primary focus of this investigation. Landsat 1 MSS (1973), Landsat 5 TM (1992, 2001) and Landsat 8 OLI-TRIS (2013, 2022) data were used to extract river shapes from the five multi-date Landsat imageries. The necessary satellite images were obtained from the USGS Earth Explorer official website (https://earthexplorer.usgs.gov). All the information about the satellite images are presented in Table 1.
Table 1. Information of used satellite images
Satellite
Sensor/Source
Path/Row
Acquisition date
Spatial resolution (m)
Landsat-1
MSS
148/42
1973/02/21
60
Landsat-5
TM
138/42
1992/03/24
30
Landsat-5
TM
138/42
2001/01/28
30
Landsat-8
OLI_TRIS
138/42
2013/11/13
30
Landsat-8
OLI_TRIS
138/42
2022/03/11
30
3.2 Data processing and analysis
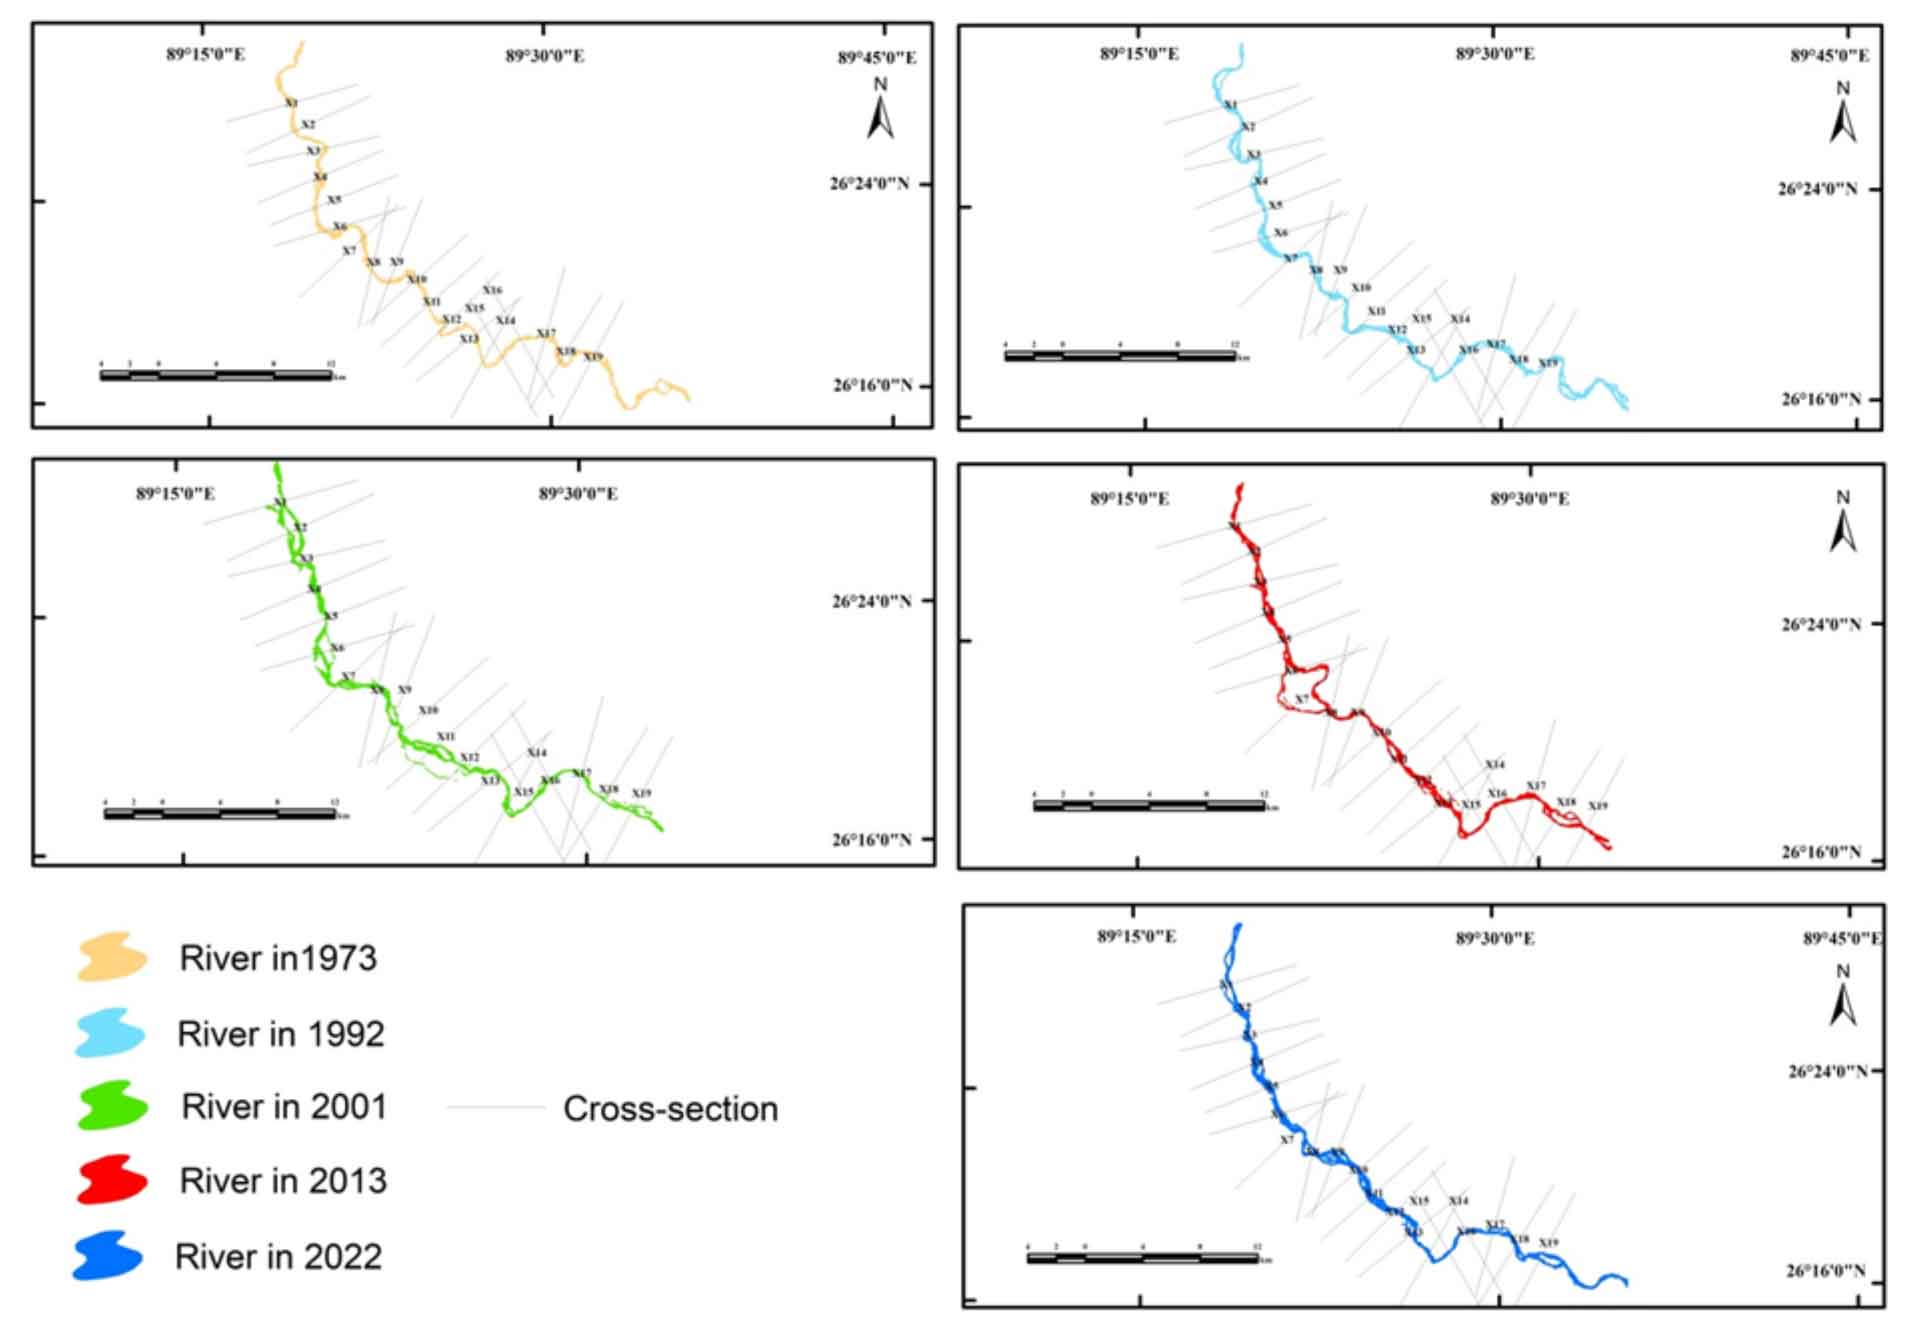
All data have to be georeferenced before doing the analysis. The Landsat images have been georeferenced using ArcMap 10.8 software. The image was rectified using the UTM-45 N projection and WGS-84 datum, with radiometric correction achieved by converting the Digital Number (DN) values of the Landsat data into Top-of-Atmosphere (TOA) reflectance during image processing. To explore the morphological changes of the river, satellite-based remote sensing techniques was applied, as employed by many scholars worldwide (Dey and Mandal, 2019; Sarkar et al., 2012; Momin et al., 2020; Pal et al., 2017; Naim and Hredoy, 2021; Thakur et al., 2012; Akhter et al., 2019). The Landsat MSS (1972) image, has a relatively low spatial resolution of ~60 meters. Therefore, the data has been resampled to 30 metres using the resample tool in ArcGIS to ensure consistency in spatial resolution with other satellite datasets. All images were obtained during the dry season, with the exception of the 2013 image, which was captured in early November. Moreover, a temporal interval of around 2–4 months exists across dry-season image collections throughout different years. Due to this inconsistency in available imagery, there are unequal time intervals (19 years, 9 years, 12 years and 9 years) between the images used to calculate erosion/accretion rates and centerline migration. The Normalized Difference Water Index (NDWI) was employed to delineate the River Torsa reach. After delineation, small inconsistencies in the derived channel boundaries were manually adjusted using ArcGIS 10.8. Nineteen cross-sections were created at 2 km intervals from north to south to measure channel width and centerline migration by GIS-based analysis. Field observations were employed in 2022 to verify channel conditions and validate the derived results by field measurements. In addition, the intersection method was utilized to identify unchanging areas, which served as the baseline to calculate erosion and accretion areas.
3.3 Assessment of lateral migration
The channel centerline was generated utilizing both banks, and for each of the four study periods, migration polygons were made using the centerline (1973-1992, 1992-2001, 2001-2013, 2013-2022) with the ‘feature to polygon’ tool in the data management tools of ArcGIS. The area and associated perimeter of each polygon were calculated using the Geometry Calculator in ArcGIS 10.8, based on the attribute tables derived from the four sets of generated migration polygons. The data were then copied to the Microsoft Excel environment, where the total Rate of Migration ( \(M_n\) ) and Yearly Rate of Migration ( \(R_y\) ) of the study reach over the analysis period were calculated based on the formulas given by Rowley (2016) expressed as follows:
\( M_n = {A \over {({1 \over 2})*P }}\)
\(R_y = \frac{M_n}{N}\)
Where, \(M_n\) represents the total rate of migration, \(R_y\) signifies the rate of migration, A refers to the area of each polygon, P defines the polygon's perimeter, and N is the total number of years considered during the study period.
3.4 Assessment of erosion and accretion
The following formulas are used to determine river erosion and accretion based on GIS-based overlay analysis of multitemporal channel boundaries (Tabassum, 2026).
Erosion = Area of previous year – Unchanged area
Accretion = Area of next year – Unchanged area
3.5 Assessment of meandering characteristics
The Sinuosity Index calculates a river channel's degree of bending. It is defined as the ratio between the mid-channel length of the widest channel and the overall length of the channel reach measured in a straight line (Friend and Sinha, 1993).
Sinuosity (S) is given as:
\(S = \frac{L_{cmax}}{L_R}\)
Where, \(L_{cmax}\) is the midway length of the widest channel and \(L_R\) is the overall length of the reach.
4 . RESULTS AND DISCUSSIONS
4.1 Temporal changes in river width
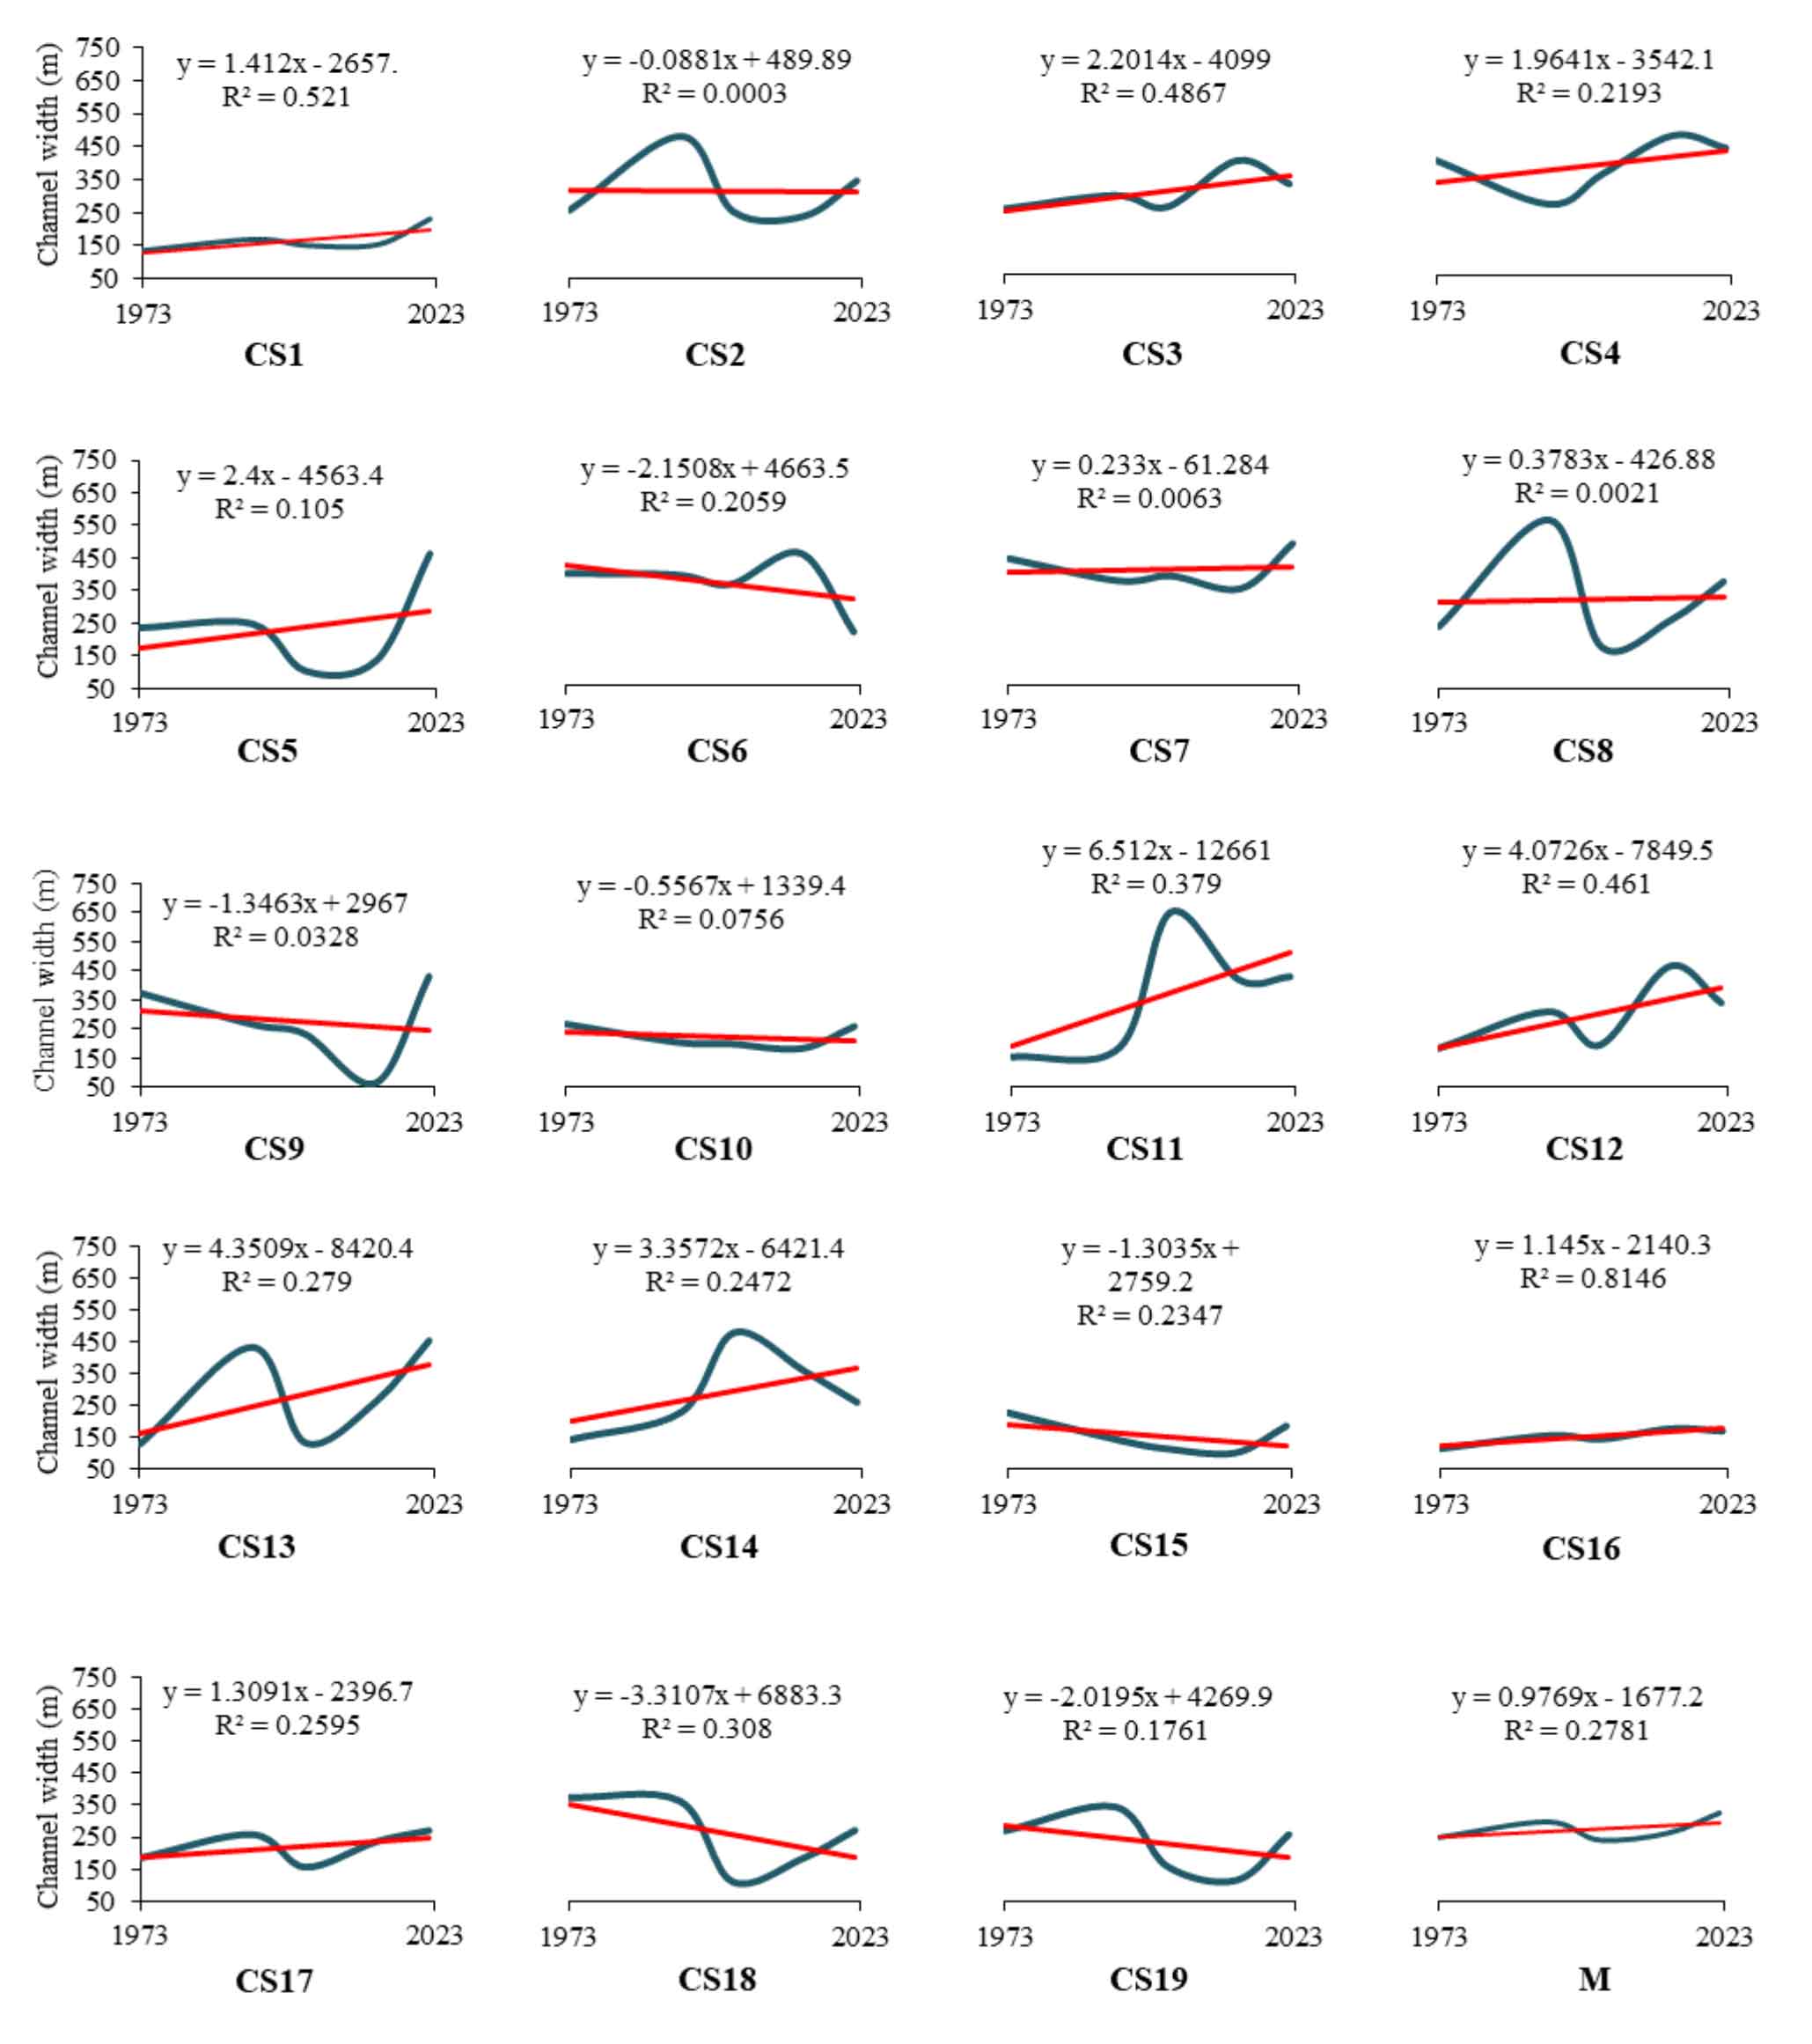
19 cross-sections have been chosen from north to south along the river channel for each of the five years in order to examine the changes in channel width over time. Changes in river width have been observed. River width changes over time due to various kinds of factors such as flooding, erosion, accretion, sediment load, and anthropogenic activities (Thakur et al., 2012; Dewan et al., 2017). Therefore, the width of the river changes continuously. The largest width observed was 644.89 m at cross-section 11 in 2001. Minimum width was observed 65.38m at cross section 9 in 2013. The average width of the river was 276.79 m between 1973 and 2022. However, an increase in channel width was found throughout the 40 observations, while a decrease in channel width was observed in 36 observations throughout the four different time intervals (19 cross sections × 4 intervals = 76 observations). The average width of the river in the study area increased from 1973 -2022, indicating expansion of the river.
Figure 2. Spatio-temporal changes in river width along the cross-sections
Figure 3 of the study, on the River Torsa, 19 cross sections from 1973 to 2023 the R2 values show the correlation between the channel width and time across the river beds. Higher R2 value, such as CS1 (with R2 of 0.521 and P < 0.05), CS3 (with R2 value of 0.486 and P < 0.05), and notably CS16 (with R2 value of 0.814 and P < 0.05), indicates a positive correlation between channel width and time in these particular sections, and widening trends in those are with time. In comparison areas, such as CS2 (R2= 0.000 and P < 0.05), CS5 (R2=0.010 and P < 0.05) and CS (R2= 0.006 and P < 0.05) show little to no correlation, indicating potentially nonlinear shifts in channel structure. Overall, the variation in R2 values across the cross sections highlights the spatial heterogeneity of fluvial processes affecting the river, which in some areas undergoes pronounced, directional changes while others experience more erratic or complex dynamics.
Figure 3. Changing trends of channel width of River Torsa from 1973 to 2023
4.2 Lateral centerline migration of the river over time
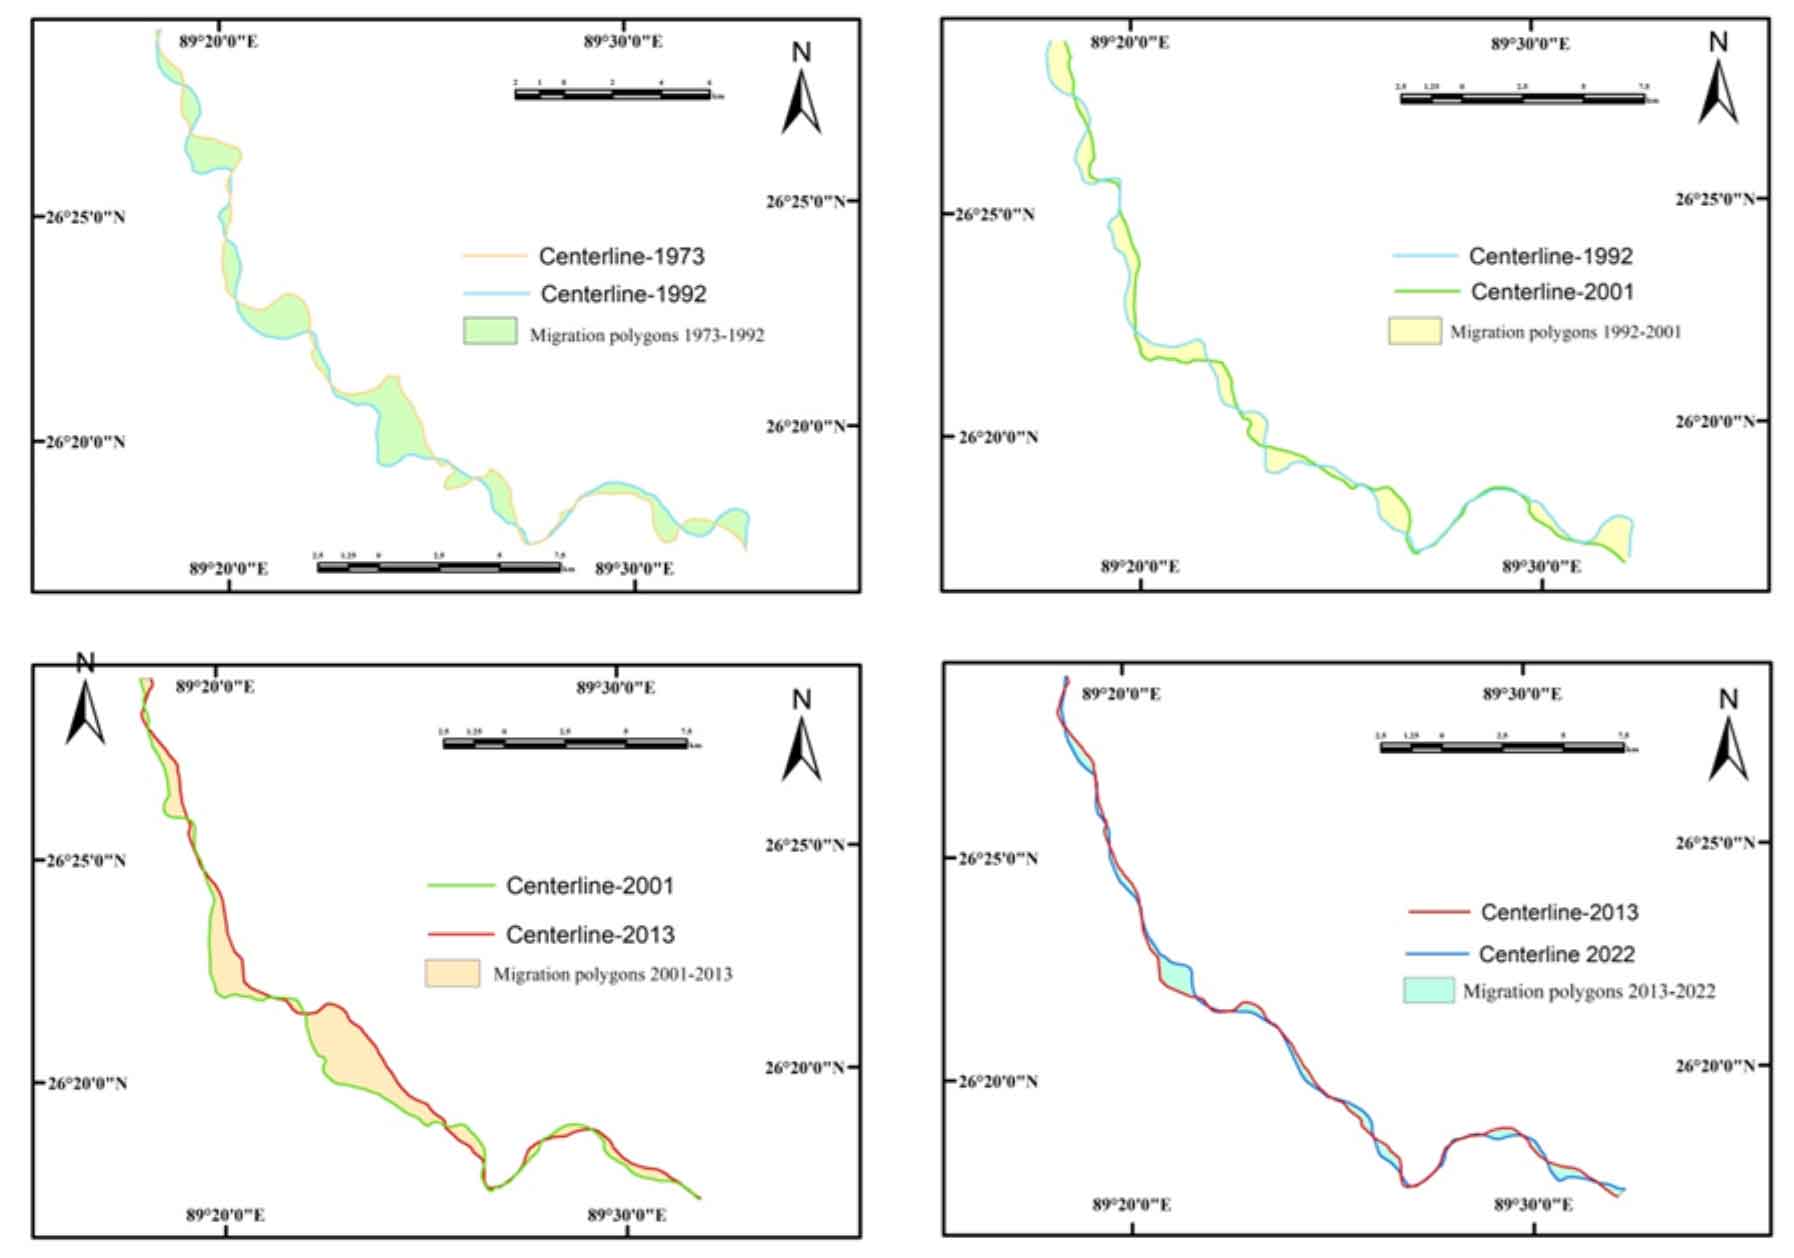
The study of lateral migration along the study reach from 1973 to 2022 indicated significant patterns of channel migration across all four study periods. In this reach, maximum yearly migration rate of 32.50 m/year from 1992 to 2001, followed by 18.92 m/year from 2001 to 2013, and 17.69 m/year from 1973 to 1992. The significantly decreased rate of centerline migration (13.81 m/year) was recorded for the latest time intervals of 2013 to 2022. The results showed channel stability and reduced meandering activity over time, although highest yearly migration rate in the time period from 1992-2001 indicates remarkable fluvial dynamics.
Figure 4. Channel migration patterns and polygons for 1973-1992, 1992-2001, 2001-2013 and 2013-2022
4.3 Area of erosion and accretion
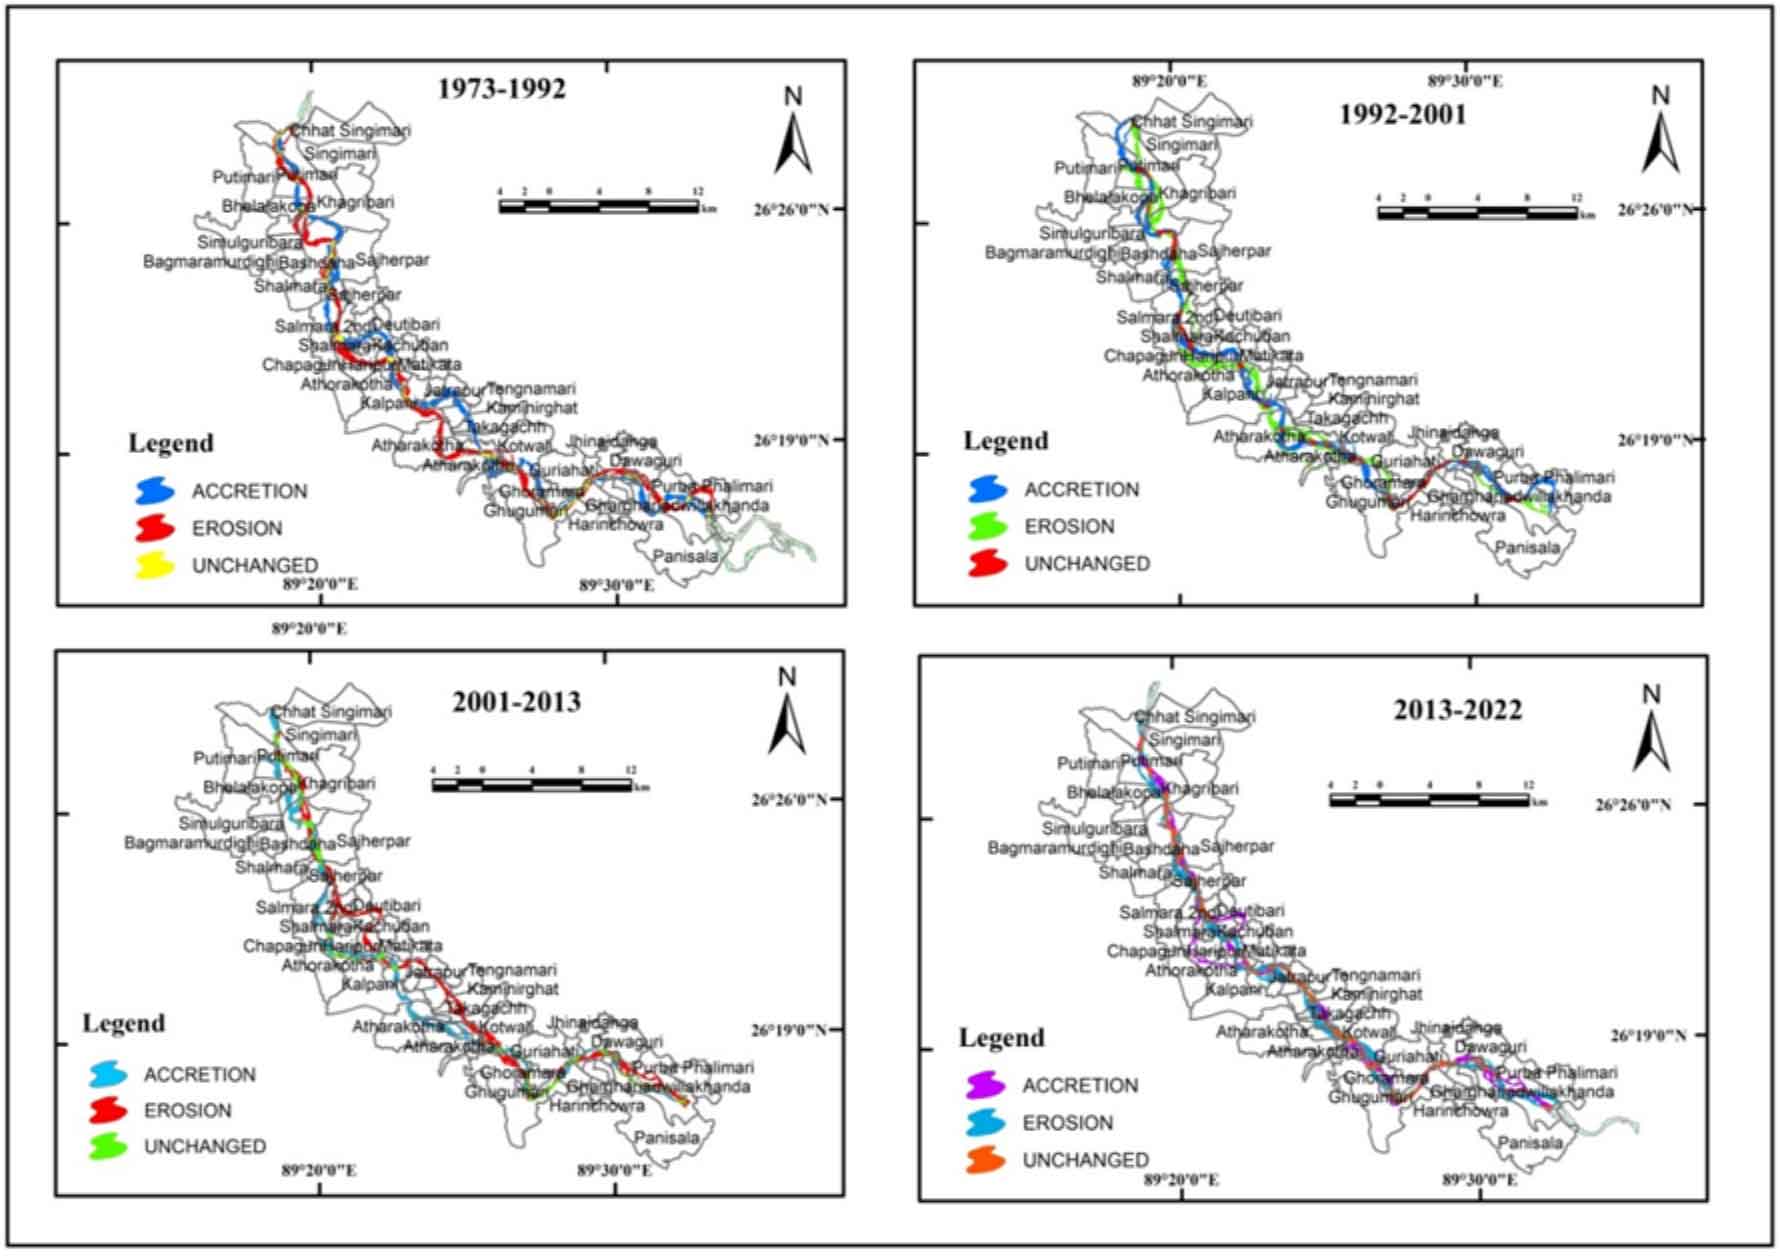
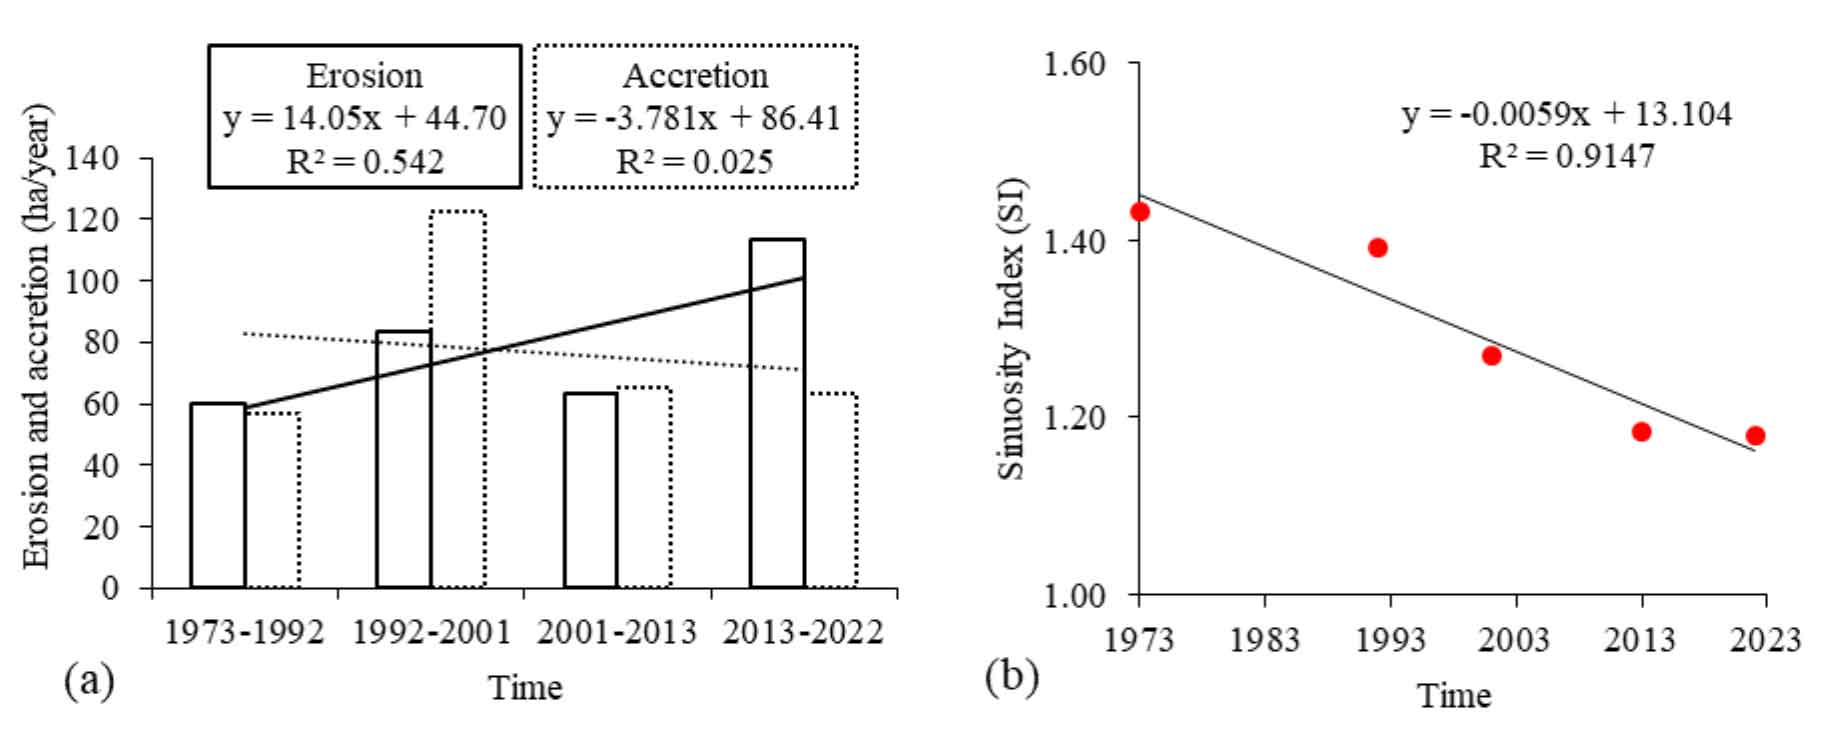
Some of the most vulnerable villages along the River Torsa are Putimari, Bhelakopa, Bashdaha, Salmara II, Shalmara, Baldihati, Sajherpar, Kalapani, Takagachh, Karishal, Damodarpur, Haripur, Jatrapur, Kaminirghat, Ararguri, Hokakura, Kachuban, Kamrangaguri and Ghierhari. Measurements of erosion and accretion have been made for 49 years, from 1973 to 2022, for different time periods (1973-1992, 1992-2001, 2001-2013, 2013-2022). The maximum erosion rate was found in the period of 2013-2022 with 113.36 ha/year. Total eroded land in this period is 1020.27 ha land. Minimum erosion rate has been found in 1973-1992 with 59.75 ha/year, 1135.23 ha land has been eroded in this 19 years’ time interval. Between 1992-2001 time period, the erosion rate was 83.28 in 1992-2001 and 63.03 ha/year in 2001-2013. The average annual erosion rate was 74.72 ha/year with total erosion of 3661.41 ha from 1973 to 2022. The highest erosion rate, 113.36 ha/year, was recorded between 2013 and 2022. Total eroded land in this period is 1020.27 ha land. Minimum erosion rate has been found in 1973-1992 with 59.75 ha/year, 1135.23 ha land has been eroded in this 19 years’ time interval. Between 1992-2001 time period, the erosion rate was found 83.28 ha/year in 1992-2001 and 63.03 ha/year in 2001-2013. Between 1973 and 2022, the average annual erosion rate was 74.72 ha/year, with a total erosion of 3661.41 ha. This persistent erosion has caused significant annual land loss in the study area. The highest accretion rate, 122.52 ha/year, was recorded between 1992 and 2001. Total 1102.71 ha land area has increased in this time period. However, the minimal accretion rate of 56.84 ha/year was found between 1973 and 1992, during which time the land increased by 1080.02 ha. The accretion rate was 65.11 ha/year from 2001 to 2013, and 63.38 ha/year from 2013 to 2022. Between 1973 and 2022, the average annual accretion rate was 72.13 ha/year, resulting in a total accretion of 3534.46 ha.
Figure 5. River bank erosion and accretion for 1973-1992, 1992-2001, 2001-2013 and 2013-2022
The coefficient of determination (R² = 0.542 and P < 0.05) for the erosion regression model suggests that approximately 54.2% of the temporal variance in erosion rates (ha/year) is statistically explained by the time intervals, indicating a moderately strong and consistent increase in erosion around 14.05 ha/year per temporal phase. On the other hand, the very low (R²= 0.025 and P < 0.05) indicates a negligible relationship for accretions suggests minimal correlation with time, reflecting highly inconsistent and irregular accretion patterns.
4.4 Sinuosity
Sinuosity is the most important geomorphological parameters of river channel that reflects the degree of meandering. In the present study, the highest recorded sinuosity value is 1.43 in 1973, while the lowest sinuosity value of 1.18 has been observed between the years 2013 and 2022. The gradual decrease in the value of sinuosity from 1973 to 2022 indicates that the river channel is being straightened. There is a significant negative association between time and sinuosity index as the trend line is going downwards as well as the R2 value is 0.914 which indicates 91.47% of the variability in the sinuosity index can be determined by time.
Figure 6. (a) Rate of erosion and accretion and (b) changing trend of SI during 1973 to 2022
5 . CONCLUSIONS
The study reach of the Torsa River has clearly undergone major morphological changes from 1973 to 2022, influenced by both natural fluvial processes and increasing anthropogenic activities. These changes along the Torsa River in Koch Bihar Sadar sub-division have been observed due to flood during the monsoon season, resulting from excessive rainfall and the massive discharge of water from the upper course of the river (Maiti, 2016; Maity and Maiti, 2017). Numerous bank failures have occurred in the study area following floods, primarily triggered by seepage erosion and toe erosion resulting from secondary water flow (Maiti, 2016). Human intervention like bridge construction, construction of embankments along the river and mining (boulders and sand) from the riverbed has exerted excessive pressure on the riverbanks, rendering these areas highly susceptible to erosion leading to continuous channel shift with time (Dey and Mandal, 2019). The average width of river from 1973 to 2022 was found 276.79m. The average channel width has shown a gradual increase over time in the study area. The reach has frequently experienced lateral channel migration, with the greatest migration intensity (32.50 m/year) occurring in the time period 1992-2001. The fact that migration rates have been decreasing steadily over the last few decades suggests that the channel is slowly becoming more stable. The average erosion and accretion rates were found 74.72 ha/year and 72.13 ha/year from 1973 to 2022. But localized erosion and meander migration remain active in the study reach. These geomorphic changes have altered floodplain environments and resulted in land loss in nearby riparian areas. Moreover, this type of changes in river dynamics have been also observed in Teesta and Jaldhaka river (Akhter et al., 2019; Alam et al., 2025). Therefore, effective management and regular monitoring are needed in order to reduce further channel instability and to maintain ecological and geomorphic balance in the study reach of Torsa River.
Aside from this analysis, the study has a few limitations. We selected satellite images with a temporal gap of approximately 2-4 months. The interval should be decreased to get better results while extracting the river shapes. To identify the centerline migration four time frames have been taken (1973-1992, 1992-2001, 2001-2013, 2013-2022). If more time intervals were taken into account, the results would be more accurate. This limitation will be addressed in future research work.
Despite certain limitations, the findings of this study can assist policymakers, planners, government authorities, and local residents living along the banks of the Torsa River in formulating effective strategies to mitigate the impacts of centerline shifting and reduce property damage caused by erosion.
Tables
Figures
Conflict of Interest
No conflict of interest: not applicable.
Acknowledgements
The authors sincerely thank the scholars and academicians whose support, encouragement, and valuable assistance (direct and indirect) contributed to the preparation of this manuscript.
Abbreviations
CCM: Channel Centreline Migration; CS: Cross-section; GIS: Geographic Information System; HFB: Himalayan Foreland Basin; Mn: Total Rate of Migration; MSS: Multispectral Scanner System; NDWI: Normalized Difference Water Index; OLI: Operational Land Imager; RS: Remote Sensing; Ry: Yearly Rate of Migration; SI: Sinuosity Index; TM: Thematic Mapper; TOA: Top of Atmosphere; UTM: Universal Transverse Mercator; WGS-84: World Geodetic System 1984.
Akter, S., Zahra, F. T., Sakib, M. N., Sen, D. and Chowdhury, M. A., 2017. Analysis of river bank erosion and calculation of universal erosion co-efficient using space-borne GIS and RS technique: a study on lower reach of Jamuna river. In International Conference on Disaster Risk Mitigation.
Gogoi, C. and Goswami, D. C., 2013. A study on bank erosion and bank line migration pattern of the Subansiri River in Assam using remote sensing and GIS technology. Int J EngSci, 2(9), 1-6.
Lovric, N. and Tosic, R., 2016. Assessment of bank erosion, accretion and channel shifting using remote sensing and GIS: Case study–lower course of the Bosna River. QuaestionesGeographicae, 35(1), 81-92.
16.
Maiti, R., 2016. Modern approaches to fluvial geomorphology. Delhi: Primus Books.
Nath, B., Naznin, S. N. and Alak, P., 2013. Trends analysis of river bank erosion at Chandpur, Bangladesh: a remote sensing and GIS approach. International Journal of Geomatics and Geosciences, 3(3), 454-463.
Pal, P. K., Rahman, A. and Yunus, A., 2017. Analysis on river bank erosion-accretion and bar dynamics using multi-temporal satellite images. American Journal of Water Resources, 5(4), 132-141.




 ,
Darshan Chandra Barman 2
,
Darshan Chandra Barman 2