1 . INTRODUCTION
Water is the most precious natural resource, which is consumed and used universally. With the increasing population, there is an ever growing demand for this precious resource. Most regions have rainfall limited to specific months of the year and some regions even lack a perennial source of water. The use of groundwater to solve this problem has increased considerably in the recent years. With the increase in the use of groundwater also comes it misuse and mismanagement. This misuse ranges from the overuse of the resource and also its pollution. Artificial recharge practices sometimes lead to pollution and also give misleading results about water table interpolation. Thus its assessment becomes critical for the sustainable development and management of groundwater resources (Magesh et al., 2012; Gashaw et al., 2018; Kadam et al., 2018).
Remote sensing (RS) and GIS methods are extensively used for the managing of various natural resources (Singhai et al. 2017; Kadam et al. 2012; Alizadeh et al. 2017; Mekuriaw et al. 2017; Gashaw et al. 2018). In the recent years, a number of authors were successfully demarcated the approximate water table elevation using RS techniques (Mondal and Garg, 2007; Deepika et al., 2013; Al-Abadi, 2015; Abuzied and Alrefaee, 2017; Singh et al. 2017). The earth exhibits various features like soil, geomorphology, drainage density, slope, etc which influence the potential
of groundwater. Each of this has been considered and with the use of geospatial data as a reference to compute these layers. The geospatial approach is widely used for the development and management of various natural resources (Kadam et al., 2012; Alizadeh et al., 2017; Mekuriaw et al., 2017; Gashaw et al., 2018). Assessment of groundwater prospects mapping using geospatial analysis was done by many researchers (Mondal and Garg, 2007; Deepika et al., 2013; Al-Abadi, 2015; Abuzied and Alrefaee, 2017; Singh et al., 2017). Preparation of various thematic layers, such as geomorphology, lithology, drainage density and slope in GIS environment with assigned weightage in a spatial domain will help delineate potential groundwater zones.
The analytic hierarchy process (AHP) is a multi-criteria managerial method introduced by Saaty (Saaty, 2008). An AHP was used to assign values for the preparation of the groundwater prospects map so as to negate human biasness (Saaty, 2008). As a key decision-making tool, AHP was used in this study to obtain appropriate solutions to the suitability assessment for GWP zones. This technique with help of remote sensing and GIS-based geospatial analysis was used to map the areas suitable for groundwater prospect.
A systematic hydrogeological, geographical, social and economic investigations were carried out in the semi-arid region (Batchelor, et al., 2003; Bouma, et al., 2007; Calder, et al., 2008; Chowdary, et al., 2009; Babu et al., 2014) for watershed development study. Soil moisture accounting (SMA) algorithm has been used to evaluate the performance of the HEC-HMS model for the Subarnekha basin.
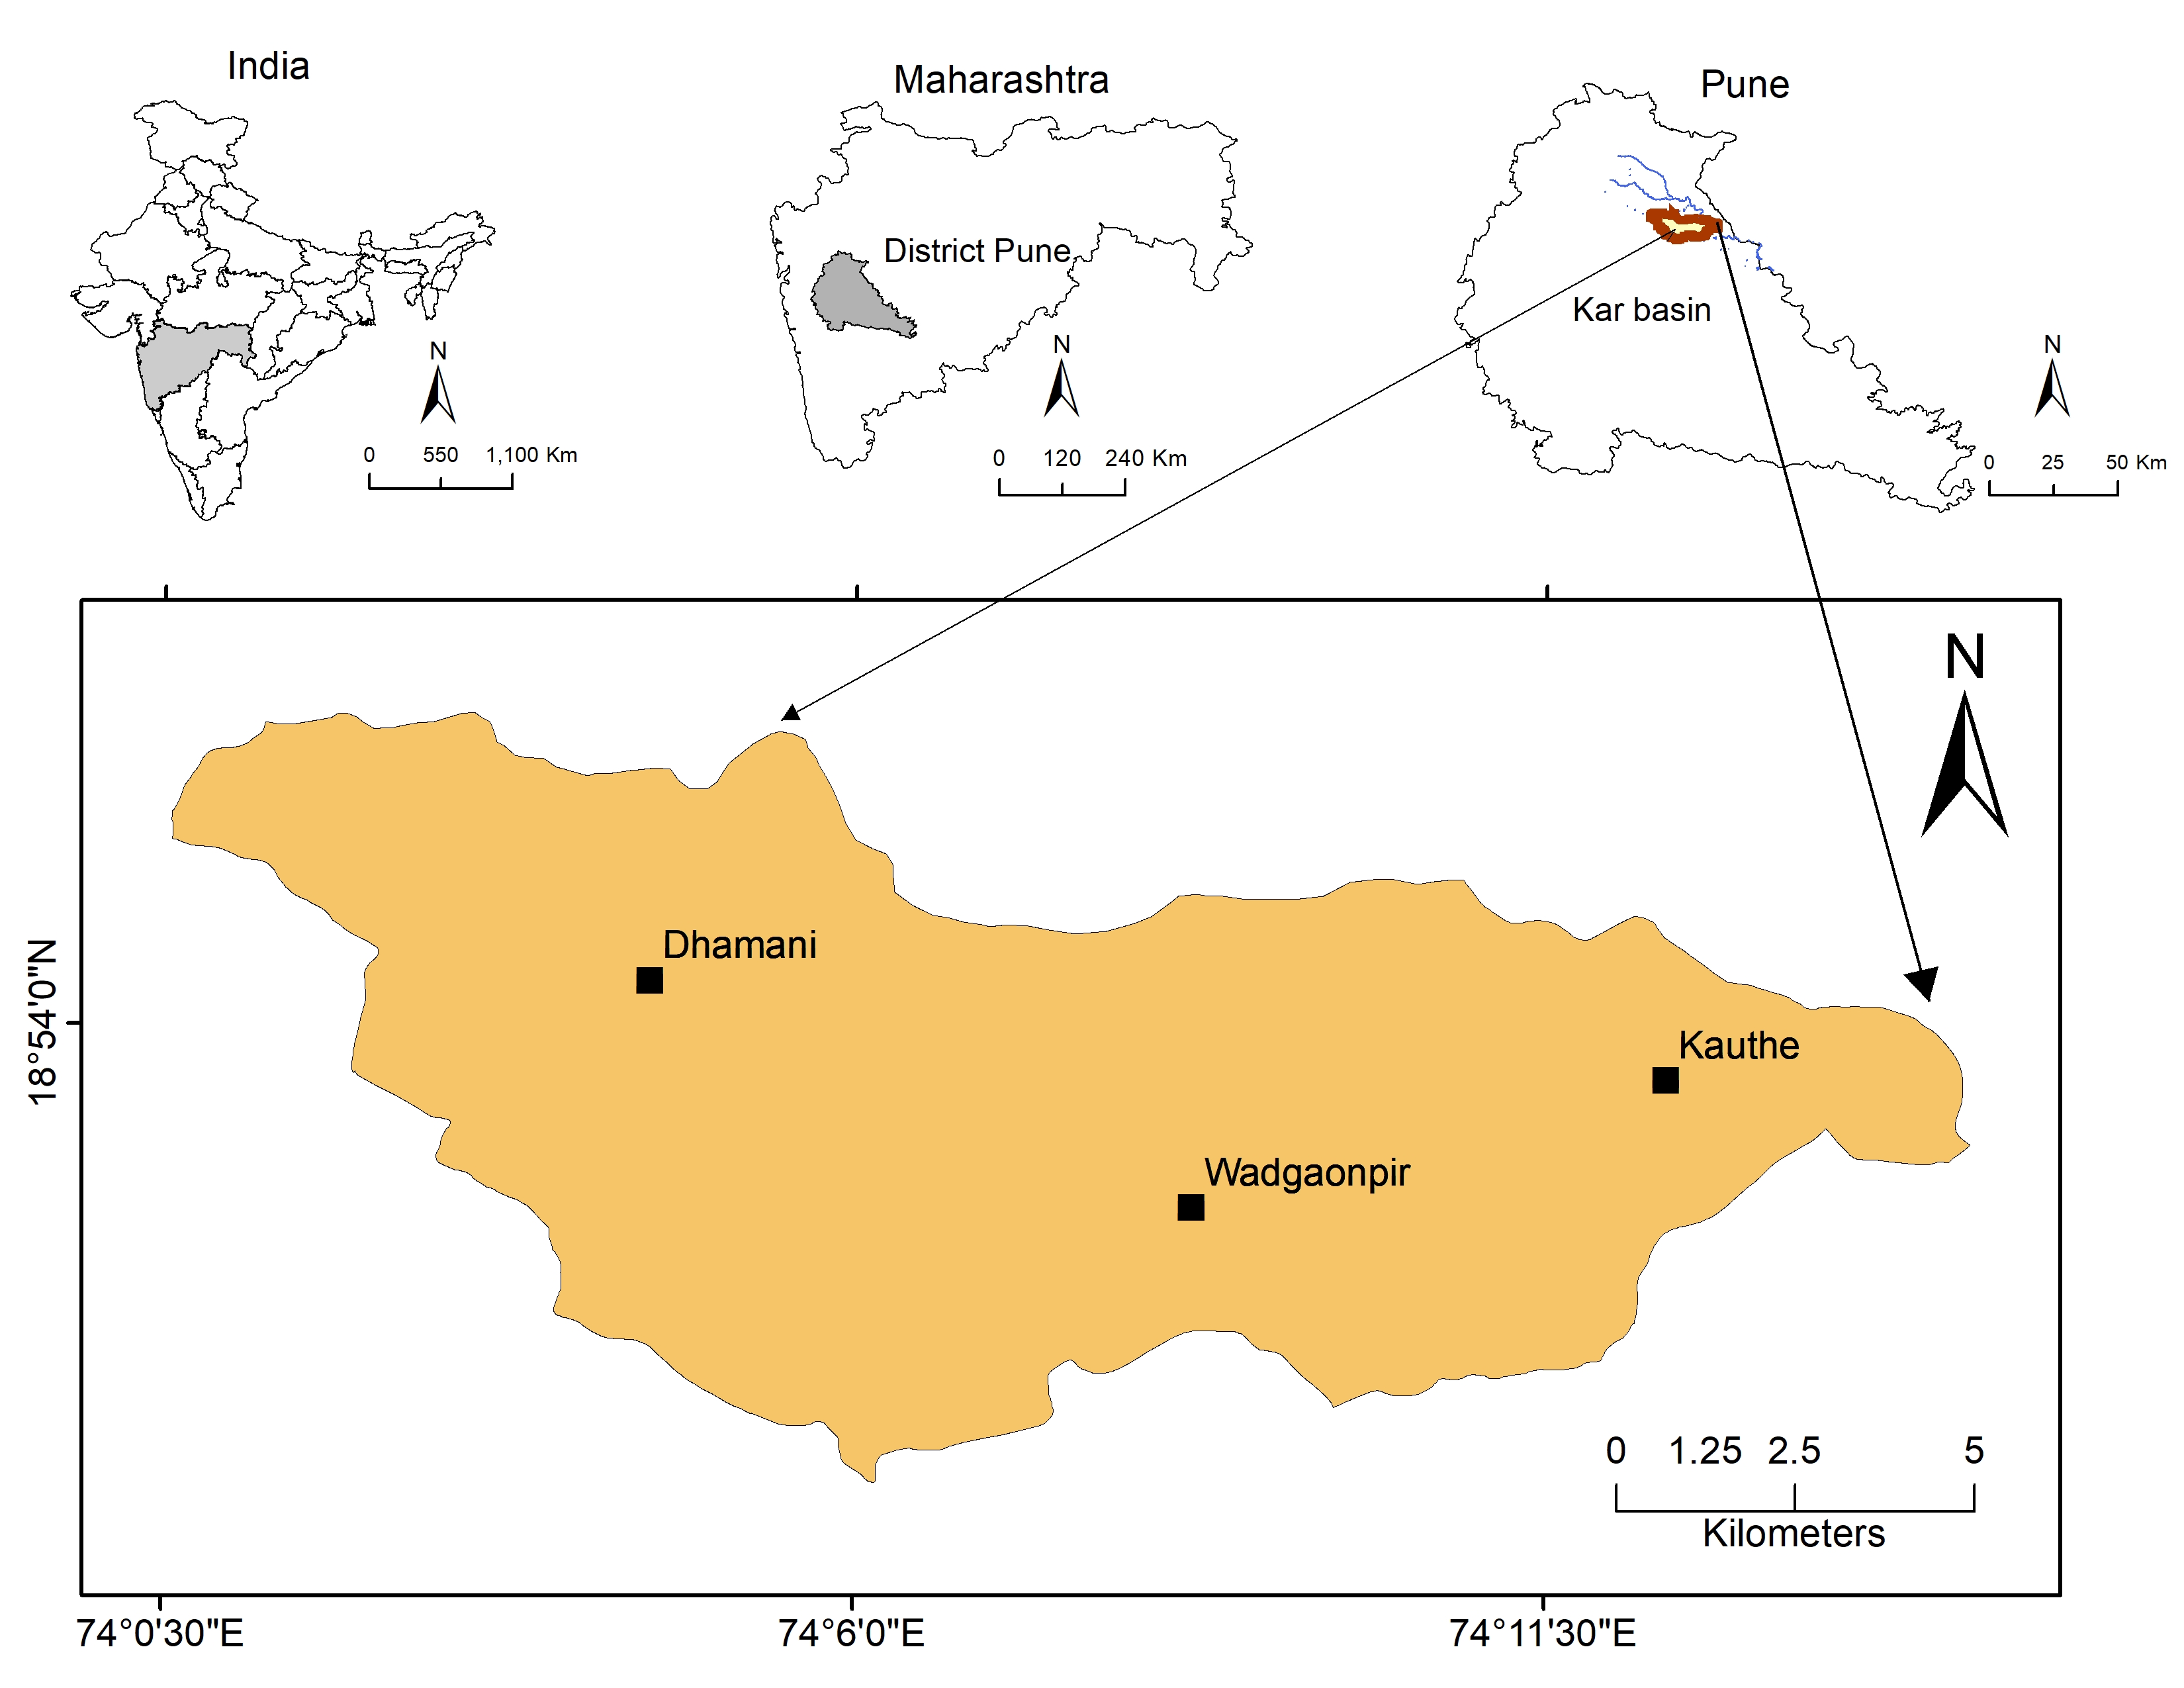
However, very few studies have reported long-term hydrological simulations using HEC-HMS in Indian basins. (Meenu et al., 2012; Singh and Jain, 2015). Kadam et al. (2012) envisaged GIS and remote sensing technologies in suitability analysis for rainwater harvesting sites in the hard rock terrain. The hydrology and hydrogeology characteristics of the present study area are available as studied by Zambre (1983). GIS has been used to analyses the multiple geospatial data with higher flexibility and precision in using groundwater and ground soil quality study for green growth. This technique also used for land suitability analysis and (Zolekar and Bhagat, 2015) and watershed prioritization for development (Gaikwad and Bhagat, 2017). The potential of satellite remote sensing in various applications related to water resources is well established; hence, it is necessary to use this technology not only for targeting of groundwater potential zones (Sreedevi et al., 2005; Chowdary et al., 2009; Oh et al., 2011; Kumar and Krishna, 2016; Mandal and Sahoo, 2016; Kumar et al., 2017) but also for identifying location-specific activities such as percolation tanks, check dams, farm ponds etc. (Dhakate and Rao, 2012; Kadam et al., 2012; Jha et al., 2014; Adham et al., 2016; Ammar et al., 2016; Mahmoud and Alazba, 2016). Applications of remote sensing and GIS in groundwater management such as artificial recharge have been reported by a limited number of researchers (Scanlon et al., 2005; Dhakate and Rao, 2012; Mahmoud et al., 2014; Yeh et al., 2014; Senanayake et al., 2015). In view of this, the present study focuses on the mapping of groundwater prospect zones in Kar river watershed representing basaltic terrain, India were spatial data very less available.
3 . SPATIAL DATA AND METHODOLOGY
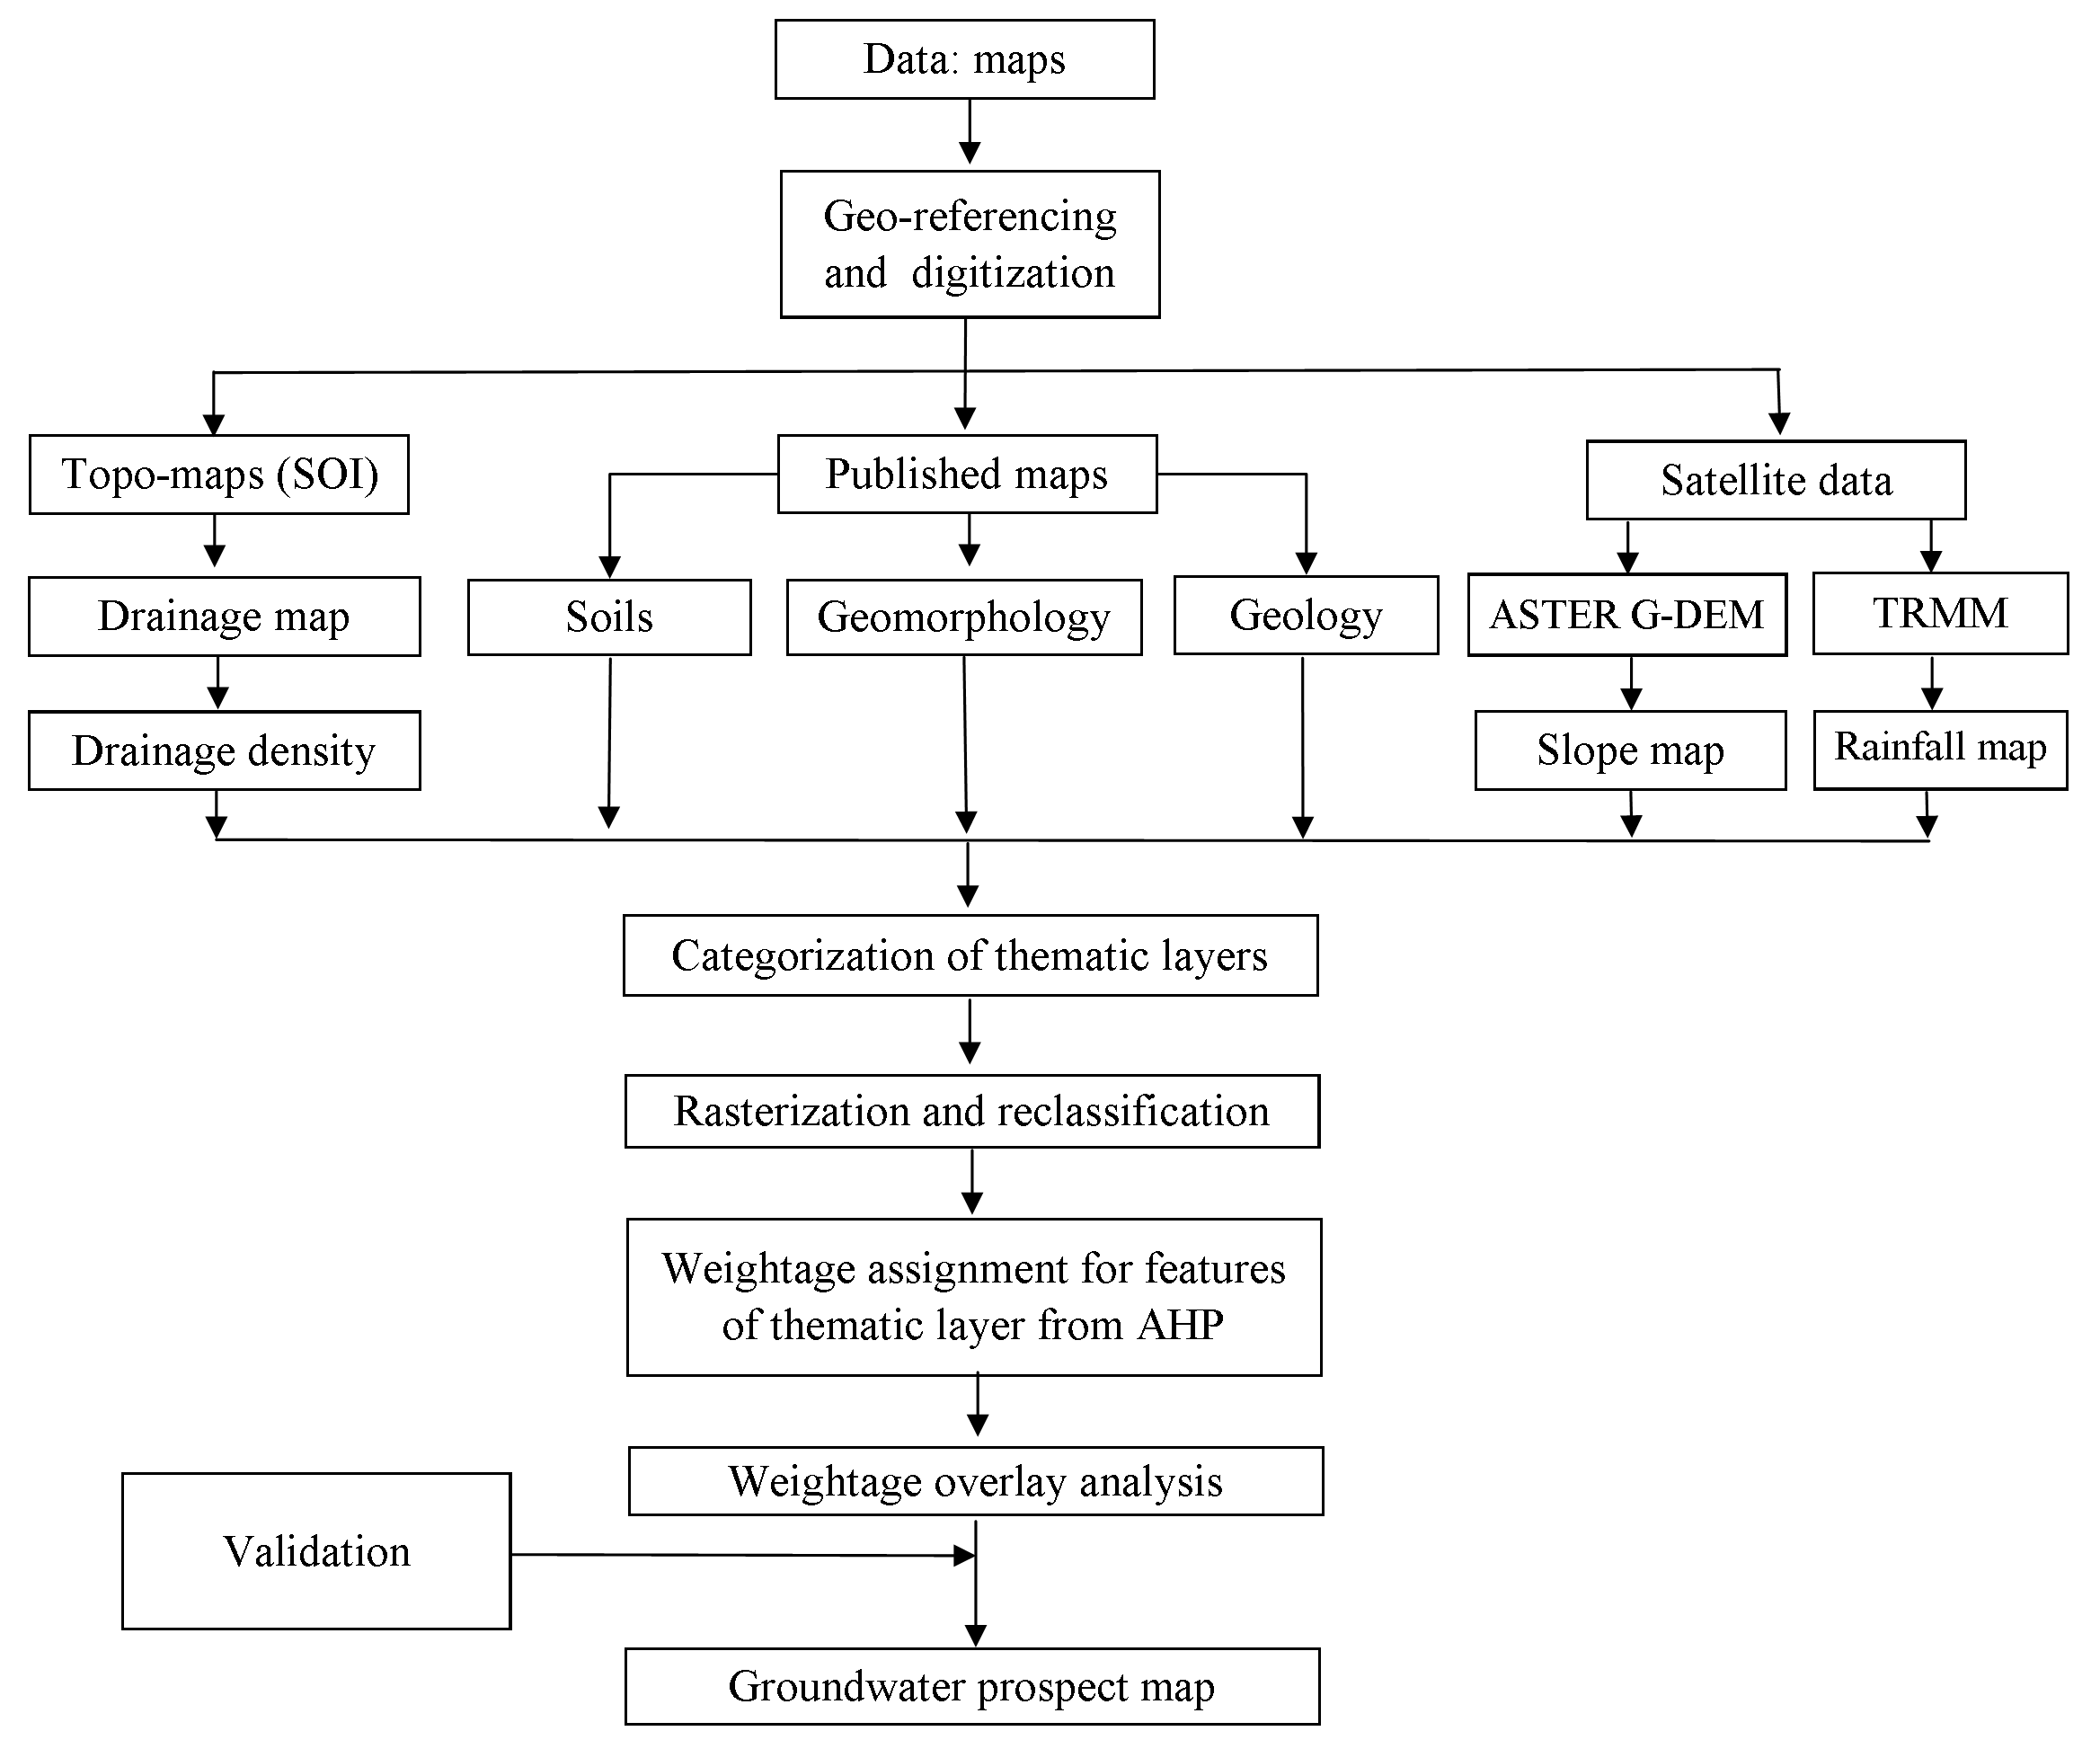
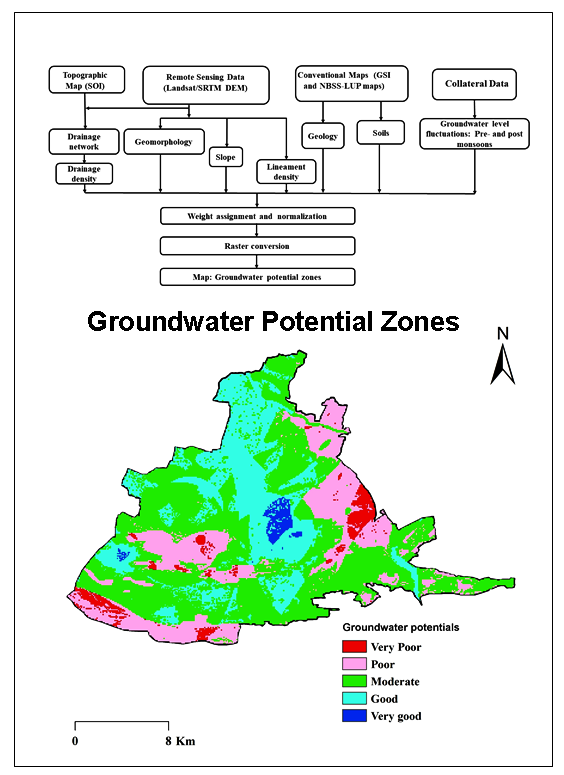
The study was carried out using GIS as a prime tool for the virtual representation of the area. Thirty wells were monitored for the water table fluctuation during the pre-monsoon and post-monsoon seasons for validation purpose. This data was integrated into a GIS environment for the generation of a number of thematic layers, which would help to delineate the groundwater prospects map. The thematic layers virtualized comprise of a geology, geomorphology, slope drainage pattern, drainage density, soil and rainfall as well as the database used is given in Table 1. The methodology adopted for the study is given below (Figure 2).
Table 1. Database
|
Data
|
Scale
|
Layer
|
Derived layer
|
|
Geomorphology map a
|
1: 2,50,000
|
Geomorphology
|
Geomorphology
|
|
Geological map b
|
1: 50,000
|
Geology
|
Geology
|
|
Topologic maps c
|
1: 50,000
|
Drainage
|
Drainage density
|
|
Soil map d
|
1: 2,50,000
|
Soil
|
Hydrological soil groups
|
|
|
|
|
|
|
ASTER GDEM e
|
|
DEM
|
Slope
|
|
Rainfall f
|
Tropical Rainfall Measuring Mission (TRMM) database
|
Rainfall distribution
|
Rainfall distribution
|
a National Atlas and Thematic Mapping Organization (NATMO), Kolkata.
b Geological Survey of India (GSI) India.
c Survey of India
d National Bureau of Soil Survey and Land Use Planning (NBSS and LUP), Nagpur.
e NASA’s Land Processes Distributed Active Archive Center (LP DAAC).
f Tropical Rainfall Measuring Mission (TRMM) database.
AHP is a model that has been widely used by different researchers in the field of natural resources and environmental management (Kumar and Krishna 2016; Mogaji, 2017). The final weight of each conditioning factor is shown in Table 2. The result of pairwise comparison indicated that the parameters namely aquifer thickness, lithology, water table level, and distance from the river have taken the highest weights. In this study, the CR value is 0.04; the ratio reflects a reasonable level of consistency in the pair-wise comparison phase. For this purpose, each layer mentioned above was converted into a raster format, reclassified and assigned weights from one to three depending on whether the area could
favour the storage of water or no; with one being the least favourable and three being the most. Later all these layers were overlaid and a combined map considering the favourable locations of all the layers is generated (Figure 9). Areas with high gradient will have low potential as there will be a higher runoff. Similarly, areas with dense and compact rocks will have lower potential as water will not percolate. Clayey soil will also not allow water to percolate. Thus, these factors play an important role even if the rainfall is high. Rainfall too is not uniform across the area.
Satellite data like TRMM, Landsat – 8 and ASTER data have been interpreted to derive certain conclusions. The TRMM data gives us the regional variation of rainfall within the basin at a 30 m resolution. It provides valuable input about how much water the area receives as precipitation and its variation. This is an important factor as it determines the main input of the groundwater. The Landsat data was used to study the land use and land cover. These factors are important because, even though the rainfall might be high, the surface should favour its path vertically downward. If the area is a concrete forest there is relatively no permeability in comparison to a green forest. Finally, we have the ASTER data which serves as a digital elevation model. This is another important factor as the permeability is also a function of the slope. The sharper the gradient the more the run off and hence a lower chance of groundwater recharge. Thus, thematic maps are prepared which are basically representations of the data in the form of colors on the map itself. The geomorphic and litho units have been determined via field observations and then co related on the satellite data.
The aquifer is a perched aquifer in hard rock basalt in which most of the porosity is secondary, in the form of cracks, fractures and faults. All the stratigraphic successions are composed of basalt. These basalts vary in types like vesicular, amygdaloidal and compact. Thus, in each of these cases, the potential is low and the strata have only been distinguished as the various impulses as flows. In vesicular basalt too, the vesicles aren’t or seldom connected, so the potential doesn’t increase much anyway (Table 1).
3.1 Geology
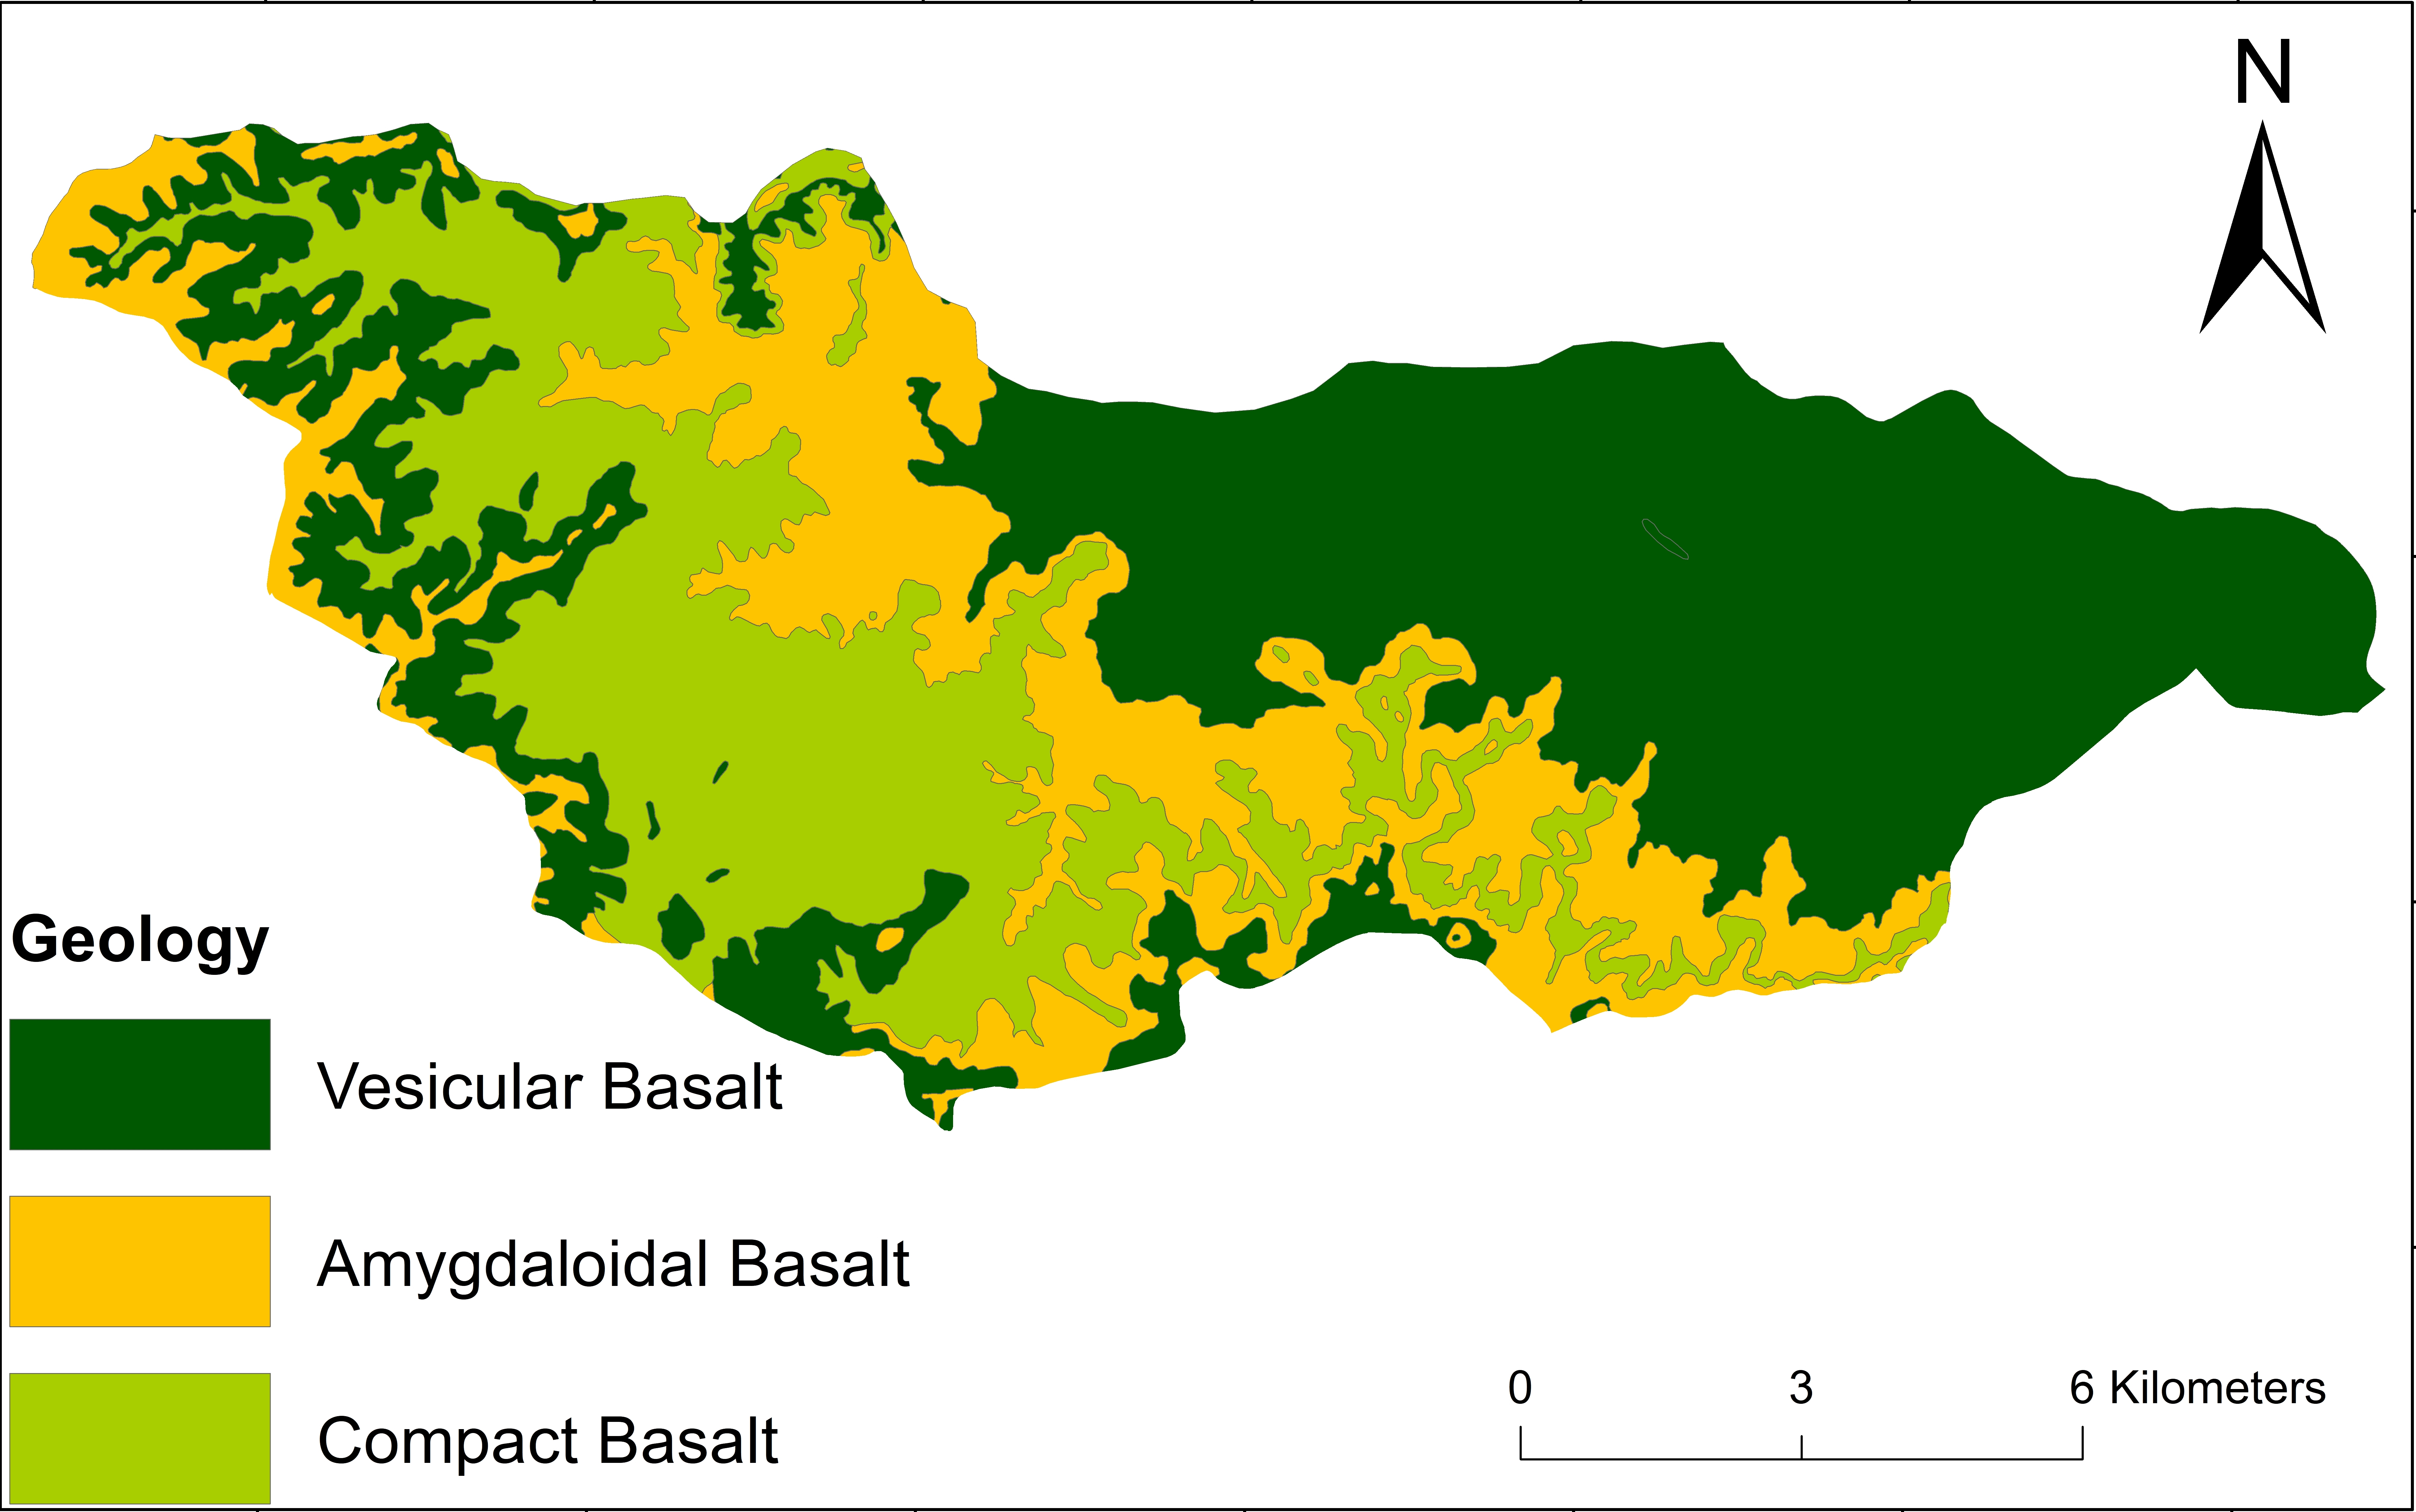
In the Deccan Volcanic Province, the majority of the area is comprised of basalt. The basalt is compact at most locations while amygdaloidal basalt is encountered seldom. A mafic dyke is seen cross-cutting one of the good sections in the central area. Fractures and joints, both vertical and horizontal in nature are frequently seen in the basalt (Figure 3). The geological was obtained from Geological Survey of India (GSI).
3.2 Geomorphology
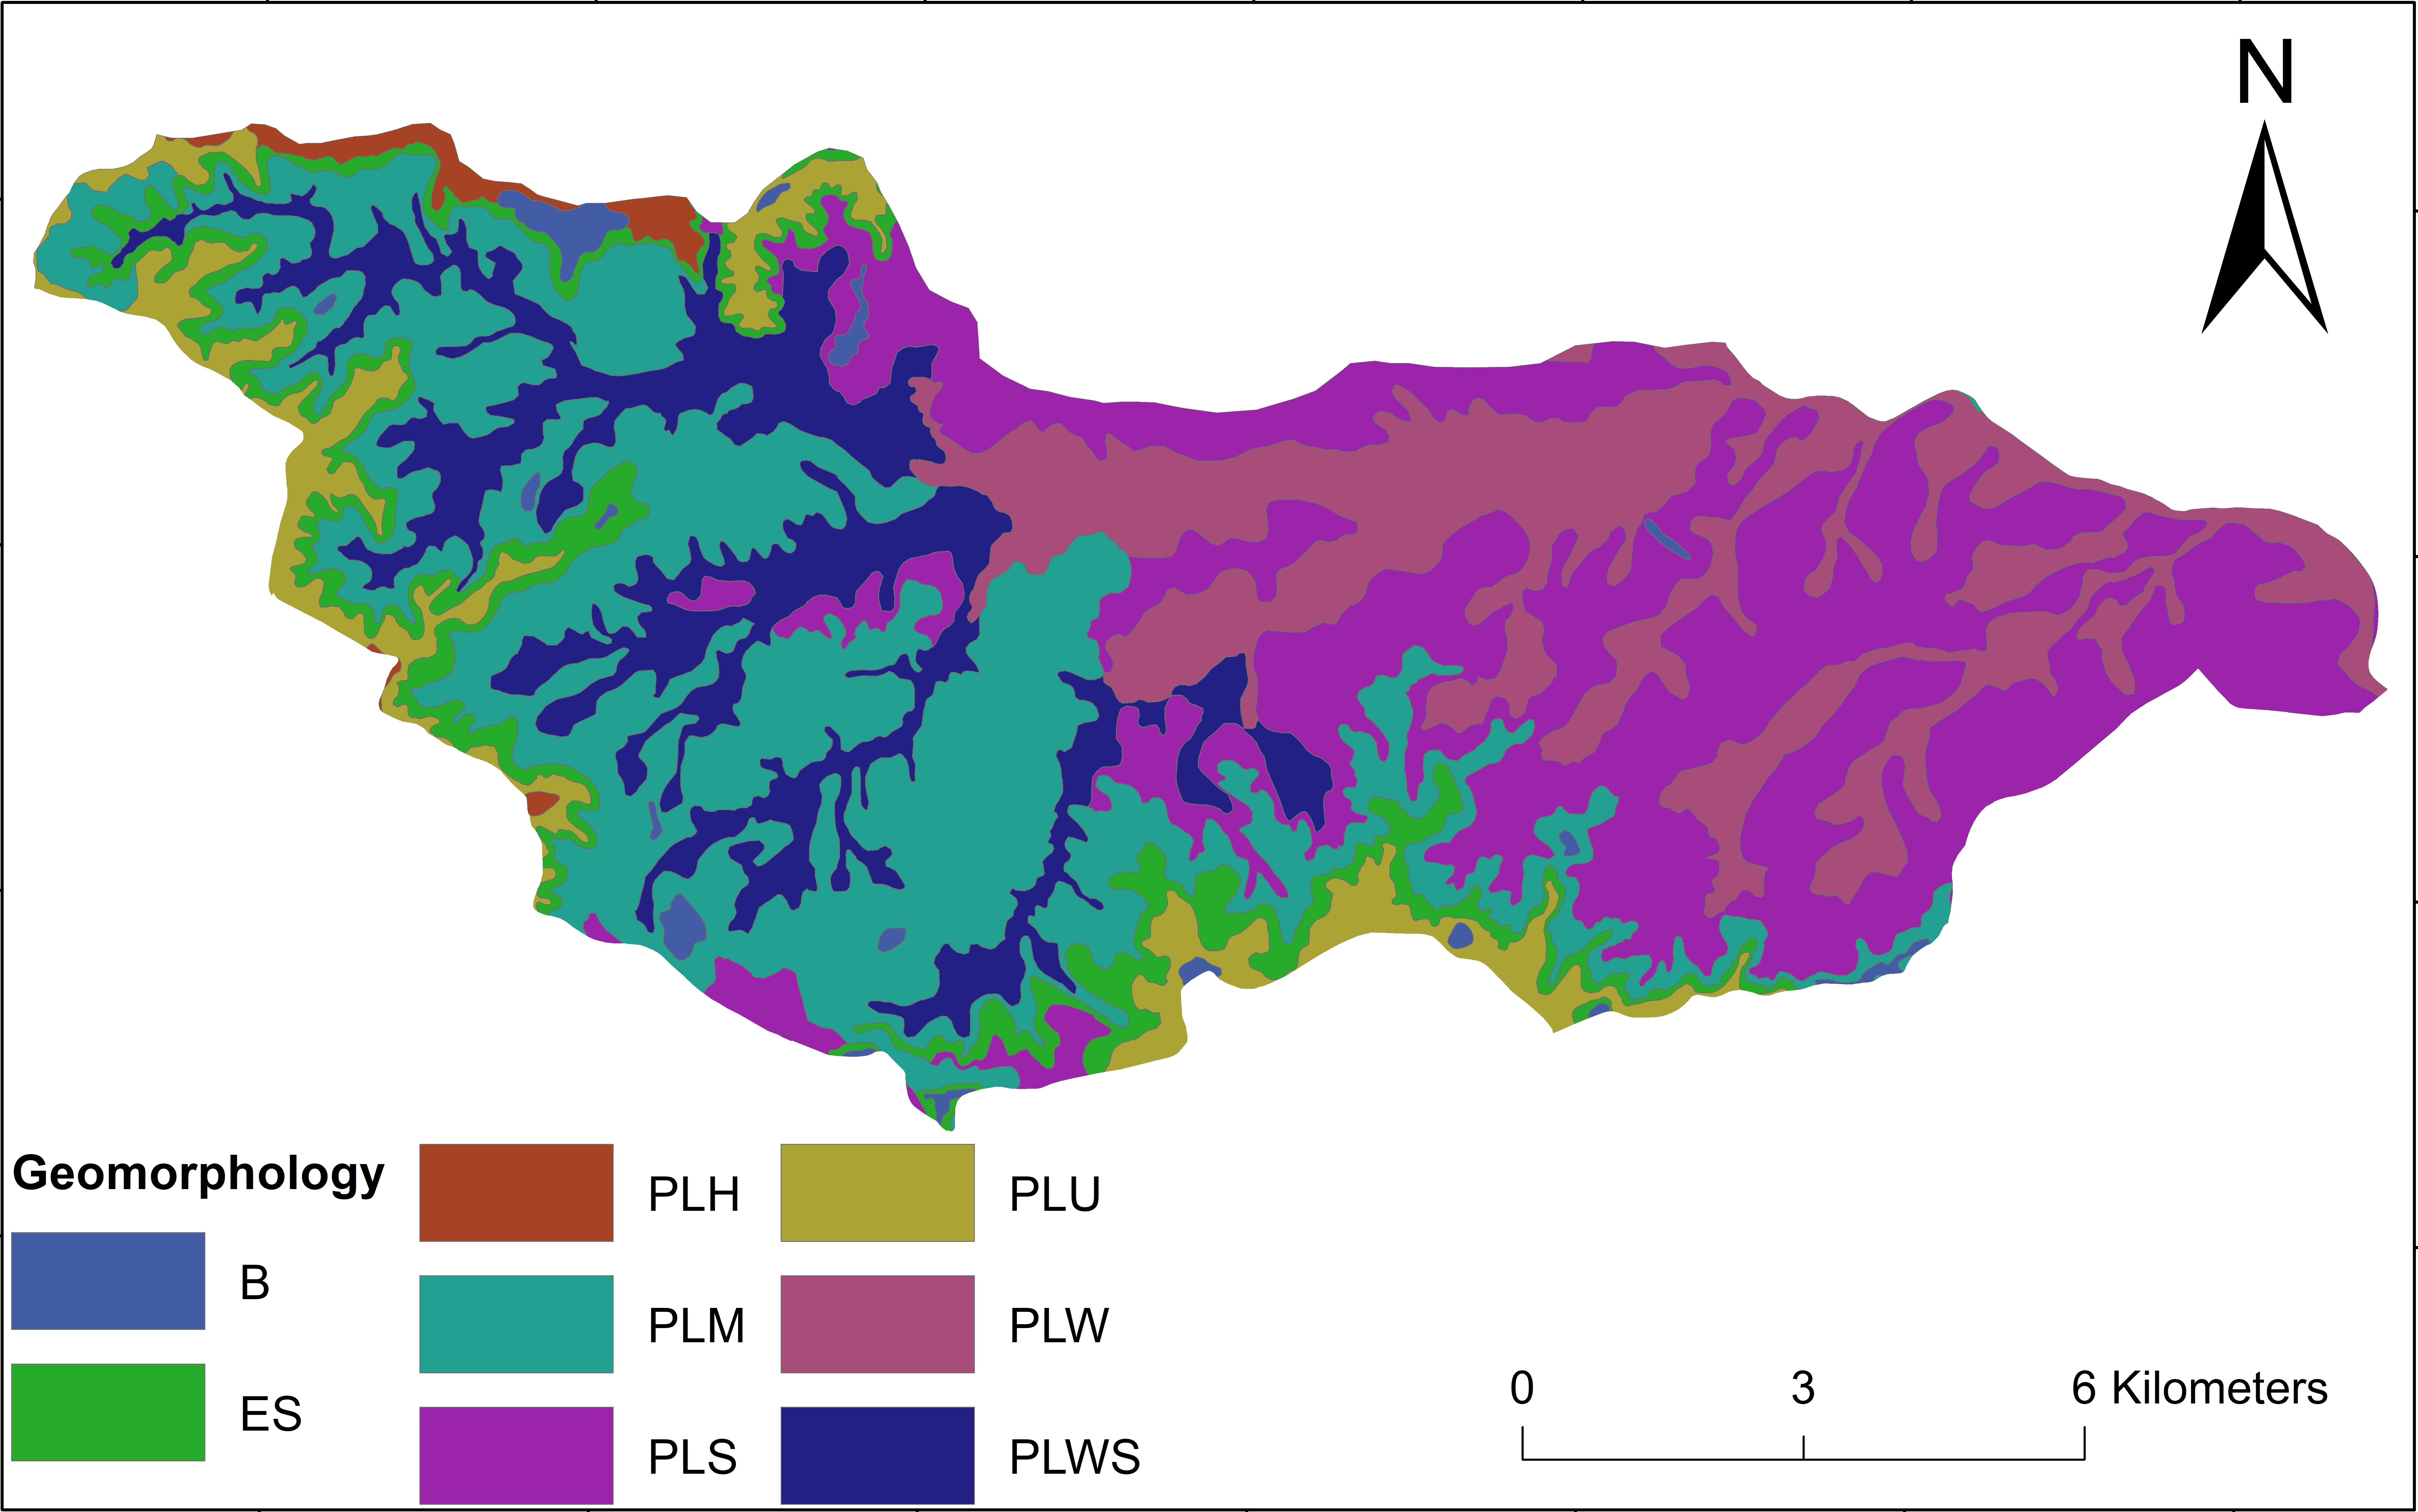
Majority of the area is a remnant plateau of the gigantic Deccan Volcanic Province. The other dominating morphology is of rounded hills and ridges, which occupy the Northwestern quadrant of the study area. Considering all the local geomorphological features, the area exhibits a Highly Dissected Plateau (PHD), Moderately Dissected Plateau (PMD), Slightly Dissected Plateau (PSD), Undissected Plateau (PLU), Weathered Plateau (PW), Shallow-Weathered Plateau, Buttes (B) and Escarpments (ES) (Figure 4).
3.3 Slope
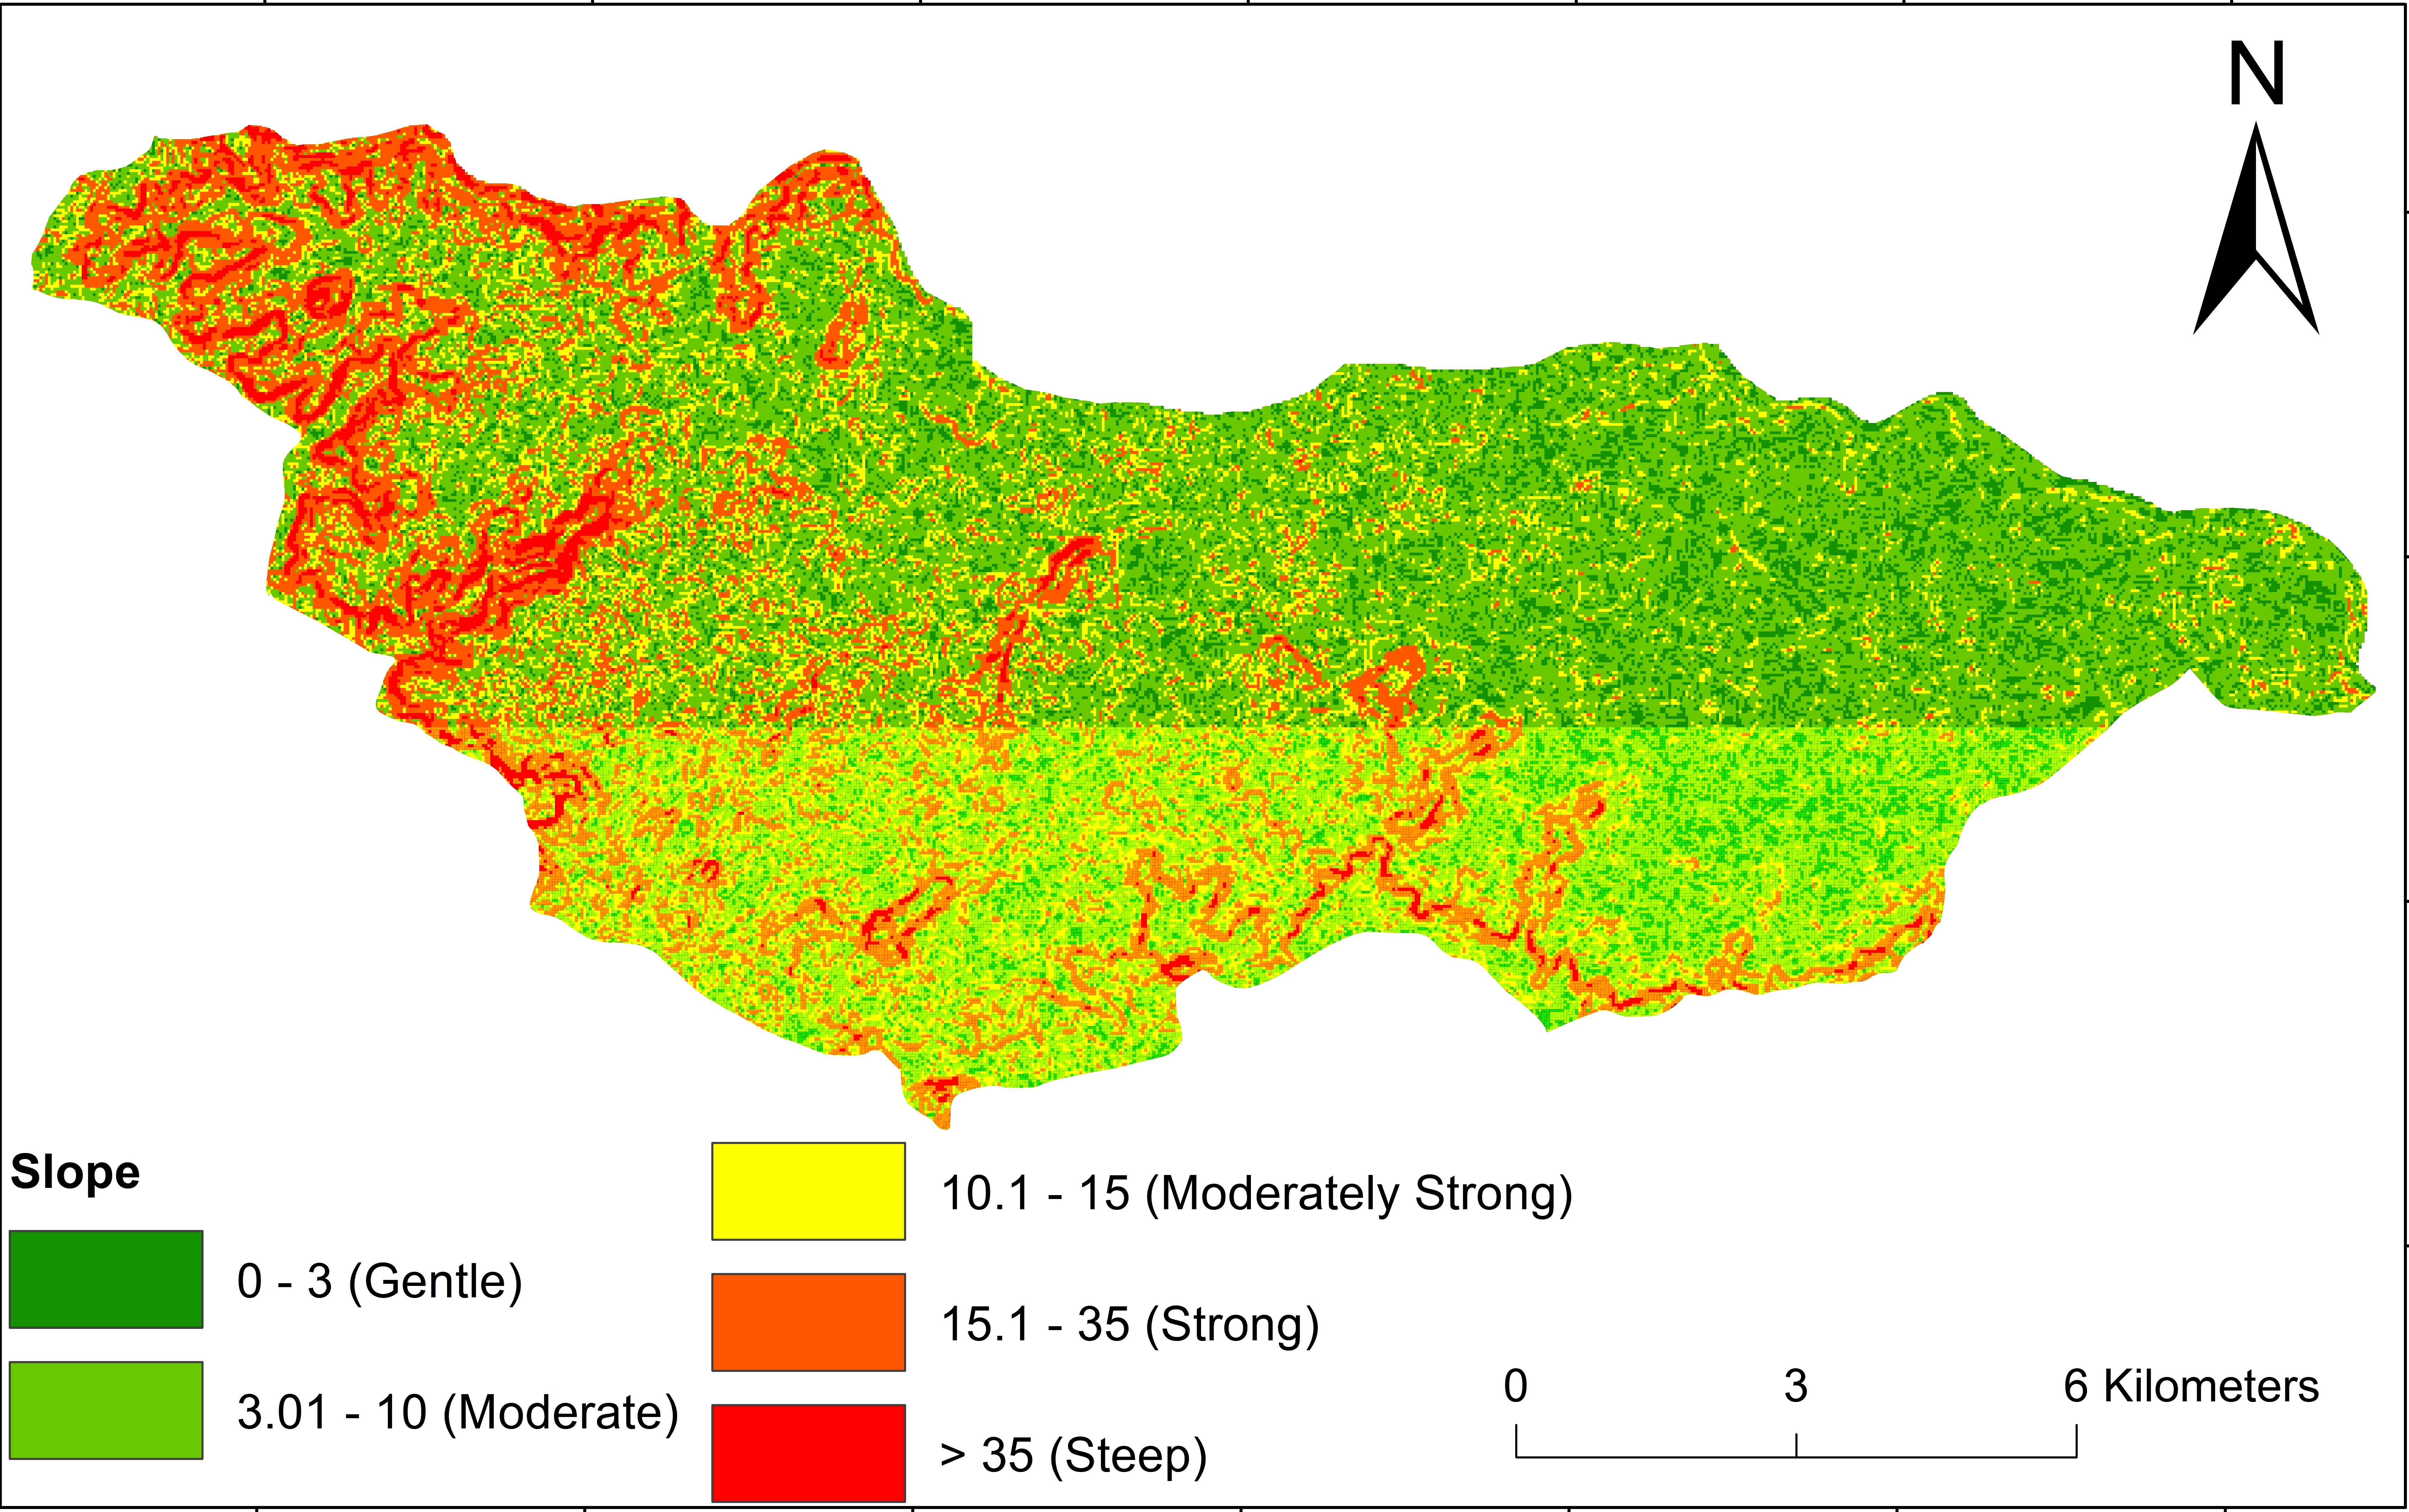
The slope (percent) of the area is generated from the DEM which has a resolution of 30 m (Figure 5). The area is divided into 5 slope classes (IMSD, 1995). ‘Gentle’ class is assigned to the areas having 0-3% slope, and as flat terrain promotes higher infiltration, it is the most important of the slope classes. ‘Moderate’ class denotes areas with 3-10% slope, which signifies a slightly undulating topography with some runoff. The geology of area also influences the amount of runoff and infiltration. A slope of 10-15% will lead to relatively high runoff and low infiltration and fall under the ‘moderately strong’ class. A slope between 15-35% will fall under the ‘strong’ class and ultimately, areas with slope >35% are considered as ‘steep’ as they majorly contribute to runoff even if the subsurface geology is favourable.Each of these units were prioritized while creating the groundwater prospects map by using AHP which is described further.
3.4 Drainage Density
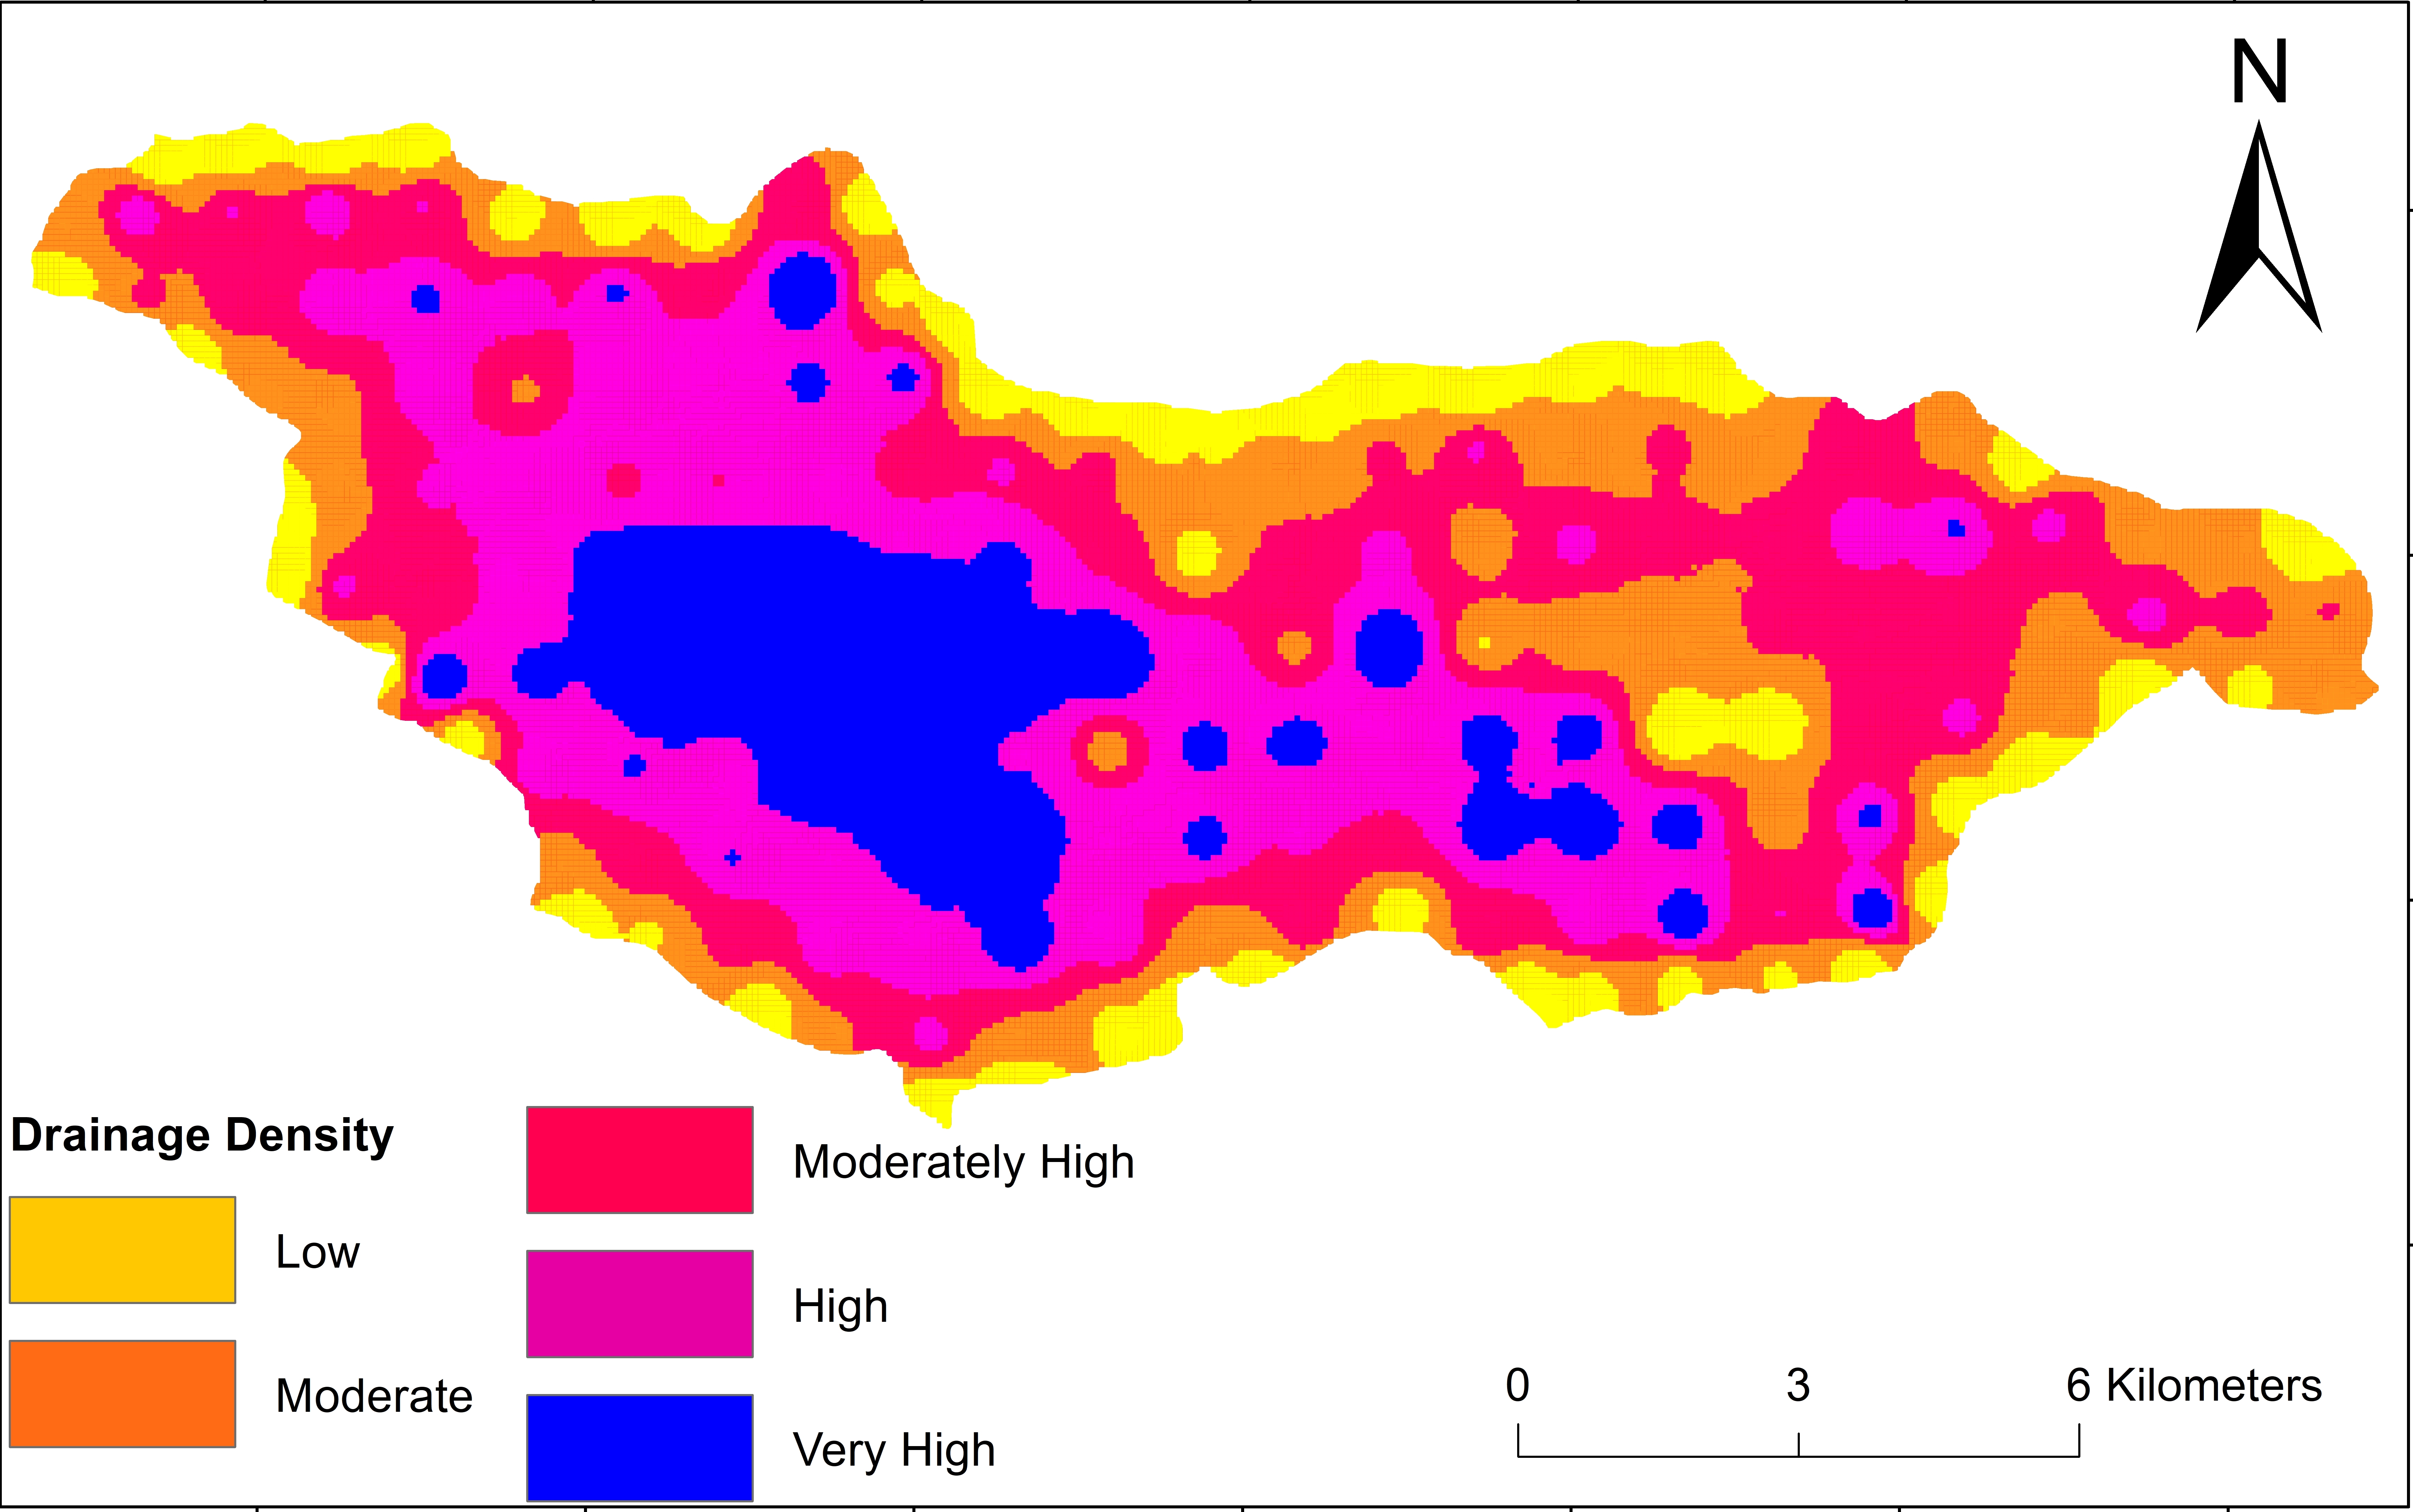
Drainage density is defined as the closeness of spacing of stream channels per unit area. The drainage density of the area has a direct relation with the topography, the geomorphology, the subsurface geology and the land use in the area. Five classes are created to depict the variation in the drainage density. The classes assigned are ‘low’ (0-0.97 km/km2), ‘moderate’ (0.98-2.21 km/km2), ‘moderately high’ (2.21 -3.28 km/km2), ‘high’ (3.29-4.25 km/km2) and ‘very high’ (4.26-5.74 km/km2) respectively (Figure 6). Deriving drainage density and its relation to surface runoff and rock permeability help in delineating groundwater potential zones.
3.5 Soil
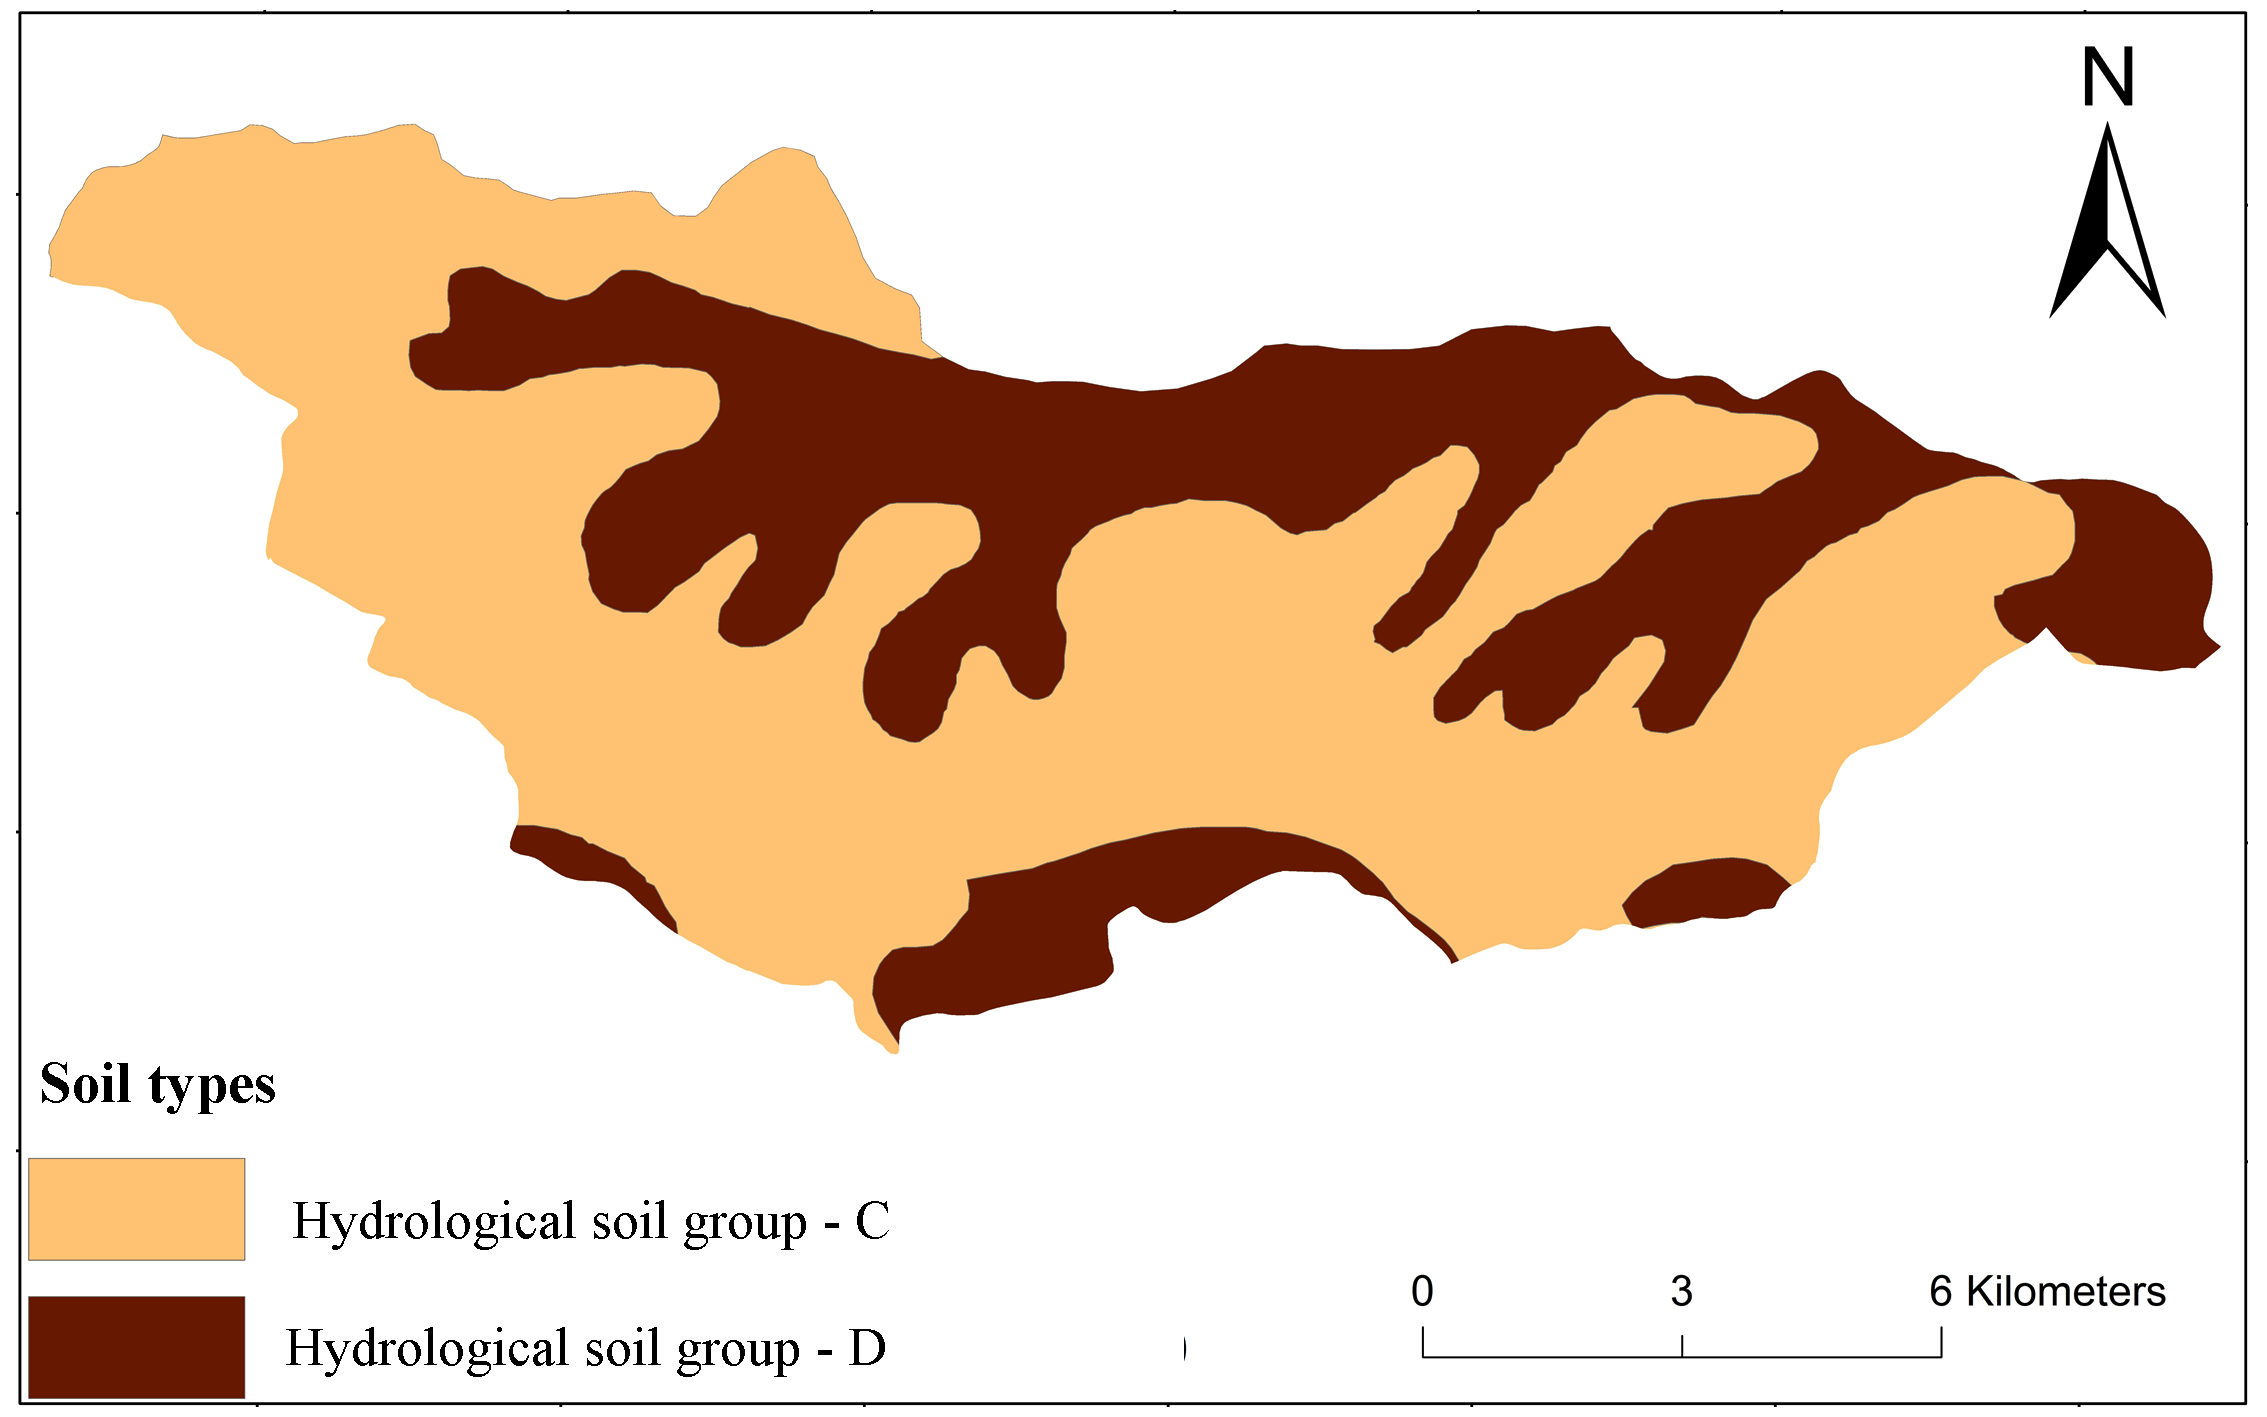
A well-defined soil horizon is developed at most locations. The soil is reddish brown in colour and frequently exhibits mud cracks. This justifies the semi-arid climate of the area. The soil map was acquired from Soil Atlas and Soil Characteristic data from Natural Bureau of Soil Survey and Land Use Planning (NBSS and LUP) Nagpur. According to the soil classification, the soil is of two types i.e. clay loam and clay. Majority of the soil is of clay loam, while we encounter clay along the riverbank. These represent Hydrological Soil Group - C and Hydrological Soil Group – D respectively (Figure 7).
3.6 Rainfall
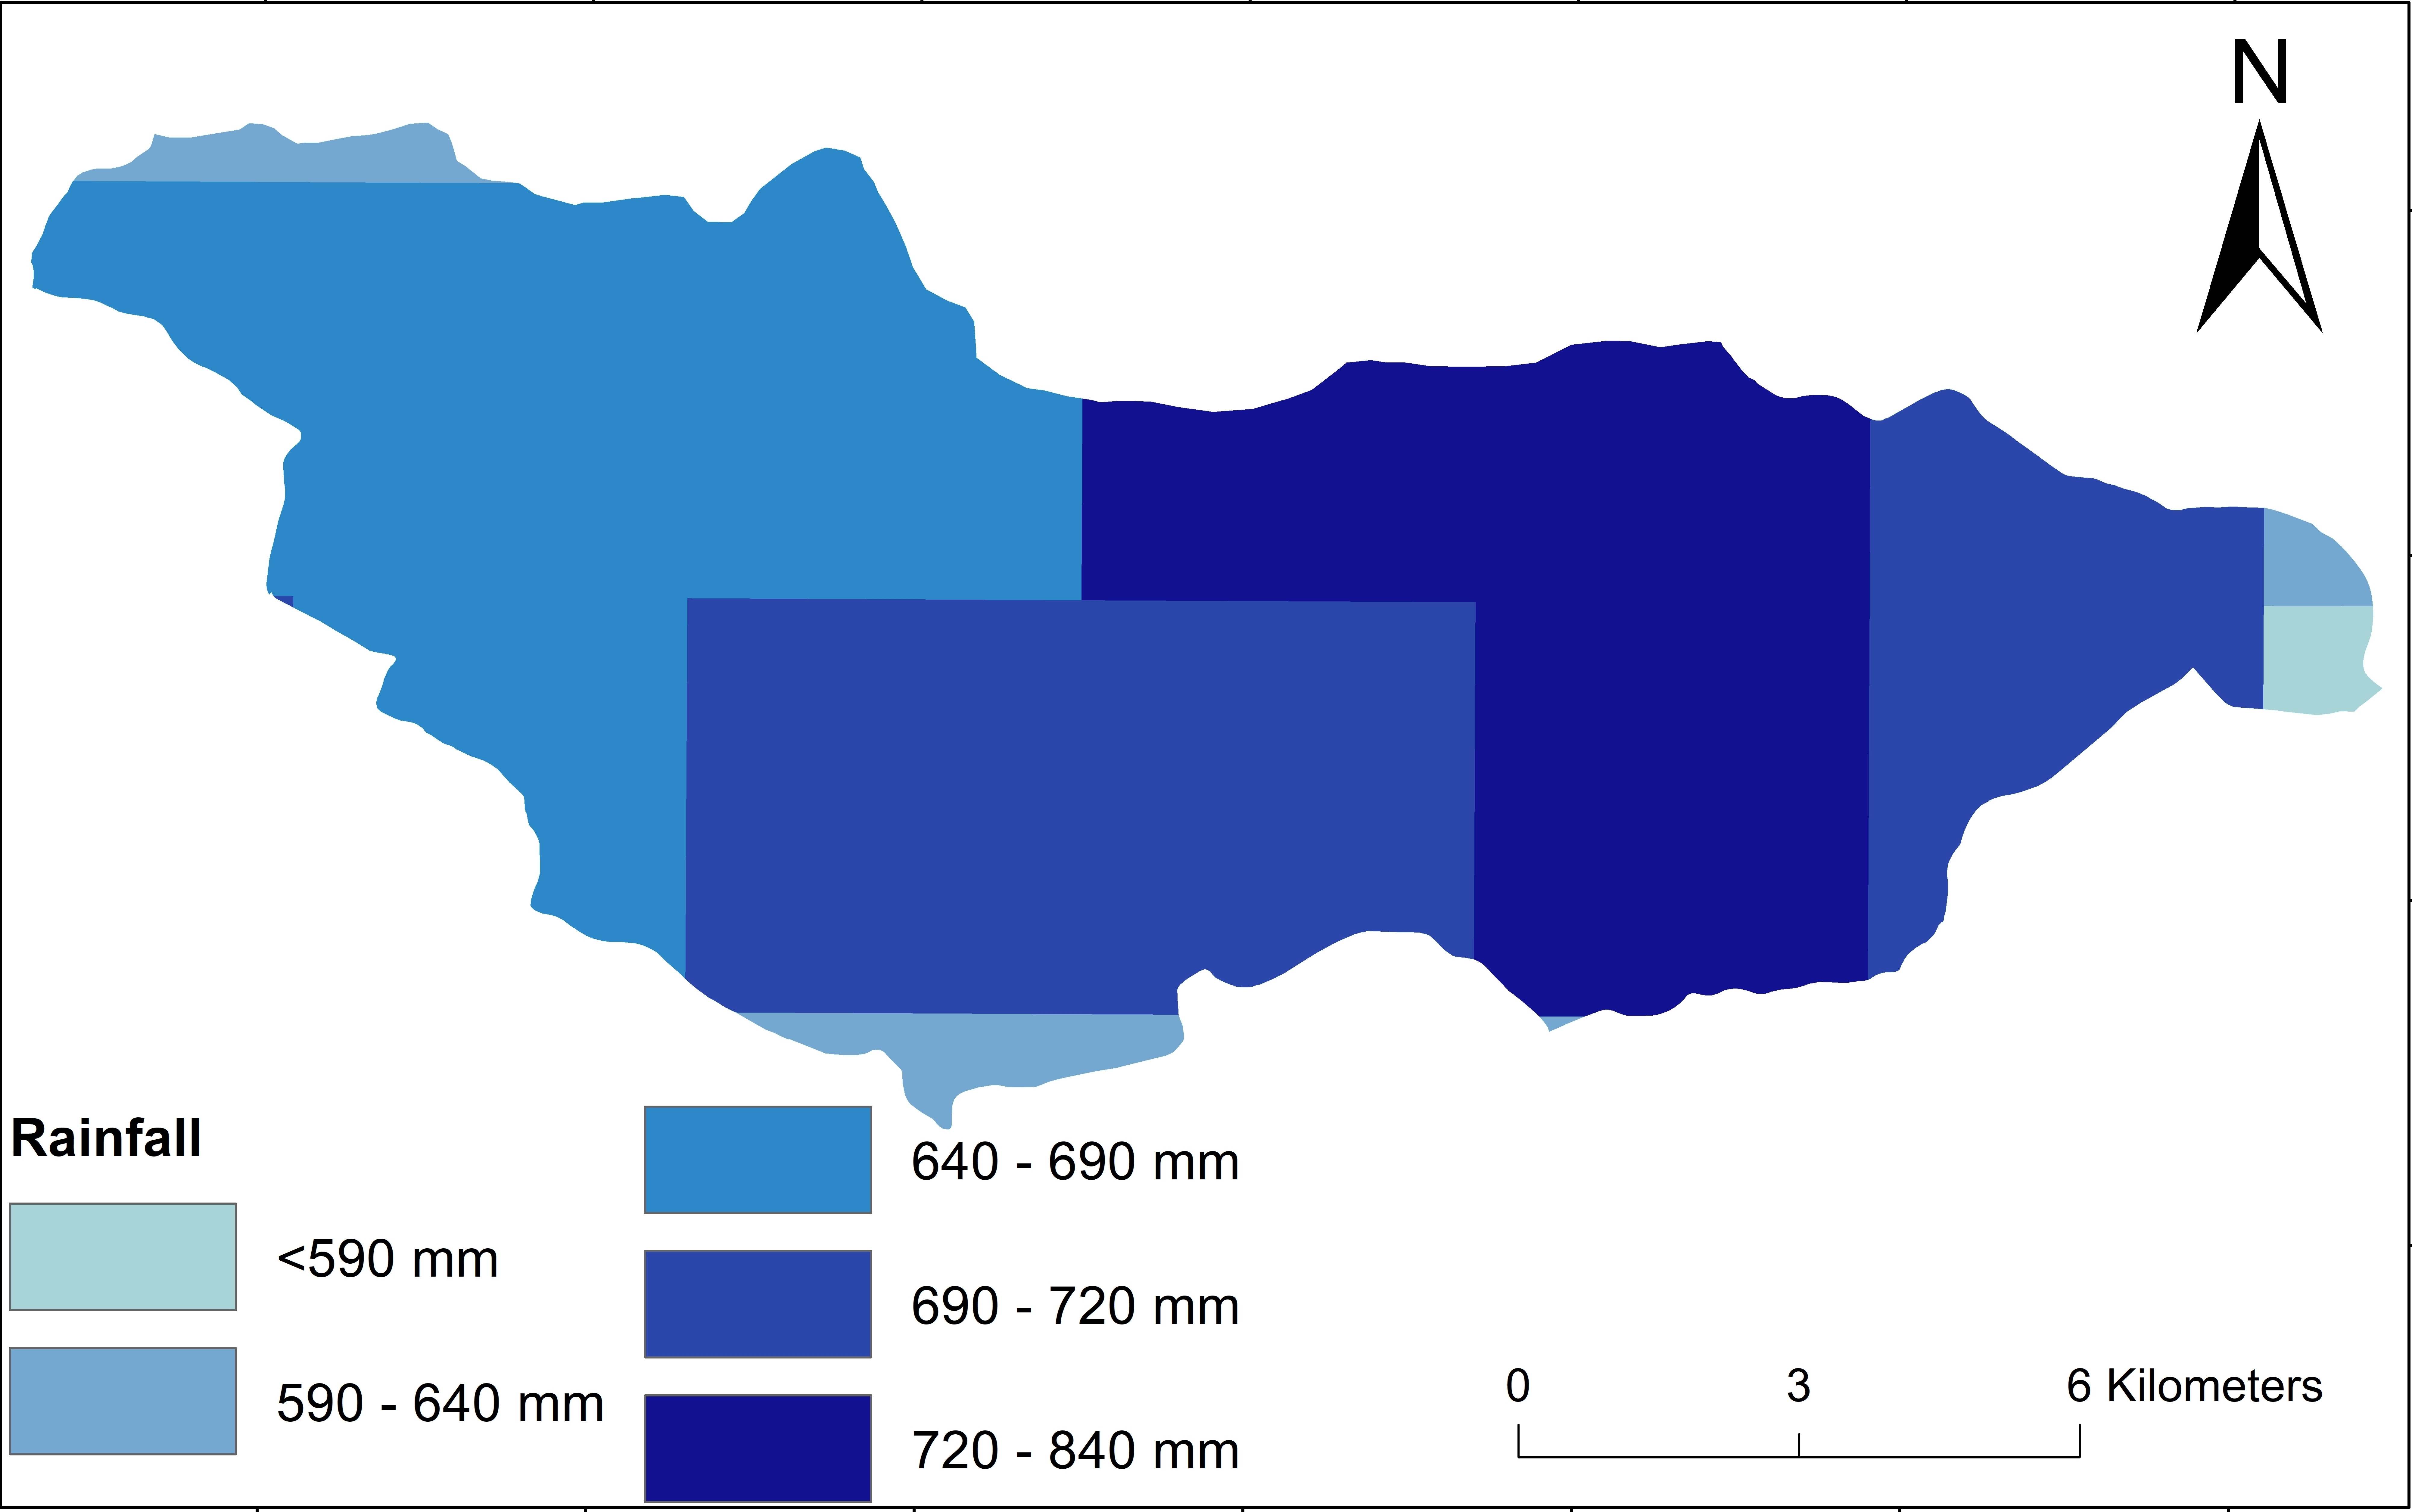
The rainfall data of the study area was acquired the from Tropical Rainfall Measuring Mission (TRMM) satellite, which has a resolution of 0.5º grid. The data were further classified into five classes using natural breaks method to determine the rainfall distribution of area. The rainfall varies from 690 mm to 840 mm (Figure 8).
3.7 Analytical Hierarchy Process (AHP)
The AHP was used for groundwater prospects mapping in the study area. This approach allows the user for group management, where the researcher can use their scientific knowledge and understanding to solve a problem as a hierarchy structure. It allows the user to remove the biasness by using following six steps 1) outline the unstructured aim and objectives, 2) define the complete conditions and options, 3) use pairwise comparisons between the influencing parameter to prepare comparison matrices, 4) Use the eigenvalue method to define the comparative weights of the influencing parameter, 5) Normalization of weights by dividing sum of total weights of column and 6) Compute the consistency index of the matrices and obtain an overall rating for the alternatives.
With the purpose of defining the weight of each influencing parameter, judgment ratings based on Saaty’s 1–9 scale (Saaty, 2008) were prepared and filled by several experts (hydrologist, hydrogeologists, etc.). Consequently, all the groundwater-influencing parameters were compared against each other in a pairwise comparison matrix. The following equation is used to compute the consistency ratio (\(CR\)).
\(CR = {CI \over RI}\) (1)
Where, \(RI\) is the random index whose value depending on the influencing parameter; and \(CI\) is the consistency index, which is calculated by the following equation,
\(CI = {(\lambda \ max -n)/(n-1)}\) (2)
3.8 Definition of the GWPMI
The groundwater prospects mapping index (\(GWPMI\)) is a unitless quantity that is applied to perform the groundwater potential mapping in the study area. It is calculated using following equation.
\(GWPMI = \sum_{w=1}^{m} \sum_{i=1}^{n} W_i X_j\) (3)
WhereWi is the AHP percent normalized weights of the influencing parameter (thematic layer), \(X_j\) is the rank assigned to each sub-criteria respect to the jth layer, m is the total number of influencing parameter, and n is the total number of sub-criteria of that thematic layer. The values for all layers are given by the equation below,
\(GWPMI-Gmw\ Gmwf+Gew\ Gewf+Sw\ Swf+Ddw\ Ddwf+Rfw\ Rfwf+Slw\ Slwf\) (4)
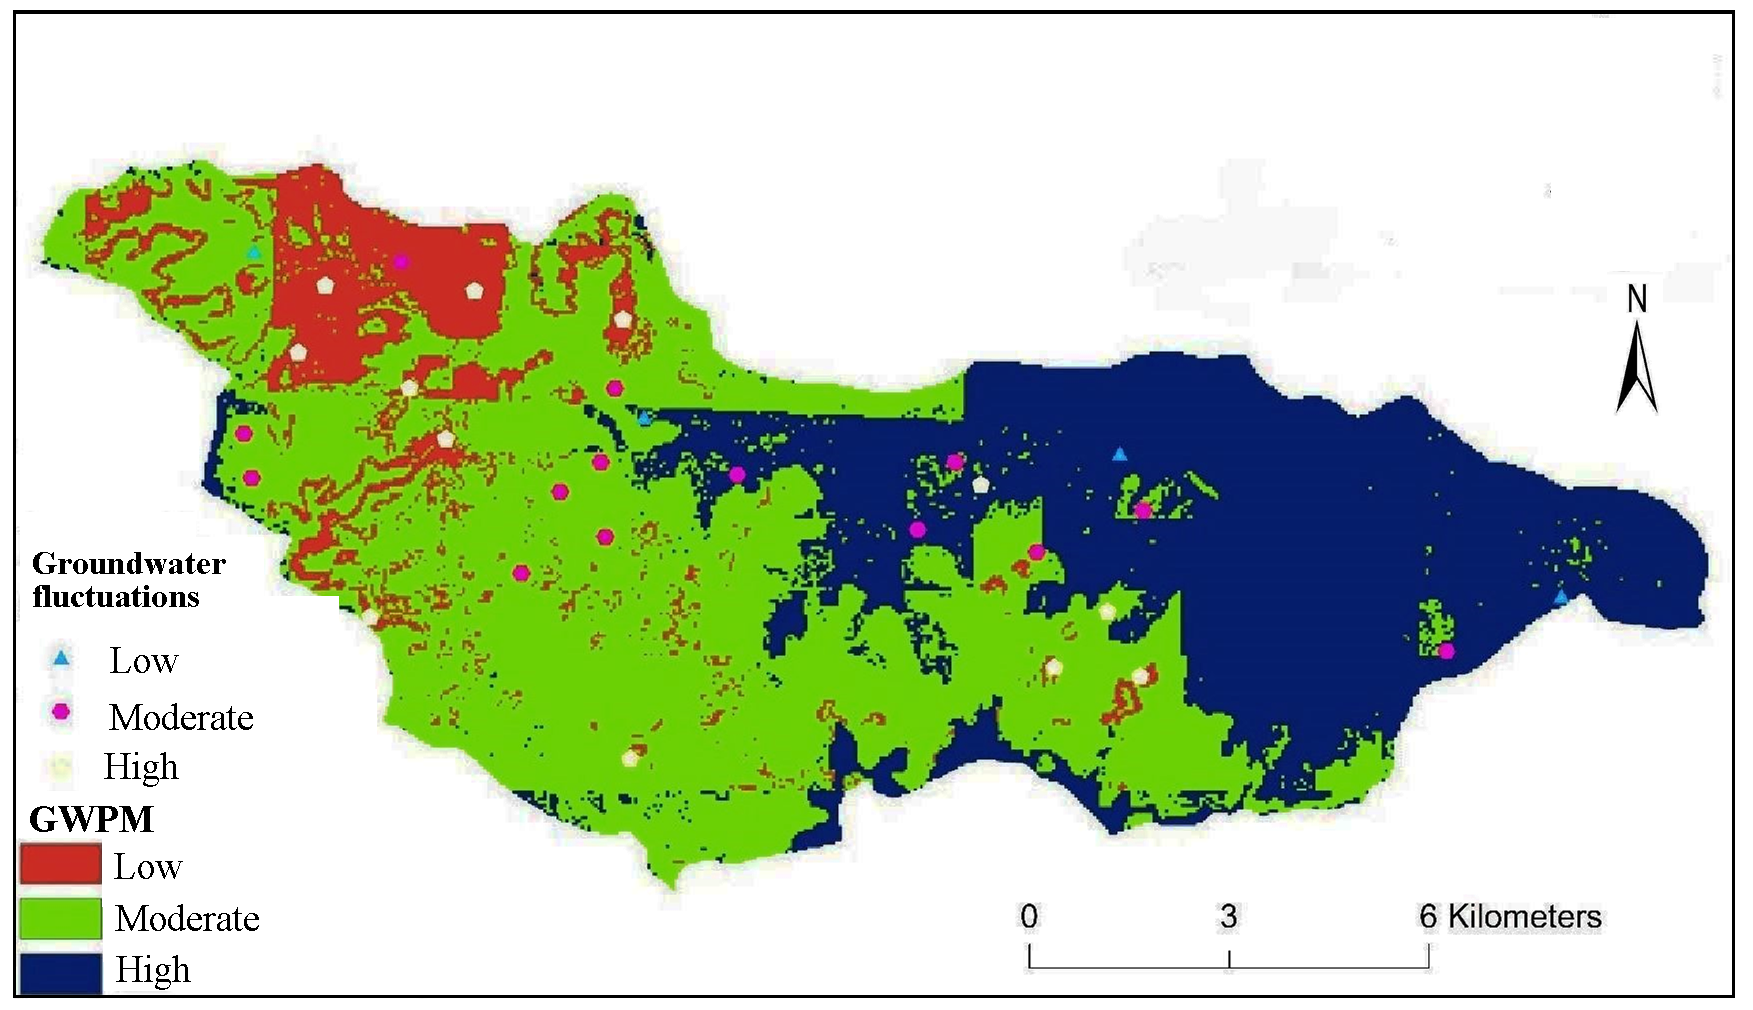
\(GWPMI\) is the groundwater prospects mapping index for each pixel, \(Gm\) is the Geomorphology, \(Ge\) is geology, \(S\) is the Soil, \(Dd\) is the drainage density, \(Rf\) is the rainfall and \(Sl\) is the Slope. \(GWPMI\) values were grouped into three classes; namely, low, moderate and high where the natural breaks classification method was used in order to prepare the groundwater prospect map.
3.9 Validation
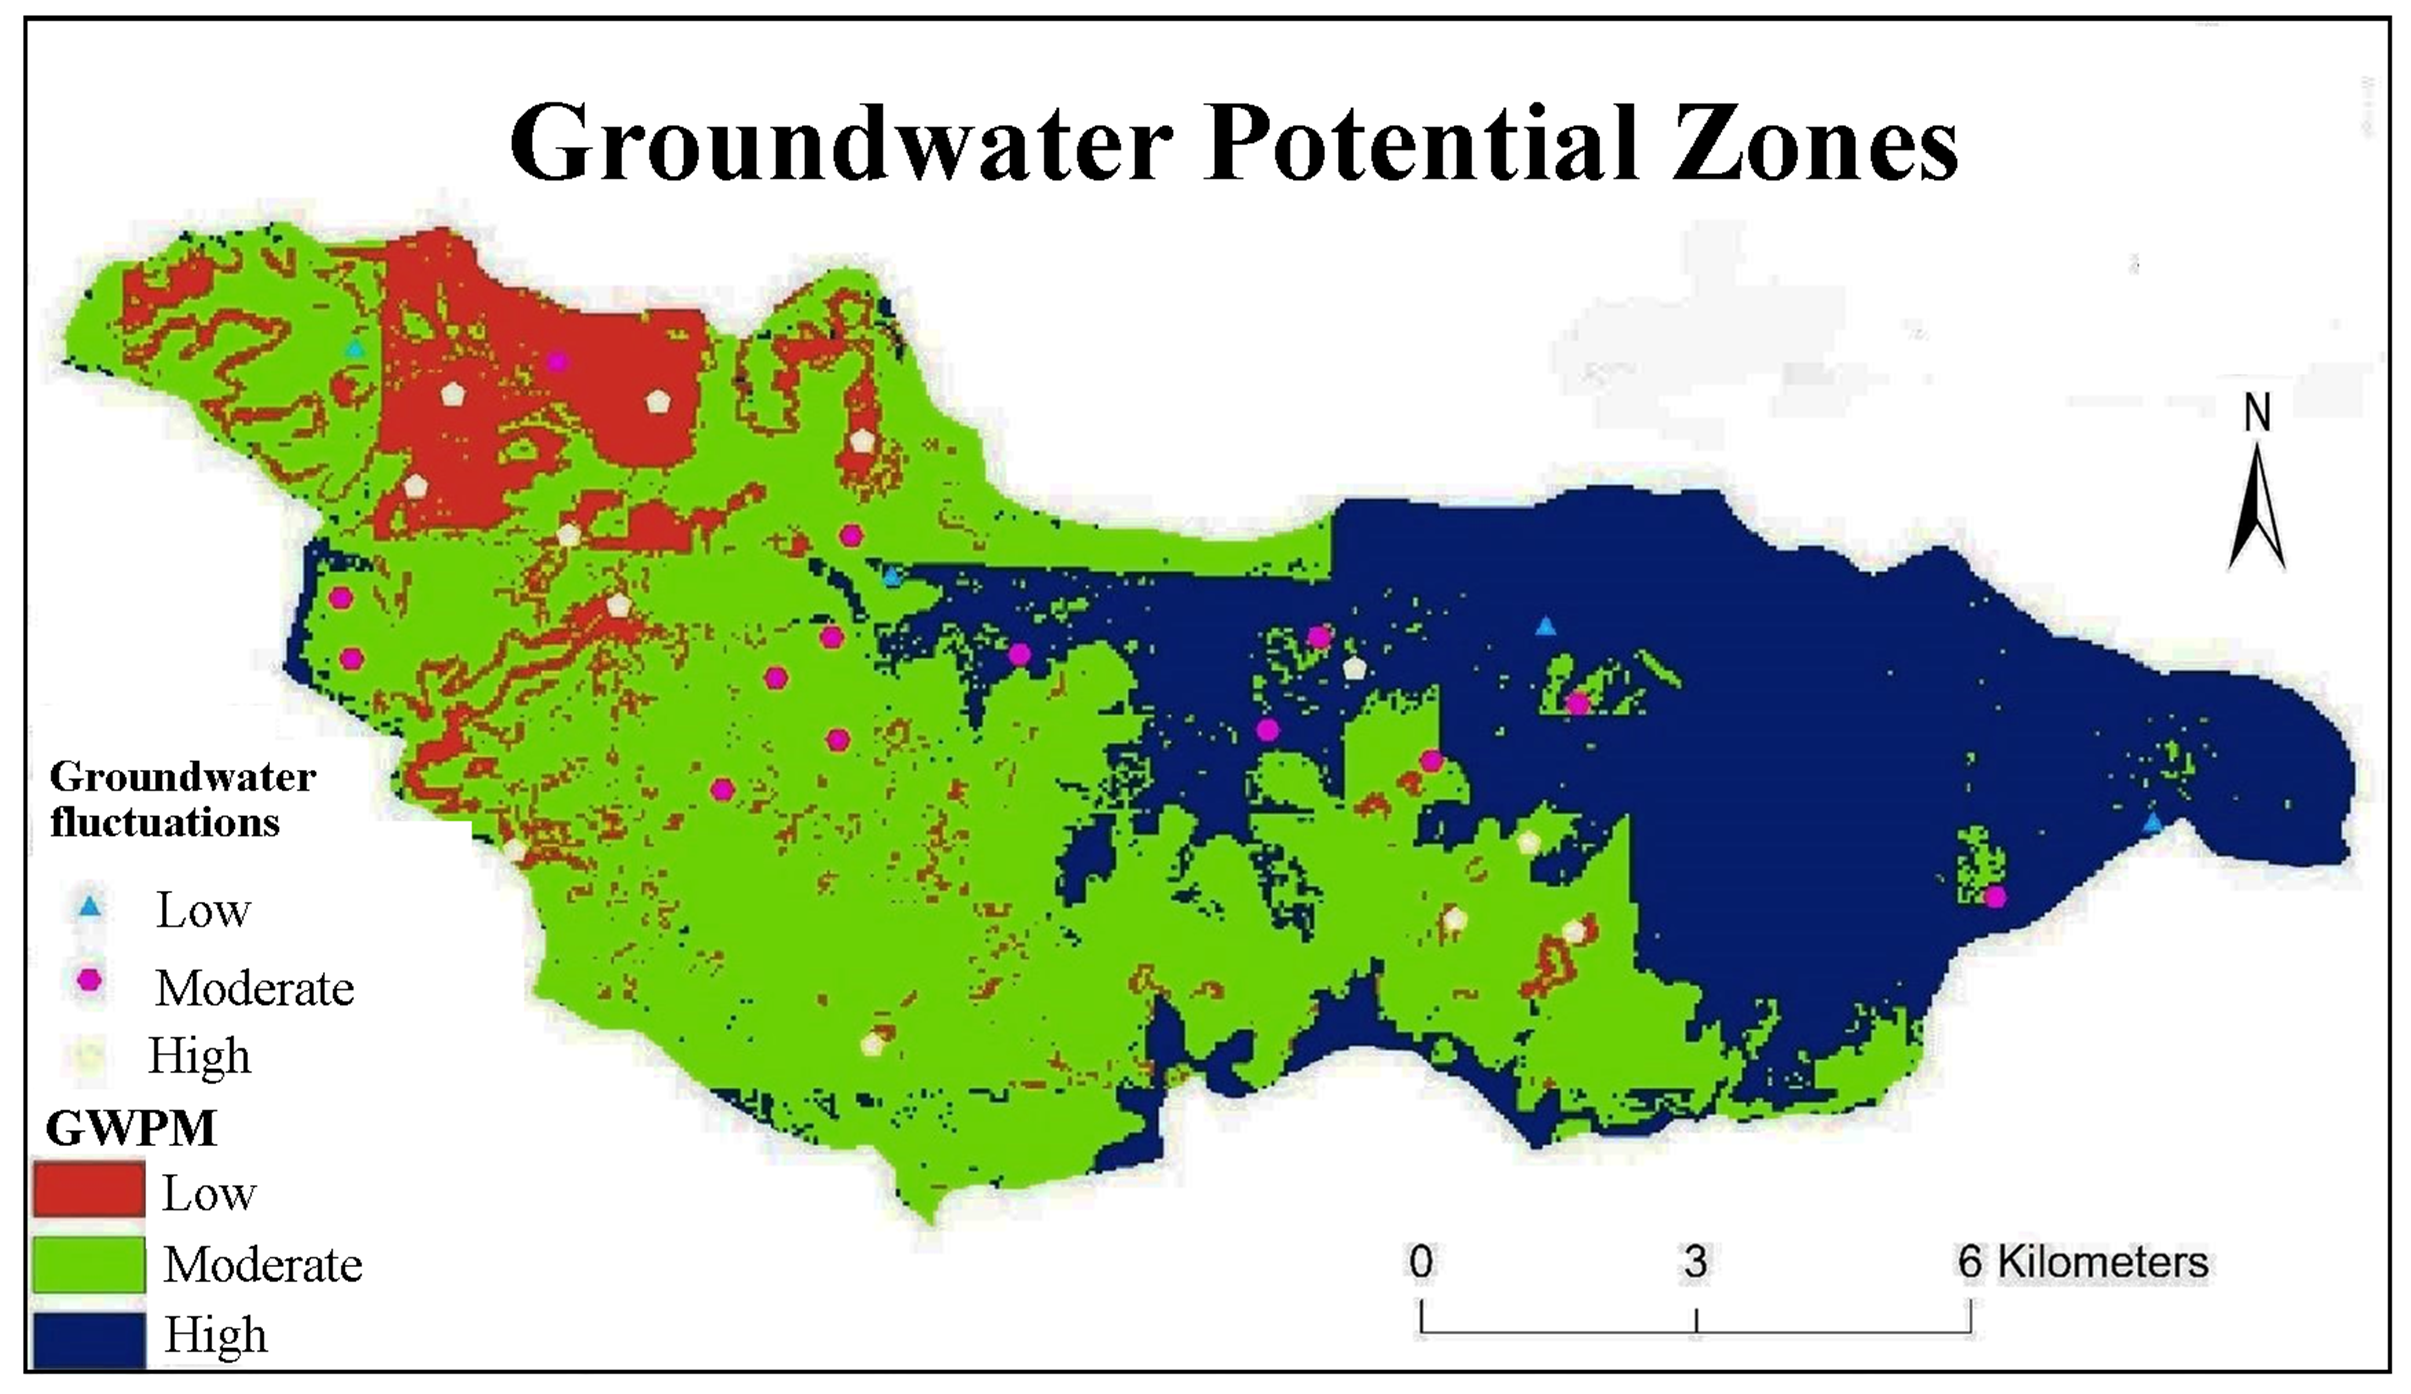
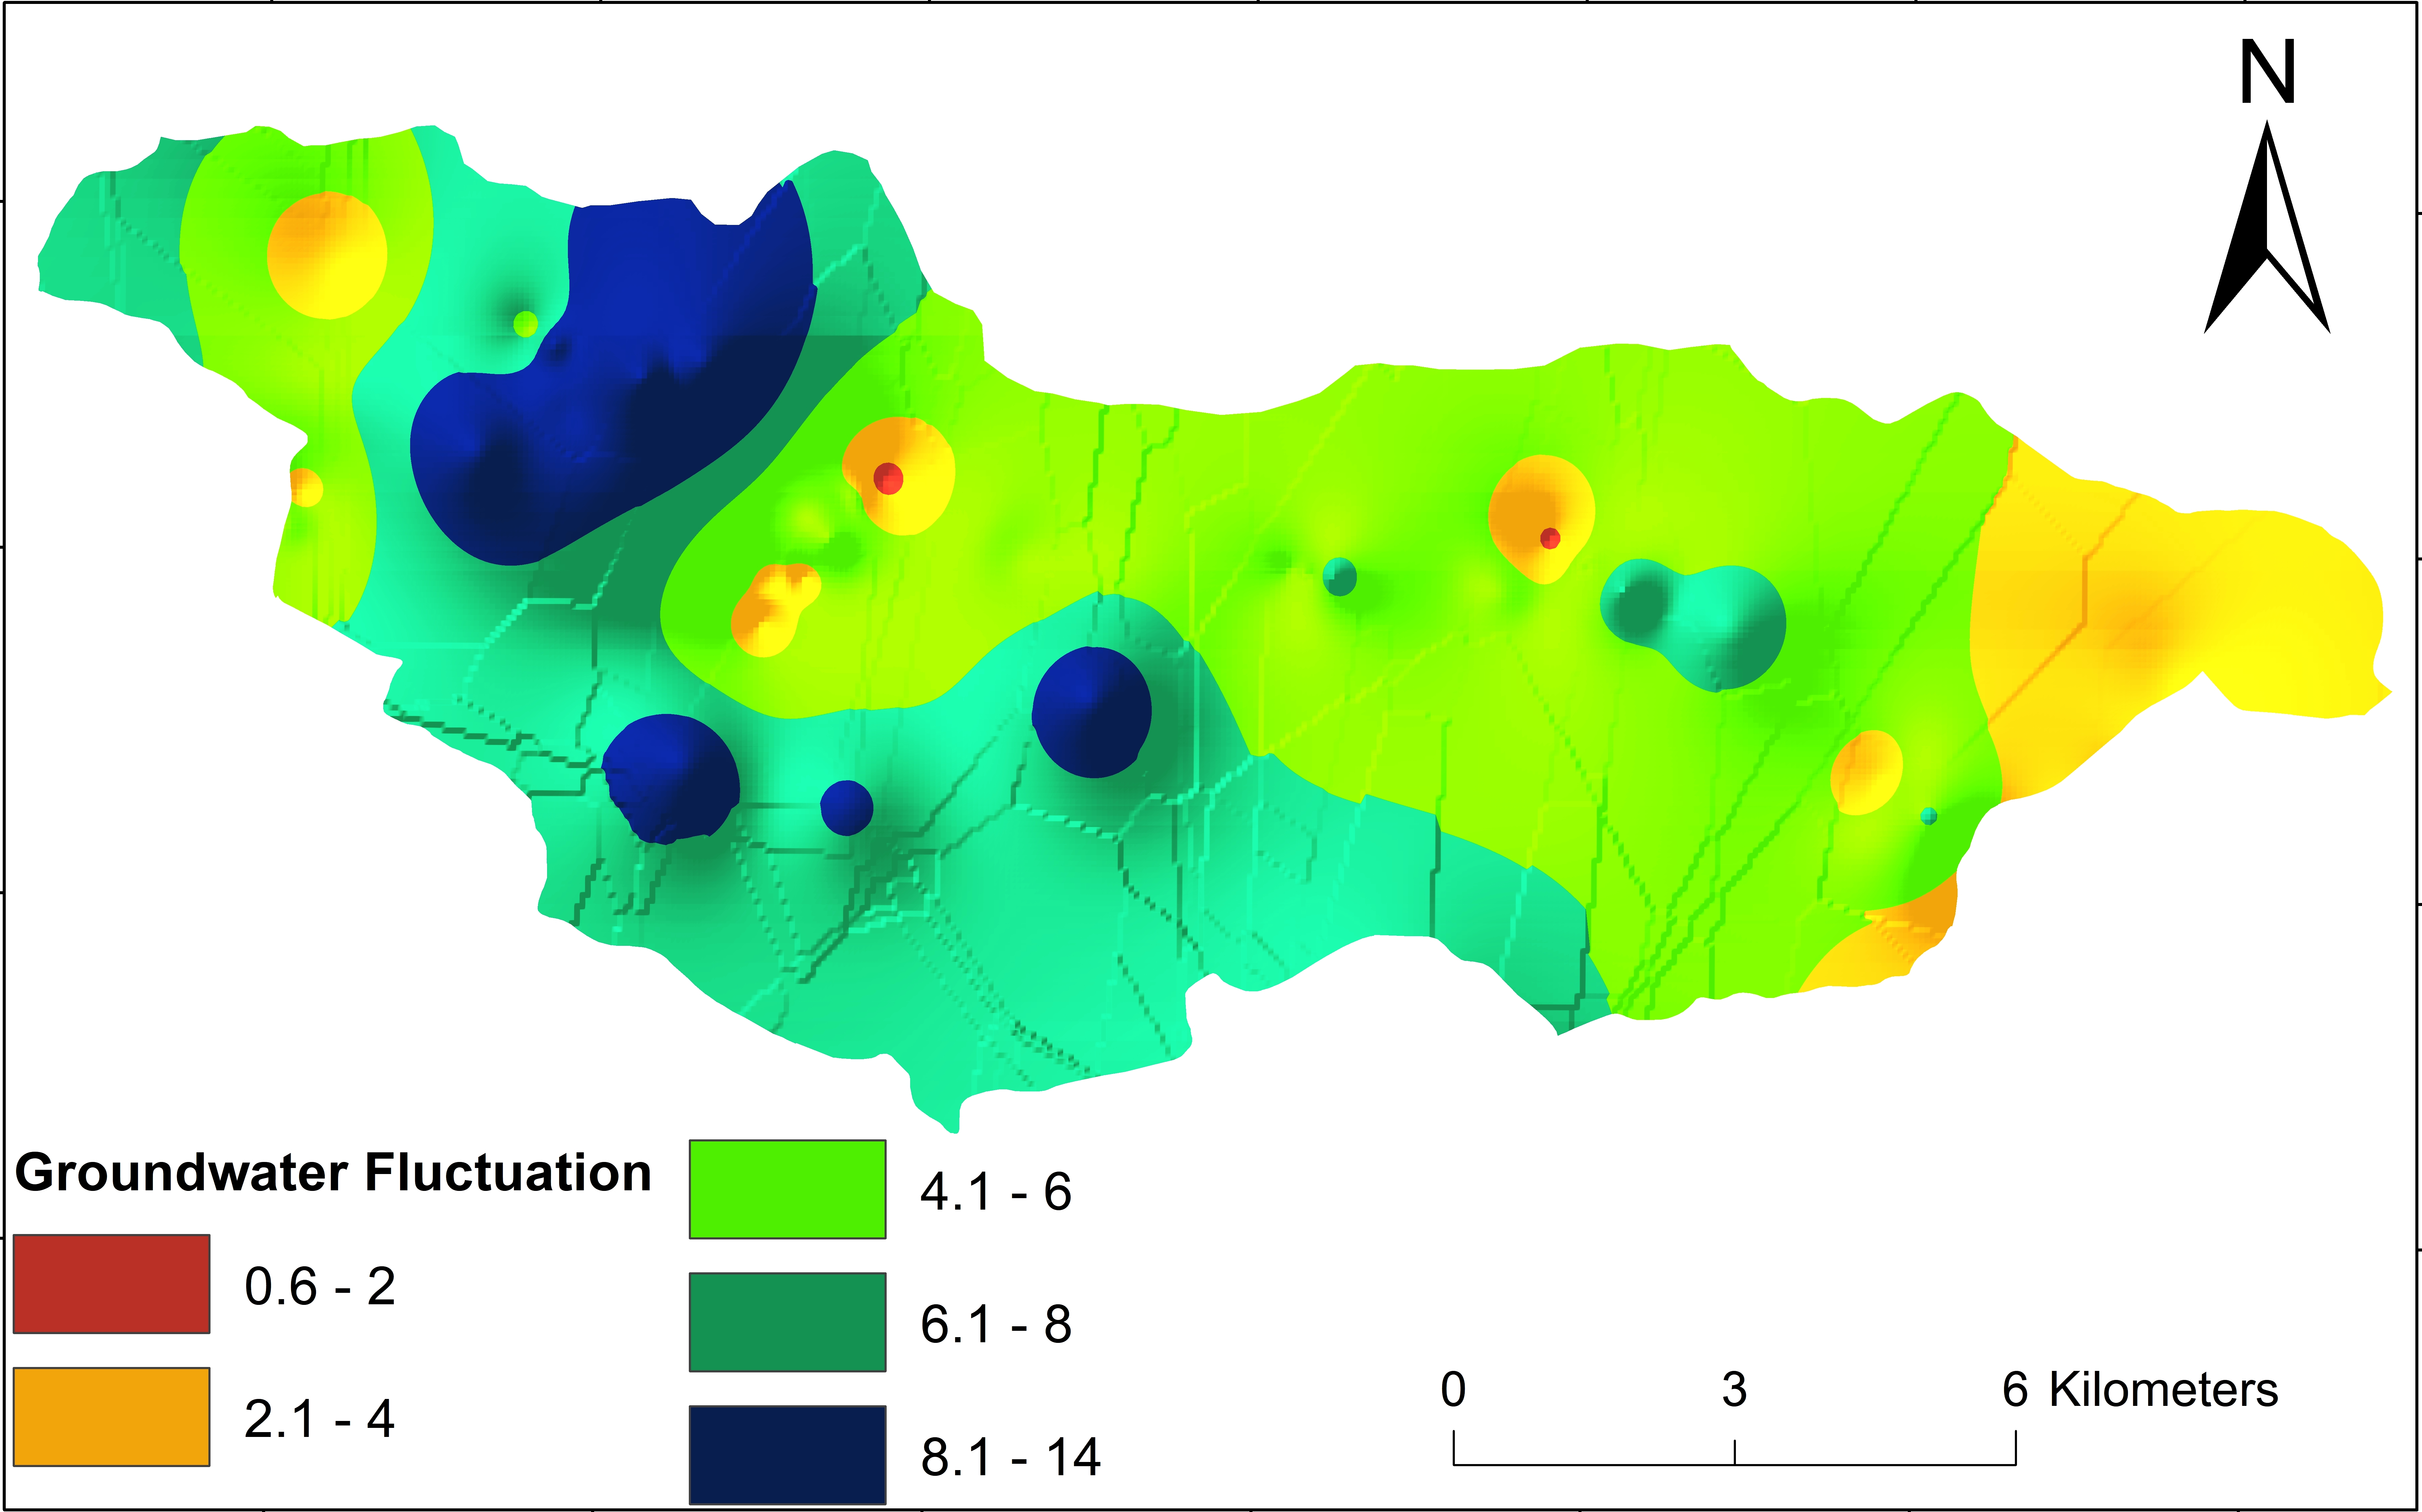
The groundwater flictuation data of 30 wells were used for the validation of study (Figure 9). Low groundwater fluctuation (GWF) depicts high groundwater potential, similarly, high GWF shows low groundwater prospect. The accuracy was assessed by using the following formula:
Accuracy of High GWP (%) = (Wells with low GWF in High GWP zone) / (Total number of wells with low GWF) (5)
Table 2. Random index values
|
N
|
1
|
2
|
3
|
4
|
5
|
6
|
7
|
8
|
9
|
10
|
|
RI
|
0
|
0
|
0.58
|
0.9
|
1.12
|
1.24
|
1.32
|
1.41
|
1.46
|
1.49
|
4 . RESULT AND DISCUSSION
4.1 Spatial analysis
The groundwater prospects map is the base of the development, planning and management of the watershed (Deepika et al. 2013; Abuzied and Alrefaee 2017; Singh et al. 2017b). The groundwater prospects map of the study was derived by performing a weighted overlay analysis of the hydrogeological and geospatial layers such as geomorphology, soil, drainage density, rainfall, geology and slope. The geomorphology of the area has a direct relation to the subsurface movement of water (Avinash et al. 2011). The geomorphology is the aspect which defines the GWP by its characteristic shape (Chowdary et al. 2009). The geomorphology of the study area depicts a weathered plateau which accounts for 15.61% of the area and contributes towards high groundwater prospect. A shallow weathered plateau, that spans across the Northwest to the Southwest region and accounts for 13.12% of the area, denotes a moderately high groundwater prospect. This was followed by an undissected plateau which traces an area of 6.6%, having moderate GWP. The major part of the study was a dissected (56.6%) plateau and was assigned low ranking in the GWP. Buttes and Escarpments were present on the periphery of the study area and cover 8.01% of the study area, holding the lowest GWP.
The study area falls in a basaltic hard-rock terrain and comprises mainly of three litho units. Of these units, the vesicular basalt has the highest GWP (Limaye, 2010) and covers 27.34% of the study area. It is followed by amygdaloidal basalt, which covers 48.14% of the area and is seen in the central portion and the western boundary of the study area. The compact basalt is the third as last lithounit which holds the lowest GWP and covers 24.52% of the total area.
The runoff of the area is a direct product of the slope (Kadam et al. 2012; Singh et al., 2017). The higher the slope more the runoff and hence poor percolation of water. A steep slope will contribute to maximum runoff and hence lowest GWP.51.43% of the area is moderately steep and spans across the northwestern, southwestern and parts of the southeastern quadrant. The result shows that GWP is low this area. A gentle gradient is seen only across 11.01% of the area, which spans across the north-eastern quadrant. Areas with slopes Moderately Strong, Strong and Steep populate 18.43%, 16.07% and 3.06% of the area respectively.
Rainfall is the primary source for recharge of groundwater (Huang et al. 2013; Oikonomidis et al. 2015; Senanayake et al. 2015), it holds prime importance in the delineation of the GWP. A lack of rain directly implies that there exists no water to percolate below, irrespective of the other factors considered. The area has a variation in rainfall and hence it is classified into five classes namely: Very High (711-843 mm), High (682-711 mm), Moderate (640-682 mm), Low (583-640 mm), Very Low (<583 mm). 52.23 % of the area receives high rainfall and is dominated in the central region. The Eastern quadrant receives the heaviest rainfall, which spans across an area of 17.87%. 15.12% of the area has moderate rainfall while 7.48 % has low and 7.29% has very low rainfall. All these three classes correspond the regions with moderately strong, strong and steep slopes in the area; and it shows low GWP
4.2 Groundwater Prospects Mapping
Multi-criteria decision-making (MCDM) based AHP method, which concerns about multiple conflicting criteria can be formally incorporated into the management and planning processes (Agarwal and Garg 2015; Mogaji 2016). A groundwater potential map is prepared by creating a weighed overlay of the thematic layers of geomorphology, geology, drainage density, soil, slope and rainfall (Table 3, 4 and 5).
Table 3. Pairwise comparison matrix
|
|
Geomorphology
|
Geology
|
DD
|
Soil
|
Slope
|
Rainfall
|
|
Geomorphology
|
1.00
|
2.00
|
3.00
|
3.00
|
3.00
|
0.14
|
|
Geology
|
0.50
|
1.00
|
0.33
|
0.33
|
0.20
|
0.20
|
|
Drainage density
|
0.33
|
3.00
|
1.00
|
0.25
|
0.20
|
0.33
|
|
Soil
|
0.33
|
3.00
|
4.00
|
1.00
|
3.00
|
0.20
|
|
Slope
|
0.33
|
5.00
|
5.00
|
0.33
|
1.00
|
0.20
|
|
Rainfall
|
7.00
|
5.00
|
3.00
|
5.00
|
5.00
|
1.00
|
Table 4. Normalization of weights
|
|
Geomorphology
|
Geology
|
DD
|
Soil
|
Slope
|
Rainfall
|
Weightage
|
Avg. Weight
|
|
Geomorphology
|
0.105
|
0.105
|
0.184
|
0.303
|
0.242
|
0.069
|
1.01
|
0.126
|
|
Geology
|
0.053
|
0.053
|
0.020
|
0.034
|
0.016
|
0.096
|
0.27
|
0.034
|
|
Drainage density
|
0.035
|
0.158
|
0.061
|
0.025
|
0.016
|
0.160
|
0.46
|
0.057
|
|
Soil
|
0.035
|
0.158
|
0.245
|
0.101
|
0.242
|
0.096
|
0.88
|
0.110
|
|
Slope
|
0.035
|
0.263
|
0.306
|
0.034
|
0.081
|
0.096
|
0.81
|
0.102
|
|
Rainfall
|
0.737
|
0.263
|
0.184
|
0.504
|
0.403
|
0.482
|
2.57
|
0.322
|
Table 5. Weights and ranks assigned as per the influence of parameters and their categories derived using AHP
|
Sr. No
|
Criterion
|
Sub-criterion
|
Rank
|
Weight
|
|
1)
|
Geomorphology
|
Plateau Undissected(PLU)
Plateau shallow-weathered(PLSW)
Plateau weathered(PLW)
Plateau highly+ moderate+ shallow dissected (PLH+PLM+PLS)
Butte+Escarpment(B+Es)
|
5
4
3
2
1
|
0.126
|
|
2)
|
Geology
|
Vesicular Basalt
Amygdaloidal Basalt
Compact Basalt
Intrusion(Dyke)
|
5
3
2
1
|
0.034
|
|
3)
|
Drainage Density
|
Low (0.0 -0.97 km/km2)
Moderate (0.98 -2.21 km/km2)
Moderately high (2.22 - 3.28 km/km2)
High (3.29 – 4.25 km/km2)
Very high (4.26 – 5.74 km/km2)
|
5
4
3
2
1
|
0.057
|
|
4)
|
Soil
|
loamy (HSG –B)
Clay loam (HSG – C)
Clay (HSG – D)
|
5
3
1
|
0.11
|
|
5)
|
Slope %
|
Gentle (0-3%)
Moderate (3-10%)
Moderate strong (10-15$)
Strong (15-35%)
Steep (>35%)
|
5
4
3
2
1
|
0.102
|
|
6)
|
Rainfall
|
Very high (711-843 mm)
High (682-711 mm)
Moderate (640-682 mm)
Low (583-640 mm)
Very Low (<583 mm)
|
5
4
3
2
1
|
0.322
|
4.3 Validation of groundwater potential maps
The resultant groundwater potential map was validated by superimposing the groundwater fluctuation data. The high groundwater level fluctuation is observed in areas of low potential and the vice versa for the areas of high potential. The accuracy percentage of the resultant map is given in the following table (Table 6). The accuracy of the high potential zone delineated is 75% as 3 out of the 4 wells lying in the high potential zone have low fluctuation. Similarly, 10 of the 12 wells in low groundwater potential zone have high groundwater fluctuation hence the accuracy of the zone is 83.33%. (Figure 10).
This resultant map will be useful for identification of favourable zones for groundwater exploration, which is further used for watershed development purpose.
Table 6. Accuracy assessment of GWPM
|
|
Total Wells
|
% Accuracy
|
|
GWPM class
|
Low GWF
|
Moderate GWF
|
High GWF
|
|
|
High
|
3
|
1
|
0
|
75.00 %
|
|
Moderate
|
2
|
11
|
1
|
78.57 %
|
|
Low
|
1
|
1
|
10
|
83.33 %
|
GWF: Groundwater Fluctuations
 ,
Clinton Fernandes 1
 ,
Ajaykumar Kadam 2
 ,
BHAVANA Umrikar 3


