

Article Title :
Spatiotemporal Assessment of Meteorological Drought of Paschim Medinipur District, West Bengal, India 

6 (2022)
54-72
trend , Standardized Precipitation , Meteorological Drought , Evapotranspiration Index , duration


The drought phenomenon is linked to the water scarcity and these are the pressing issues that require careful and thoughtful consideration. Drought in India mostly affects regions that are part of numerous plateaus, including the Chottanagpur plateau and the Deccan plateau. The Paschim Medinipur District of West Bengal, which is located in the southern portion of the Chottanagpur plateau, has recently experienced extreme and severe drought on multiple occasions. The assessment of the drought scenario in this region is, nevertheless, still very far from being finalized. Using the Standardized Precipitation Evapotranspiration Index (SPEI) at various time intervals (e.g., 3 months, 6 months, 12 months and 48 months) between 1979 and 2014, we have evaluated drought both geographically and temporally in this study. Here, the drought evaluation metrics include peak intensity, average intensity, magnitude, occurrence rate (%) and trend. Peak intensity, magnitude, average drought intensity, and the frequency of Extreme to Severe (ES) droughts are all seen to decline noticeably as time steps move forward. The frequency of moderate droughts starts to rise as time moves forward. Peak intensity, magnitude, average drought intensity, drought duration, ES and moderate drought occurrence rate is high in southern and southwestern portions of Paschim Medinipur. Additionally, the Principal Component Analysis (PCA) composite scores used to identify the drought-prone zones are estimated using the aforementioned parameters at various time steps. As the time step increases the area under the high and high moderate drought prone zone decreases, but very low and low drought prone area increases. Overall 16% area is found under high to high moderate drought prone category, whereas, approximately, 65% area is found under the low to low moderate drought category. The outcome of this research may be helpful to combat with drought and to make a fruitful move to manage water resources in the Paschim Medinipur region, West Bengal. Additionally, the study makes use of a superb methodology to comprehend the spatiotemporal variation of meteorological drought, which is applicable to all parts of the globe.
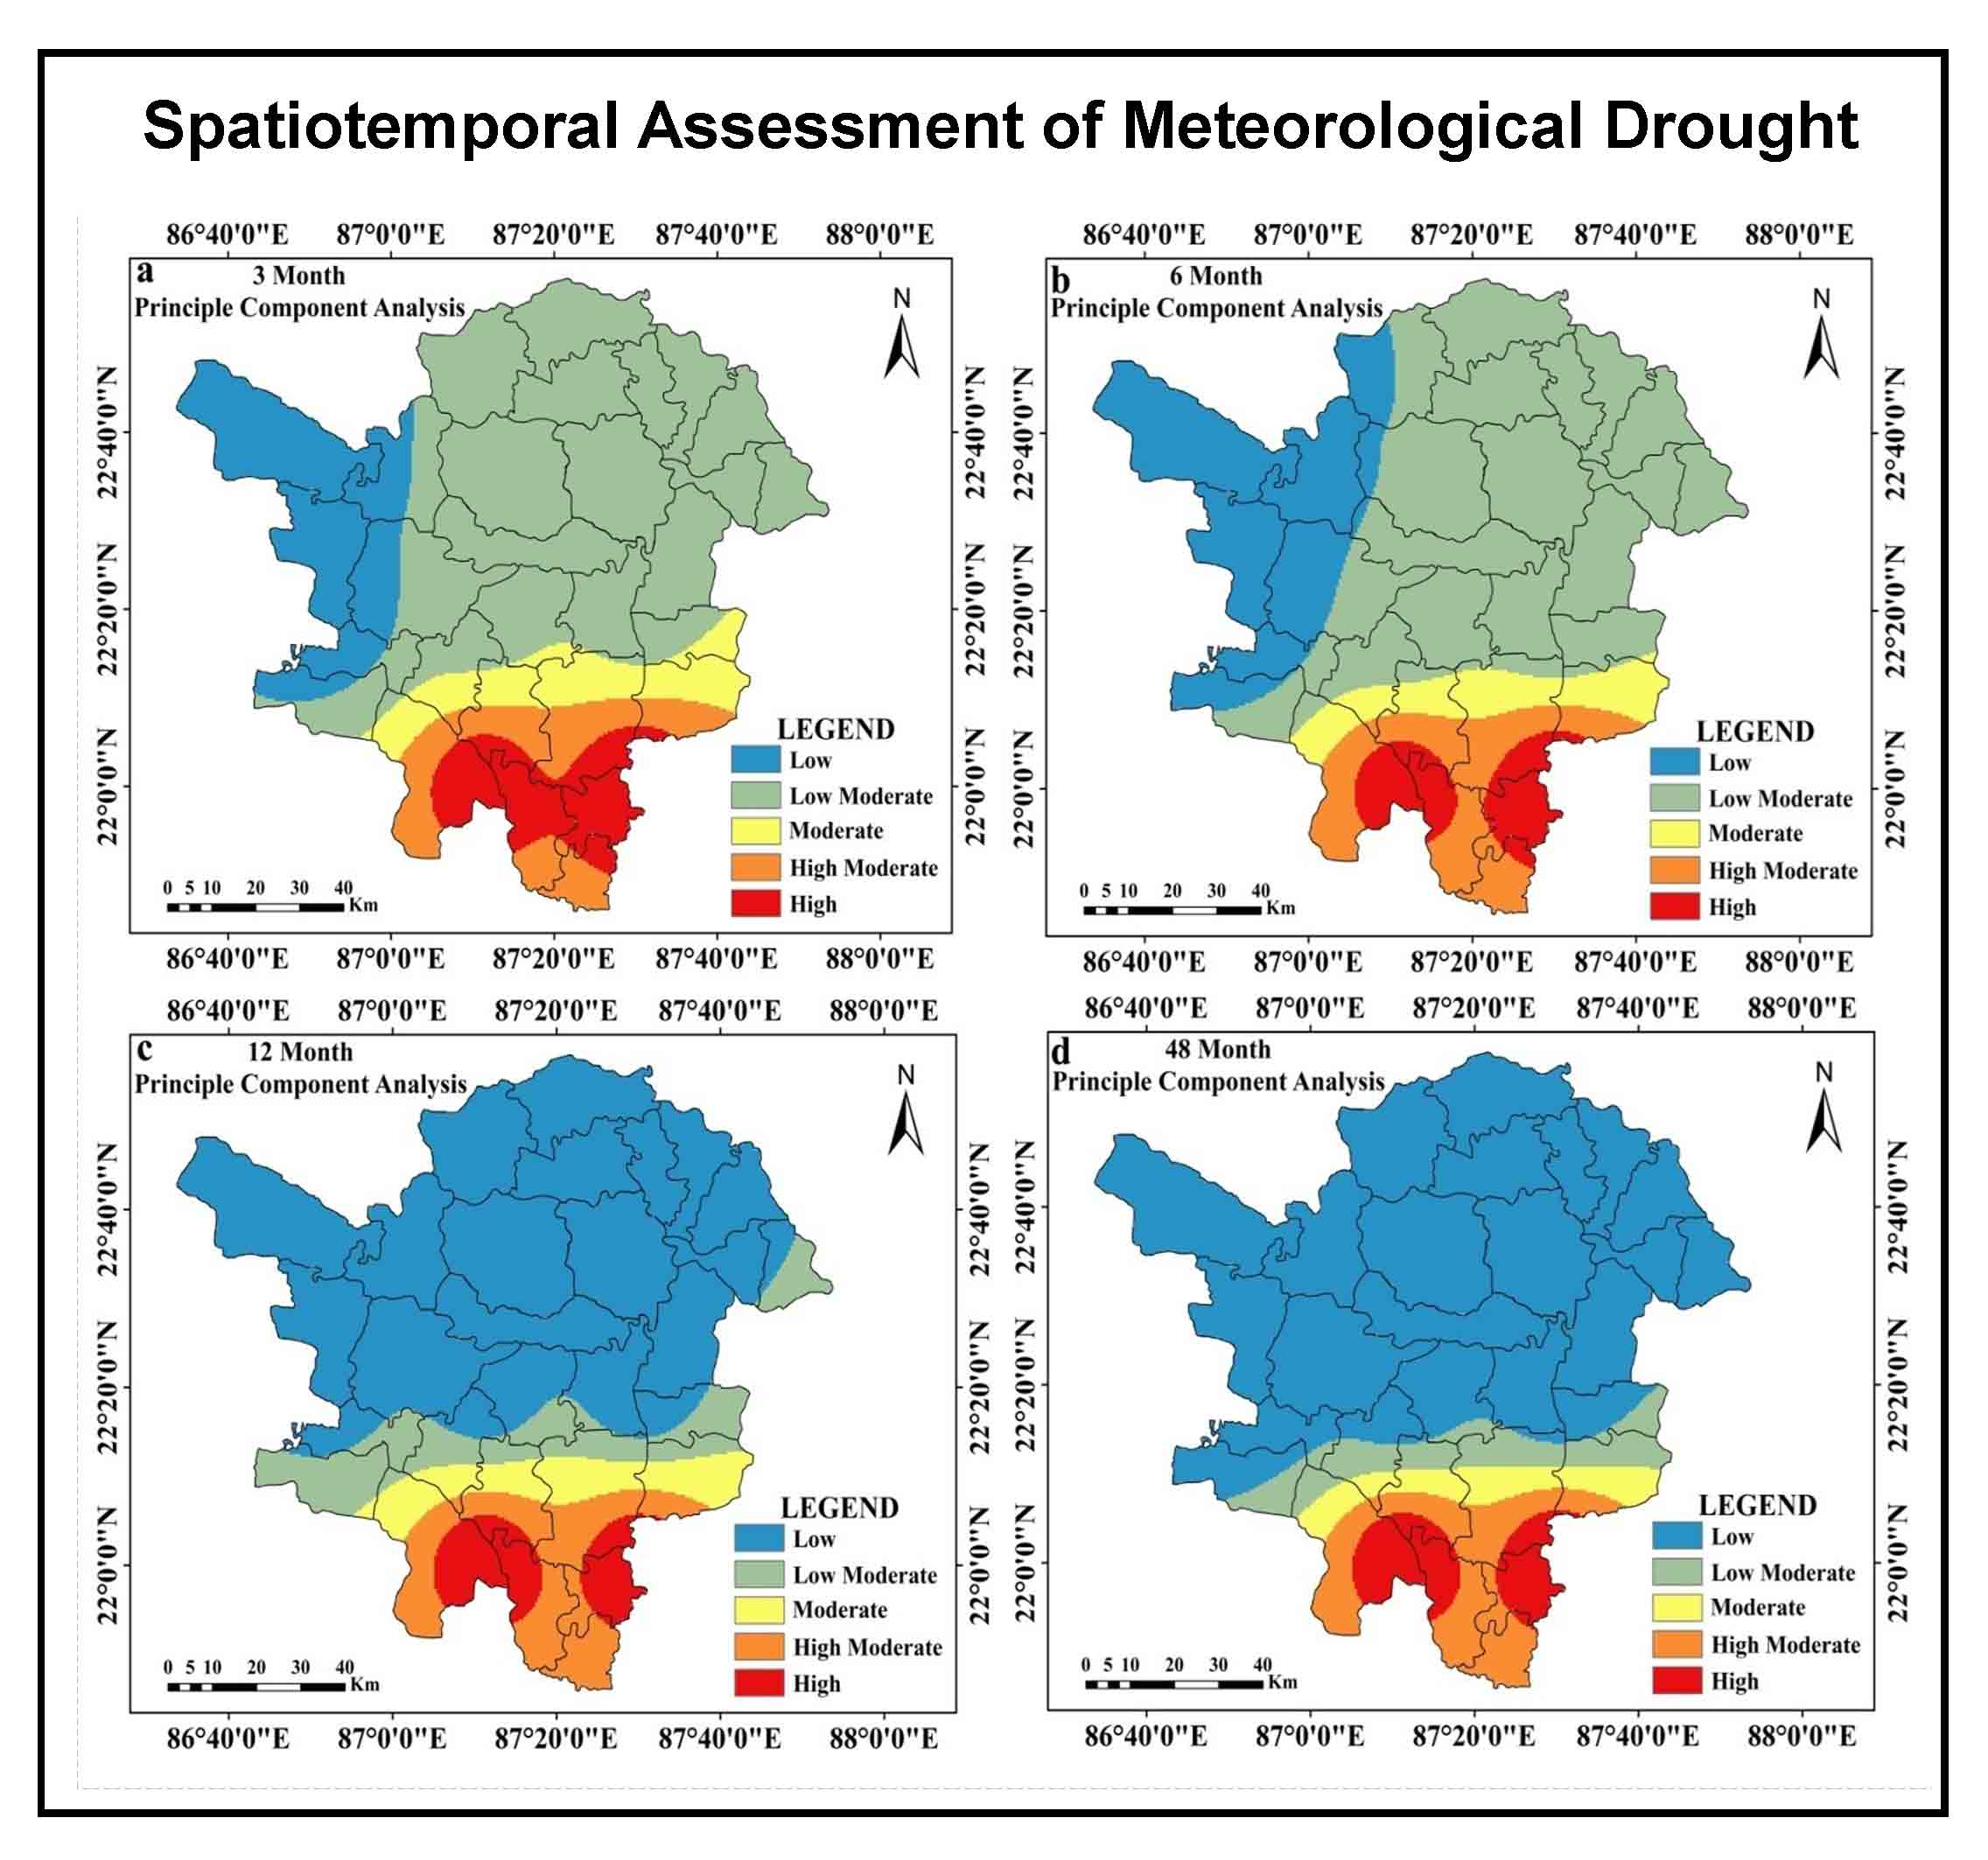
Drought has been assessed spatio-temporally at 3 months, 6 Months, 12 Months and 48 Months.
Peak intensity, average drought intensity, magnitude, occurrence rate (%) and trend, are considered here as the drought evaluation parameters.
As the time step advances, peak intensity, magnitude, average drought intensity, Extreme to Severe drought occurrence rate starts to decrease in significant proportion.
Drought prone zones are demarcated using composite scores of PCA and those composite scores are estimated using the above-mentioned parameters at several time steps.
Overall 16% area is found under high to high moderate drought prone category, whereas, approximately, 65% area is found under the low to low moderate drought category.
Abramowitz, M. and Stegun, I. A. (Eds.), 1964. Handbook of mathematical functions with formulas, graphs, and mathematical tables, 55. US Government printing office.
Gupta, A. K., Tyagi, P., and Sehgal, V. K., 2011. Drought disaster challenges and mitigation in India: Strategic appraisal. Current Science. 100(12), 1795-1806.
IPCC [Intergovernmental Panel on Climate Change], 2007. Climate change 2007: The physical science basis. In Contribution of working group I to the fourth assessment report of the intergovernmental panel on climate change, ed. S. Solomon, D. Quin, M. Manning, X. Chen, M. Marquis, K.B. Averyt, H.L. Tignor, and M. Miller, 1-996. Cambridge: Cambridge University Press.
Jolliffe, I. T., 2002. Principal component analysis for special types of data, 338-372. Springer, New York.
Kar, B., and Saha, J., 2012. Analysis of meteorological drought: The scenario of West Bengal. Indian J. Spatial Sci., 3(2), 1-11.
Kendall, M. G., 1975. Rank Correlation Methods, Griffin, London.
Khan J. H., Hassan T. and Shamsad, 2011. Socio economic causes of rural urban migration in India. Asia-Pacific Journal of Social Sciences. 138-158.
NRC [National Research Council] 2010. Adapting to the impacts of climate change: America’s climate choices. Washington, DC: National Academies Press.
Sommerlot, A. R., 2017. Coupling Physical and Machine Learning Models with High Resolution Information Transfer and Rapid Update Frameworks for Environmental Applications (Doctoral dissertation, Virginia Tech). Accessed 15 April 2020.
Svoboda, M. and Fuchs, B., 2016. Handbook of drought indicators and indices. National Drought Mitigation Center, Lincoln, NE. Accessed: 23rd April 2020.
Theil, H., 1950. A rank invariant method of linear and polynomial regression analysis, part 3. Netherlands Akademie van Wettenschappen. Proceedings, 53, 1397-1412.
Thompson, S., 1999. Hydrology for water management, 476. Rotterdam, The Netherlands: AA Balkema Publ.
Upadhayay, U., Kumar, N., Kumar, R. and Kumari, P., 2019. Hydro-geological status of the core and buffer zone of Beekay Steel Industries Limited, Adityapur Industrial Area, Saraikela, Kharsawan, Jharkhand. In Wastewater Reuse and Watershed Management, 219-246, Apple Academic Press.
Zou, H., Hastie, T. and Tibshirani, R., 2006. Sparse Principal Component Analysis. J. Comput. Graph. Stat., 15(2), 265-286.

