Abstract
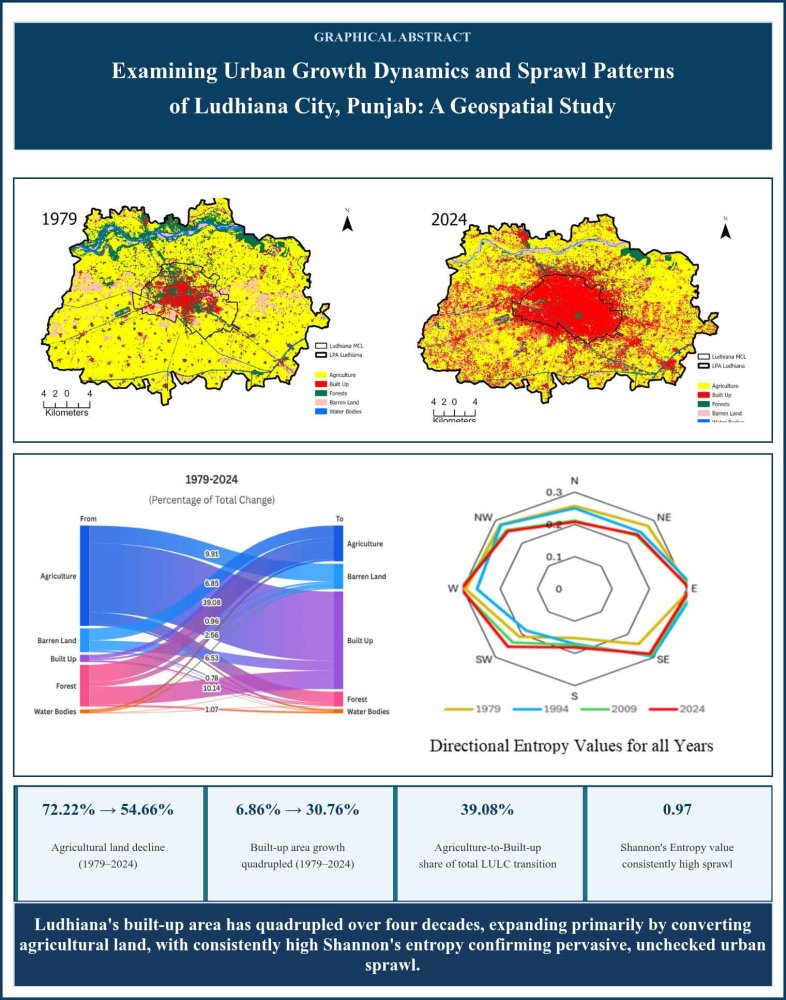
Accelerated urbanization has led to an increasing demand for land to build new areas of settlement and related infrastructure. This growing demand for land shows an encroachment onto related land uses and other natural areas. Therefore, it is important to critically examine the changing land-use/land-cover (LULC) patterns, particularly in highly urbanizing areas. This study is based on the Local Planning Area of Ludhiana, one of the most urbanized and industrialized cities in the state of Punjab, India. This study is aimed at evaluating changes in LULC over a period of forty-five years using remote sensing and GIS tools. A total of five LULC classes were used for the study: agriculture, built-up areas, forests, barren land and water bodies; and changes in area have been calculated for the years 1979, 1994, 2009 and 2024. The study utilizes the Landsat images, and classification was performed using the maximum likelihood technique with supervised classification using ArcGIS Pro. The study reveals that the area under agriculture was 72.22% in 1979, which dropped to 54.66% in 2024, whereas the area under built-up was 6.86%, which drastically increased to 30.76% by 2024. The other land use classes also witnessed a significant change, but the major transition was from agriculture to built-up, which is 39.08% of the total transition. To assess the urban sprawl, Shannon's entropy has been used. The results of Shannon's entropy revealed that the study area has a high level of urban sprawl, having relative entropy of 0.9773, 0.9729, 0.9691 and 0.9732 for years 1979, 1994, 2009 and 2024, respectively. The study offers insights into the nature of urban growth and sprawl in the Local planning Area of Ludhiana.
1 . INTRODUCTION
Urbanization is inherently a spatio-temporal process that transforms both human lives and land use patterns. According to the United Nations (2016), 55.3% of the world’s population lived in urban settlements, projected to reach 60% by 2030. With rapid urbanization, India’s urban population increased to 377 million (31.1% of the total population) by 2011 (Census of India, 2011) and is projected to reach 600 million by 2036 (Kouamé, 2024). This urban expansion necessitates the transition of agricultural, forest and other non-urban lands into built-up areas. In India’s top 100 cities alone, built-up area increased 2.5-fold (over 5,000 km²) in just 20 years (Nagendra et al., 2013), highlighting the intensity of land transformation. Land Use and Land Cover (LULC) refer to the physical characteristics of Earth’s surface and the functional utilization of land by humans (Rawat and Kumar, 2015; Dhiman et al., 2022). LULC change analysis has emerged as a critical tool for understanding urban dynamics and their environmental, biodiversity and socio-economic implications (Li et al., 2024; Cabernard et al., 2024; Barati et al., 2023; Kebebe et al., 2023; Eekhout and Vente, 2022; Borrelli et al., 2020; Dasalegn et al., 2014). Several anthropogenic factors, such as population growth, age-sex composition, increasing investment and industrialization, etc. have impacted the LULC changes and these changes also impact the living conditions of people and push them to destitute and absolute poverty (Kebebe et al. 2023; Bekere et al. 2023; Hasan et al. 2019; Toh et al. 2018; Dasalegn et al., 2014). Timely and accurate LULC detection is essential for sustainable development planning and land management at both macro and micro levels (Seyam et al., 2023; Kumar and Singh, 2021). Therefore, the study of LULC change has emerged as an essential tool for better understanding the changing dynamics of urban areas and their implications.
The Encyclopedia Britannica defines urban sprawl as “the rapid expansion of the geographic extent of cities and towns, often characterized by low-density residential housing, single-use zoning, and increased reliance on the private automobile for transportation”. Although this definition summarizes the basic understanding of the sprawl, there have been several attempts to define the urban sprawl, but scholars have not reached a consensus about the proper definition and explanation of sprawl (Banerjee and Dutta, 2024; Guan et al., 2022; Oueslati et al., 2015; Paulsen, 2014; Anas et al., 1998). Bhat et al. (2017) summaries the sprawl, “As population increases in an area or a city, the boundary of the city expands to accommodate the growth; this expansion is deemed as sprawl.” It could be concluded that the sprawl is a growth or extension of the city into surrounding non-urban or rural areas with the imprints of urban functions in these areas. Deo et al. (2024) note that although the sprawl was initially considered as a solution to urban congestion, at later stages, it emerged as a problem in itself. The rapid unplanned sprawl of the city not only puts pressure on the available resources but also impacts the quality of life of urban dwellers. Such haphazard expansion and infringement bring substantial changes in LULC. Therefore, studying urban sprawl is essential to understanding a city’s development holistically.
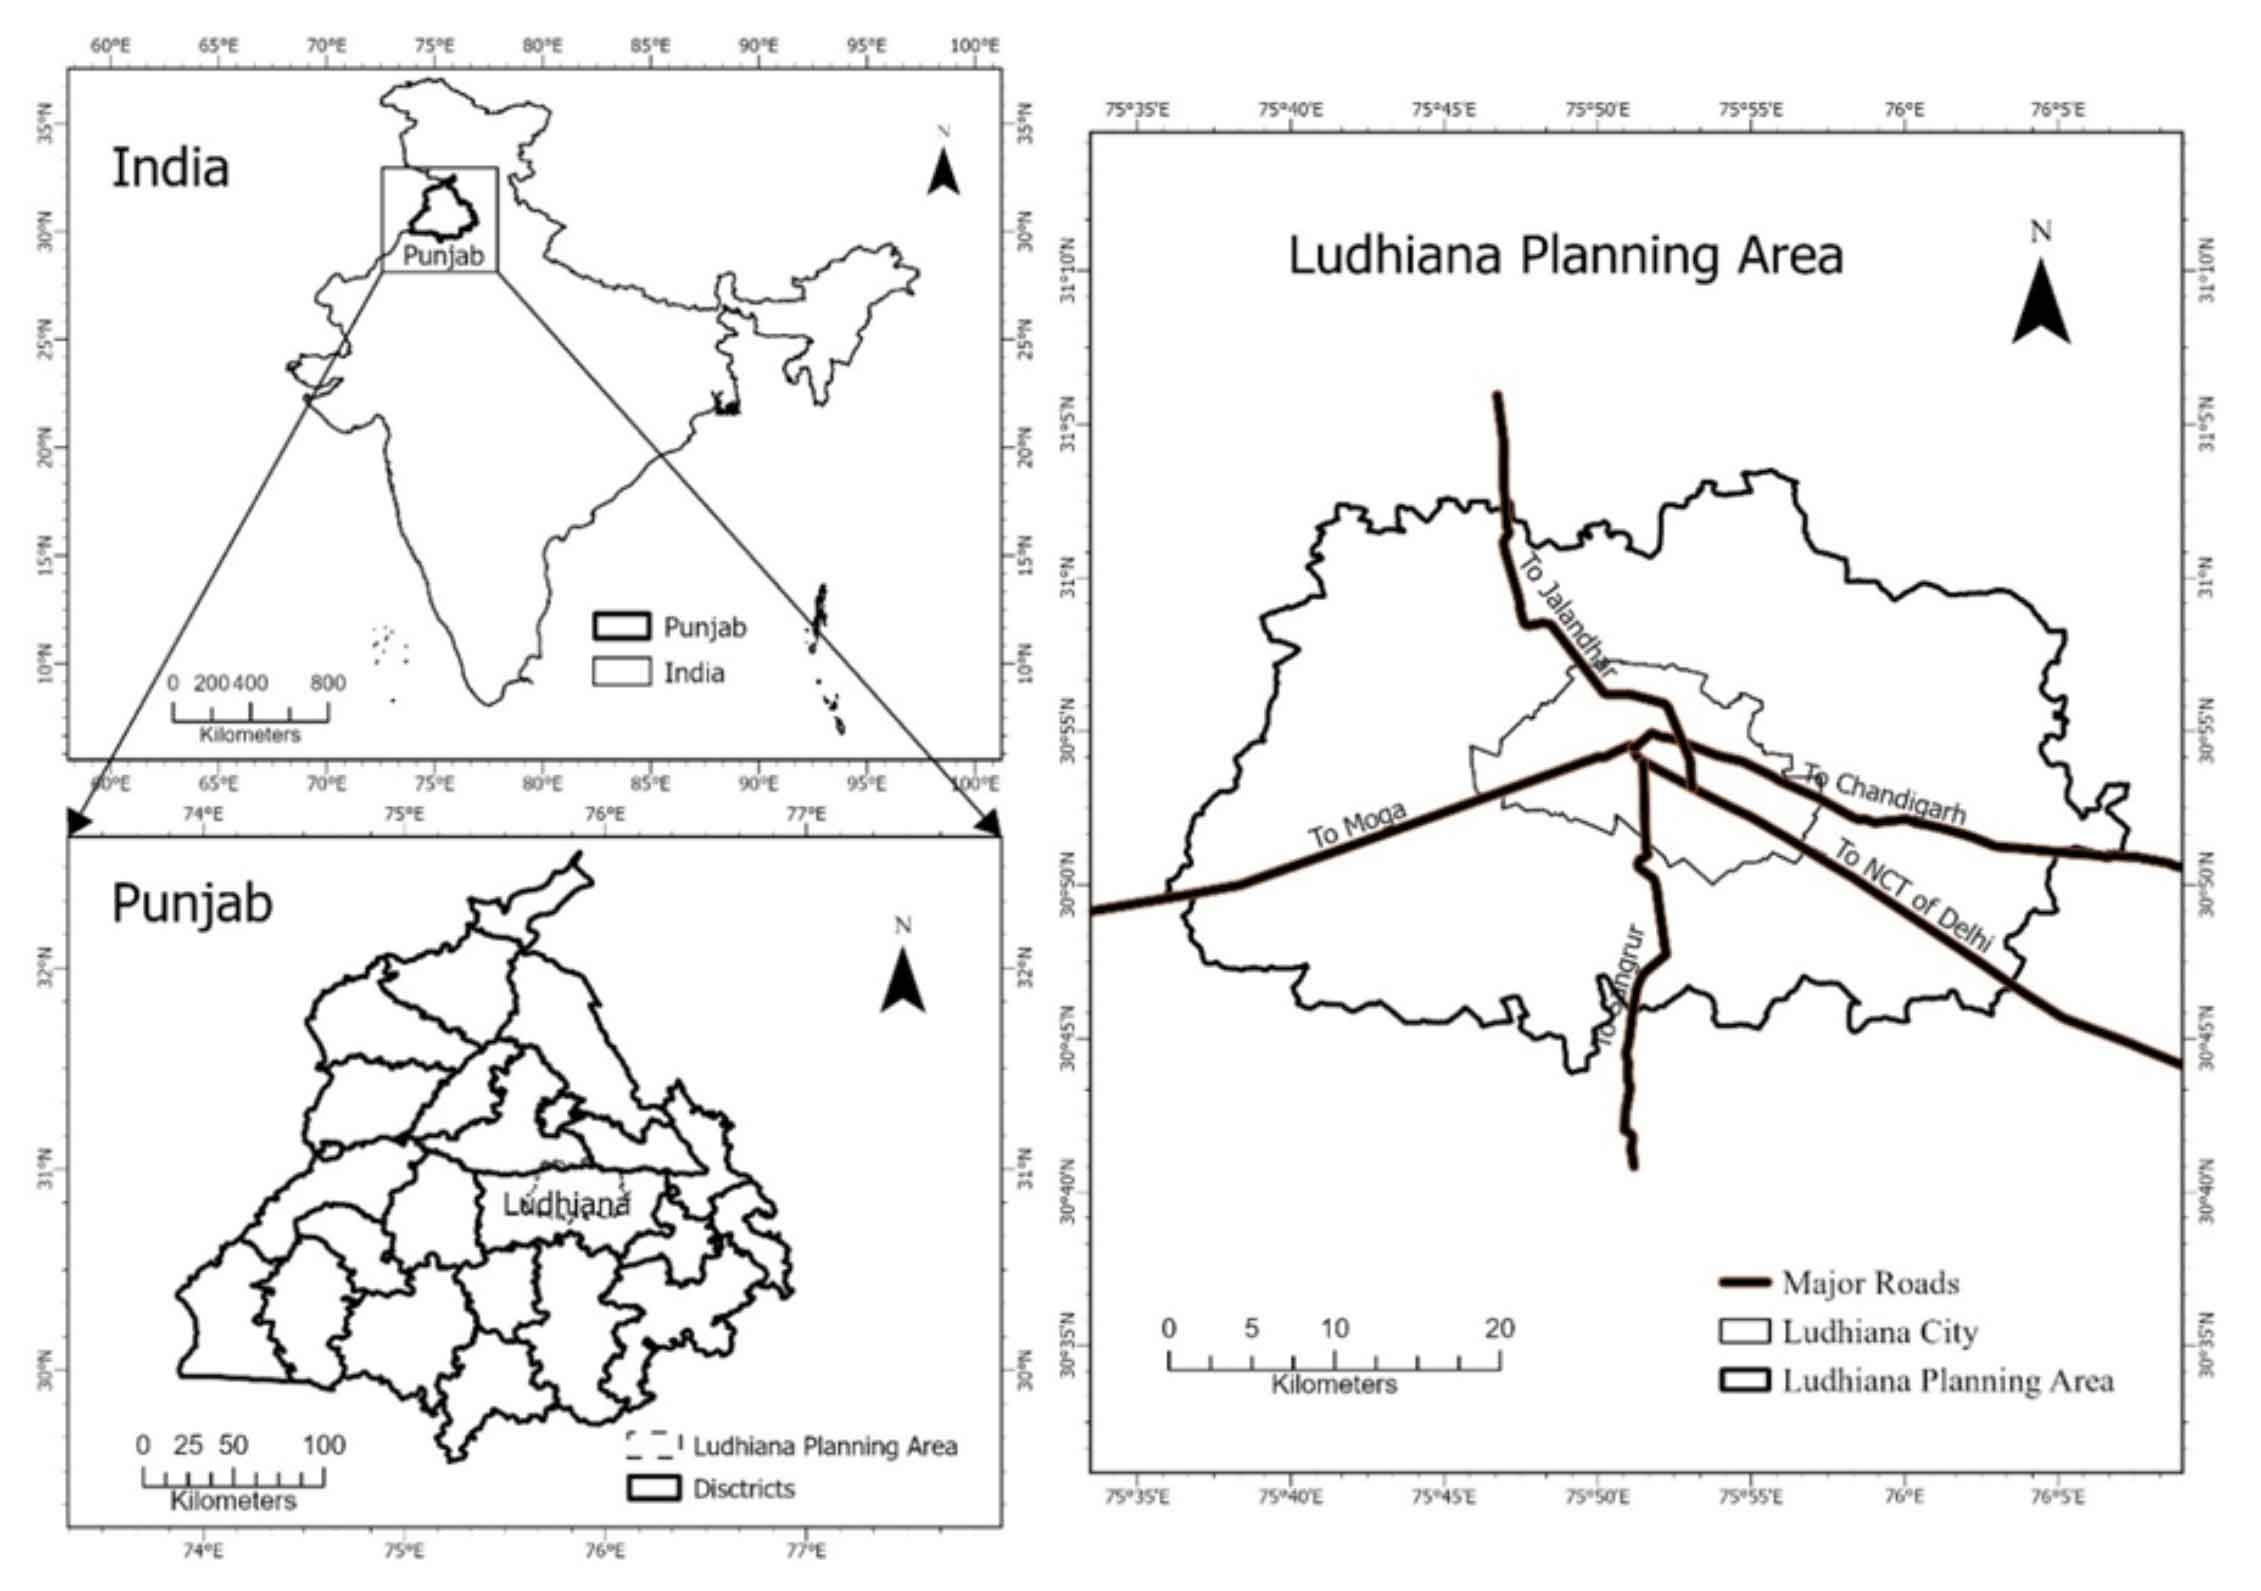
Punjab is located in northern India, which has been traditionally an agricultural based state. However, in past few decades, the state witnessed a rapid transformation resulting in high urbanization and industrialization. Ludhiana district is the most urbanized and industrialized district of the Punjab. Ludhiana city, being the district headquarters, has witnessed unprecedented development in terms of urbanization, industrialization and immigration. The population of Ludhiana city was 1,53,795 in 1951, which increased to 6,07,052 in 1981 and further to 16,13,837 in 2011. Several studies (Channi, 2025; Buttar and Sachan, 2024; Dhiman et al., 2022; Sharma et al., 2005) have been conducted assessing the LULC Change. However, the focus of these studies is either the agricultural development and related phenomenon or the studies focused on the entire state or the district. There is also a lack of long-term analysis of LULC change and the emerging urban sprawl. This study adopts a multidecadal study approach, considering the multidirectional urban sprawl, keeping the urban development in the Local Planning Area, Ludhiana, as the center of the study. This paper focuses on this area and aims to study the class-wise transition of Land Use/Land Cover (LULC) in the Local Planning Area, Ludhiana. It also analyses the urban sprawl in the area using Shannon’s Entropy and examines the causes and spatial planning implications of Land Use/Land Cover transformations. This paper focuses on this area and aims to study the class-wise transition of Land Use/Land Cover (LULC) in the Local Planning Area, Ludhiana. It also analyses the urban sprawl in the area using Shannon’s Entropy and examines the causes and spatial planning implications of Land Use/Land Cover transformations.
3 . DATA AND METHODS
3.1 Data acquisition
The study is based on the Landsat data. The data has been acquired from the USGS Earth Explorer platform. As the data for multiple years were required for the study, data from several satellites have been used as shown in Table 1. Landsat OLI (Operational Land Imager)/TRIS (Thermal Infrared Sensor) has been used for 2024. For 2009 and 1994, Landsat TM (Thematic Mapper) and for year 1979, Landsat MSS (Multispectral Scanner) have been used. The imagery having cloud cover less than 5% has been selected to for higher accuracy of the land use and land cover data.
Table 1. Detailed Information of Satellite Data Used
|
Satellite
|
Sensor
|
Path/Row
|
Date
|
Source
|
|
Landsat 8
|
Operational Land Imager
|
148/38 and 148/39
|
14-03-2024
|
USGS Earth Explorer
|
|
Landsat 5
|
Thematic Mapper
|
148/38 and 148/39
|
13-03-2009
|
|
Landsat 5
|
Thematic Mapper
|
148/38 and 148/39
|
04-03-1994
|
|
Landsat 3
|
Multispectral Scanner
|
159/38 and 159/39
|
28-02-1979
|
3.2 Data processing and image classification
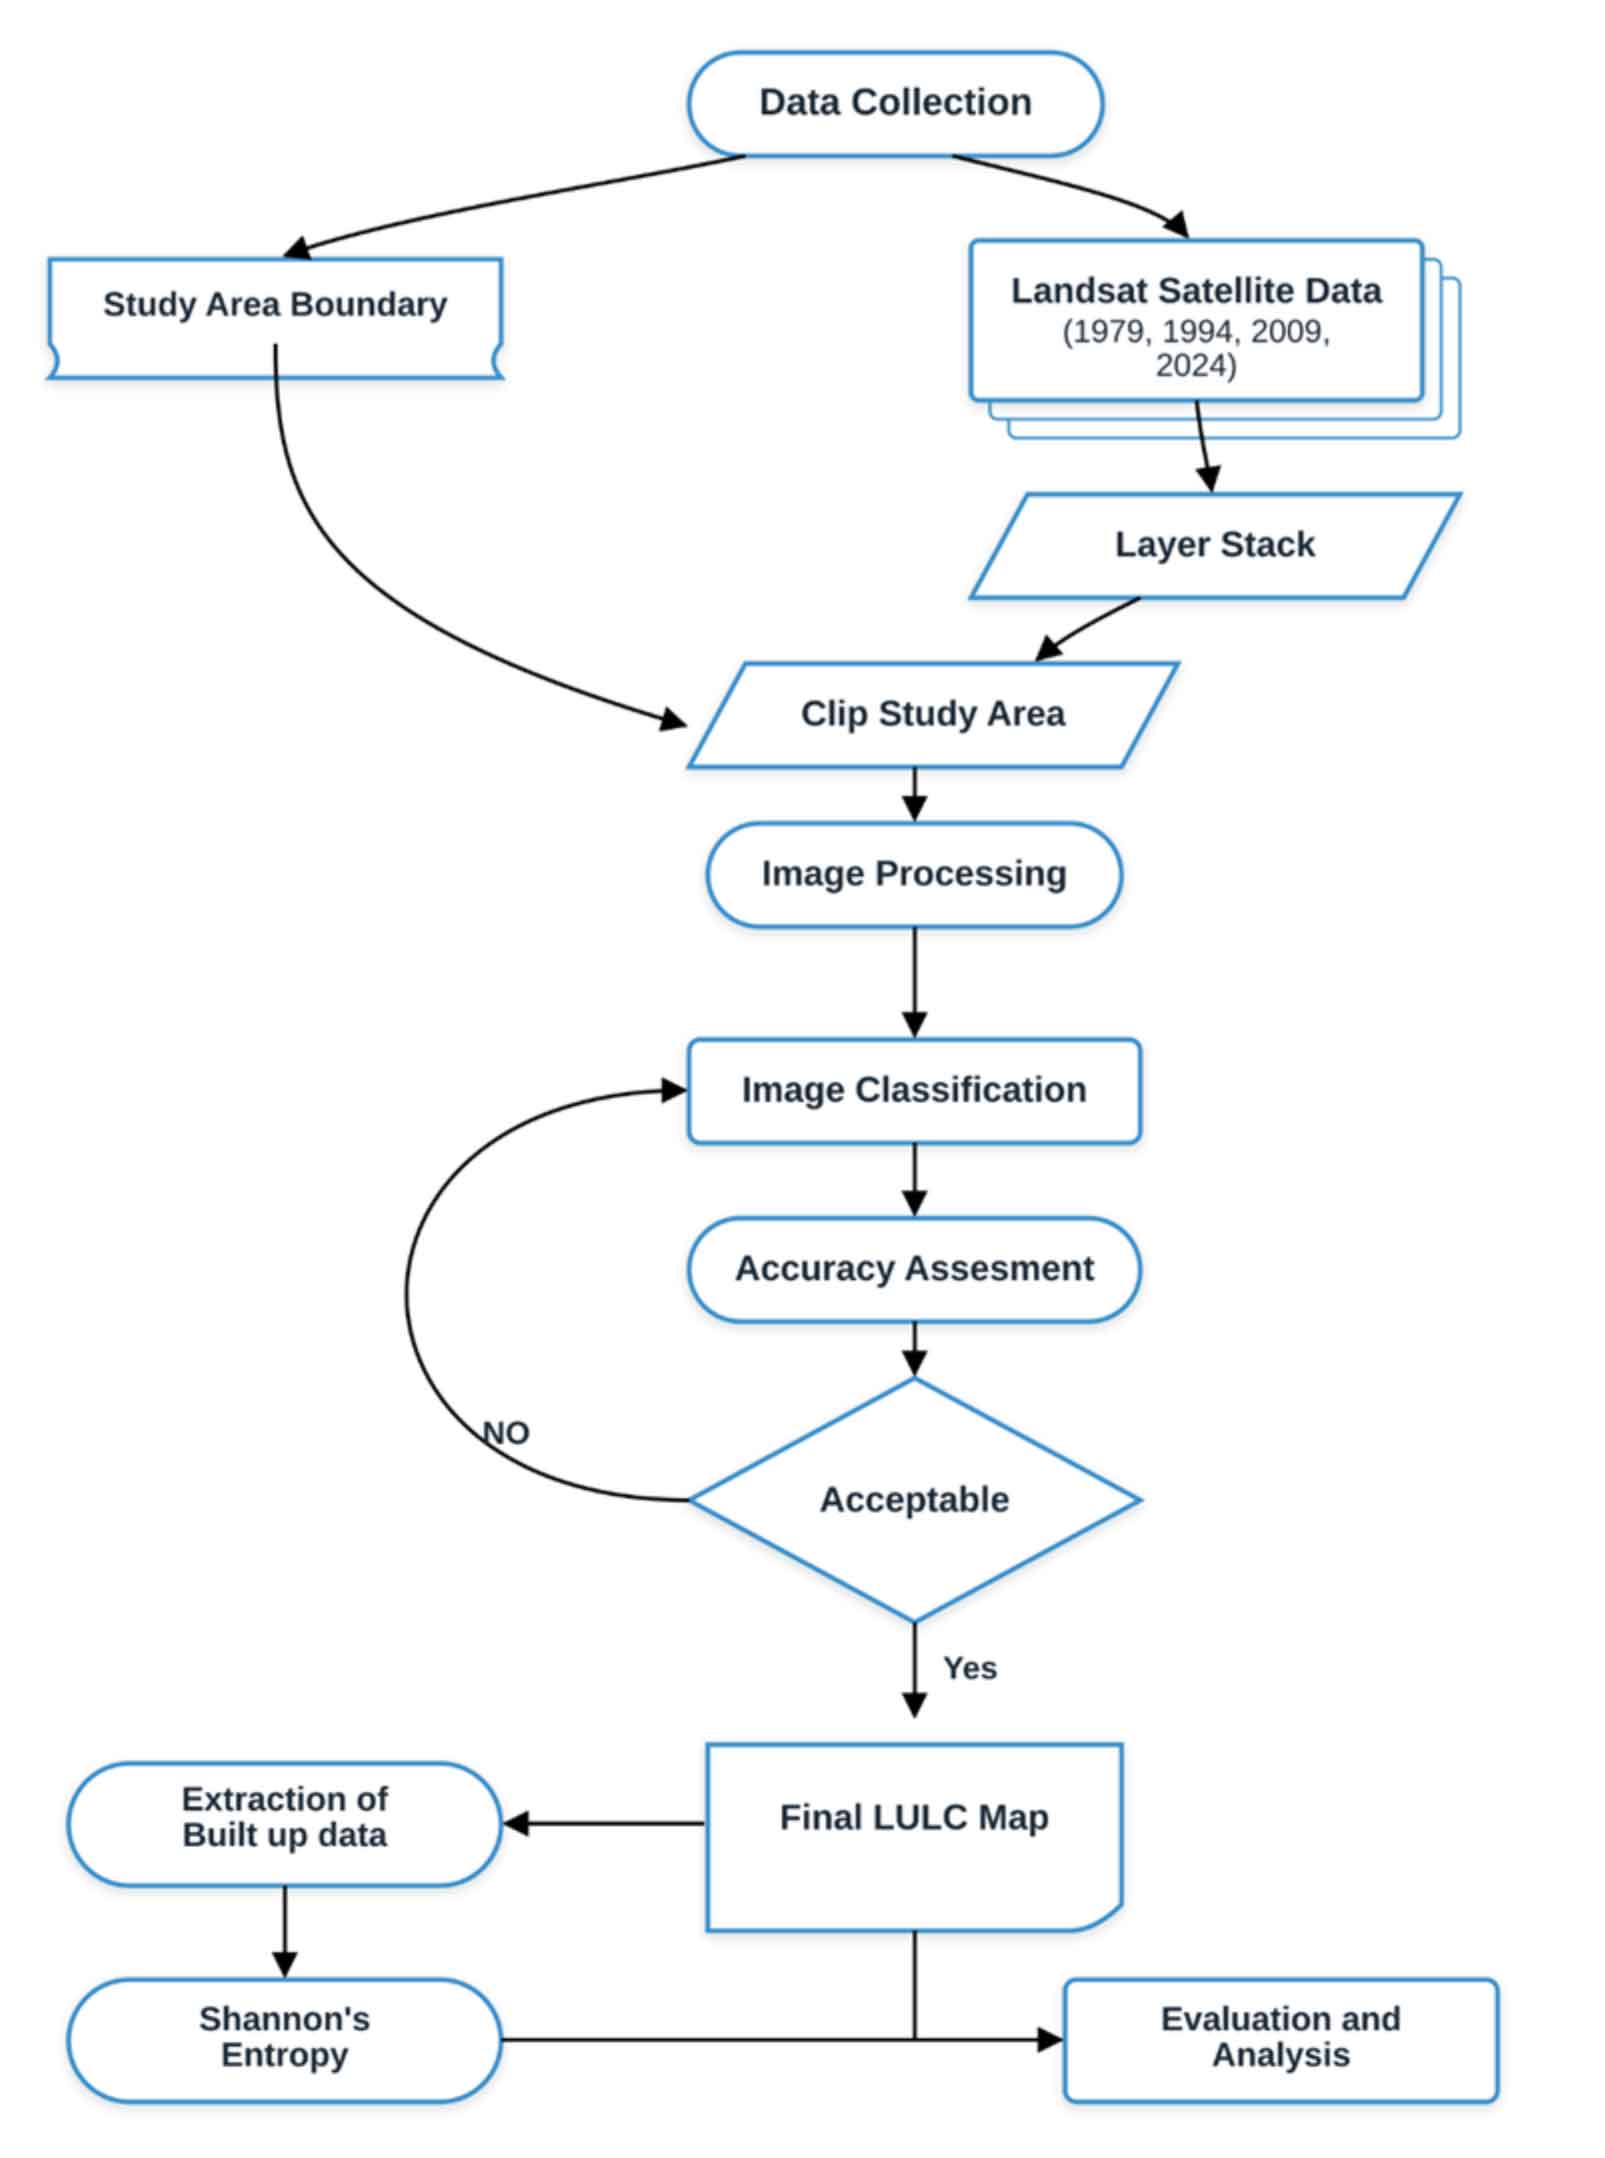
The processing of the satellite data has been done using ArcGIS Pro. First of all, a composite tool has been used to combine the multiple bands. This tool allowed us to efficiently combine Landsat multiple band images into a single composite image for image stacking, a process that improves the distinction between different land cover types by utilizing the full range of spectral information from multiple bands (Adhikari et al., 2025; Chander et al., 2009). The inclusion of multiple bands enhanced the discrimination capabilities of the classifiers, increasing the comprehensiveness of the assessment of the LULC classes (Pande et al., 2024). The mosaic tool has been used to combine the data as the study area was spread across different paths/rows of the satellite imagery and the study area was extracted.
After the extraction of the study area, five LULC classes were selected for the purpose of the study (Table 2). These five categories are Built-up, Agriculture, Forests, Barren land and water bodies. These land use classes are based on the LULC classification of the National Remote Sensing Centre, India. After selecting the required LULC classification, false color composites of extracted satellite imagery data have been used for better identification and classification of the area. Supervised classification has been used to prepare the LULC map. LULC classes are often analyzed using digital remotely sensed data and supervised classification to process and categorize images into categories (Campbell, 2011; Mohajane et al., 2018; Khanam et al., 2022). In this method, “spectral signatures are developed from specified locations in the image. These specified locations are given the generic name ‘training sites’ and are defined by the user” (Mallupattu et al., 2013). Supervised classification is more or less controlled by the analyst (Patra and Gavsker, 2021). After selecting the training sites polygon using the false color for supervised classification, classification of the study area was done using maximum likelihood. Maximum likelihood is a supervised classification algorithm that assigns each pixel in a satellite image to the class that maximizes the likelihood function based on the properties of pixel values (Deo et al., 2024). This method is based on probability theory and is frequently used in the analysis of remote sensing images to classify pixels into various types of land cover (Bharath et al., 2023; Tsai et al., 2019). At the end, LULC maps for the years 1979, 1994, 2009 and2024 were produced. The methodology has been summarized in Figure 2.
Table 2: Land Use/ Land Cover Classes of Study Area
|
Land Use/Land Cover Class
|
Description (Based on National Remote Sensing Centre, India, 2019)
|
|
Agriculture
|
Cropped field, fallow land, agricultural plant or shifting cultivation
|
|
Built-Up
|
Urban and Rural areas, including Residential, Commercial and services, Industrial, Transportation, Communication and Utilities.
|
|
Forests
|
Dense or open evergreen, semi-evergreen, deciduous and tree-clad areas including forest plantations and scrub forests
|
|
Barren Land
|
Salt-affected land, gully, ravines, barren rocky and riverine sandy areas
|
|
Water Bodies
|
Wetlands, rivers, canals, drains, lakes, ponds and waterlogged areas
|
3.3 Accuracy assessment
The accuracy evaluation of LULC changes is necessary for the right and efficient analysis of each class (Butt et al., 2015). Accuracy assessment has been done by creating a confusion matrix for the respective LULC map. “The confusion matrix shows
the number of pixels that were correctly or incorrectly categorized into each class” (Dhiman et al. 2022). For accuracy assessment, 250 ground control points were selected using a stratified random sampling method, dividing fifty control points for each class. These ground control points were compared with Google Earth historical imagery. Historical imagery of 05/2024, 04/2009 and 12/1994 has been used for the years 2024, 2009 and 1994 respectively.
The accuracy points were transferred to Google Earth and ground truth was verified for the years 2024, 2009 and 1994. Due to the absence of historical imagery for 1979, it was not possible to conduct an accuracy assessment for this year. After verifying the ground truth, user accuracy, producer accuracy and Kappa coefficient were obtained for the years 2024, 2009 and 1994. The percentage of correctly classified pixels is measured by overall accuracy, and the degree of agreement over and above what would be predicted by chance alone is assessed by the Kappa coefficient (Bharath et al. 2023; Chowdhury et al. 2020; Kangabam et al., 2019). The value of Kappa coefficients from 0.80 to 1.00 can be considered as an almost perfect strength of agreement (Rwanga et al., 2017). Therefore, a Kappa coefficient of more than 0.80 is regarded as a good measure of accuracy for the classified image. As the study was aimed at under studying the change in the land use in the study area over these years, change assessment was conducted. After classifying the images, images of subsequent years were compared at the pixel level using ArcGIS Pro and further, the changes were extracted.
3.4 Shannon’s Entropy
Multiple scholars have used Shannon’s entropy to analyze the pattern of urban sprawl to understand the concentration or dispersion of urban growth in any region at any point of time (Sudhira et al., 2003; Kumar et al., 2007; Chong, 2017; Verma and Chatterjee, 2017; Patra et al., 2022; Khanam et al., 2022; Banerjee and Dutta., 2024). Therefore, to analyze the urban sprawl in LPA Ludhiana for the years 1979, 1994, 2009 and 2024, Shannon’s entropy has been used. The following equation has been used to calculate Shannon’s entropy
\(Absolute \ Entropy \ (H_n) = -\sum_{i=1}^{n} P_i \log_e P_i\)
\(Relative \ Entropy \ (H_n') = \frac{-\displaystyle\sum_{i=1}^{n} P_i \log_e P_i}{\log_e (n)}\)
Where Pi stands for the proportion of the variable (built-up area) in the ith zone (sector); n represents the number of zones or spatial divisions (8 sectors of direction) under consideration.
The value of Hn lies between 0 and \(\log_e(n)\), where 0 shows the absolute compactness and \(\log_e(n)\) shows high sprawl and dispersion. The study area was divided into eight sectors as per eight directions (North, North-East, East, South-East, South, South-West, West and North-West), to calculate Shannon’s entropy. Built-up area was extracted from each LULC map, and the map was divided into these eight sectors. As there are eight sectors, the value \(\log_e(n)\) will be 2.079, that is the highest value of Absolute entropy (Hn). As the study is aimed at comparing the sprawl of multiple years, relative entropy has been used. The values of Absolute entropy are normalized for multiple years, and the value lies between 0 and 1, where 0 shows the high compactness, and 1 shows the highly sprawled distribution (Banerjee and Dutta, 2024).
4 . RESULTS AND ANALYSIS
4.1 Accuracy assessment
The summary of accuracy has been provided in Table 3. The analysis shows that the Classification is reasonably accurate as the overall accuracy remained 87.2% for 2024, 89.6% for 2009 and 88.4% for 1994. The Kappa Coefficient also indicates a good level of agreement between the classified image and the reference data. The Kappa coefficient for the years 2024 and 2009 was 0.84 and 0.87, respectively. For the year 1994, it was 0.85. Considering these values, the classified maps can be used for further analysis.
Table 3. Accuracy Assessment and Kappa Coefficient
|
Year
|
1994
|
2009
|
2024
|
|
LULC Classes
|
Producer Accuracy
|
User Accuracy
|
Producer Accuracy
|
User Accuracy
|
Producer Accuracy
|
User Accuracy
|
|
Agriculture
|
81.67
|
98
|
80.32
|
98
|
79.03
|
98
|
|
Built-up
|
91.67
|
88
|
95.45
|
84
|
90.19
|
92
|
|
Forest
|
90.9
|
80
|
95.83
|
92
|
91.48
|
86
|
|
Barren Land
|
84.31
|
86
|
87.23
|
82
|
80
|
80
|
|
Water Bodies
|
95.74
|
90
|
92
|
92
|
100
|
80
|
|
Overall Accuracy
|
|
88.4
|
|
89.6
|
|
87.2
|
|
Kappa Coefficient
|
|
0.85
|
|
0.87
|
|
0.84
|
4.2 LULC in local planning area of Ludhiana
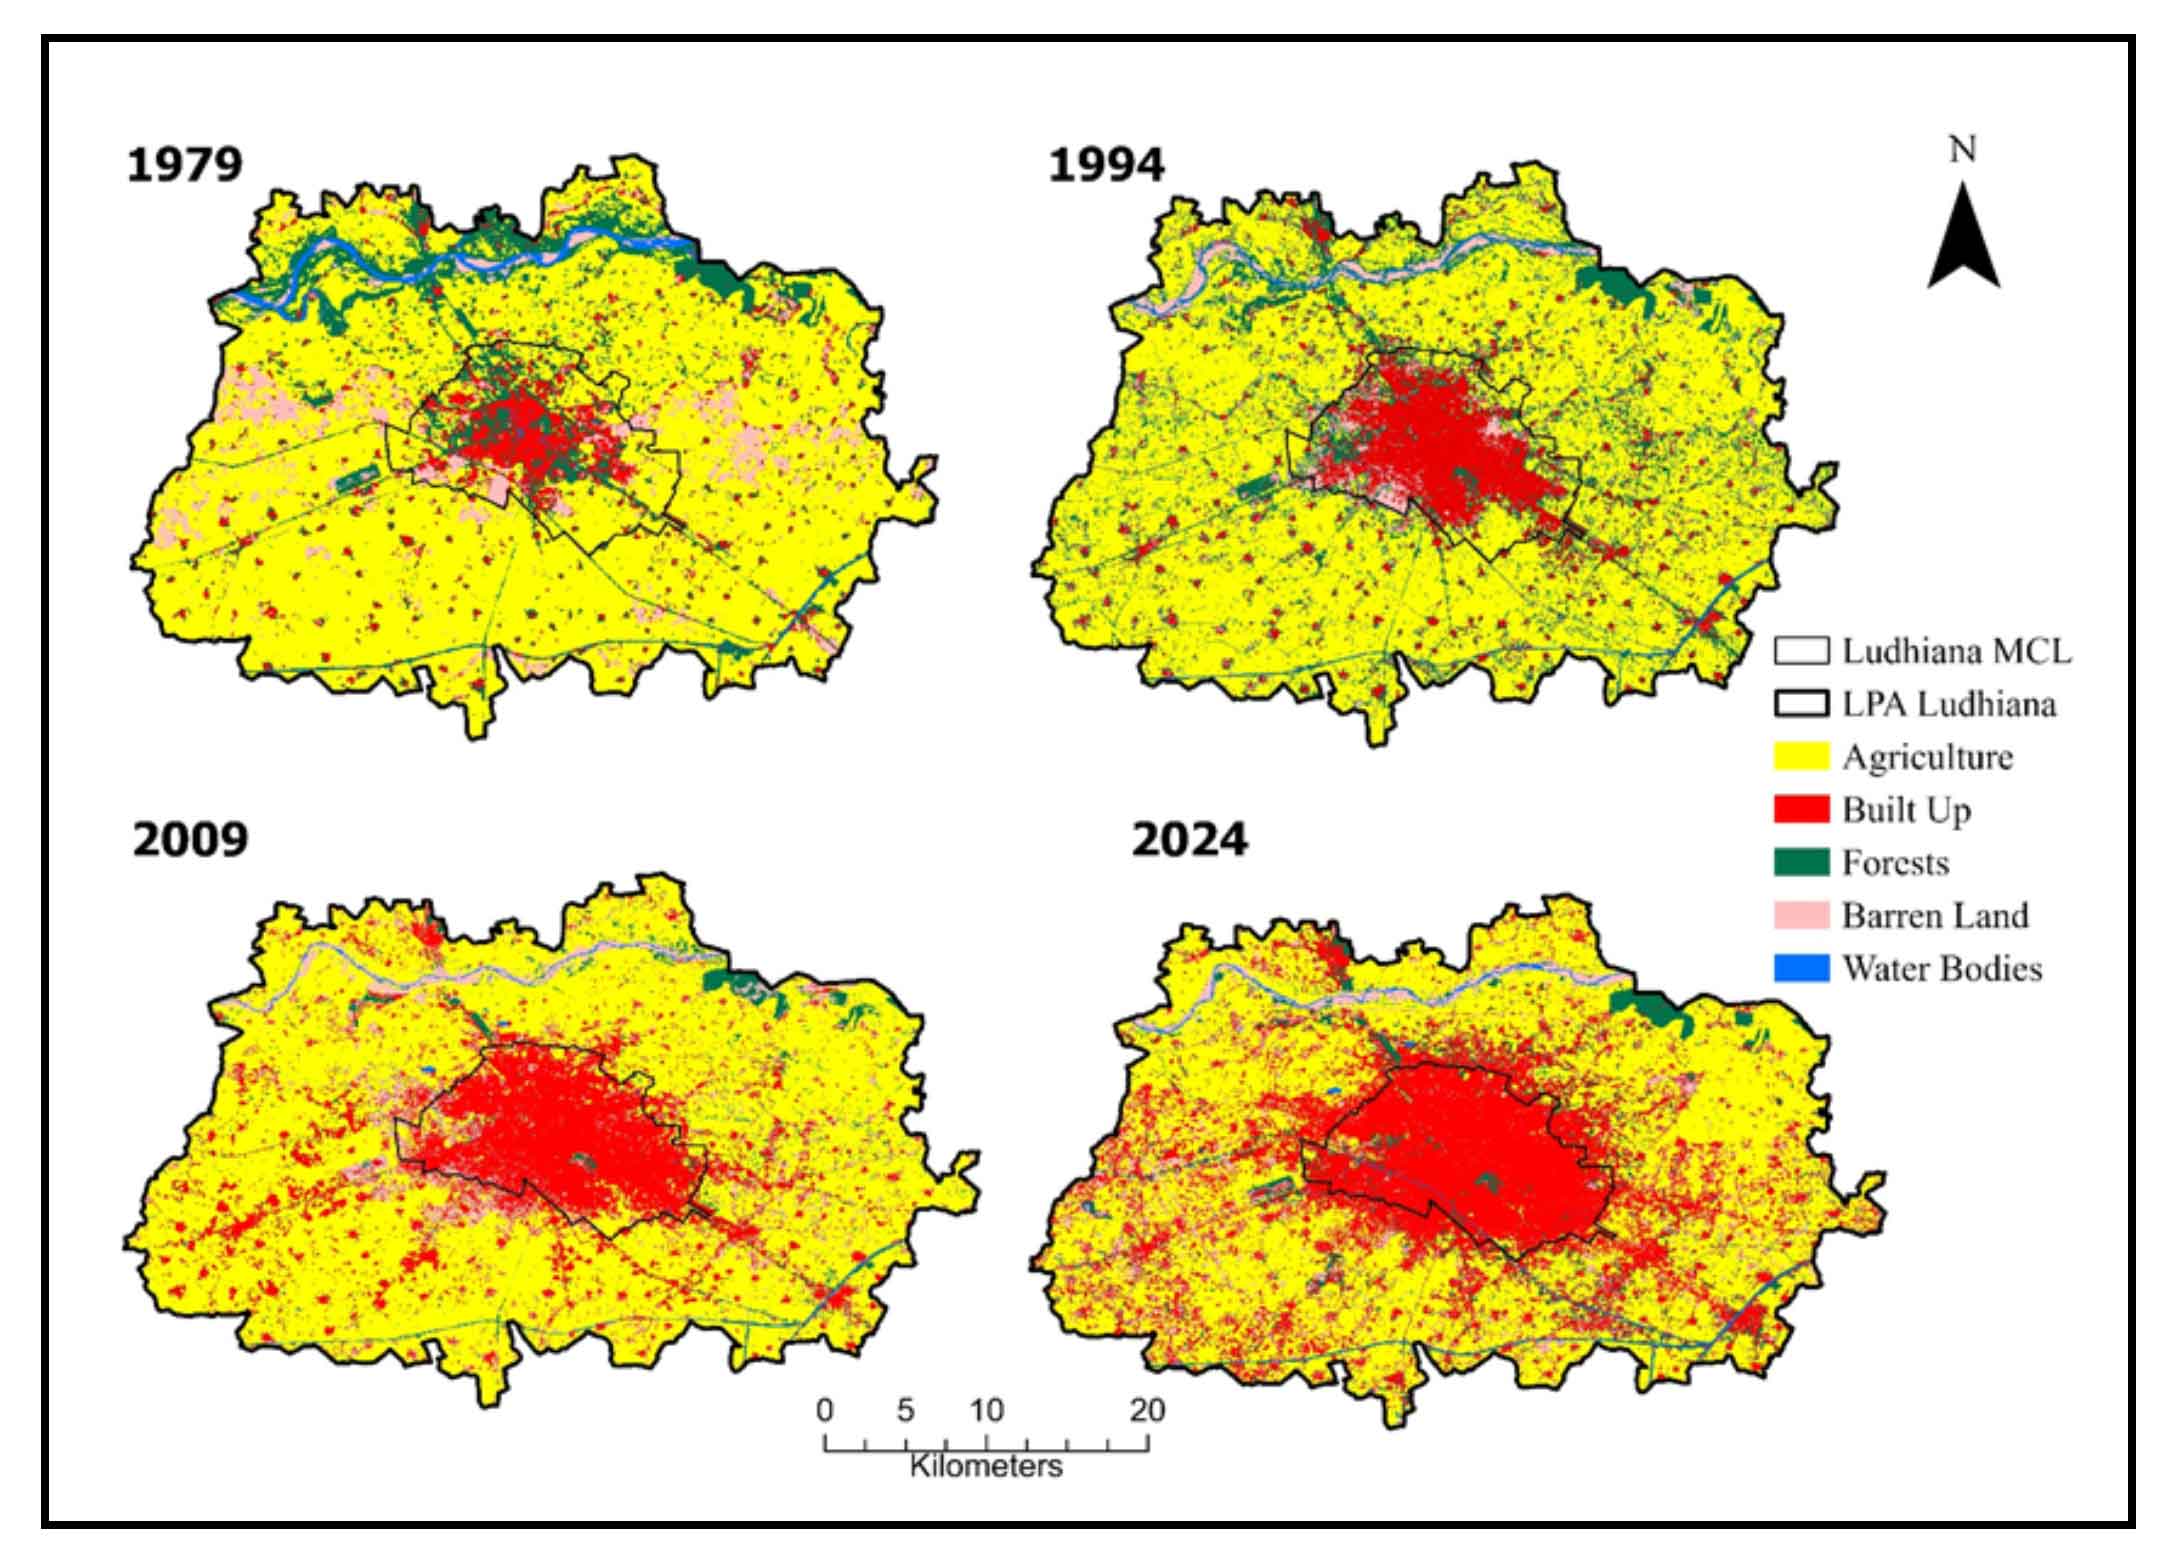
The most dominant LULC in the LPA Ludhiana remained agriculture in all the study years. In 1979, the agricultural land use covered 858.99 sq. km. of total area, which declined to 794.86 sq. km. in 1994. It slightly increased to 820 sq. km. in 2009 and further dropped to 650.10 sq. km. in 2024. The built-up land cover, on the other hand, witnessed a drastic increase in all the study years.
The built-up land cover was merely 81.57 sq. km. in 1979, which increased to 130.22 sq. km. in 1994. It further increased to 240.99 sq. km. in 2009. It further increased to 365.83 sq. km. in 2024. The forest land cover was 150.49 sq. km. in 1979, which increased to 202.27 sq. km. in 1994. It witnessed a sharp decline in 2009, reaching to 37.53 sq. km. but further increased to 69.17 sq. km. in 2024. Table 4 shows the total area and percentage under different LULC classes in the Local Planning Area of Ludhiana.
Table 4. Total Area and Percentage under different LULC classes in Local Planning Area Ludhiana
|
Year/LULC Class
|
1979
|
1994
|
2009
|
2024
|
|
Area
|
Percentage
|
Area
|
Percentage
|
Area
|
Percentage
|
Area
|
Percentage
|
|
Agriculture
|
858.99
|
72.22
|
794.86
|
66.83
|
820.98
|
69.02
|
650.1
|
54.66
|
|
Barren Land
|
83.13
|
6.99
|
52.50
|
4.41
|
82.11
|
6.90
|
88.15
|
7.41
|
|
Built-Up
|
81.57
|
6.86
|
130.22
|
10.95
|
240.99
|
20.26
|
365.83
|
30.76
|
|
Forest
|
150.49
|
12.65
|
202.27
|
17.01
|
37.53
|
3.16
|
69.17
|
5.82
|
|
Water Bodies
|
15.19
|
1.28
|
9.52
|
0.8
|
7.81
|
0.66
|
16.13
|
1.36
|
The barren land area remained consistent during the study years. The barren land cover was 83.13 sq. km. in 1979, which reached to 52.5 sq. km. in 1994. It increased to 82.11 sq. km. in 2009 and 88.15 sq. km. in 2024. The condition remained similar for water bodies as well. The land covered by water bodies was 15.19 sq. km. in 1979. It increased to 9.52 sq. km. in 1994 which declined to 7.81 sq. km. in 2009. It further increased to 16.13 sq. km. in 2024. Figure 4 shows the LULC of Local Planning Area Ludhiana for all these study years.
4.3 LULC change
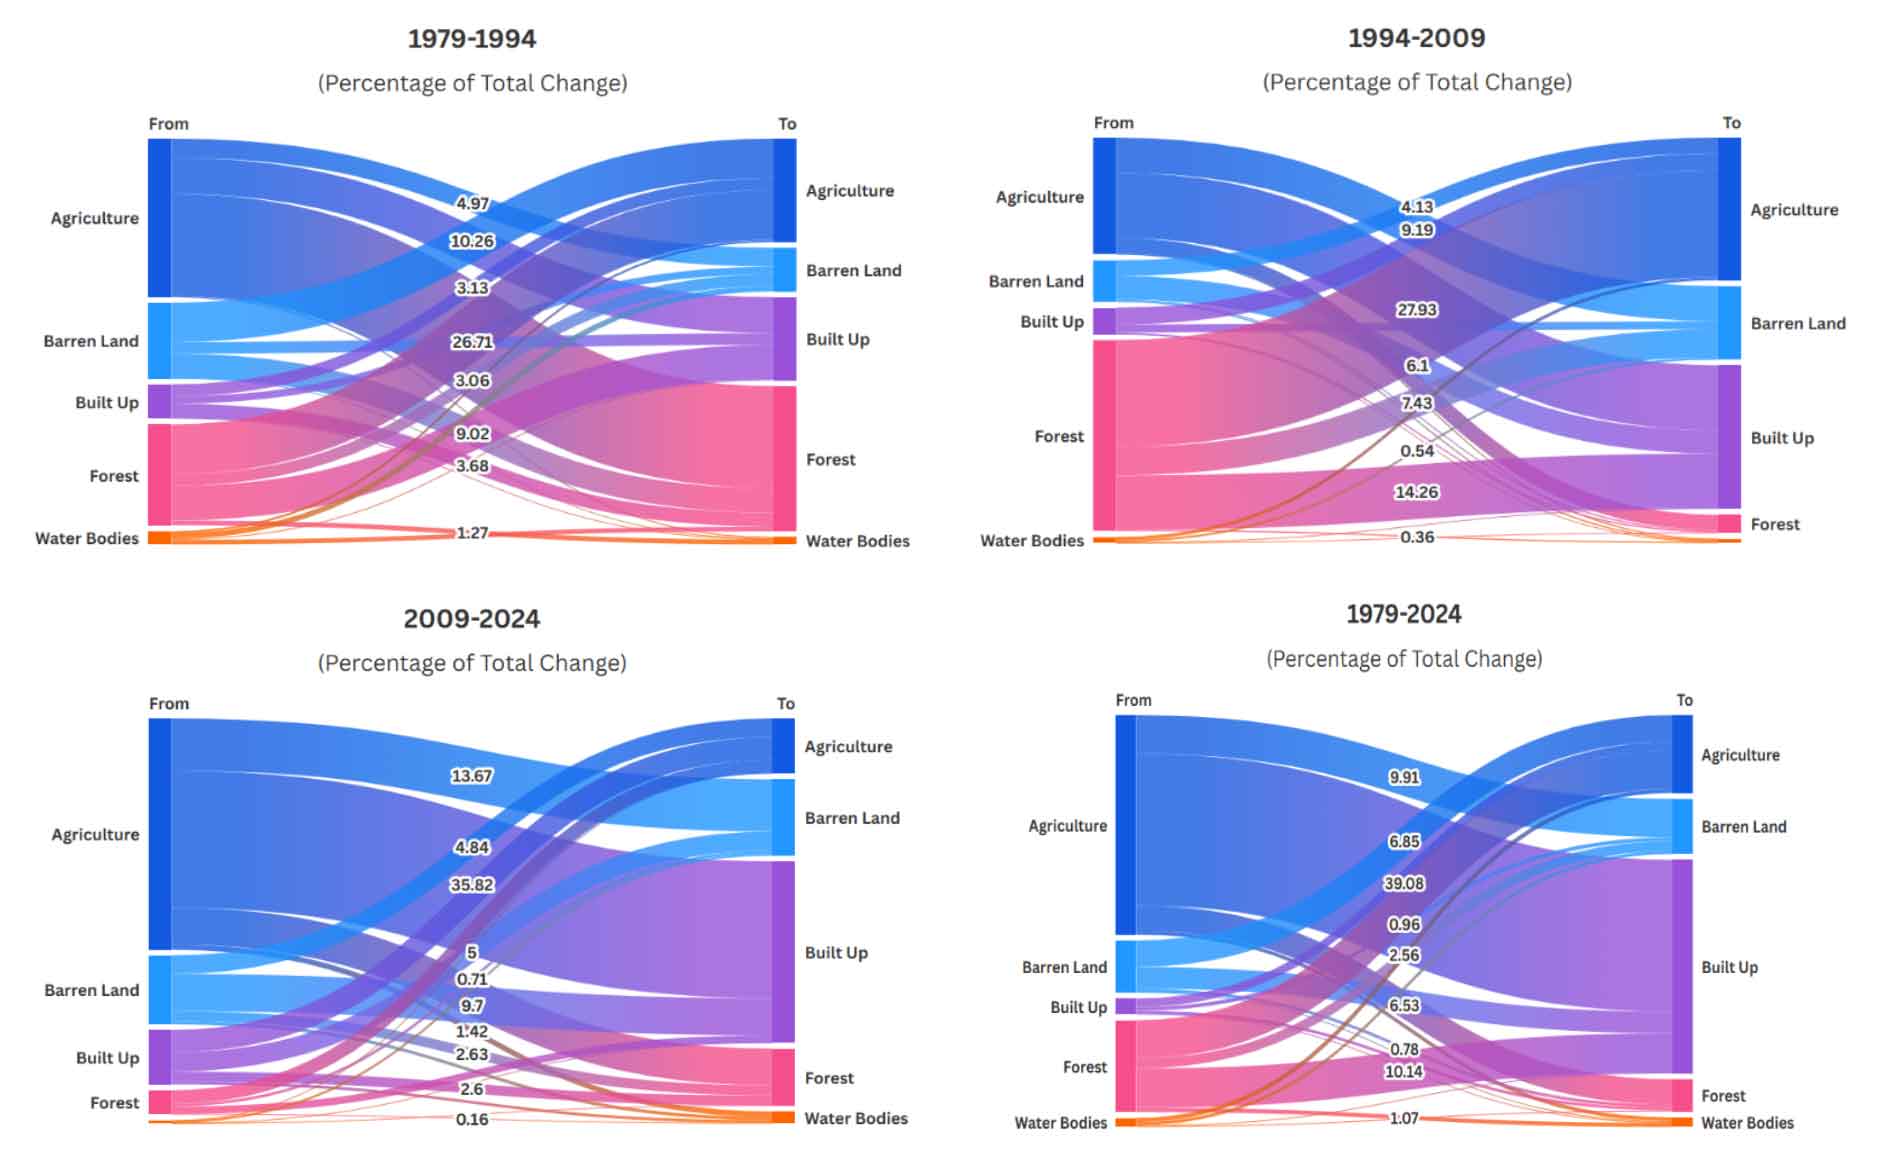
Agricultural land exhibits the highest level of transition among all categories. The transition from agriculture to built-up land increases progressively across the study periods, from 9.44% during 1979-1994 to 17.00% during 1994-2009, and further to 35.82% during 2009-2024. Over the entire study period (1979-2024), this transition accounts for 39.08%, representing the most prominent change. Agriculture to barren land conversion also shows an increasing trend, rising from 4.97% from 1979 to 1994 and to 13.67% from 2009-2024. In contrast, agriculture to forest is highest during 1979-1994 (26.71%) and decreases considerably in the subsequent periods. Transitions involving barren land show noticeable variability across the study duration. Conversion from barren land to agriculture is highest in the first period of 1979-1994 (10.26%) and declines in later periods. Barren land to built-up conversion increases gradually from 3.01% to 9.7% across the three intervals. The conversion of barren land to forest remains relatively low throughout the study period, with minimal values recorded during 1994-2009 and 2009-2024. Built-up land displays limited transitions to other categories. Conversion from built-up to water bodies remains minimal across all intervals, with values below 1%. Forest land undergoes notable transitions, particularly to agriculture and built-up land. Forest to agriculture conversion reaches its maximum during 1994-2009 (27.93%) and declines sharply during 2009-2024. Forest to built-up conversion is highest during 1994-2009 (14.26%), with lower values observed in the subsequent period. Transitions from forest to water bodies remain consistently low across all time intervals. Water bodies show the least overall change among all land cover categories. Transitions from water bodies to agriculture, barren land, built-up land, and forest remain minimal during the course of the study period. However, slight fluctuations are observed across different time intervals, indicating minor spatial redistribution within this category.
4.4 Urban sprawl
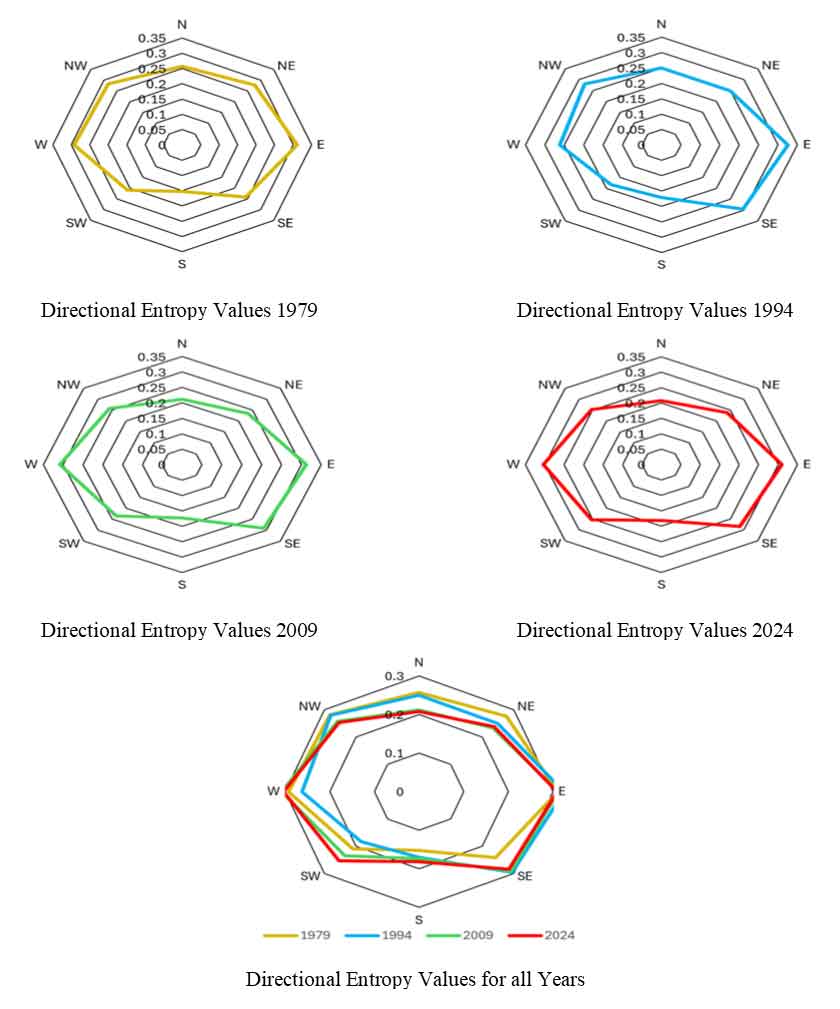
Shannon’s Entropy value gives essential insight into the urban sprawl in the LPA, Ludhiana. The results presented in Table 5 indicate that although the built-up area of the study region has changed considerably over time, Shannon’s Entropy values have remained largely stable. The absolute entropy values vary only marginally from 2.0322 in 1979 to 2.0238 in 2024, while the relative entropy consistently remains high, ranging between 0.9691 and 0.9773. Since the maximum entropy value, logₑ(n), remains constant (2.079), the observed stability in relative entropy suggests that urban growth, despite being substantial in magnitude, has occurred in a proportionally balanced manner across the defined spatial zones or directional sectors. Shannon’s entropy is sensitive to the distribution of urban land rather than the absolute quantity of built-up area; therefore, even significant spatial expansion does not necessarily result in major changes in entropy values if the relative share of growth among zones remains similar (Cho et al., 2021; Nazarnia et al., 2019). The slight decline in entropy from 1979 to 2009 reflects a marginal tendency toward spatial concentration, whereas the minor increase observed in 2024 suggests a renewed trend toward dispersion. However, the persistently high relative entropy values (close to 1) indicate that the overall urban form of the study area has maintained a predominantly dispersed and evenly distributed growth pattern over the study period. This finding implies that urban expansion has been spatially uniform rather than directionally dominant.
Table 5. Absolute and Relative Values of Shannon’s Entropy
|
Year
|
Absolute Entropy
|
\(log_e(n)\)
|
Relative Entropy
|
|
1979
|
2.0322
|
2.079
|
0.9773
|
|
1994
|
2.0231
|
0.9729
|
|
2009
|
2.0151
|
0.9691
|
|
2024
|
2.0238
|
0.9732
|
5 . DISCUSSION
The study indicates that the LPA Ludhiana has been completely transformed in terms of land use and land cover. The major agricultural land has transformed into built-up areas as the region witnessed a massive increase in population and urbanization. The study by Jha and Gavsker (2022) showed that the level of urbanization in the district was 42.01% in 1981, which increased to 59.16% in 2011 and was projected at 64.27% in 2021. Ludhiana City, being the major city in the district, absorbed the major population pressure and rapidly urbanized, becoming the most urbanized city in the state. This transformation needs to be understood within the broader historical context of Ludhiana’s emergence as Punjab’s industrial capital. Industrialization in Ludhiana is expected to have started nearly 150 years ago when artisans from Kashmir came to this town and started manufacturing woolen products. Post-partition, many refugees moved and settled in Ludhiana. This gave a further push to the artisanal and hosiery industry in the city. Ludhiana became very important in India for its hosiery and textile industry. The Green Revolution also played a crucial role in the development of industries in Punjab. The mechanization of agriculture created a need for an industrial setup to cater for the need.
“The demand from the agriculture sector pushed the industrial ecosystem in the state” (Jha and Gavsker, 2022). “Studies reveal that agriculture-induced industrialization remains the primary motive force for urbanization in the state of Punjab” (Maini, 2004). Ludhiana, already having an industrial inclination, received a significant push and industrial growth became more rapid. This created a need for new workers, and the city witnessed a major influx of migrants. Bhagat (2014) reports that the percentage of in-migrants in million-plus urban agglomeration, such as Ludhiana, is 55% or more. The increase in population created a need for built-up areas, and agricultural land was prominently sacrificed for this purpose. It not only impacted agricultural land but also water bodies such as ponds and barren land. The increasing pressure on land impacted the forest cover as well, with forests appearing to be cleared for agricultural purposes. This pattern of land conversion reflects the complex interplay between Ludhiana’s industrial growth and agricultural heritage.
The findings of this study reveal that Ludhiana’s Local Planning Area (LPA) has undergone substantial land use transformation, with Shannon’s entropy values indicating sprawl patterns tending toward perfect sprawl across all study years. This pattern aligns with broader urban dynamics observed across India’s rapidly growing cities. A comparative study of 16 major Indian cities by Mukherjee and Panda (2024) demonstrated that urbanized landscapes primarily display dispersive outward growth since the beginning of the 21st century, with significant compaction occurring only near urban cores in recent years. Ludhiana hold almost a central position in the state of Punjab. The central position of the city enables it to connect with Ambala, Panipat, National Capital Territory Delhi, etc. in South-East, Chandigarh in East, Jalandhar, Amritsar in North-West, Bathinda in West, and other major cities. This central position, along with road and rail connectivity radiating in all directions towards other major cities, became the major reason for almost perfect sprawl in all the years, as the city was not growing in one specific direction but in all directions. Ludhiana’s sprawl characteristics mirror this national trend, though with distinctive regional attributes influenced by its industrial character and connectivity to major metropolitan centers. The entropy-based sprawl patterns observed in Ludhiana can be meaningfully compared with other Indian urban agglomerations. In Tiruchirappalli, entropy values of 3.85 (2006) to 3.88 (2017) against a log(n) of 3.95 demonstrated high dispersion in urban areas, particularly beyond 8 km from the Central Business District (Rastogi and Jain, 2018). Ludhiana’s sprawl patterns bear notable similarity to these cities, particularly in the directional expansion along major transportation corridors. This corridor-influenced sprawl pattern represents a critical planning challenge that distinguishes cities like Ludhiana from more radially expanding metropolitan areas.
The study shows that the built-up area in the city has rapidly increased, but the planning framework and ground reality show a high contrast. According to a NITI Aayog report on urban planning capacity, approximately 65% of the 7,933 urban settlements in India lack master plans to guide their spatial development (NITI Aayog, 2021). Even where master plans exist, implementation remains severely deficient. The Ludhiana Master Plan 2031, despite outlining provisions for arterial roads, public spaces, and regulated housing clusters, has seen key elements remain largely on paper due to farmer resistance to land pooling and proliferation of unauthorized colonies (CAG, 2018; PHD, 2019; Garg, 2025). The land pooling policy introduced under the Punjab Regional and Town Planning and Development Act, 2006, was designed to facilitate orderly urban expansion while ensuring land availability for infrastructure and public amenities. However, in Ludhiana, this policy has faced significant implementation challenges. Farmers from 32 of 44 affected villages have resisted the policy, fearing delays in compensation or permanent land loss (Garg, 2025). This resistance has fragmented development patterns and undermined the planned green belts and housing clusters envisioned in the master plan. The rapid transition of agricultural land to urban uses has intensified housing pressures in Ludhiana. Punjab faces a unique challenge where urban poverty rates exceed rural poverty rates, and slum populations are growing faster than overall city populations (CSE, 2017). According to the NBO (2015), Punjab has approximately 1.46 million people living in slums, representing 2% of India’s total slum population. Ludhiana exemplifies this housing crisis with 209 identified slum pockets and a slum population growth rate of 25%, far exceeding the city’s annual population growth rate of 8.75% (CSE, 2017). The Task Force on Urban Housing Shortage in Punjab estimated a deficit of 0.39 million dwelling units in 2012, predominantly affecting Economically Weaker Sections (EWS) and Lower Income Groups (LIG), who account for approximately 95% of the housing shortage (CSE, 2017).
Ludhiana also occupies a pivotal position along the Amritsar-Kolkata Industrial Corridor (AKIC), which extends along the 1,839 km Eastern Dedicated Freight Corridor (EDFC) from Ludhiana in Punjab to Kolkata, spanning seven states. This corridor encompasses one of the most densely populated regions in the world, housing approximately 40% of India’s population, and is designed to stimulate investments in manufacturing, agro-processing, services, and export-oriented units. The corridor’s influence zone, extending 150-200 km on either side of the EDFC, directly encompasses the Ludhiana LPA, creating unprecedented development pressures. The research demonstrates that states lacking effective institutional systems for urban and regional development planning experience dampened multiplier effects from large-scale infrastructure investments. This observation is particularly relevant to Ludhiana, where the observed unplanned sprawl suggests gaps between infrastructure-led development and integrated spatial planning.
The conversion of agricultural land, forests and waterbodies also poses challenges in terms of the environment and natural habitat “The ecosystem may get negatively impacted by the disappearance of vegetation and water bodies due to soil erosion, deteriorated water quality, and loss of wildlife habitat” (Bharath et al., 2023). Further, the loss of agricultural area may pose a threat to food security as well in future. Punjab have been a major agricultural state but the area under land cover is diminishing. This may result from excessive use of many more fertilizers and chemicals to boost agricultural productivity to satisfy the needs, but this will further create complications impacting human health. Various studies have shown that the use of pesticides and chemical fertilizers along with other factors, has caused the increase in cancer cases in Punjab (Vikramjit et al., 2023; Thakur et al. 2009; Tiwana et al., 2009). The loss of water bodies with high demand of water for settlements may have also resulted in high pressure on groundwater. The report on Dynamic Ground Water Resources, 2023 Punjab by Central Ground Water Board reports that, “out of total 150 assessed blocks and 03 Urban areas taken for study, 114 blocks and 03 Urban Areas have been categorized as ‘Over-exploited’, 03 blocks as ‘Critical’, 13 blocks as ‘Semi Critical’ and 20 blocks as Safe”. This is a threatening situation in terms of groundwater. It becomes clear that the transformation of land use has a drastic negative impact on the environment and the overall life of human beings. This perspective adds to enhance our knowledge about and understanding of physical form and its nature as driven by social and political processes. Thus, land use and land cover are one element of the wider process operating in the urban space. McLoughlin (1973) noted that “physical form and function are emphasized, but not forgetting that they are but one manifestation of social and economic processes. Planning should often concern itself with necessity, with seeking improved governmental forms.”
The results of this study carry important policy implications for sustainable urban development in Ludhiana and similar rapidly urbanizing cities across India. The observed land transformation patterns, characterized by near-perfect sprawl and extensive agricultural land conversion, necessitate a comprehensive, multi-pronged policy framework that integrates zoning reforms, green infrastructure planning, wetland conservation, and sprawl containment measures within a coherent spatial planning strategy. As the master plan has faced several challenges, this study recommends transitioning from conventional text-based zoning regulations to form-based codes that respond to local contexts and economic growth drivers. Such reforms should incorporate mixed-use zoning provisions along major transportation corridors to promote Transit-Oriented Development (TOD), which encourages walkable, dense neighborhoods along public transport corridors and has been successfully explored in cities like Delhi, Pune, and Ahmedabad (Joshi, 2017). The establishment of green belts and buffer zones represents a critical intervention for containing Ludhiana’s outward sprawl. For Ludhiana’s LPA, this study recommends designating prime agricultural lands in peripheral villages as Agricultural Protection Zones with strict development restrictions, mandating green belt development around industrial clusters as per Ministry of Environment, Forest and Climate Change (2025) guidelines stipulating that green areas should constitute approximately 33% of total industrial plant area, and establishing green buffer zones along major highways radiating from Ludhiana, particularly along the Amritsar-Kolkata Industrial Corridor influence zone. These efforts can help to manage the rapid expansion and degradation of the environment and could help in creating a sustainable city.
6 . CONCLUSION
This study demonstrates that Ludhiana’s Local Planning Area has undergone a profound and largely irreversible transformation, marked by extensive conversion of agricultural land, degradation of water bodies, and near-perfect urban sprawl across multiple decades. Entropy-based analysis confirms that urban expansion has been dispersive and multidirectional, driven by industrial growth, strong transport connectivity, and sustained in-migration. While this trajectory aligns with broader national urbanization trends, Ludhiana’s industrial character, corridor-led and weak implementation of statutory plans have produced a particularly fragmented and environmentally stressed urban landscape. The disconnect between rapid built-up growth and ineffective planning instruments has intensified housing shortages, informal settlements, groundwater over-extraction, and ecological vulnerability. These findings underscore the urgency of reorienting Ludhiana’s planning framework toward compact, ecologically sensitive, and implementation-driven urban development. Zoning reforms should prioritize a transition from conventional land-use zoning to form-based and mixed-use regulations, particularly along high-capacity transport corridors, to promote densification and Transit-Oriented Development. Sprawl containment measures, including clearly defined urban growth boundaries and the protection of high-quality agricultural land through legally enforced Agricultural Protection Zones, are critical to curbing further peripheral expansion. Equally important is the institutionalization of green buffer planning through continuous green belts around industrial estates and major highways, alongside the restoration and legal safeguarding of urban ponds and wetlands to enhance groundwater recharge and ecological resilience. Future research should adopt integrative, forward-looking methodologies to support evidence-based urban governance. Predictive urban growth models, policy simulations assessing alternative zoning and land-pooling mechanisms, and climate-linked LULC projections can help anticipate long-term environmental and social consequences of different planning choices.




 ,
Kapil Kumar Gavsker 1
,
Kapil Kumar Gavsker 1