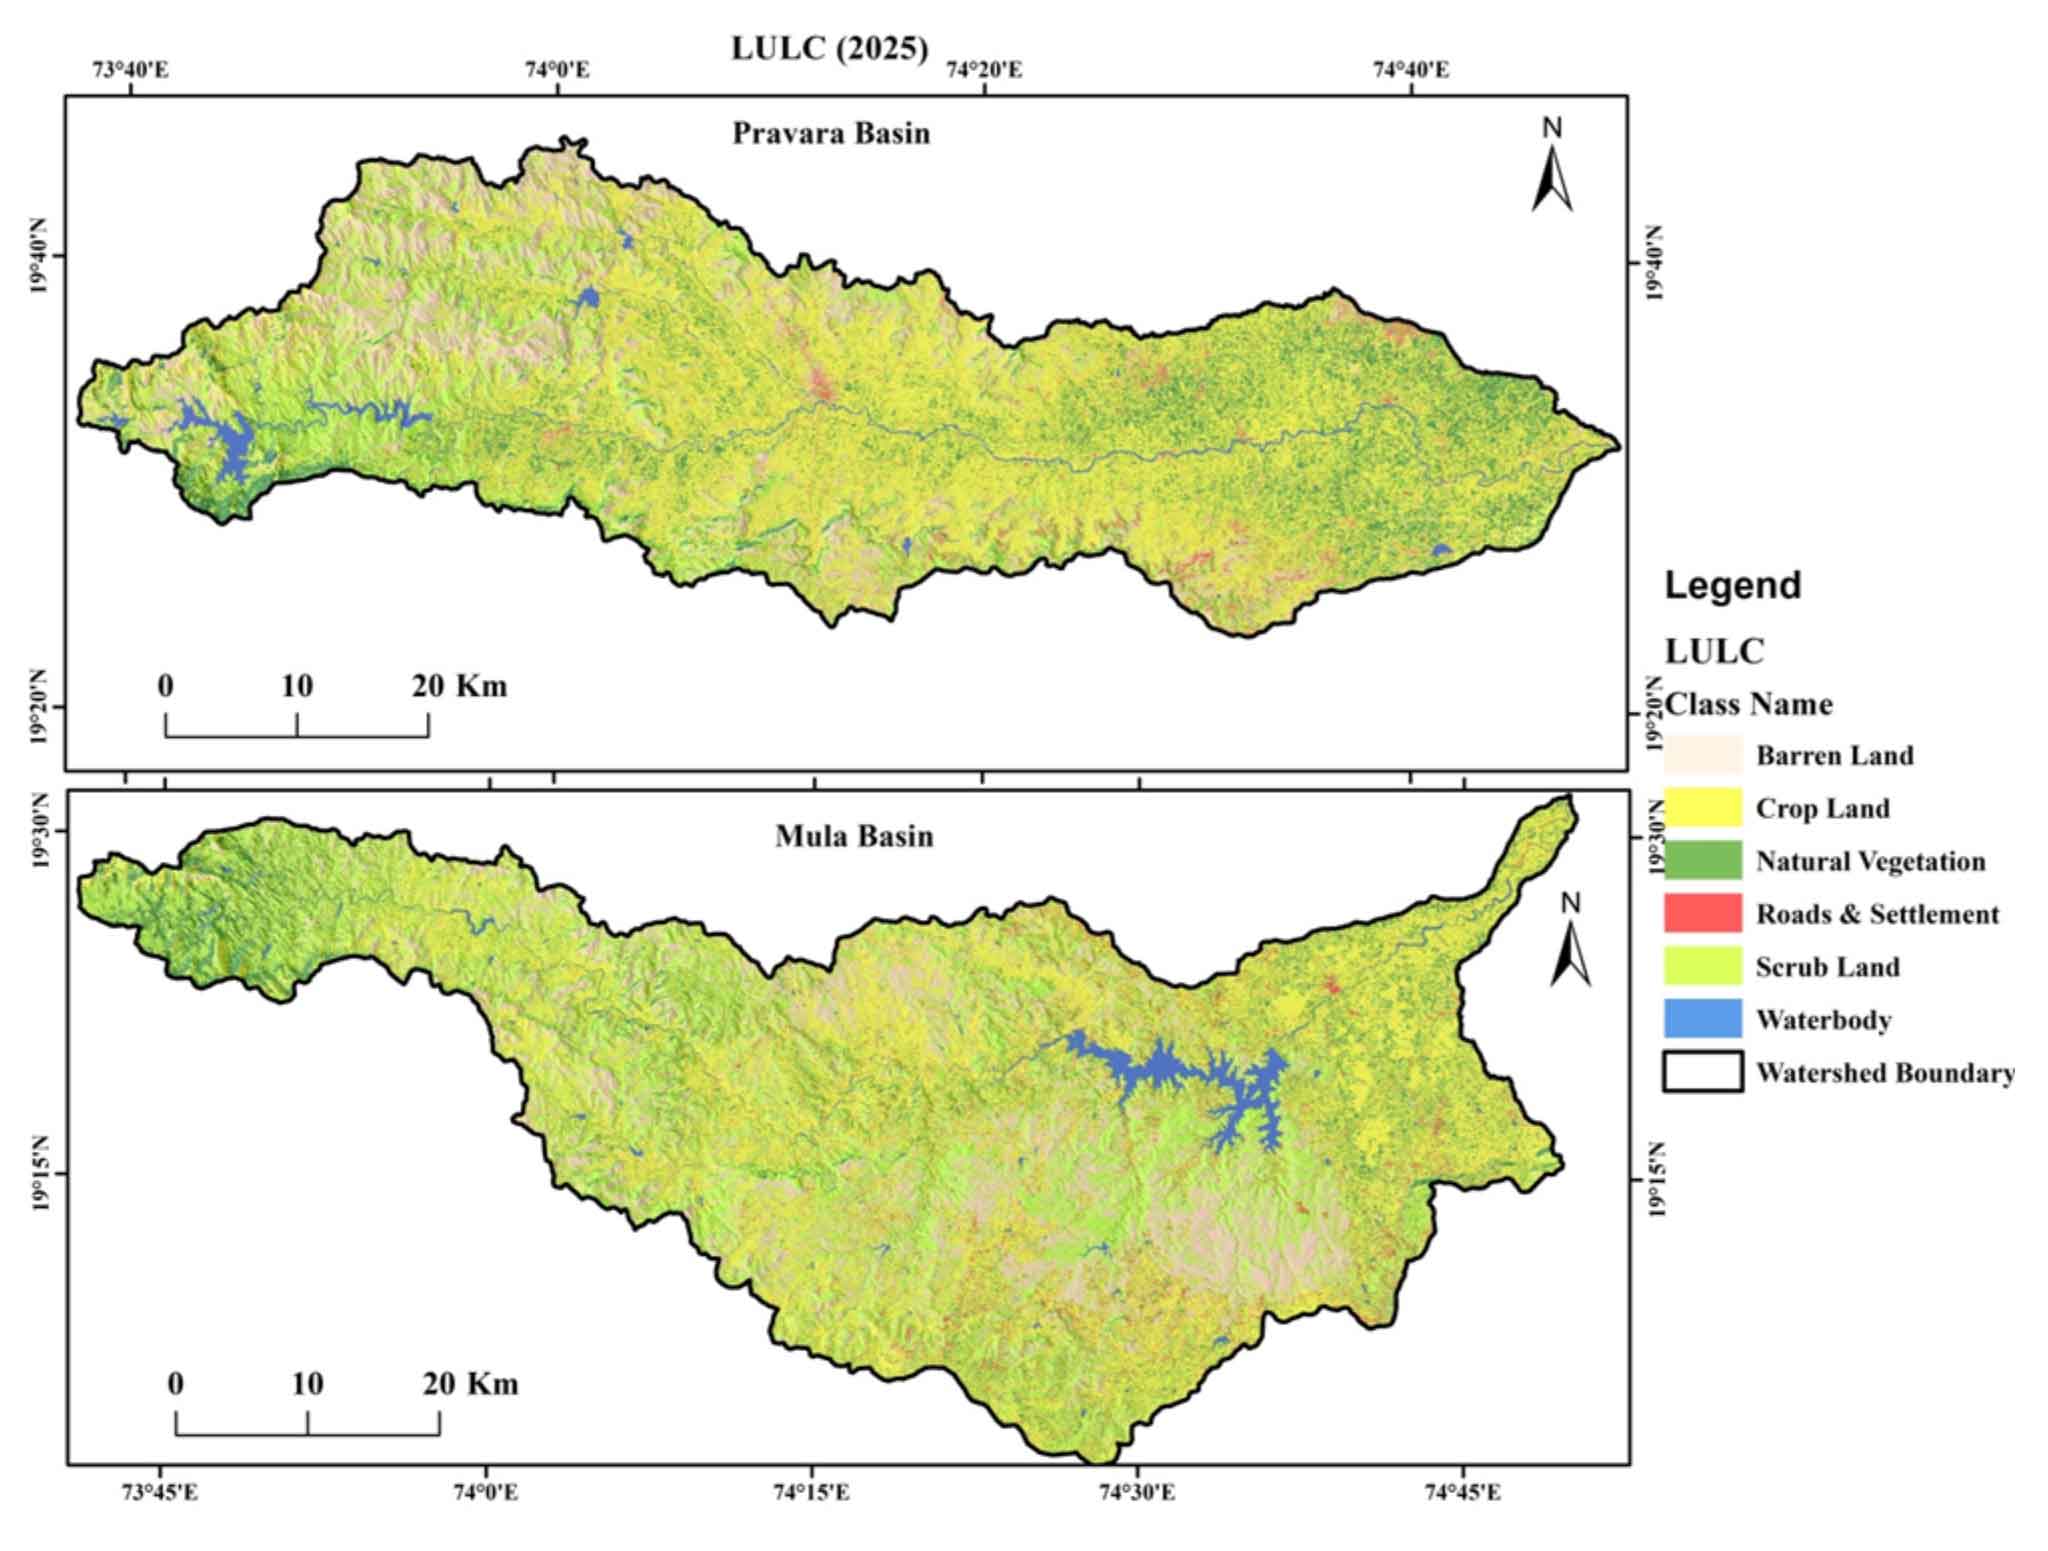
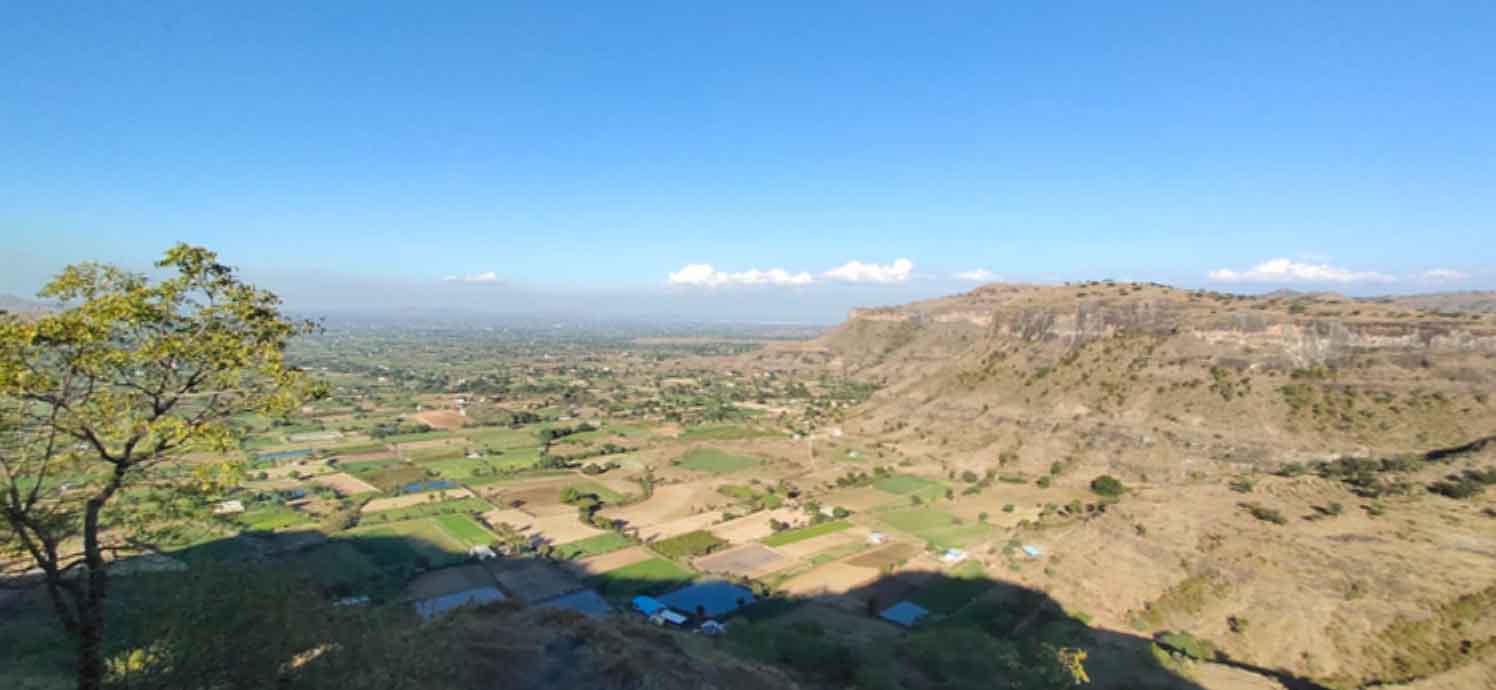
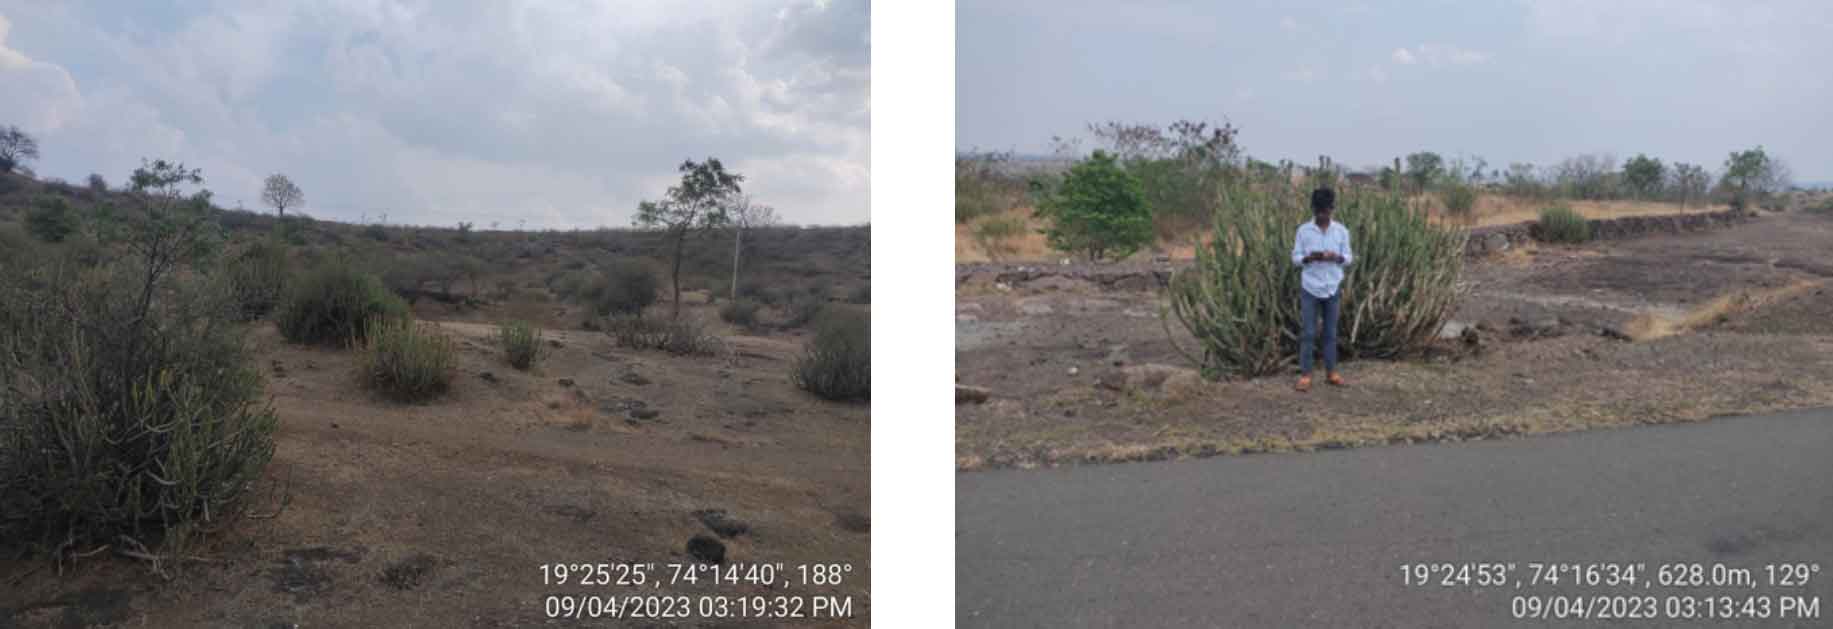
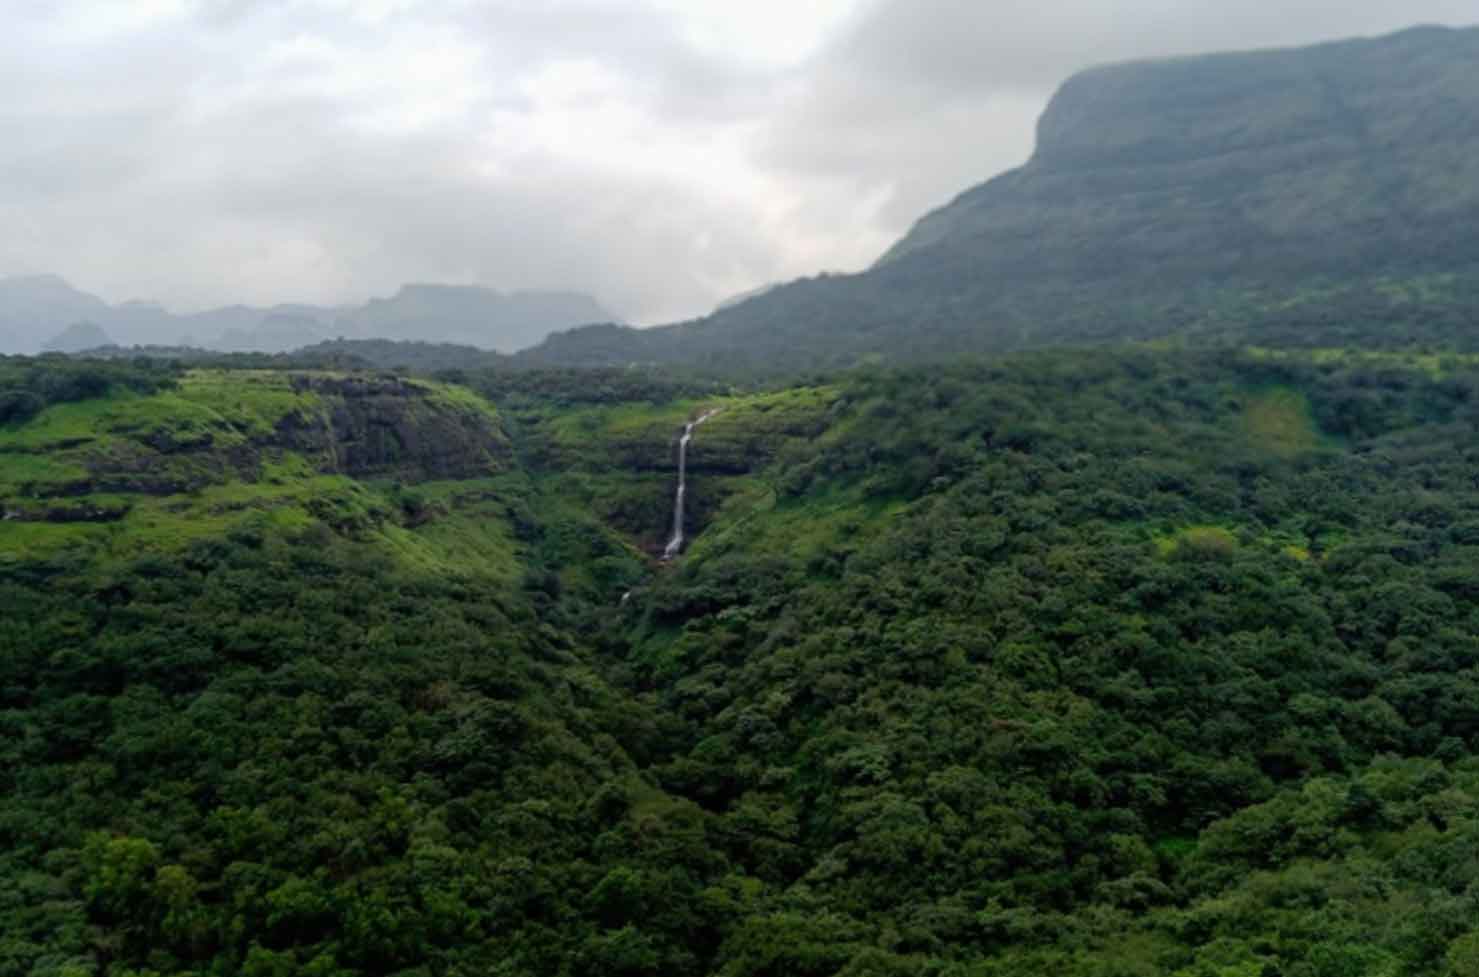
Fieldwork plays a crucial role in providing ground truth data, enabling a deeper understanding of land use and land cover changes in the study area (Ekka et al., 2026). During this stage, the study area is visited at various times or seasons using Global Positioning System (GPS) surveys, and digital photographs are taken (Fretwell et al., 2017). This helps in understanding the current land use and land cover, as well as the actual changes that have occurred (Tahir et al., 2025) in the study area from 1994 to 2025.
4.1 Field Verification
4.1.1 Built-up Land
During the field survey, built-up areas were identified and validated using fifty GPS coordinates and photographs, based on the presence of houses, roads, and related infrastructure that indicate significant anthropogenic expansion (NRSC, 2006; Utomo et al., 2025).
4.1.2 Cropland
Cropland covers areas dedicated to the cultivation of crops such as grains, vegetables, fruits, and nuts, as well as land used for livestock grazing (Bringezu et al., 2021). It consists of varied agricultural practices, including irrigated and unirrigated agriculture, fallow fields, and plantations, which jointly support farming, manufacturing, and rural living (Sivaraman et al., 2023). Field verification was conducted using GPS coordinates and photographic documentation, supported by observations of crop characteristics, cultivation patterns, and land-management practices (Photo 1) (Anderson, 1976).
4.1.3 Scrub Land
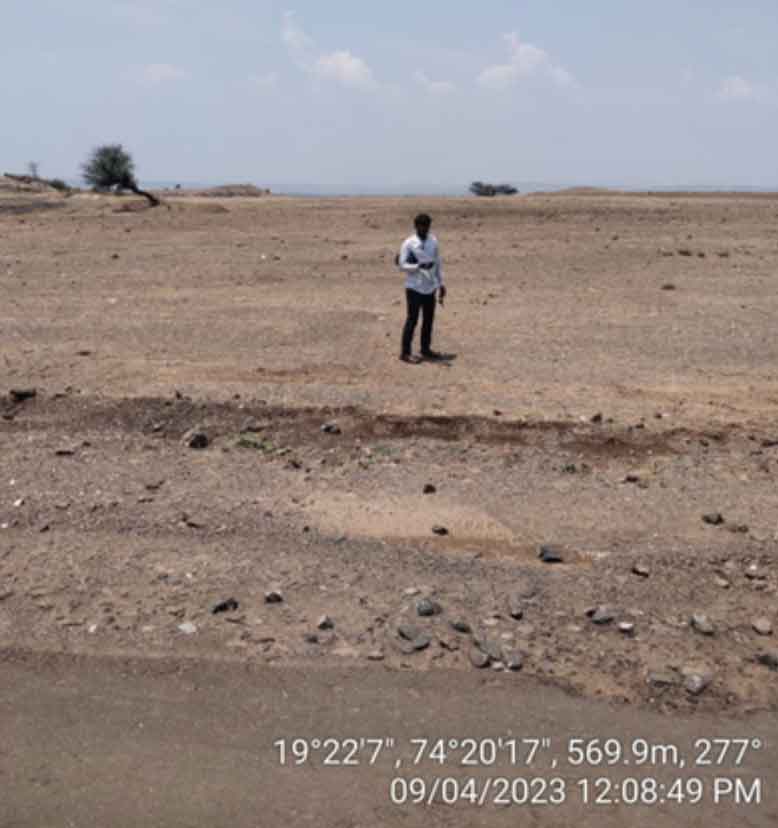
Scrub land is characterized by shallow and skeletal soils, rare chemical degradation (Wielgos and Kulik, 2026), steep slopes, severe erosion, and extreme aridity, which favor the expansion of sparse scrub vegetation (NRSC 2006; Zubair et al., 2026). These areas are generally characterized by elevated, relatively level terrain and are distinct from hilly or mountainous terrain (Gujar et al., 2025). Field verification was conducted using GPS coordinates and geotagged photographs to validate these features and support the accuracy assessment of the LULC classification (Photo 2) (Ganga et al., 2026).
4.1.4 Natural Vegetation
Vegetation was defined as land with >10% tree canopy cover, an area >0.5 ha, and trees ≥5 m in height (NRSC, 2006; Goparaju and Ahmad, 2020). It included evergreen/semi-evergreen, deciduous, plantation, and scrub forests (Jara et al., 2017). Field observations and GPS-referenced photographs were used to verify vegetation type, canopy cover, and spatial characteristics at selected locations, supporting the satellite-based LULC classification. (Photo 3) (Sarun and Nat, 2025).
4.1.5 Water body
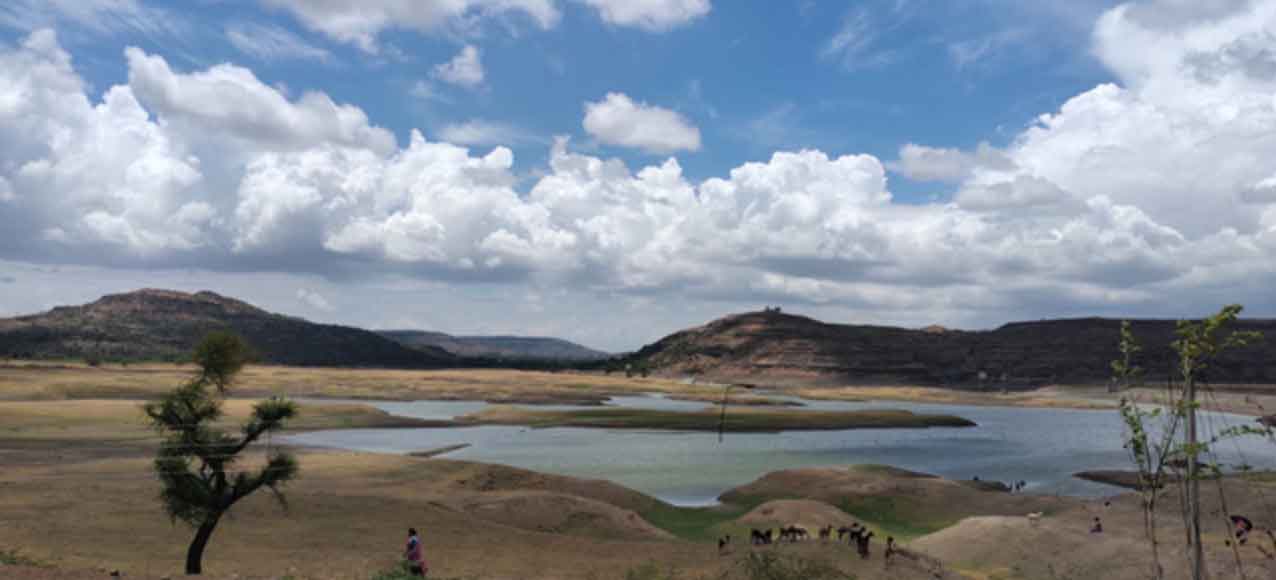
Water bodies include natural water features such as rivers and streams, which carry water through defined channels either continuously or seasonally (Singh et al., 2026). They also include ponds, lakes, tanks, and reservoirs (Ninawe et al., 2026). During the field survey, these water features were directly observed and verified, including the Bhojapur Dam and other water bodies, based on their presence, flow conditions, and spatial distribution (Photos 4 and 5) (Manandhar et al., 2024).
4.1.6 Barren Land
Barren land is characterized by little or no vegetation and generally poor soil fertility, limiting its suitability for agricultural activities (Naik et al., 2025). Barren land may include rocky terrain, sand dunes, exposed surfaces, and other sparsely vegetated areas (Singh and Sharma, 2025). Field verification was conducted using GPS-referenced observations and geotagged photographs at selected locations, based on vegetation cover, surface characteristics, and agricultural use (Photo 6).
4.2 Accuracy assessment
Accuracy is defined as the degree of proximity between the obtained results and the true values (Zhang et al., 2026). It serves as a measure of the quality of the information extracted from remotely sensed data. Accuracy assessment relied on visual interpretation of images supplemented by ground truth data gathered from fieldwork. The accuracy assessment of the classified images was conducted using the ERDAS Imagine application (Othow et al., 2017). For each of the identified images in 2025, the accuracy evaluation tool of the supervised classifier randomly generated 100 reference points using stratified random sampling. The error matrix and kappa statistics for all classified images were also generated using the ERDAS Imagine software (Foody, 2002). Due to the unavailability and unclear nature of Google Earth images, the accuracy assessment of the images from 1994 was not feasible. The classified image attained an overall classification accuracy of 89% for the year 2025 (Table 3). Subsequent sections present the individual producer’s accuracy and user’s accuracy values for all classes.
Table 3. Accuracy assessment for classified Landsat image (2025) of the Mula-Pravara basin
|
Class Name
|
Referenced Total
|
Classified Total
|
Number of correct
|
Producer’s Accuracy (%)
|
User’s Accuracy (%)
|
|
Barren Land
|
17
|
17
|
17
|
100
|
100
|
|
Cropland
|
45
|
48
|
42
|
93.33
|
87.50
|
|
Natural Vegetation
|
14
|
11
|
10
|
78.57
|
90.91
|
|
Roads and Settlement
|
8
|
8
|
6
|
100
|
75
|
|
Scrub Land
|
12
|
12
|
10
|
100
|
83.33
|
|
Water body
|
4
|
4
|
4
|
100
|
100
|
|
Total
|
100
|
100
|
89
|
|
|
|
Overall Classification Accuracy = 89%
|
4.2.1 User’s and Producer’s Accuracy
Another procedure derived from the error matrix includes the “error of omission” and the “error of commission” (Bhat et al., 2026). Omission error refers to the proportion of reference pixels belonging to a specific class that are incorrectly classified into other classes. Commission error refers to the proportion of pixels classified as a specific class that actually belong to other classes. Omission and commission errors are complementary to Producer’s Accuracy and User’s Accuracy, respectively, and can be calculated as 100 minus the corresponding accuracy value (Rwanga and Ndambuki, 2017).
4.2.2 Kappa statistics
Kappa statistics were produced to assess class accuracy within the broader context of classifier accuracy. According to the criteria outlined by Landis and Koch (1977), agreement is considered poor if Kappa is below 0.4, satisfactory if it falls between 0.4 and 0.7, and excellent if it exceeds 0.75. Table 4 shows the kappa statistics for the 2025 LULC classification.
Table 4. Overall Kappa Statistics for classified Landsat image of the Mula-Pravara basin
|
Class Name
|
Overall Kappa Statistics = 0.8959
|
|
Kappa Value (2025)
|
|
Barren Land
|
1.00
|
|
Cropland
|
0.9092
|
|
Natural Vegetation
|
0.8078
|
|
Roads and Settlement
|
0.8263
|
|
Scrub Land
|
0.8967
|
|
Water body
|
0.9356
|
For the year 2025, the overall Kappa statistics value is 0.8959. Remarkably, the water body category exhibits a kappa value of 1 for 2025, signifying an outstanding agreement. All other classes have kappa values exceeding 0.5, indicating good to excellent agreement.
Monitoring and managing natural resources and urban development rely on change detection, which provides a quantitative analysis of how the population and other environmental activities are distributed spatially (Huang et al., 2008).
4.3 LULC Change Detection and Dynamics
By comparing the classified LULC images from 1994 and 2025, the area of each category was determined in terms of both km² and percentage. Subsequently, to quantify the temporal changes in the area of each LULC category, the percentage increase or decrease for the respective category was calculated (Desalegn et al., 2014; Hailu et al., 2020). For this purpose, the percentage change in land use and land cover was determined using the following Equation (2), based on a comparison of the category-wise areas from 1994 and 2025.
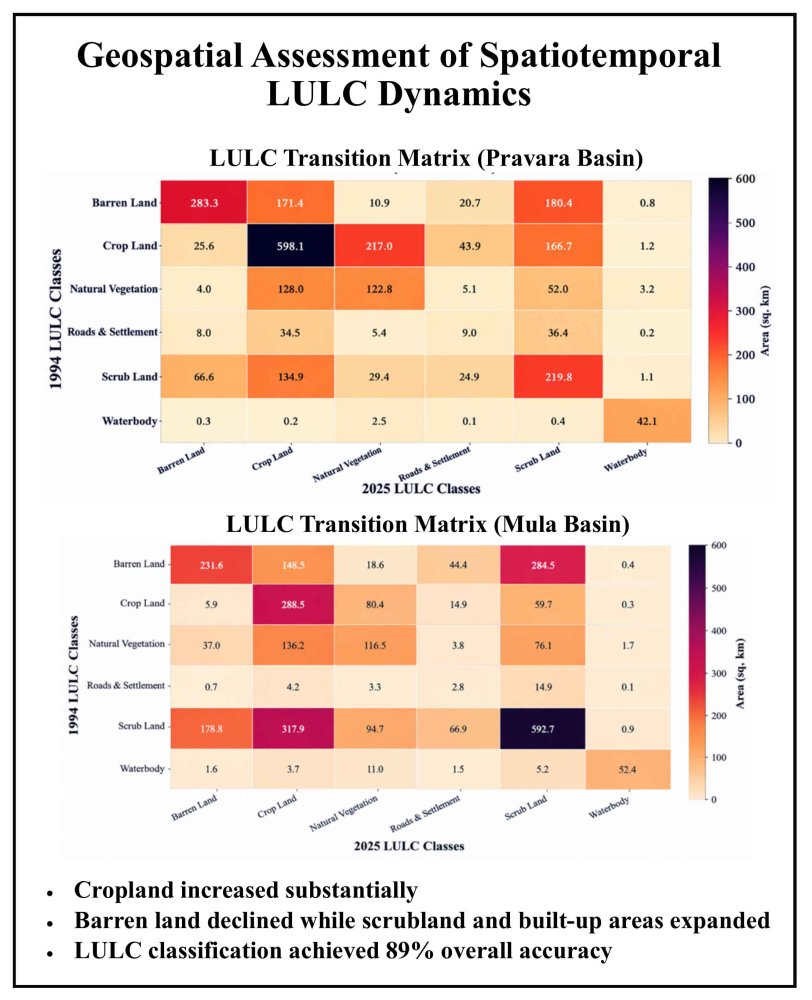
\(Percentage LULC change= {Area final year- Area initial year \over Area initial year} \times 100\) (2)
4.3.1 Pravara Basin
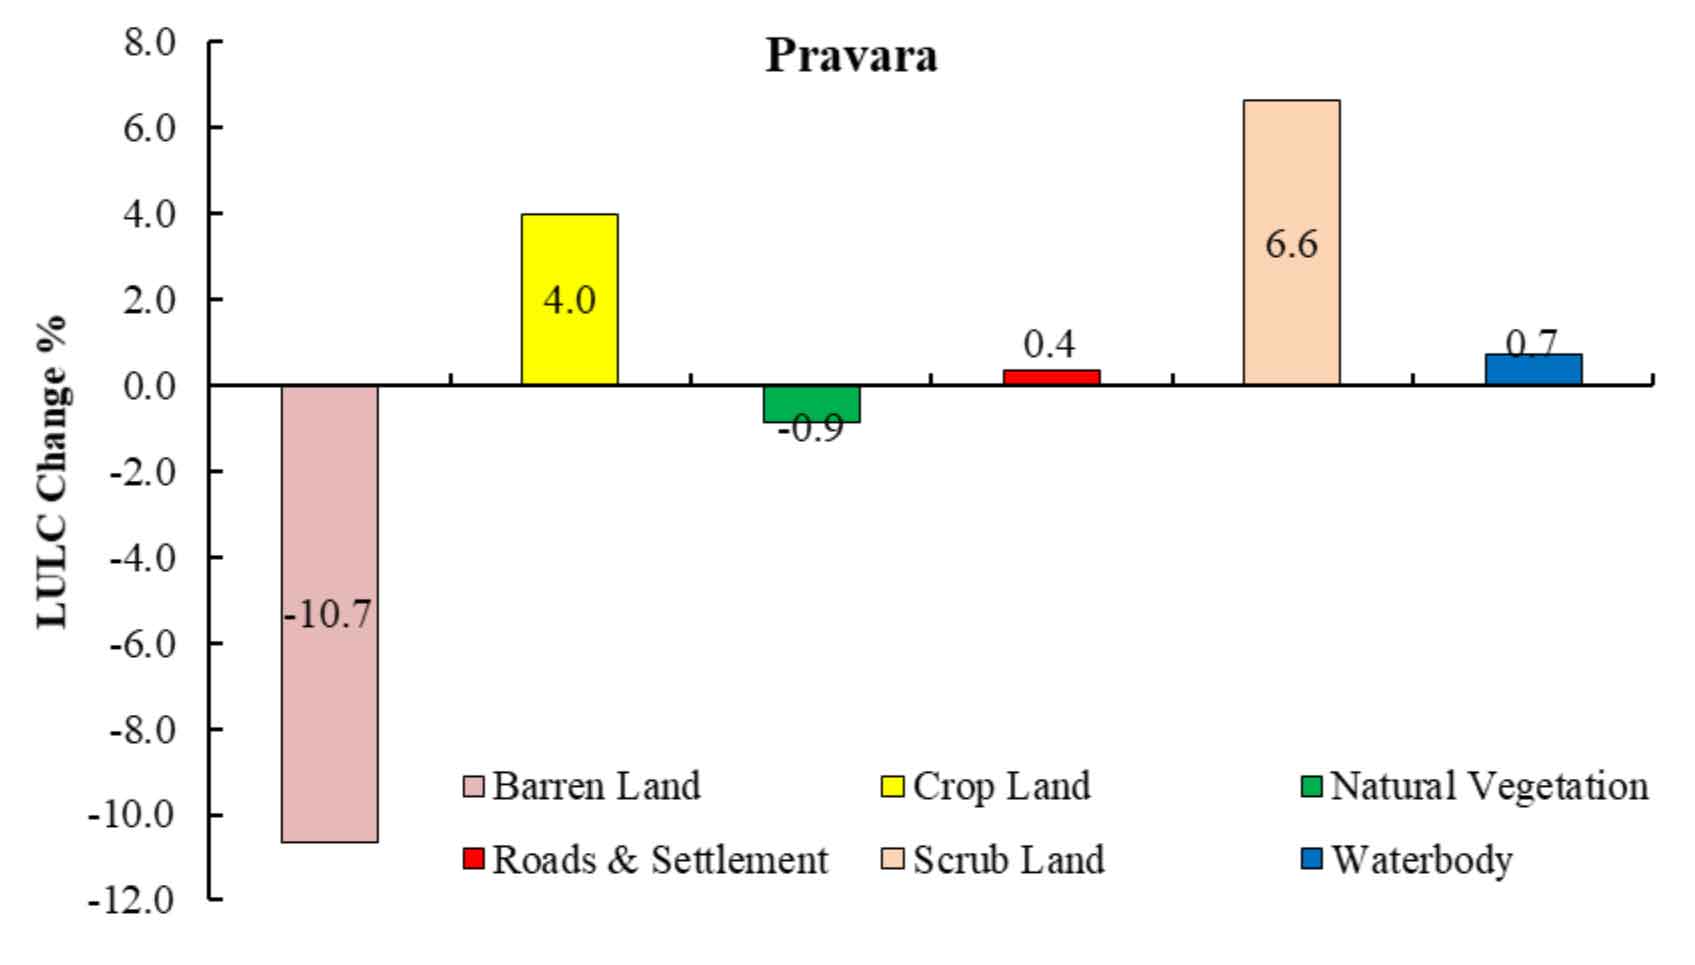
The LULC change analysis of the PRB reveals remarkable land cover transitions over time. Barren land has decreased by 10.7%, indicating conversion to more productive land uses, likely cropland (+4.0%) and scrub land (+6.6%) (Table 5, Figure 5). The increase in cropland suggests agricultural expansion, possibly driven by improved irrigation and farming practices. A minor fall in natural vegetation (-0.9%) implies limited deforestation, while the growth in scrub land may indicate land degradation. Built-up areas (roads and settlements) have increased slightly by 0.4%, reflecting limited urban expansion. Additionally, water bodies have expanded by 0.7%, possibly due to improved watershed management or seasonal water retention. Overall, the observed changes suggest a shift toward agricultural intensification, natural regeneration, and infrastructure expansion, with a potential impact on land sustainability and hydrological balance in the region.
Table 5. LULC (Pravara basin)
|
Class Name
|
2025
|
1994
|
Change (%)
|
|
Area (km2)
|
Area (%)
|
Area (km2)
|
Area (%)
|
|
Barren Land
|
387.0
|
14.6
|
670.6
|
25.3
|
-10.7
|
|
Cropland
|
1068.2
|
40.3
|
962.2
|
36.3
|
4.0
|
|
Natural Vegetation
|
387.0
|
14.6
|
410.9
|
15.5
|
-0.9
|
|
Roads and Settlement
|
103.4
|
3.9
|
95.4
|
3.6
|
0.4
|
|
Scrub Land
|
654.7
|
24.7
|
479.8
|
18.1
|
6.6
|
|
Water body
|
50.4
|
1.9
|
31.8
|
1.2
|
0.7
|
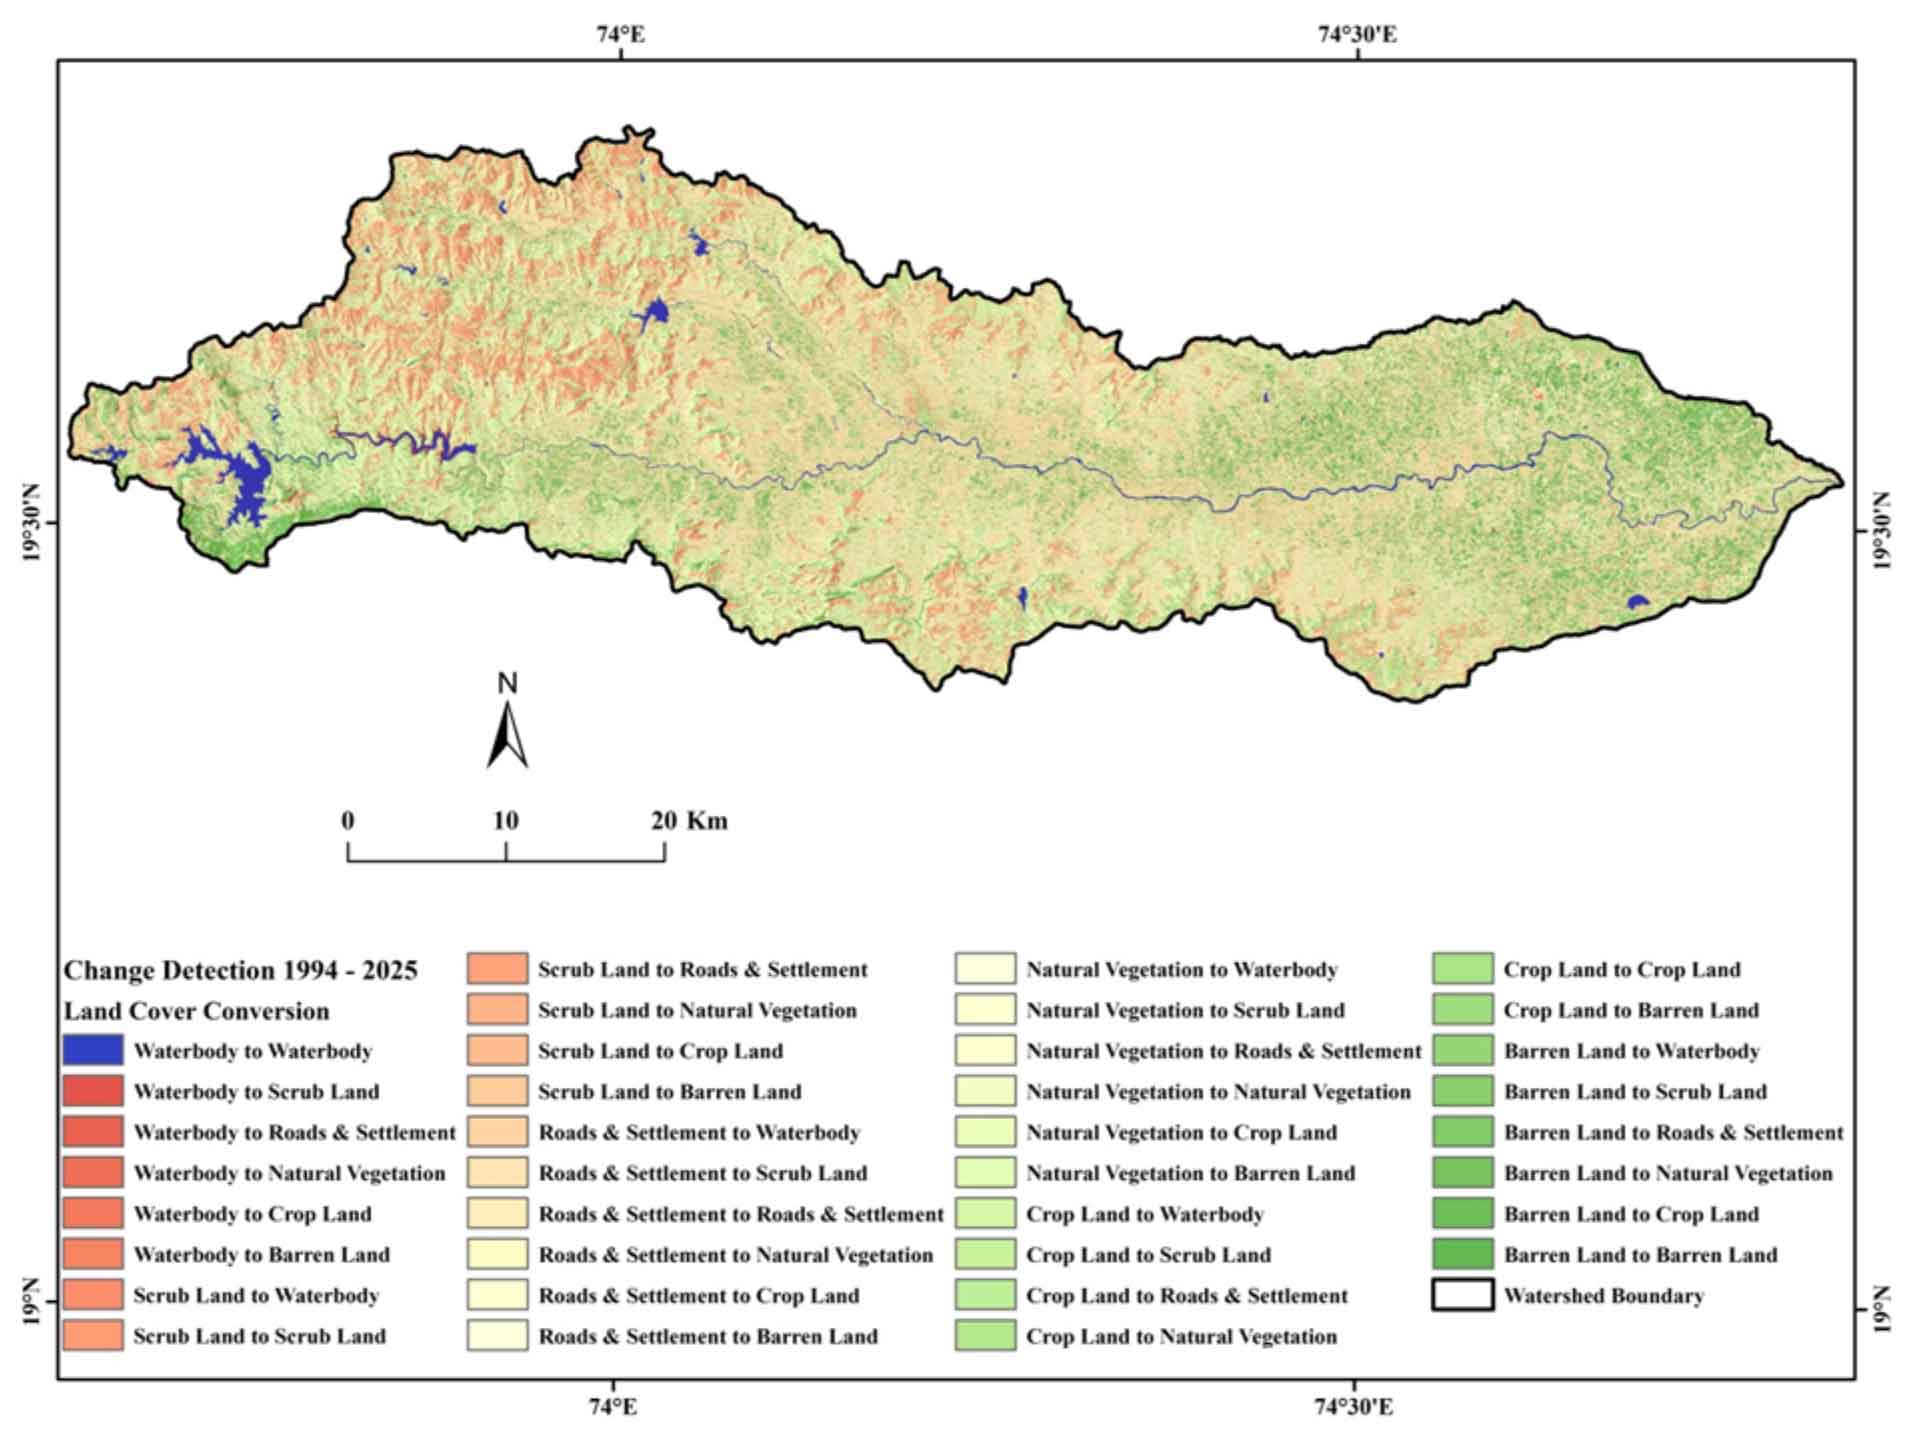
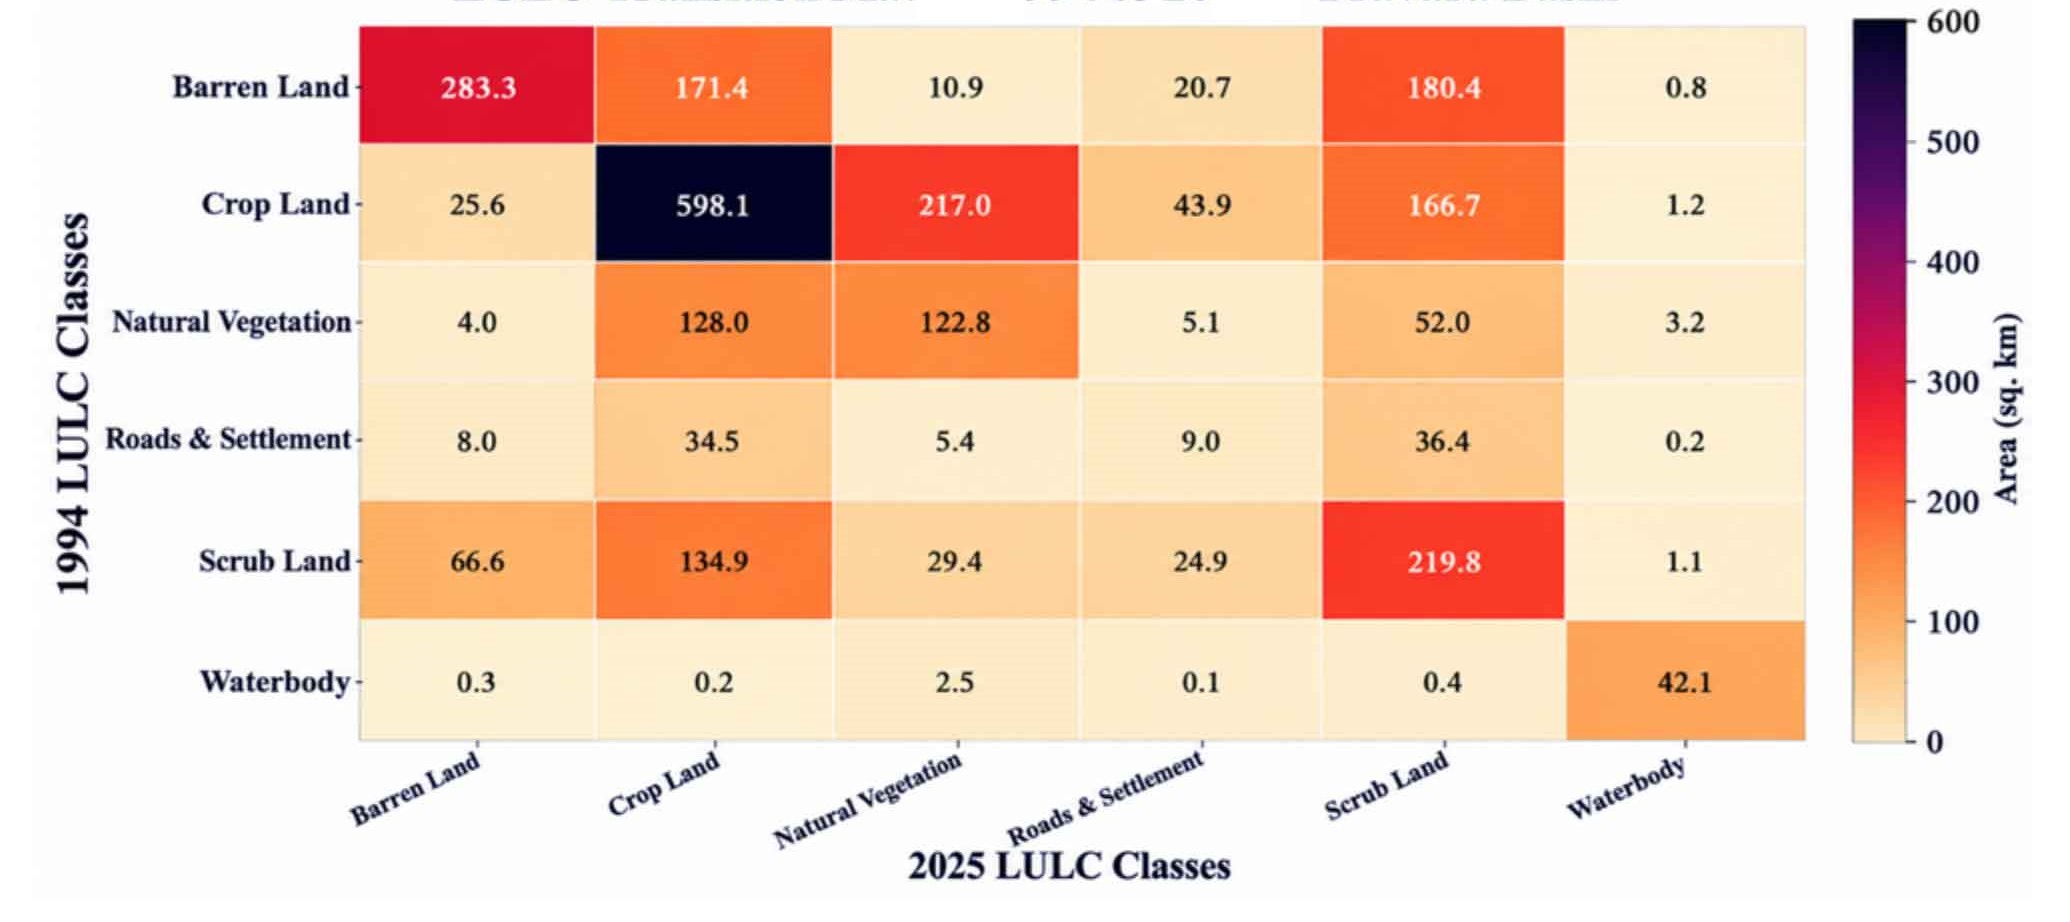
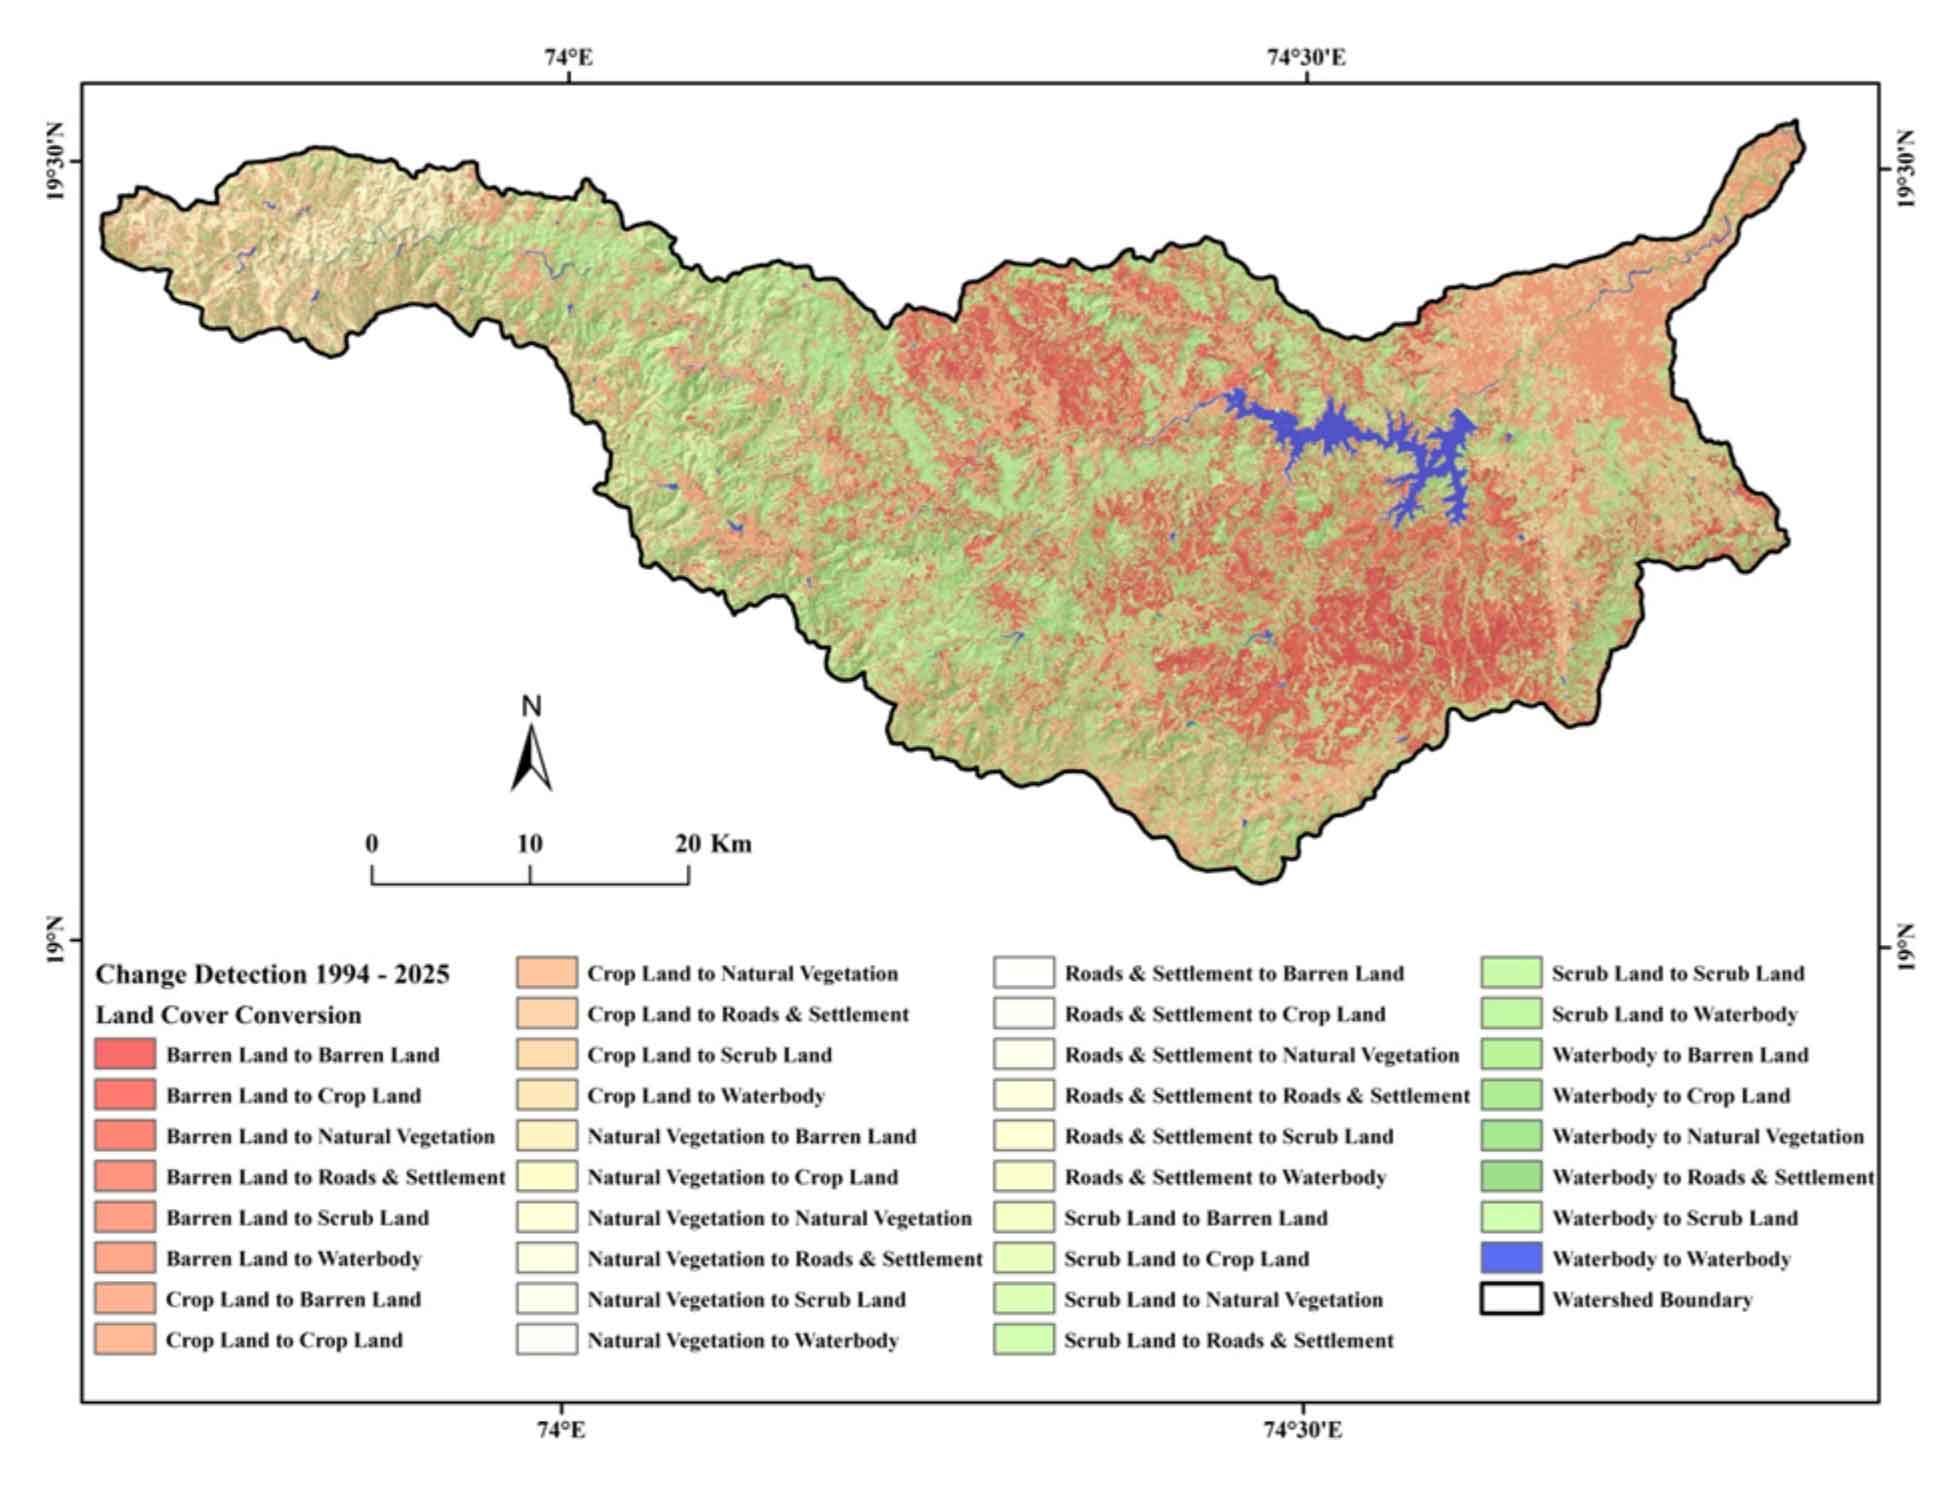
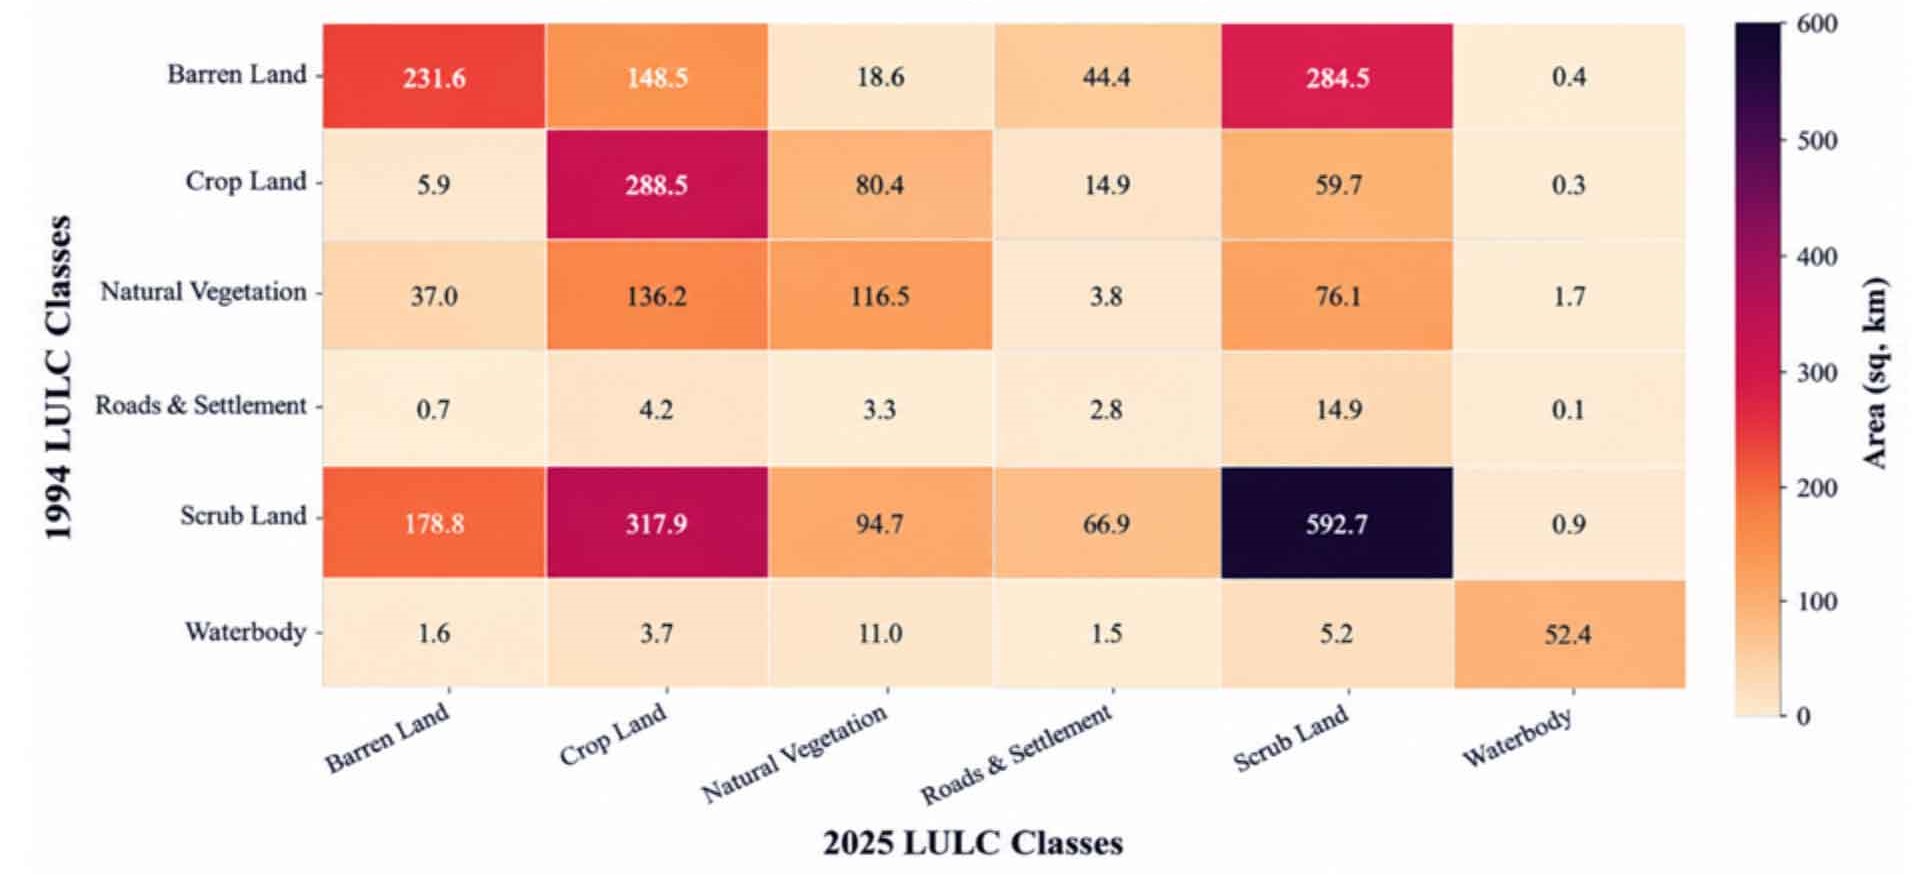
A transition matrix was prepared to quantify the changes in LULC classes between 1994 and 2025. The matrix records the area of each LULC class in 1994 that was subsequently classified into the same or a different LULC class in 2025. The rows represent the LULC classes of 1994, while the columns represent the corresponding LULC classes of 2025. The diagonal elements indicate areas that remained under the same LULC class, whereas the off-diagonal elements represent conversions from one LULC class to another. The transition matrix was generated using the classified LULC maps in GIS and was used to quantify the magnitude and direction of landscape transformation during the study period.
An analysis of LULC changes in the PRB between 1994 and 2025 reveals considerable transformations driven by human intervention and environmental factors. The barren land decreased by 41.9%, with its area dropping from 670.6 km2 to 387.0 km2 (Figure 6). This barren land was primarily converted into cropland (171.4 km2) and scrub land (180.4 km2). Key drivers behind this shift include the expansion of irrigation facilities, water conservation and watershed management measures, and agricultural expansion. Consequently, the cropland area saw a significant increase, rising from 962.2 km2 in 1994 to 1,067.1 km2 (40.3% increase) by 2025 (Figure 7). This highlights the expansion of agriculture and improved water resource availability within the river basin. Concurrently, changes have occurred in areas covered by natural vegetation and scrub land. Due to increasing urbanization, population growth, and infrastructure development, the area occupied by roads and settlements expanded by approximately 103.6 km2 (11%). Specifically, a conversion of cropland and scrub land into built-up areas is evident. However, the water surface area shows relatively minimal change. Overall, it is evident that agricultural expansion, irrigation, water conservation, watershed management, and increasing urbanization are the primary drivers of LULC changes in the PRB.
4.3.2 Mula Basin
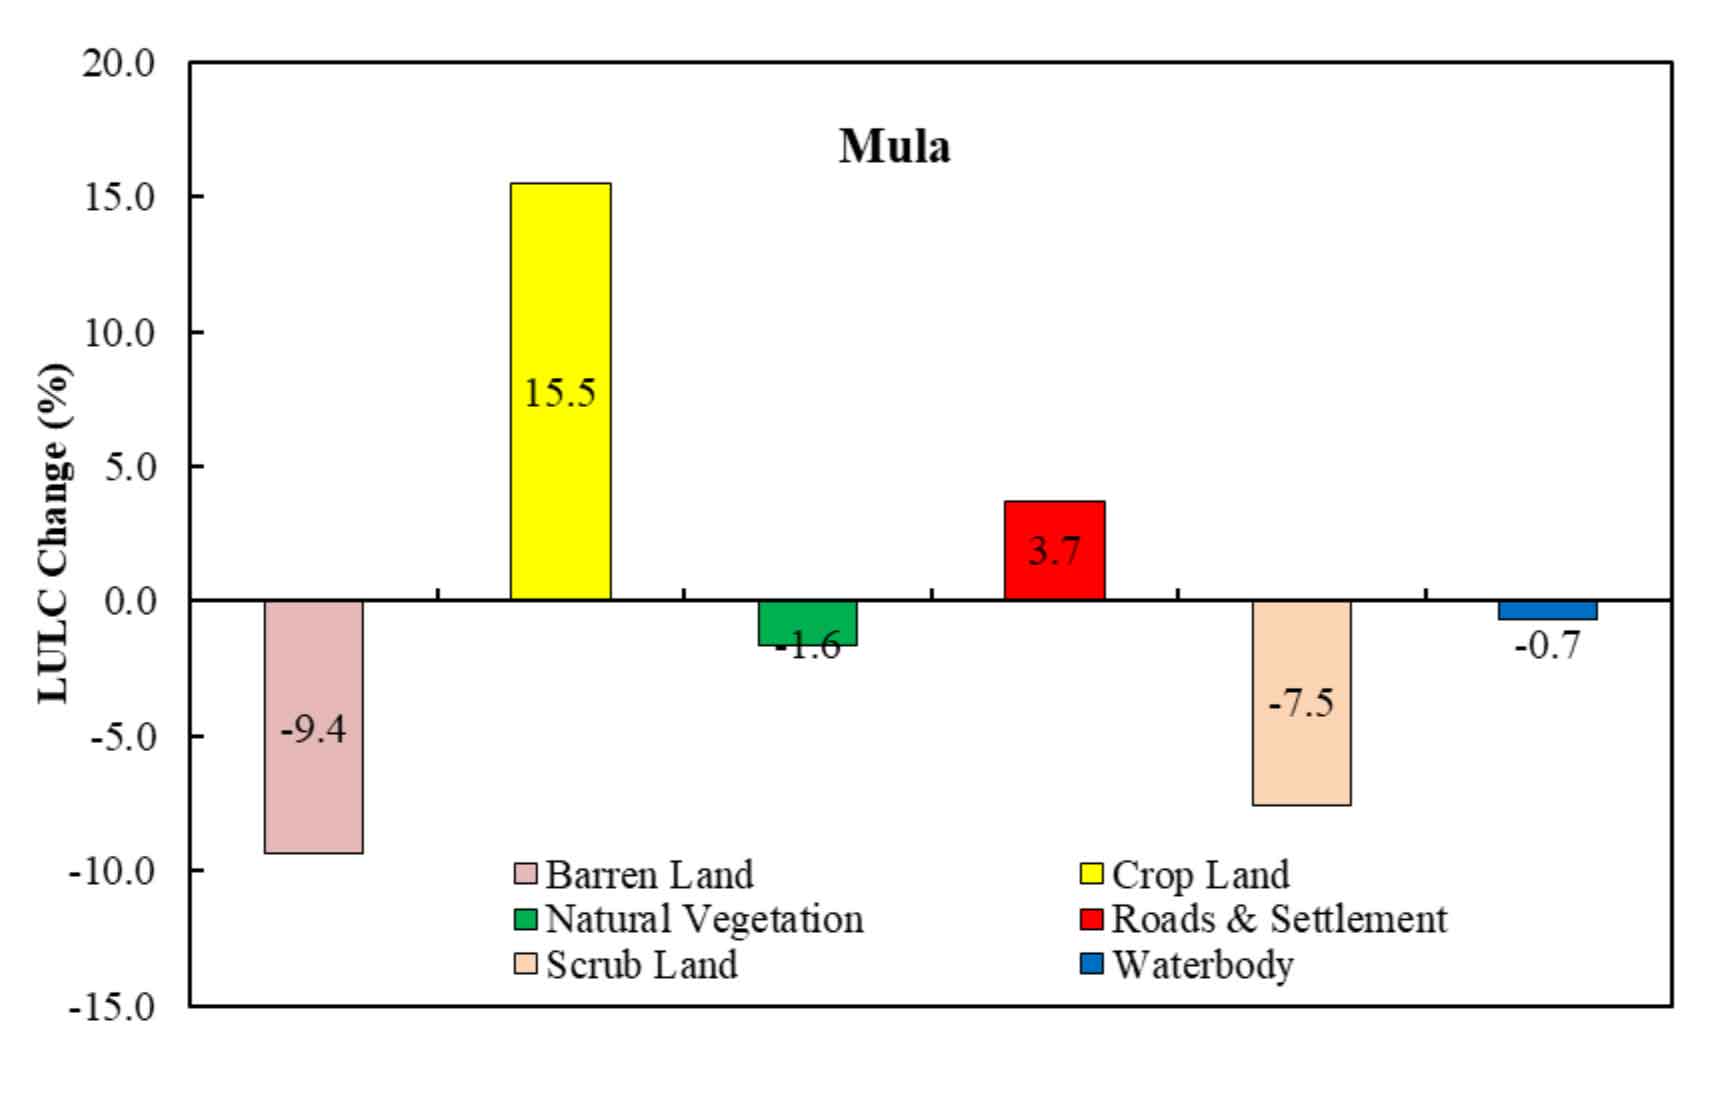
The LULC change analysis of the Mula River Basin (MRB) indicates significant land cover transitions, reflecting shifts in land utilization patterns. Table 6 and Figure 8 show a prominent decline in barren land (-9.4%) and scrub land (-7.5%), suggesting large-scale land conversion, primarily into cropland (+15.5%), indicating intensified agricultural expansion, likely driven by improved irrigation practices and increasing food demand. The increase in built-up areas (roads and settlements) by +3.7% signifies urban growth and infrastructure development, potentially influenced by population expansion and economic activities. A marginal decline in natural vegetation (-1.6%) suggests minimal deforestation, while the slight decrease in water bodies (-0.7%) may be attributed to seasonal hydrological variations. These LULC changes highlight a transition from fallow and degraded lands to more productive agricultural and urban landscapes, which may have implications for land productivity, ecological stability, and watershed hydrology in the MRB.
Table 6. LULC (Mula basin)
|
Class Name
|
2025
|
1994
|
Change (%)
|
|
Area (Km2)
|
Area (%)
|
Area (Km2)
|
Area (%)
|
|
Barren Land
|
456.0
|
15.7
|
728.1
|
25.1
|
-9.4
|
|
Cropland
|
899.2
|
31.0
|
449.6
|
15.5
|
15.5
|
|
Natural Vegetation
|
324.6
|
11.2
|
371.3
|
12.8
|
-1.6
|
|
Roads and Settlement
|
134.4
|
4.6
|
26.1
|
0.9
|
3.7
|
|
Scrub Land
|
1033.4
|
35.6
|
1250.2
|
43.1
|
-7.5
|
|
Water body
|
55.7
|
1.9
|
75.4
|
2.6
|
-0.7
|
Anthropogenic activities and intensive agricultural practices have led to significant changes in LULC within the MRB between 1994 and 2025. A major shift observed is the expansion of agricultural land, with the area increasing from 449.6 km2 to 899.2 km2 (Figure 9).
Against the backdrop of this agricultural expansion, barren land decreased by 37.4%, dropping from 728.1 km2 to 456.0 km2. Furthermore, rapid infrastructure development and urbanization have resulted in a substantial increase in the area covered by roads and settlements, rising from 26.1 km2 to 134.4 km2.
The impact of human and economic development is also evident in the natural ecosystem. The area under natural vegetation declined from 371.3 km2 to approximately 324 km2, while scrub land saw a reduction of 17.5%. Similarly, a decline of approximately 26% was recorded in the area covered by surface water bodies (Figure 10).
Overall, the LULC changes in the MRB highlight the mounting pressure that agricultural expansion, urbanization, and infrastructure development exert on the natural ecosystem. This situation highlights the importance of sustainable land and water resource management alongside socio-economic progress.




 ,
Sanjay Navale 1