

Journal of Geographical Studies Volume 5 (2021), Issue 1 · pp. 1-10
Original Research Paper Open Access

Correlating Spatial Pattern of Canopy Greenness Derived from the NDVI with Hydrological Characteristics of Small Island Watersheds

- Department of Forestry, Faculty of Agriculture, University of Pattimura, Jl. Ir. M. Putuhena Kampus Universitas Pattimura, Poka, Ambon, Indonesia.
* Corresponding author: Bokiraiya Latuamury, bokiraiya.latuamury@faperta.unpatti.ac.id
Contents
- Highlights
- Abstract
- 1. Introduction
- 2. Data And Methods
- 3. Results And Discussions
- 4. Conclusions
- 5. Funding Agency
- Conflict of interest
- Acknowledgements
- Abbreviations
- Article information
- References
-
- Table 1. The morphometric characteristics of the observed watersheds
- Table 2. Classification of canopy greenness based on NDVI
- Table 3. Morphometric parameters and hydrological characteristics of …
- Table 4. Recursive digital filter in the BFI+3.0 module
- Table 5. Classification of canopy greenness derived from NDVI in 2015
- Table 6. Canopy greenness levels derived from NDVI in 2019
- Table 7. Morphometric characteristics of small island watersheds in A…
- Table 8. Characteristics of average monthly discharge, base flow, and…
- Table 9. The regression model correlating the spatial pattern of cano…
Highlights
- The spatial pattern of canopy greenness tends to experience significant changes in the estuary or river mouth, and in 2019, the densely populated settlements in the coastal stretch had also sprawled into the adjacent mountainous area.
- Visualization of hydrological characteristics that shows a fluctuating trend during the study period (2015-2019).
- Variations in the spatial pattern of canopy greenness have a positive relationship with the hydrological characteristics of small island watersheds.
- Land and water resources management and planning in small islands need to incorporate mitigation and adaptation to any changes in the watershed ecosystems.
Abstract
Watershed ecosystem monitoring and evaluation indicators need to factor in land cover/use change rationally and adaptively. Vegetation canopy greenness can be utilized to seek an accurate solution to various land cover/use change issues, for example, by applying the Normalized Difference Vegetation Index (NDVI) algorithm. This research set out to analyze the relationship between the spatial pattern of canopy greenness and small island watersheds’ hydrological characteristics. It used NDVI algorithm extraction and BFLOW+ 3.0 filter in the HydroOffice 12.0 program and then examined the two resulting datasets using correlation analysis. The results showed that the spatial pattern of canopy greenness derived from NDVI changed significantly near the river mouth. The densely populated settlements in the coastal stretch continued to sprawl towards mountainous regions, which naturally function as recharge zones. Meanwhile, the hydrological characteristics displayed a fluctuating trend during the observation period (2015-2019). Based on the correlation analysis, canopy greenness patterns and hydrological features form a positive and relatively strong relationship (38.8%). For this reason, ecological shifts in small island watersheds require climate change mitigation and adaptation measures.
Keywords spatial patternNDVIIsland Watershedhydrological characteristicsGreennessCanopy
1. Introduction
A watershed is a natural system where hydrological-biophysical processes and socio-economic and cultural activities occur (Latuamury et al., 2020). Hydrological-biophysical methods are realistic activities that compose a hydrological cycle (Latuamury and Talaohu, 2020). Socio-economic and cultural activities are human interventions in the natural system (Arnanto, 2015; Wardiningsih and Salam, 2019). These two watershed components are inseparable, given that the demand for water, soil, and forest resources has been persistently increasing as a result of population growth and impacting the hydrological system (Eryani, 2014; Junaidi and Tarigan, 2011). Among the significant causes of disruptions to the watershed ecosystem is the intensity of uncontrolled land-use shift that has worsened the hydrological state, flow regime (especially peak discharge), inter-seasonal discharge fluctuation, and surface runoff coefficient and ultimately led to floods and droughts.
In a watershed, hydrological responses serve as indicators of damage and the basis for monitoring and evaluating the effects of land cover/use change on flow characteristics (Fuady and Azizah, 2013; Paimin et al., 2012). Normalized Difference Vegetation Index (NDVI) is an approach to mitigate the rate of such conversion as it can monitor the degree of canopy greenness or vegetation density over time by analyzing digital brightness levels, which depend on the waves received by digital recording devices of Sentinel (Candiago et al., 2015; Sobrino et al., 2008). Healthy vegetation absorbs more visible (infrared) light waves and reflects substantial amounts of near-infrared light waves.
The use of remote sensing technology in varying satellites and sensors to produce NDVI has increased in many studies in natural resources and the environment. The advancement of remote sensing technology and geographic information systems has been used to implement NDVI in these fields over the last decades. For instance, Gu et al. (2008) used MODIS imagery for NDVI and NDWI evaluation to monitor vegetation drought. Escuin et al. (2008) utilized NDVI processed from Landsat ETM imagery to assess the severity of fire based on pre-and post-fire conditions. Latuamury and Gunawan (2013) have developed NDVI to analyze the relationship between vegetation density and river base flow recession characteristics, Mekliche et al. (2015) utilized it to analyze wheat grain production under two different irrigation conditions, and Gandhi et al. (2015) used it for the distribution of humanitarian assistance and natural disaster prediction and assessment. Wilson and Norman (2018) combined NDVI with NDII as part of land and watershed restoration efforts, and Pravita (2019) compared several NDVI transformation algorithms to analyze mangrove area density.
The development of NDVI using Sentinel imagery to understand the hydrological characteristics of small island ecosystems, such as Ambon City in Maluku Province, is under-researched. Simultaneously, spatial databases’ availability is vital in planning for regional development as well as land and water resources management. Therefore, this study was intended to analyze the transformation algorithm of canopy greenness using NDVI and its relation to hydrological characteristics in five small island watersheds in Ambon City, Maluku Province.
2. Data And Methods
2.1 Study Area
Ambon city consists of many watersheds, five of which were selected for this research because of their unique spatial dynamics, namely land-cover/use conversion of the riverbank area that has implications for ecological sustainability. The morphometric characteristics of these watersheds and the locations of stream gauge stations are presented in table 1.
Table 1. The morphometric characteristics of the observed watersheds
|
Watersheds |
Stream gauge station coordinates |
Watershed length (km) |
Watershed width (km) |
Circumference (km) |
|
|
X |
Y |
||||
|
Wae Batu Merah |
412023 |
9592046.6 |
4.69 |
2.65 |
23.12 |
|
Wae Ruhu |
414316,7 |
9592304,7 |
6.46 |
3.29 |
47.96 |
|
Wae Batu Gajah |
410838,4 |
9589732,2 |
5.22 |
2.25 |
18.49 |
|
Wae Batu Gantung |
409226,4 |
9588543,2 |
4.92 |
4.24 |
25.32 |
|
Wae Tomu |
411234,2 |
9590862,9 |
5.10 |
1.55 |
12.90 |
Source: Indonesia Topographic Map (RBI), BPDAS-HL of Maluku Province
2.2 Research Procedure
2.2.1Normalized Difference Vegetation Index
Normalized Difference Vegetation Index (NDVI) is a simple numerical indicator used to analyze remote sensing-based measurements and assess vegetation and non-vegetation objects (Latuamury and Gunawan, 2013). It compares the reflections of red (R) and near-infrared (NIR) electromagnetic spectra. Both spectra were selected because they have a more in-depth ability to absorb chlorophyll and thereby reflect vegetation density; also, the near-infrared and red channels can clearly distinguish between vegetation and non-vegetation objects. In this context, NDVI can be quantified using two mathematical formulations (Chuvieco et al., 2005; Sobrino et al., 2008). Equation (1) was used to calculate NDVI using Sentinel image data processing in the ArcGIS program.
\(NDVI = {NIR - R \over NIR + R}\) (1)
NDVI produced with equation (1), however, needs radiometric correction, while equation (2) below offers NDVI calculation without having to perform radiometric correction:
(NPimd-NPimd_min) - (NPm – NPm_min)
NDVI =----------------------------------------------------- (2)
(NPimd-NPimd_min) + (NPm – NPm_min)
where,
NPimd = pixel values of near-infrared
NPm = pixel values of red
NPimd_min = minimum pixel values of near-infrared
NPm_min = minimum pixel values of red
NDVI calculations always result in a number ranging from -1 to +1. NDVI < 0 indicates water objects (i.e., swamps, lakes, and other depression reservoirs), NDVI=0 reflects built-up areas, such as houses and buildings NDVI=1 shows vegetation objects. Canopy greenness can be differentiated into five classes from the lowest to the highest NDVI values, as presented in table 2.
Table 2. Classification of canopy greenness based on NDVI
|
Ranges |
Criteria |
|
-0.0885 - 0.1186 |
Very low canopy greenness |
|
0.1186 - 0.3257 |
Low canopy greenness |
|
0.3257 - 0.5328 |
Medium canopy greenness |
|
0.5328 - 0.7399 |
High canopy greenness |
2.2.2 Hydrological Characteristics
Watershed characteristics contain specific descriptions of parameters related to morphometric, hydrological, and geological conditions, topography, soil, vegetation and land use, and human occupations (Ekawati et al., 2005; Harjadi and Paimin, 2013). Therefore, a particular method or procedure needs to be formulated as a basis for characterizing a sub-watershed as a whole (Paimin and Pramono, 2009). Watershed develops widely varying characteristics as the product of interactions between many factors that can also consist of several integrated sub-factors. Moreover, they cannot be generalized since every watershed has its unique character and facilitates different interactions between its constituent ecosystems (Paimin et al., 2012).
Morphometric characteristics observed in this study included watershed area (km2), the total length of river network (km), main stream gradient (the difference between the highest and lowest elevations per horizontal distance; km), the elevation of the middle point ( m), length of the main stream (km), Circularity Ratio (Rc), Bifurcation Ratio (Rb), form factor, drainage pattern, and landform. These physical characteristics are described in table 3.
Table 3. Morphometric parameters and hydrological characteristics of small island watersheds
|
No. |
Variables |
Assumptions in flood susceptibility |
Equations/ Methods |
Criteria |
Classificat-ions |
|
1 |
Drainage density (Dd) (Seyhan, 1977) |
Low Dd:
High Dd:
|
Dd = (∑L) / A Dd: drainage density (km/ km2) L: total stream length (km) A: watershed area (km2) |
|
Dd < 1 1 < Dd < 5 Dd > 5 |
|
2 |
Bifurcation Ratio (Rb) (Horton, 1932) |
High Rb: (> / <) or < 1
Low Rb (< / >) or > 1
|
Rb = N / (Nu +1) Rb: Specified order of stream segments N: number of streams in first order Nu + 1: number of streams in the next higher-order (u+1) |
|
Rb < 0.3 0.3 < Rb < 0.5 Rb > 0.5 |
|
3 |
Circularity Ratio (Rc) (Horton, 1932) in Seyhan, (1977) |
A semi-fully circular watershed produces high peak discharge, with short time to peak, Tc < watershed length |
Rc = 12,56 A / l Rc: watershed form A: watershed area l: watershed circumference |
|
Rc > 0.67 0.34 < Rc < 0.66 Rc < 0.33 |
|
4 |
Flow Discharge Characteristics |
Larger peak discharge (Q) means higher flood susceptibility |
Q = Qpeak / watershed area Q = discharge per unit of area (m3/s/km2) Qmax: mean flow discharge (m3/det) A: watershed area (km2) |
|
< 0.875 0.875 – 1 > 1 |
Hydrological characteristics of small island watersheds were processed in the HydroOffice 12.0 program using the BFI+ 3.0 module, specifically Recursive Digital Filter (RDF) and the filtering algorithm proposed by Lyne & Hollick 1979 (Nathan and McMohan, 1990), as summarized in table 4.
Table 4. Recursive digital filter in the BFI+3.0 module
|
Filter methods |
Mathematical equation |
Notes |
|
Lyne and Hollick’s algorithm |
\(q_{f(i)} = aq_{f(i-1)}+(q_i-q_{i-1}){1+ \alpha \over 2a}\) |
\(q_{f(i)}\) ≥ 0, where α= 0.925 is recommended for stream data filter and applied to three base flow phases, qb = q – qf. |
Source: BFI+3.0 module of the HydroOffice 12.0 program (Gregor, 2010)
3. Results And Discussions
3.1 Canopy Greenness using NDVI Algorithm for 2015 and 2019 Images
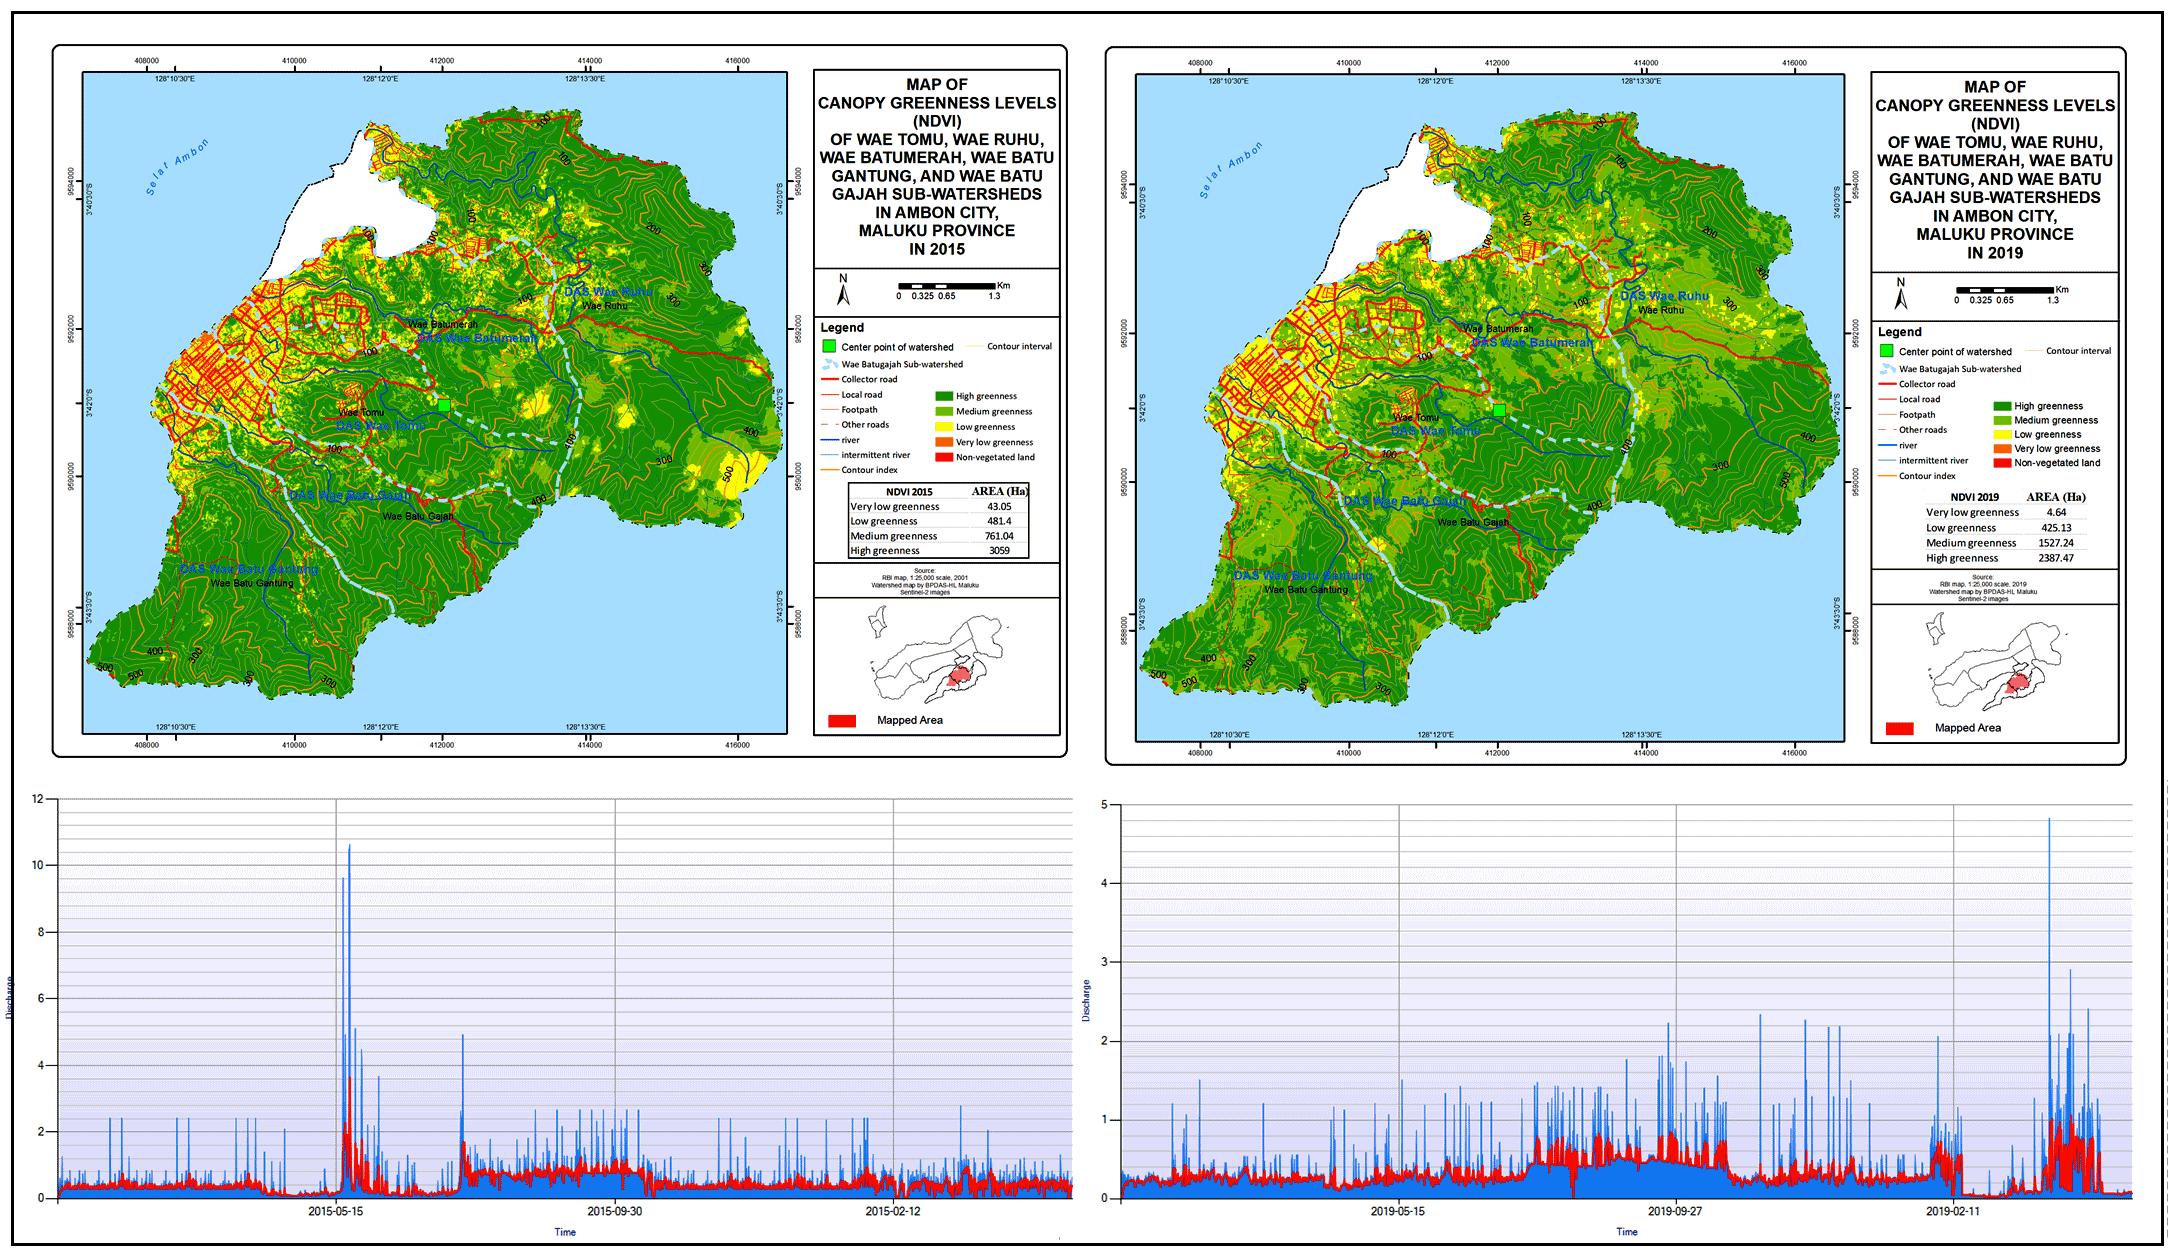
The analysis of two Sentinel images recorded in 2015 and 2019 produced details on canopy greenness variation. In 2015, the image showed that the four classes of NDVI in the five selected watersheds had a relatively uniform trend of variation and area of coverage. Wae Ruhu, Wae Batu Gajah, and Wae Batu Gantung Watersheds had a high canopy greenness level, followed by Wae Batu Merah and Wae Tomu. The first three watersheds also had the most extensive area for the medium, low, and very low canopy greenness levels. Overall, high and medium NDVI values dominated the canopy greenness of the watersheds observed in 2015, as summarized in table 4 and figure 1.
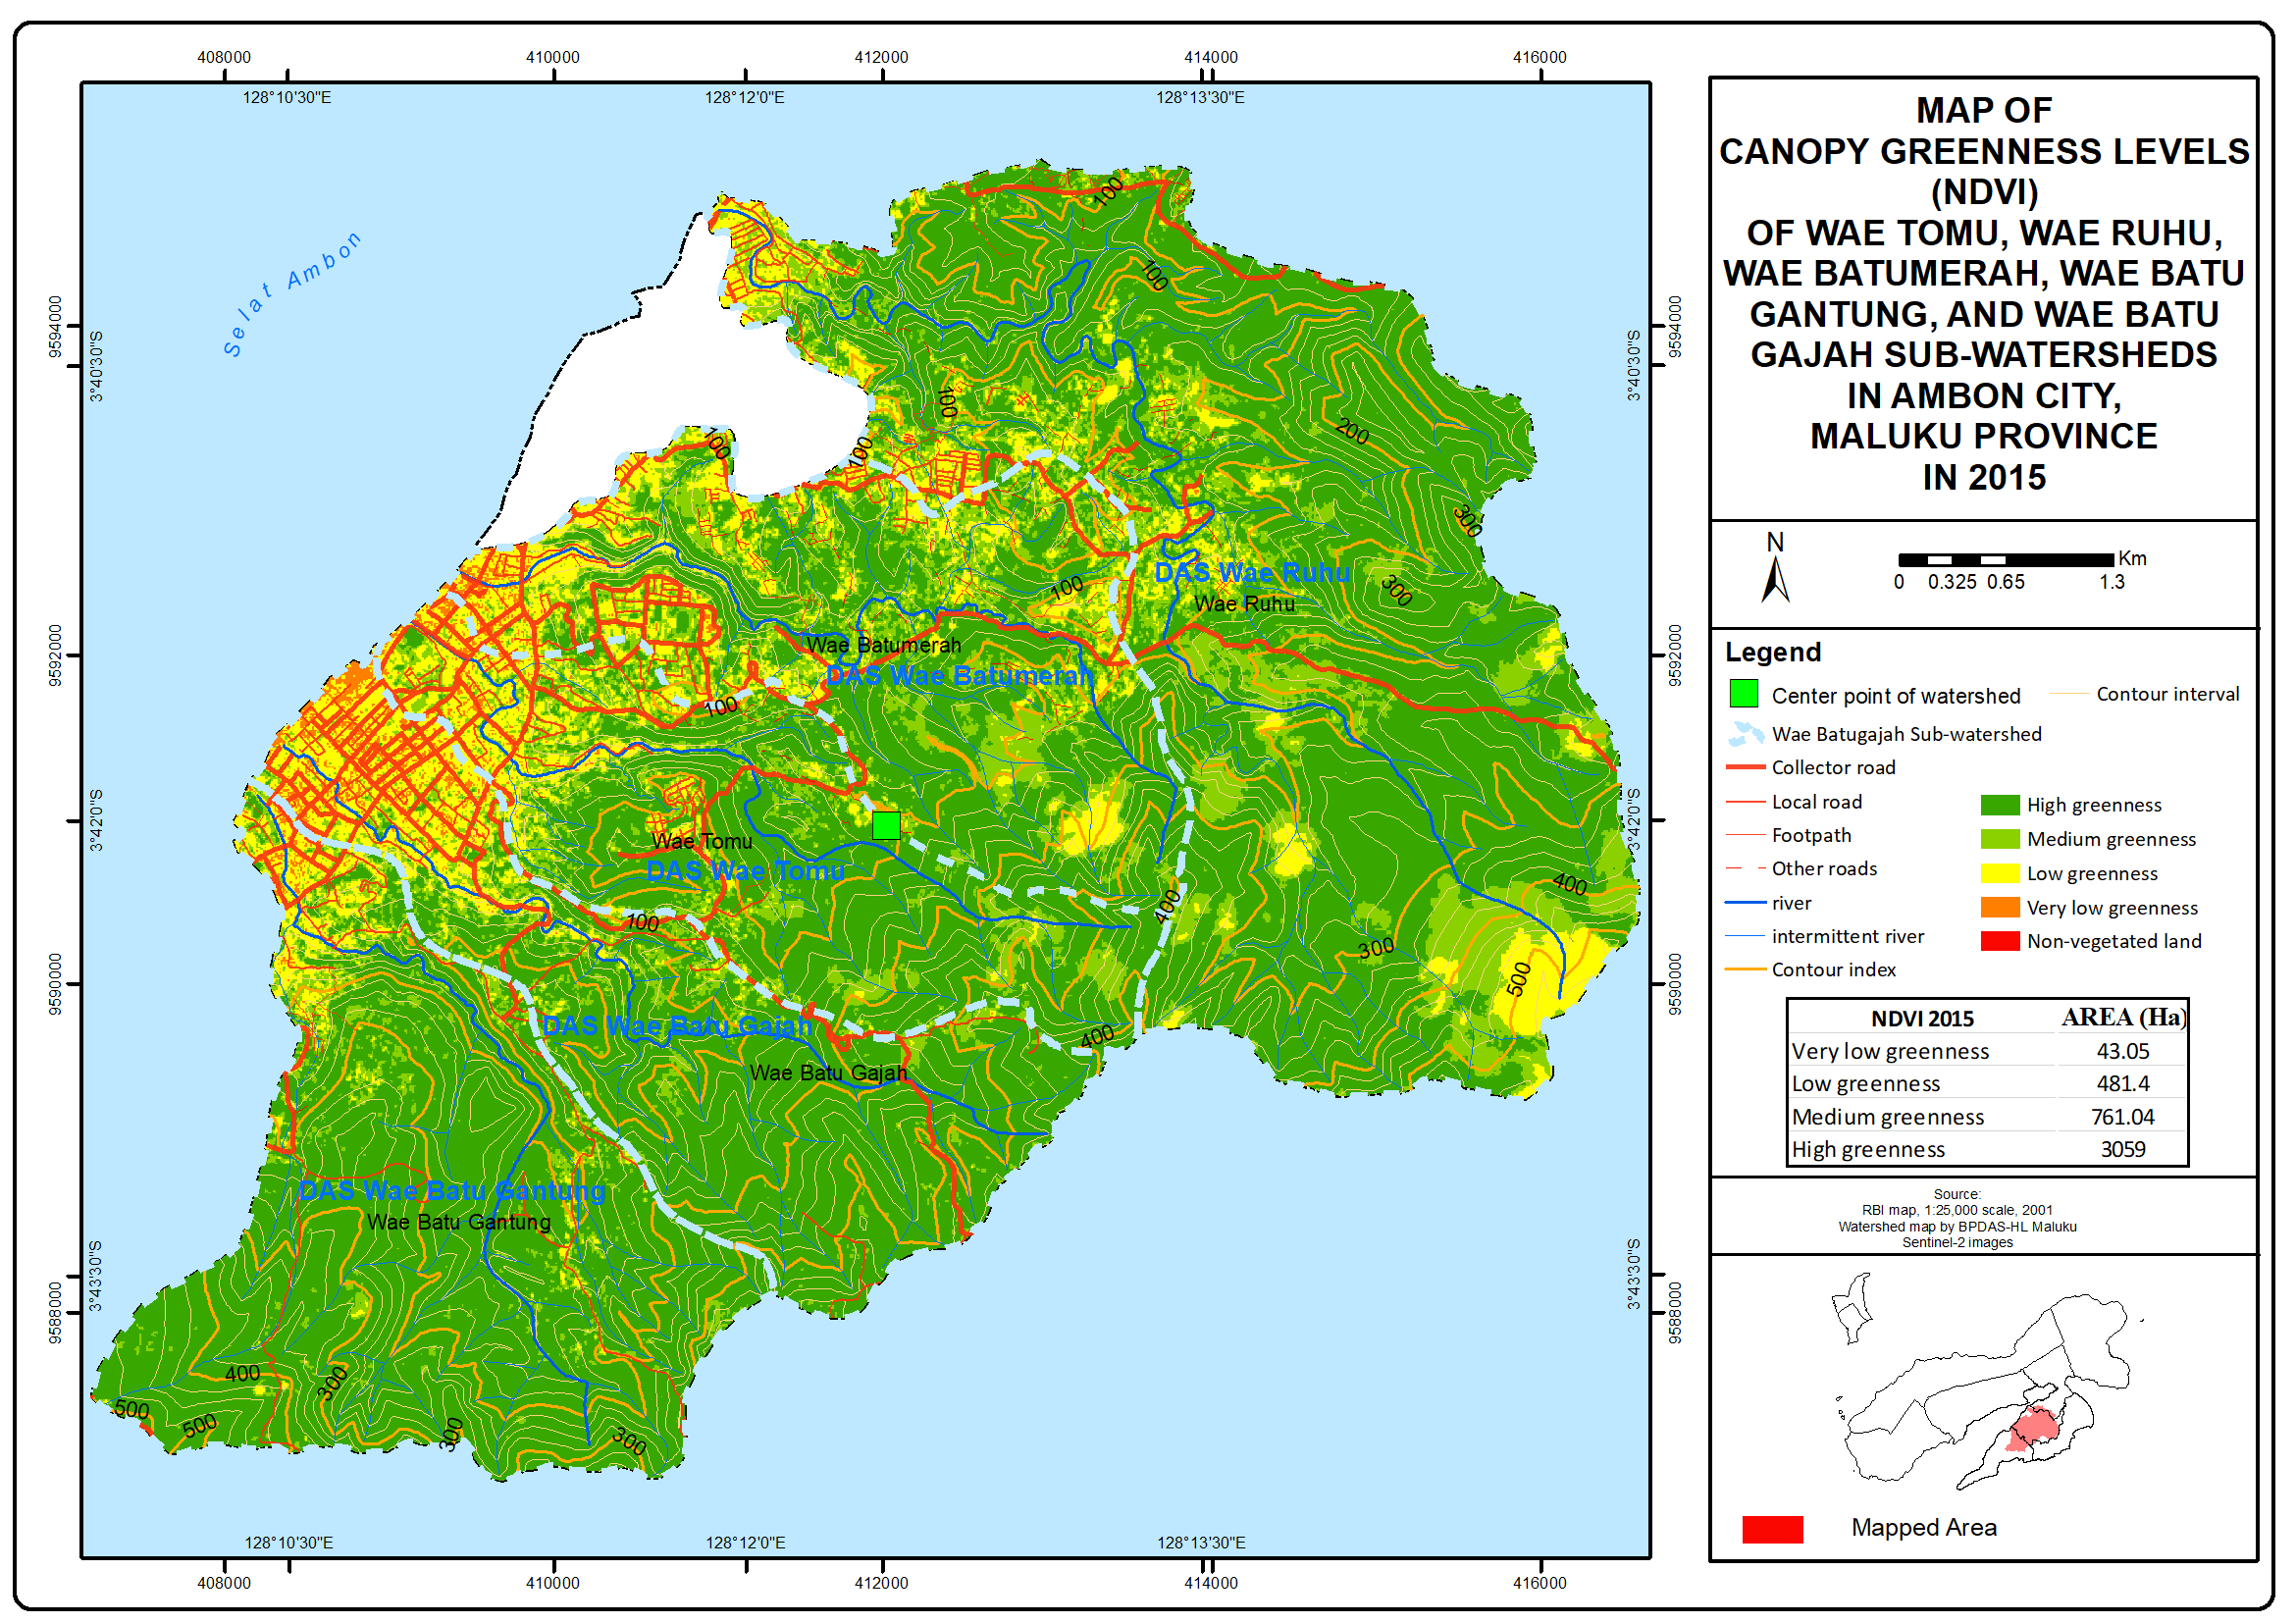
In 2015, the spatial pattern revealed that the high greenness class still dominated areas with steep topography. Meanwhile, non-vegetation objects, such as settlements and other types of buildings, tended to form a cluster along the coastal area, which is the center of government and economic activities in Ambon City (capital of Maluku Province). Figure 1 shows that the spatial pattern in 2015 was composed of physical development concentrated in coastal areas i.e, the river mouths of five watersheds observed.
Like the 2015 pattern, the four classes of NDVI values in 2019 had a relatively uniform trend of variation and coverage area. However, the 2019 data showed a decreasing trend in the area of coverage in all researched watersheds. Nevertheless, Wae Ruhu, Wae Batu Gajah, and Wae Batu Gantung still had a generally high canopy greenness, followed by Wae Batu Merah and Wae Tomu. The first three watersheds also had the most extensive area for the medium, low, and very low canopy greenness levels. Overall, high and medium canopy greenness levels were dominant in the watersheds observed in 2019, as presented in table 5 and figure 2.
Table 5. Classification of canopy greenness derived from NDVI in 2015
|
Canopy Greenness Levels |
Wae Batu Merah (%) |
Wae Ruhu (%) |
Wae Batu Gajah (%) |
Wae Gantung (%) |
Wae Tomu (%) |
|
Very low |
1.42 |
0.14 |
1.84 |
0.51 |
1.37 |
|
Low |
17.48 |
9.22 |
9.72 |
9.51 |
10.99 |
|
Medium |
16.33 |
21.98 |
15.62 |
13.96 |
18.77 |
|
High |
64.77 |
68.66 |
72.81 |
76.01 |
68.87 |
|
Total |
100 |
100 |
100 |
100 |
100 |
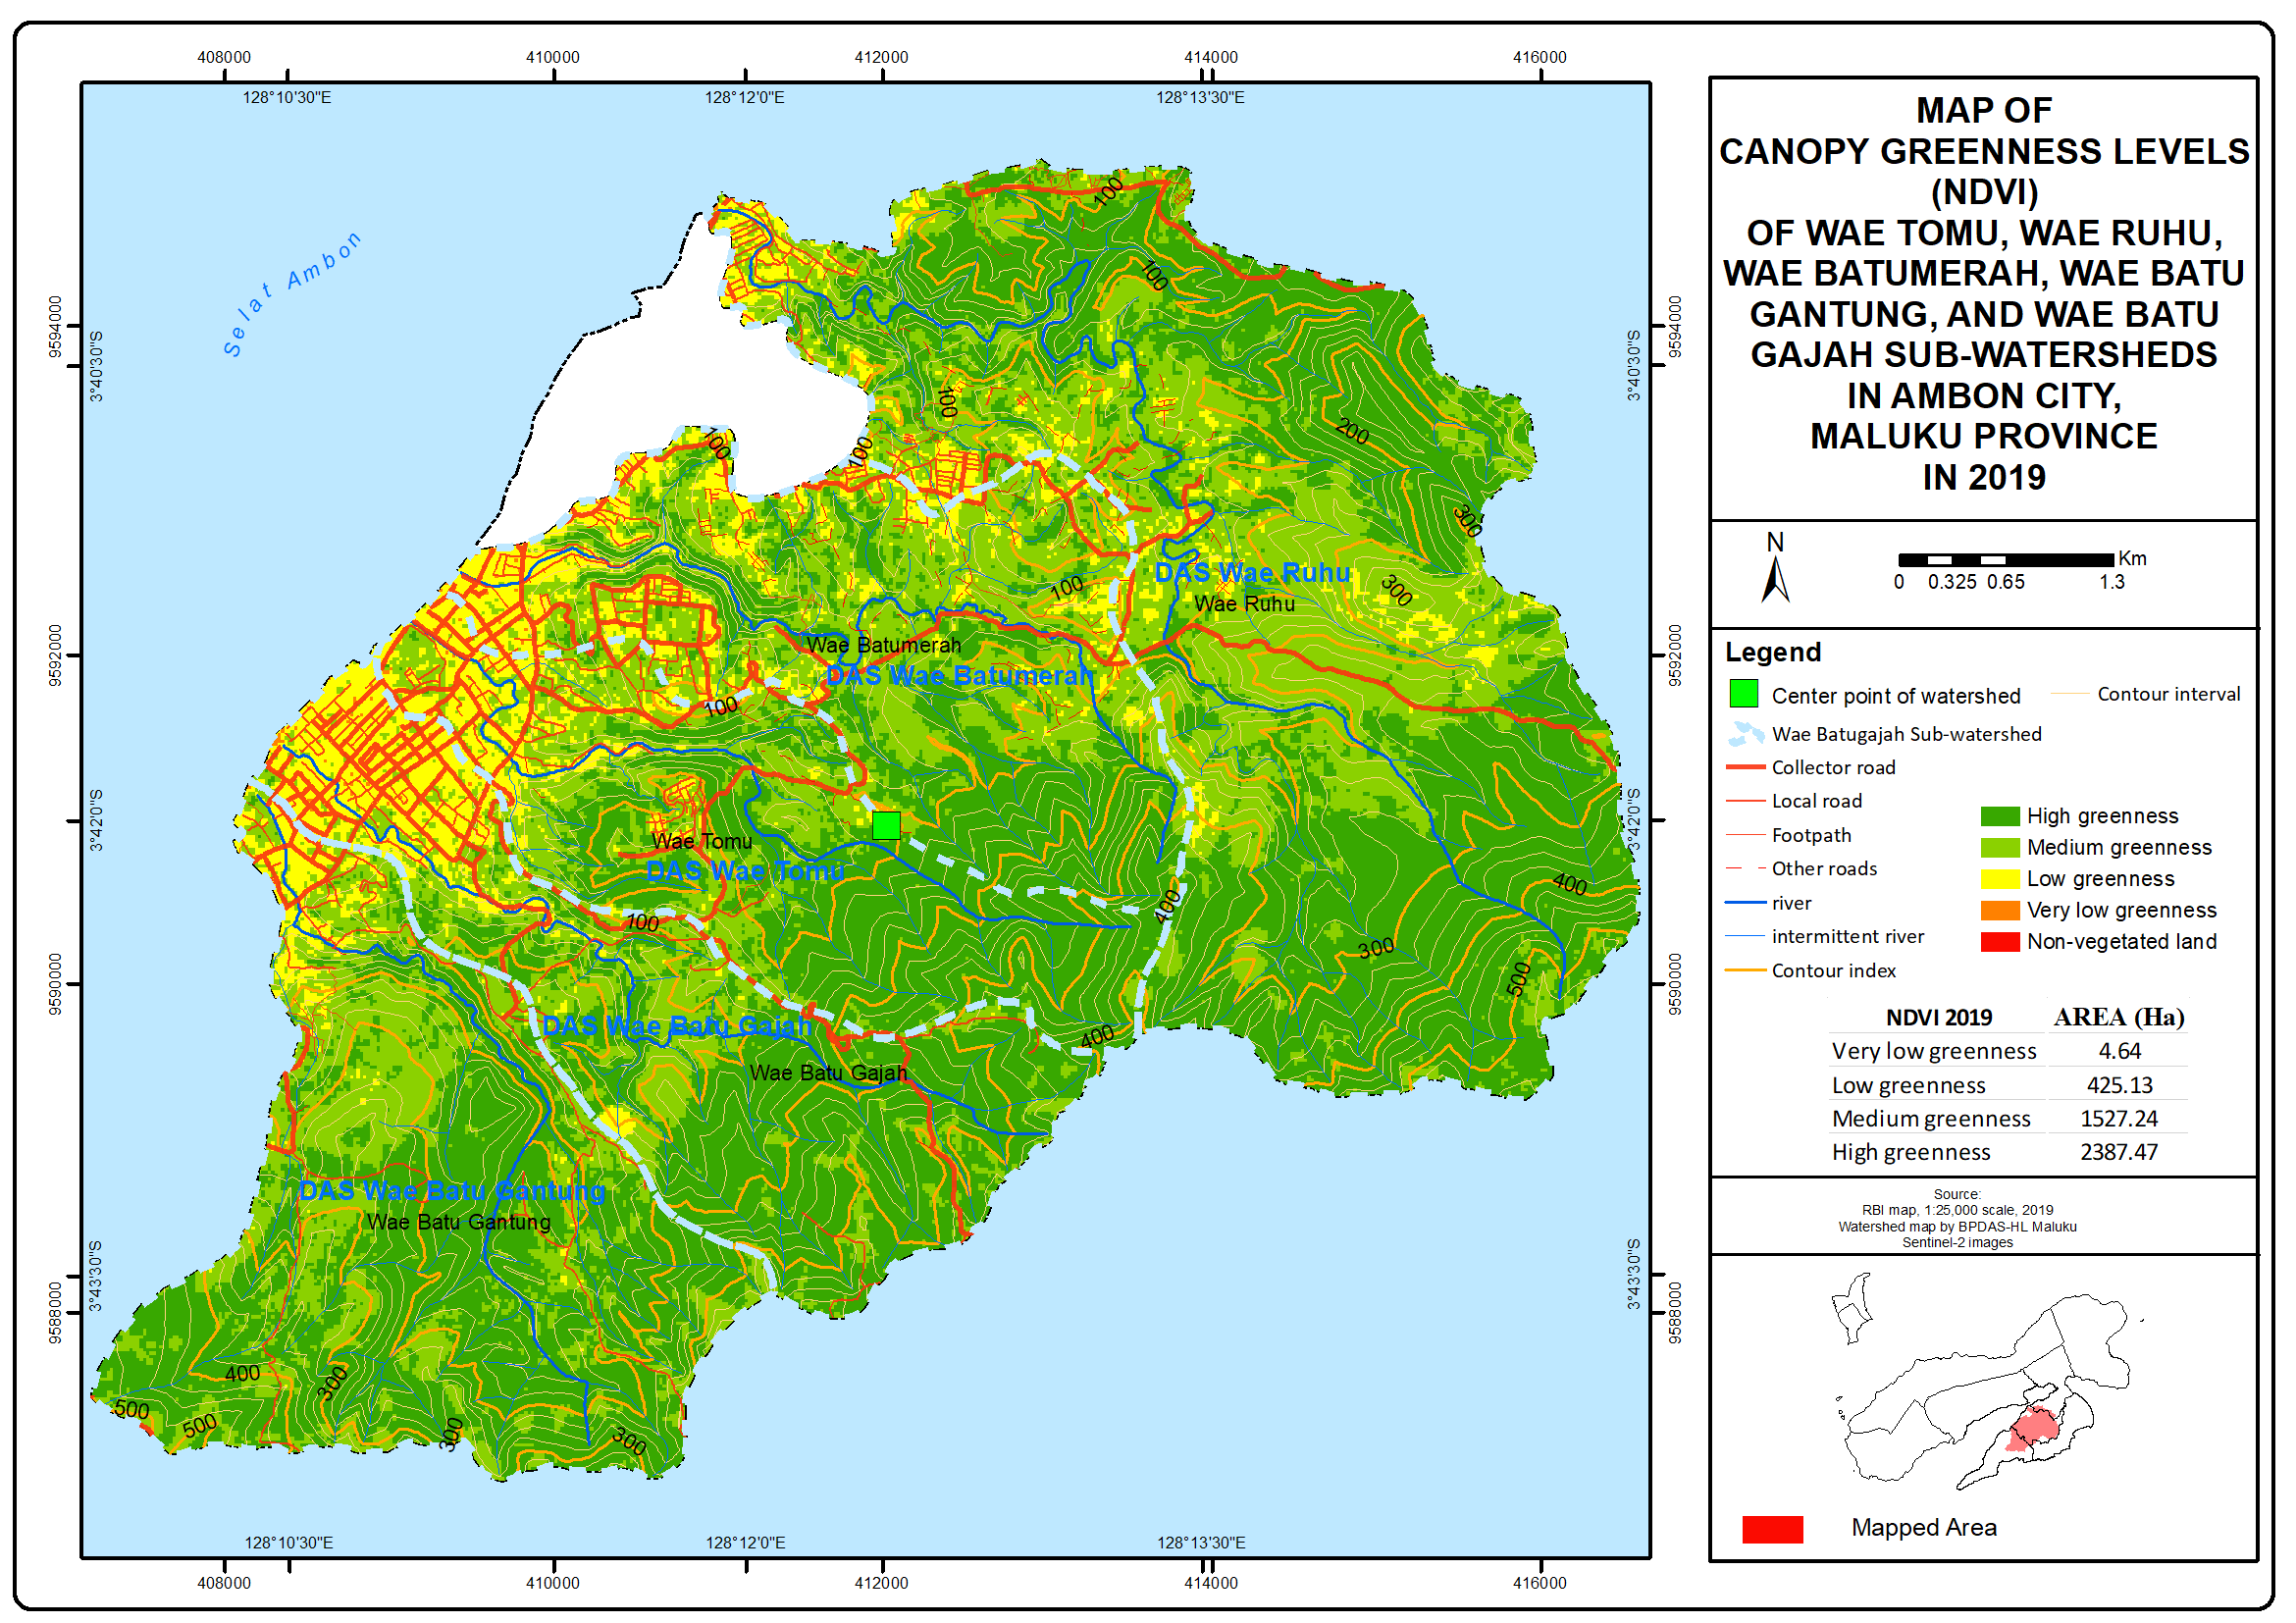
Based on the calculation results, differences in canopy greenness level between the 2015 and 2019 data indicated a trend of change in all classes of NDVI for all researched watersheds. The most significant change was found in the high greenness class, followed by low and very low classes, while the medium class in all watersheds experienced an increasing trend. These results can be traced to the changes in the direction of non-vegetated land growth, especially settlements that had started to sprawl into the mountainous areas in the east. Due to population growth and regional development in Ambon City, changes in the spatial pattern of canopy greenness have become categorically significant.
Analysis of GeoEye image with a 30m resolution using the 5m zone buffering from the river identified the spatial pattern of built-up land, which was dominant along the riparian zones on either side of the river in the five watersheds observed. The riparian zones, especially in the middle part and estuary of these watersheds, were occupied by settlements, government buildings, and centers of trade and economic activities, with high to very high building density. Their existence, therefore, disrupts the function of a riparian zone, which supposedly protects against floods and droughts.
3.2 Morphometric and Hydrological Characteristics
3.2.1 Morphometric Properties
Analyses of satellite images and topographic maps (Rupa Bumi Indonesia) found that the small island watersheds in Ambon city, Maluku province, were mainly characterized by the narrow and short mainstream. They also had a unique hydrological system that was responsive to existing climate change mitigation and adaptation strategies or generally similar to the ecosystem of other small island watersheds. The results of these analyses are summarized in table 6.
Table 6. Canopy greenness levels derived from NDVI in 2019
|
Canopy Greenness Levels |
Wae Batu Merah (%) |
Wae Ruhu (%) |
Wae Batu Gajah (%) |
Wae Gantung (%) |
Wae Tomu (%) |
|
Very low |
0.13 |
0.09 |
0.11 |
0.11 |
0.10 |
|
Low |
14.50 |
8.08 |
8.17 |
9.69 |
9.71 |
|
Medium |
39.10 |
34.82 |
34.94 |
31.28 |
36.35 |
|
High |
46.26 |
57.01 |
56.78 |
58.92 |
53.84 |
|
Total |
100 |
100 |
100 |
100 |
100 |
Table 6 shows that all watersheds had relatively small areas, with the most extensive and smallest areas identified in Wae Ruhu and Wae Tomu, respectively. Wae Ruhu had the highest average slope (12.34 m), while Wae Batu Gajah had the lowest (0.49 m). The longest main river (11.87 m) was found in Wae Ruhu, whereas the shortest (5.64 m) was in Wae Batu Gantung. Both Wae Batu Merah and Wae Batu Gajah had the highest circularity ratio, i.e., 12.56. Furthermore, the five watersheds’ morphometric characteristics included stream gradients ranging between 300 m and 500 m, drainage density of 2-3 km/km2, bifurcation ratio of averagely 0.9, and pinnate drainage pattern.
Drainage density (Dd) is a morphometric parameter indicating the effects of hydrological systems of a watershed on flood susceptibility and base flow/groundwater drainage. The five watersheds had excellent drainage density, with Dd varying from more than 1 to 5. The bifurcation ratio was more and less than 1, meaning that the watersheds are not expected as they experience a very high flood peak and have a short recession time. Moreover, they tend to have high surface runoff but low permeability and infiltration, precursors of high flood susceptibility. The bifurcation ratio of the five watersheds was 0.9. In other words, they have a round shape with very high peak discharge (Qp) and relatively short rising and recession times, all of which contribute to increased susceptibility to flooding.
3.2.2 Hydrological Characteristics
Based on the stream discharge and base flow calculations were performed using the BFLOW filter module of the Hydro-office 12.0 program (with α 0.85). The results of the analysis of the average monthly discharge, base flow, and base flow index for 2015 for the five watersheds show an average discharge of 0.51 m3/sec - 0.57 m3/sec; base flow 0.51 m3/sec - 0.57 m3/sec, and a BFI index of 0.52-0.59. The calculation results of the average monthly discharge, base flow, and base flow index for the 2019 period for the five watersheds are an average discharge of 0,51 m3/sec - 0,57 m3/sec; base flow 0.51 m3/sec - 0,57 m3/sec, and a BFI index of 0.52 - 0,59. The stream and base flow rates of the five watersheds during the research period are visualized in table 7 and figure 3.
Table 7. Morphometric characteristics of small island watersheds in Ambon City, Maluku Province
|
Watersheds |
Area (km²) |
Mean Slope Gradient (m) |
Stream Gradient (m) |
Length of Main Stream (km) |
Drainage density (km/km²) |
Circularity Ratio (CR) |
Bifurcation Ratio (BR) |
Drainage Pattern |
|
Wae Batu Merah |
7.04 |
5.15 |
359.70 |
6.83 |
3.28 |
12.56 |
0.95 |
Pinnate |
|
Wae Ruhu |
15.80 |
12.34 |
524.98 |
11.87 |
3.03 |
9.04 |
0.98 |
Pinnate |
|
Wae Batu Gajah |
6.35 |
0.49 |
324.98 |
6.58 |
2.91 |
12.56 |
0.95 |
Pinnate |
|
Wae Batu Gantung |
8.63 |
5.84 |
264.17 |
5.64 |
2.93 |
7.51 |
0.95 |
Pinnate |
|
Wae Tomu |
5.62 |
4.89 |
349.98 |
6.14 |
3.16 |
5.47 |
0.93 |
Pinnate |
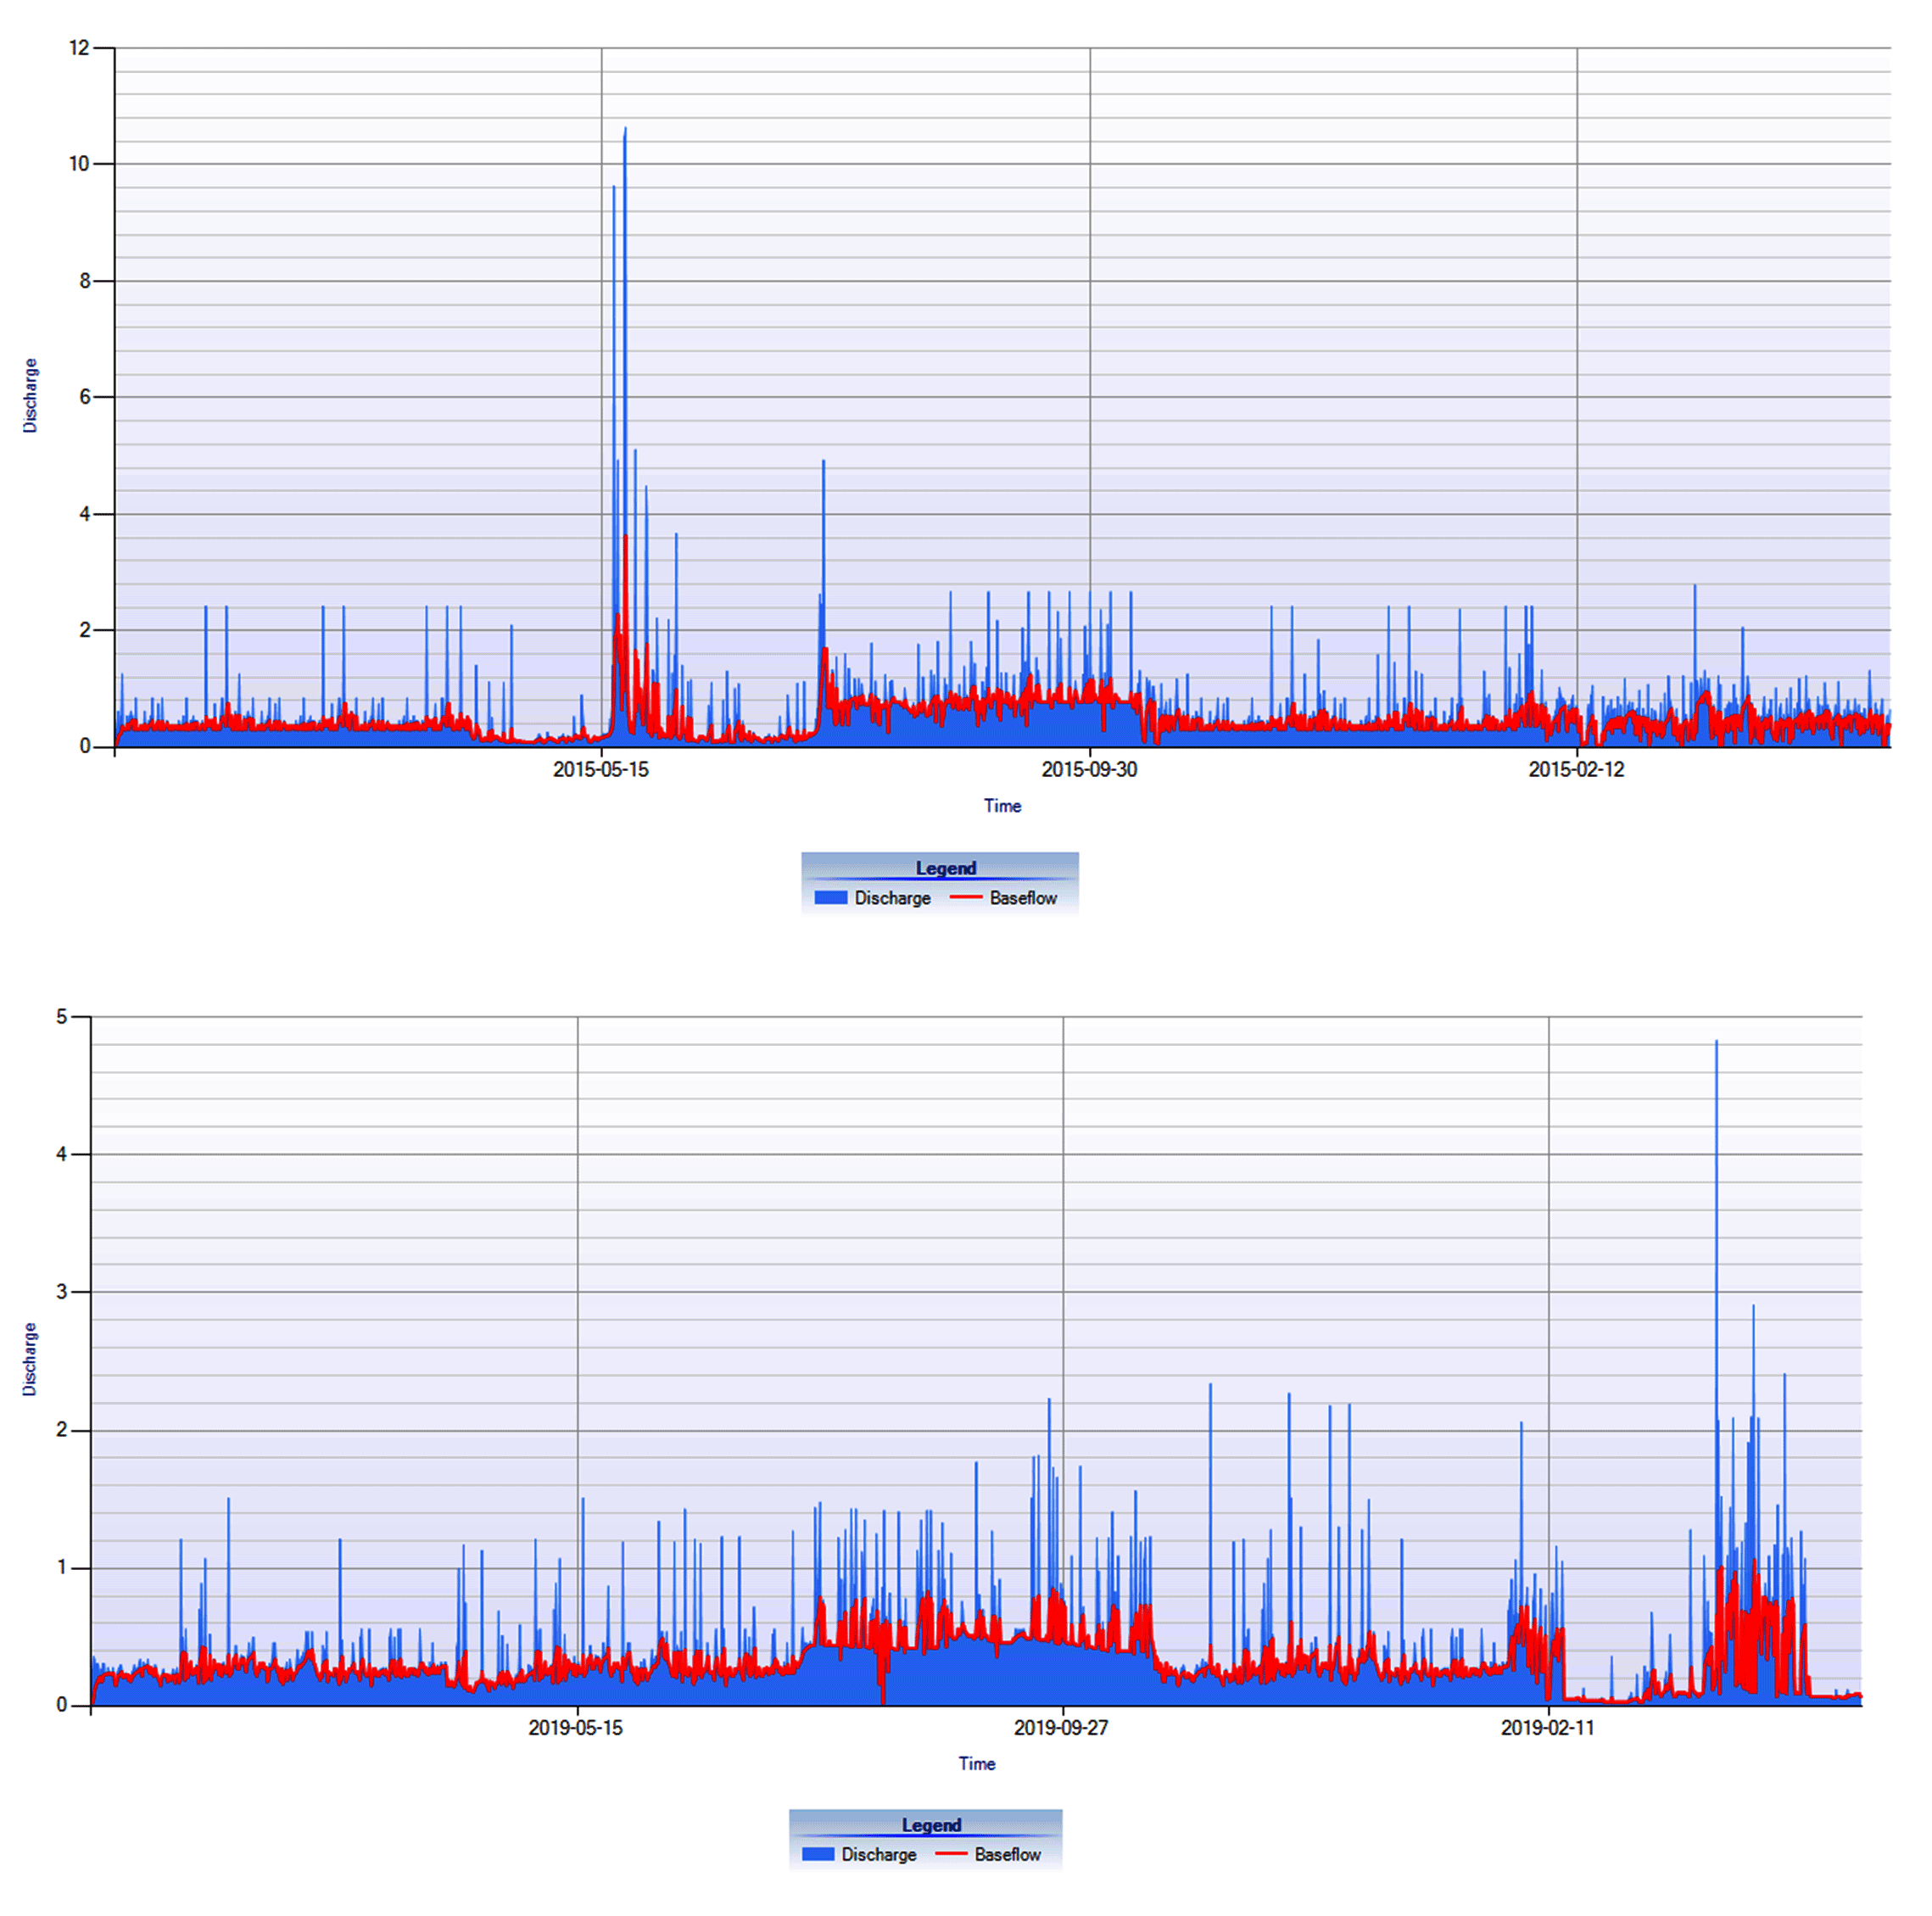
As seen in figure 3, the watersheds observed were characterized by the stream, and base flow rates significantly changed in the 2015-2019 period. In 2015, these flow components showed fluctuating rates from April until June and an increasing trend from July until September but then tended to hover around 1 m3/s throughout November and December. Meanwhile, in 2019, they were steady from January until June and had a similar increasing trend until October but tended to fluctuate with a relatively decreasing trend in November, before soaring up to 9.63 m3/s (discharge) and 2.28 m3/s (baseflow) in December.
In small island watersheds, the visualization of hydrological characteristics in 2015 and 2019 is primarily determined by the ecosystem’s land-use dynamics. Morphometric properties are the locus of small island watersheds that are highly vulnerable to global environmental changes according to the hydro-morphometric perspective. The same case applies to hydro-morphometric conditions that affect small island watersheds, hydrological systems, especially concerning flood susceptibility and base flow/groundwater drainage.
Drainage density is a primary determinant of flood susceptibility and groundwater drainage. Likewise, the bifurcation ratio determines the shape of a watershed, which reflects flood peak discharge (high or low), time to peak (fast or slow), and recession time (short or long). The combination of high flood peak, quick time to peak, and short recession time induce high surface flow rates but low permeability and infiltration, causing small island watersheds to be highly susceptible to floods.
3.3 Relationship Between Canopy Greenness and Hydrological Characteristics
The spatial pattern of canopy greenness, as derived from NDVI, showed a trend of change during the study period. Land-use change is a dynamic factor that significantly influences the hydrological characteristics of small island watersheds. These results are also apparent in the visualization of the hydrological characteristics of the five watersheds.
The relationship between the spatial pattern of canopy greenness (NDVI) and the hydrological characteristics of a watershed, including stream and base flow discharge, is marked by the coefficient of determination (R2). In the summary model, the adjusted R2 value was 0.382, and the hydrological characteristics could be explained by the model (38.8%), as seen in table 8. Also, with the Durbin-Watson value of 1.271, the model assumes that independence is met. The smaller the SEE, the closer the regression model to predicting the dependent variable accurately.
Table 8. Characteristics of average monthly discharge, base flow, and BFlow index for the period 2015 and 2019
|
Name of watershed |
2015 |
2019 |
||||
|
Discharge |
Base flow |
BF index |
Discharge |
Base flow |
BF index |
|
|
Wae Batu Merah |
0.51 |
0.53 |
0.52 |
0.51 |
0.53 |
0.52 |
|
Wae Ruhu |
0.53 |
0.55 |
0.55 |
0.53 |
0.55 |
0.55 |
|
Wae Batu Gajah |
0.57 |
0.57 |
0.59 |
0.57 |
0.57 |
0.59 |
|
Wae Batu Gantung |
0.52 |
0.51 |
0.53 |
0.52 |
0.51 |
0.53 |
|
Wae Tomu |
0.52 |
0.52 |
0.53 |
0.52 |
0.52 |
0.53 |
The ANOVA yielded a simultaneous correlation value, namely F-count= 4.234, which was higher than F-table= 2.367 at a significance of 0.001<0.05. This figure indicates that the canopy greenness levels derived from NDVI affect the hydrological characteristics (stream and base flow discharge) significantly in the five selected watersheds.
Table 9. The regression model correlating the spatial pattern of canopy greenness with hydrological characteristics
|
Model |
R |
R Square |
Adjusted R Square |
Standard Error of the Estimate |
Durbin-Watson |
|
1 |
0.645a |
0.416 |
0.382 |
0.103 |
1.271 |
Notes: predictors: (constant), NDVI algorithm, watershed area (km2), stream gradient (m), elevation (m asl), drainage density (km/km²); dependent variable: stream and baseflow discharge (m3/s)
4. Conclusions
The spatial pattern of canopy greenness tends to experience significant changes in the estuary or river mouth, and in 2019, the densely populated settlements in the coastal stretch had also sprawled into the adjacent mountainous area. This landform, however, functions as one of the water recharge zones in Ambon city, and it is feared that the land-use change will affect the local hydrological characteristics. This result is consistent with the visualization of hydrological characteristics that shows a fluctuating trend during the study period (2015-2019). Based on the statistical analysis, variations in the spatial pattern of canopy greenness have a strong positive relationship (38.2%) with the hydrological characteristics of small island watersheds. Therefore, land and water resources management and planning in small islands need to incorporate mitigation and adaptation to any changes in the watershed ecosystems.
5. Funding Agency
This research did not receive any specific grant from funding agencies in the public, commercial, or not-for-profit sectors
Conflict of interest
The authors declare that they have no known competing financial interests or personal relationships that could have appeared to influence the work reported in this paper.
Acknowledgements
The authors would like to thank the head and staff of the River Basin Station at Maluku Province for providing the authors with the opportunity to utilize the data recorded at the stream gauge stations installed at the researched watersheds.
Abbreviations
BFI: Base Flow Index; BFLOW: Base Flow; BR: Bifurcation Ratio; CR: Circularity Ratio; Dd: Drainage density; NDII: Normalized Difference Infrared Index; NDVI: Normalized Difference Vegetation Index; NDWI: Normalized Difference Water Index; NPimd: Pixel Values of Near-infrared; NPimd_min: Minimum Pixel Values of Near-infrared; NPm: Pixel Values of Red; NPm_min: Minimum Pixel Values of Red; Qp: Peak Discharge.
Article information
- Received
- 30 Aug 2020
- Revised
- 29 Jan 2021
- Accepted
- 23 Feb 2021
- Published
- 4 Mar 2021
- Handling editor
- Professor. Masood Ahsan Siddiqui
- Licence
- CC BY-NC-ND 4.0
- Journal
- Journal of Geographical Studies, ISSN 2582-1083
References
-
Arnanto, A., 2015. Pemanfaatan transformasi normalized difference vegetation Index (NDVI) Citra Landsat TM Untuk Zonasi Vegetasi Di Lereng Merapi Bagian Selatan. Geomedia: Majalah Ilmiah Dan Informasi Kegeografian, 11(2), 155-170.
Crossref -
Candiago, S., Remondino, F., De Giglio, M., Dubbini, M. and Gattelli, M., 2015. Evaluating multispectral images and vegetation indices for precision farming applications from UAV images. Remote Sensing.
Crossref -
Chuvieco, E., Martín, M. P. and Palacios, A., 2002. Assessment of different spectral indices in the red-near-infrared spectral domain for burned land discrimination. International Journal of Remote Sensing. 23(23), 5103-5110.
Crossref -
Chuvieco, E., Ventura, G., Martín, M. P. and Gómez, I., 2005. Assessment of multitemporal compositing techniques of MODIS and AVHRR images for burned land mapping. Remote Sensing of Environment, 94(4), 450-462.
Crossref -
Ekawati, S., Paimin, P., Purwanto, P. and Donie, S., 2005. Monitoring dan evaluasi kondisi sosial ekonomi dalam pengelolaan daerah aliran sungai: Studi kasus di sub das progo hulu. Jurnal Penelitian Sosial Dan Ekonomi Kehutanan. 2(2), 171-181.
Crossref -
Eryani, I., 2014. Potensi air dan metode pengelolaan sumber daya air di daerah aliran sungai sowan perancak kabupaten jembrana. Paduraksa, 3(1), 32-41.
-
Escuin, S., Navarro, R. and Fernández, P., 2008. Fire severity assessment by using NBR (Normalized Burn Ratio) and NDVI (Normalized Difference Vegetation Index) derived from LANDSAT TM/ETM images. International Journal of Remote Sensing, 29(4), 1053-1073.
Crossref -
Fuady, Z. and Azizah, C., 2013. Tinjauan daerah aliran sungai sebagai sistem ekologi dan manajemen daerah aliran sungai. Jurnal Lentera, 6, 1-10.
-
Gandhi, G. M., Parthiban, S., Thummalu, N. and Christy, A., 2015. NDVI: Vegetation change detection using remote sensing and GIS - A case study of Vellore District. Procedia Computer Science. 57,1199-1210.
Crossref -
Gregor, M., 2010. Manual: Bfi+ 3.0. Department of Hydrogeology, Faculty of Natural Science, Comenius University Bratislava, Slovakia.
-
Gu, Y., Hunt, E., Wardlow, B., Basara, J. B., Brown, J. F. and Verdin, J. P., 2008. Evaluation of MODIS NDVI and NDWI for vegetation drought monitoring using Oklahoma Mesonet soil moisture data. Geophysical Research Letters.
Crossref -
Harjadi, B. and Paimin, P., 2013. Teknik identifikasi daerah yang berpotensi rawan longsor pada satuan wilayah daerah aliran sungai. Jurnal Penelitian Hutan Dan Konservasi Alam. 10(2), 163-174.
Crossref -
Horton, R.E., 1932. The role of infiltration in the hydrologic cycle. Trans. Am. Geophysic Union, 14, 446-460.
Crossref -
Junaidi, E. and Tarigan, S. D., 2011. Pengaruh hutan dalam pengaturan tata air dan proses sedimentasi daerah aliran sungai (das) : Studi kasus di das cisadane. Jurnal Penelitian Hutan Dan Konservasi Alam. 8(2), 155-176.
Crossref -
Latuamury, B., 2013. Hubungan antara indeks vegetasi ndvi (Normalized Difference Vegetation Index) dan koefisien resesi baseflow pada beberapa subdas propinsi jawa tengah dan daerah istimewa yogyakarta. Jurnal Teknosains. 2(2), 71-92.
Crossref -
Latuamury, B., and Talaohu, M., 2020. Variations in baseflow recession curves as a function of land-use change in the Keduang Watershed, Wonogiri Regency, Jawa Tengah Province, Indonesia. Journal of Geographical Studies, 3(2), 54-67.
Crossref -
Latuamury, B., Parera, L. R. and Marasabessy, H., 2020. Characterizing river baseflow recession using linear reservoir model in Alang Watershed, Central Java, Indonesia. Indonesian Journal of Geography. 52(1), 22-28.
Crossref -
Lyne, V. D. and Hollick, M., 1979. Stochastic time-variable rainfall runoff modelling. Hydrology and Water Resources Symposium. Institution of Engineers, Australia, Perth, 89-92.
-
Mekliche, A., Hanifi Mekliche, L., Aidaoui, A., Monneveux, P. and Hwazen, A. S., 2015. Grain yield and its components study and their association with normalized difference vegetation index (NDVI) under terminal water deficit and well-irrigated conditions in wheat (Triticum durum Desf. and Triticum aestivum L.). African Journal of Biotechnology, 14(26), 2142-2148.
Crossref -
Nathan, R. J. and McMahon, T. A. 1990. Evaluation of automated techniques for base flow and recession analysis. Water Resources Research, 26(7), 1465-1473.
Crossref -
Paimin, S. and Pramono, I. B., 2009. Teknik mitigasi banjir dan tanah longsor. In Tropenbos International Indonesia Programme, Indonesia.
-
Pravita, D., Armijon, A. and Murdapa, F., 2019. Perbandingan algoritma transformasi normalized difference vegetation index (NDVI) dan enhanced vegetation index (EVI) Untuk analisis kerapatan lahan mangrove.
-
Seyhan, E.,(1977. Mathematical simulation of watershed hydrologic processes. Geografisch Instituut der Rijksuniversiteit te Utrecht.
-
Sobrino, J. A., Jiménez-Muñoz, J. C., Sòria, G., Romaguera, M., Guanter, L., Moreno, J., Plaza, A. and Martínez, P., 2008. Land surface emissivity retrieval from different VNIR and TIR sensors. IEEE Transactions on Geoscience and Remote Sensing.
Crossref -
Wardiningsih, S. and Salam, B. F., 2019. Perencanaan RTH sempadan sungai ciliwung di kawasan kampung pulo. NALARs Jurnal Arsitektur. 18(1), 65-74.
Crossref -
Wilson, N. R. and Norman, L. M., 2018. Analysis of vegetation recovery surrounding a restored wetland using the normalized difference infrared index (NDII) and normalized difference vegetation index (NDVI). International Journal of Remote Sensing, 39(10), 3243-3274.
Crossref