

Journal of Geographical Studies Volume 7 (2023), Issue 1 · pp. 1-13
Original Research Paper Open Access

Application of Sentinel-1A SAR Data for Village Level Flood Inundation Mapping in Malda District, West Bengal, India
- Department of Disaster Management, Pondicherry University, Port Blair Campus, Andaman, India.
- Department of Geography, West Bengal State University, West Bengal, India.
- Birla Institute of Technology and Science, Pilani- K.K. Birla Goa Campus, Goa, India.
- National Remote Sensing Centre, ISRO, Hyderabad, India.
* Corresponding author: Kajal Kumar Mandal, kajal.kkm@gmail.com
Contents
- Highlights
- Abstract
- 1. Introduction
- 2. Study Area
- 3. Materials And Methods
- 4. Results And Discussion
- 5. Conclusion
- Conflict of interest
- Acknowledgements
- Abbreviations
- Article information
- References
-
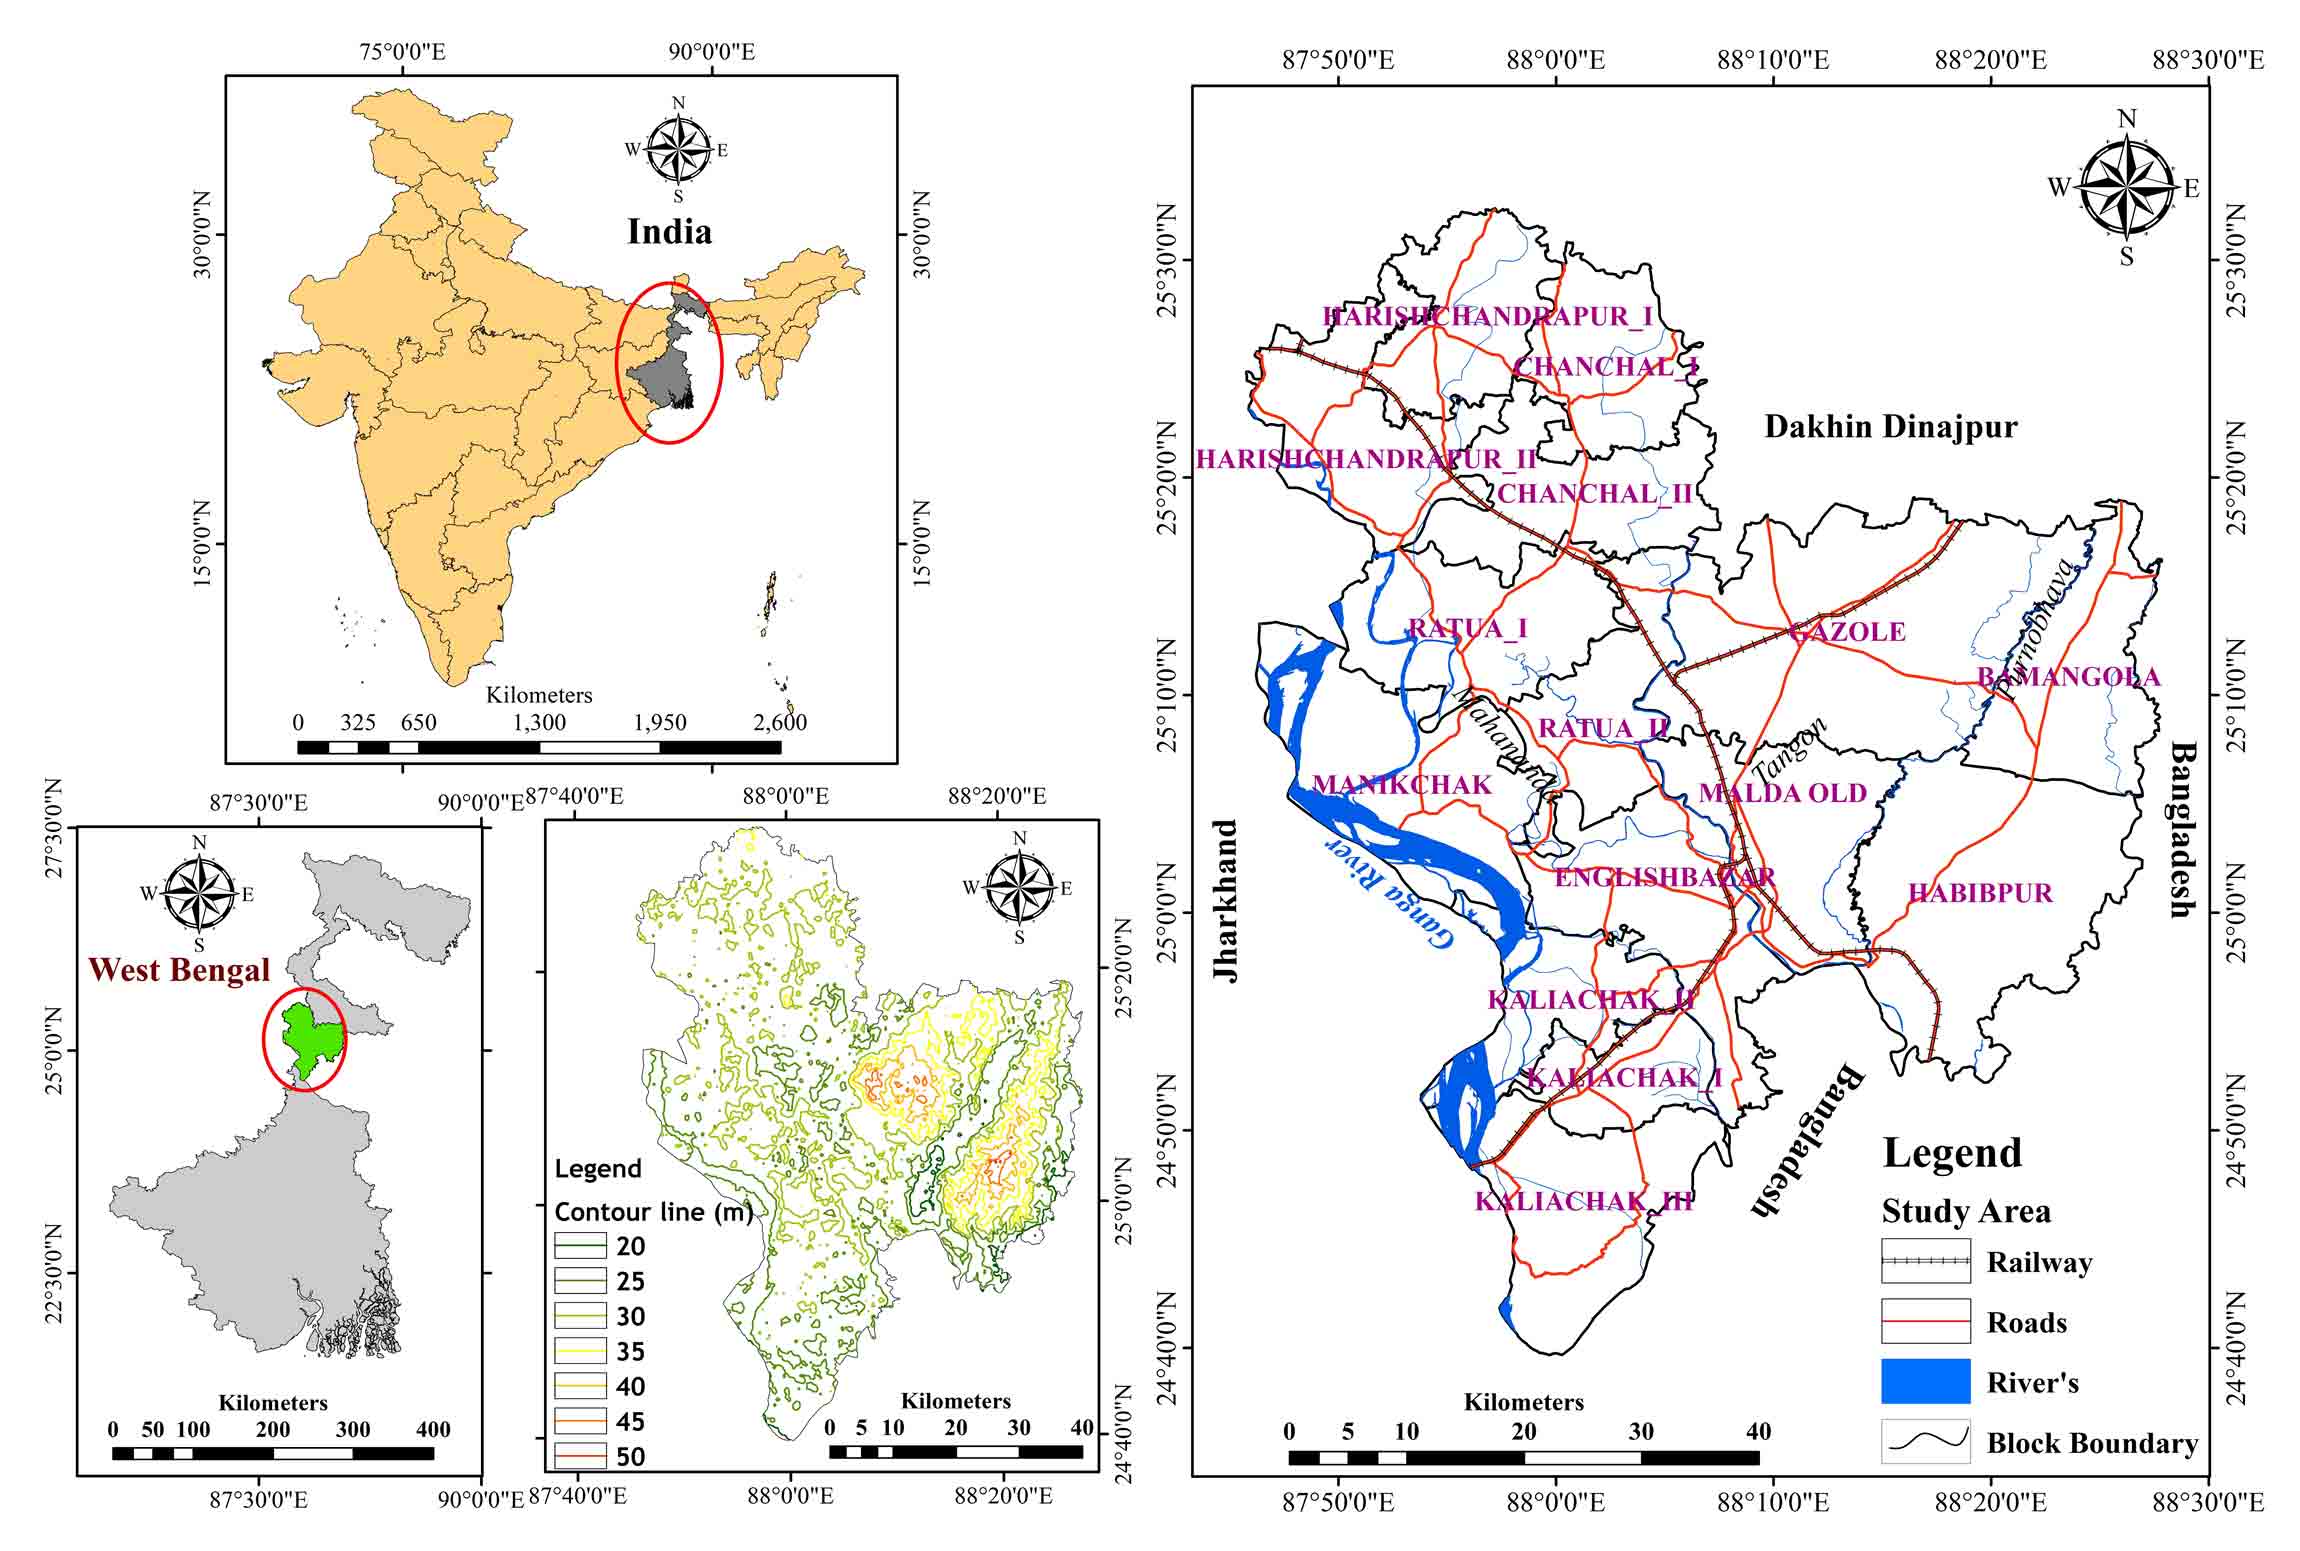
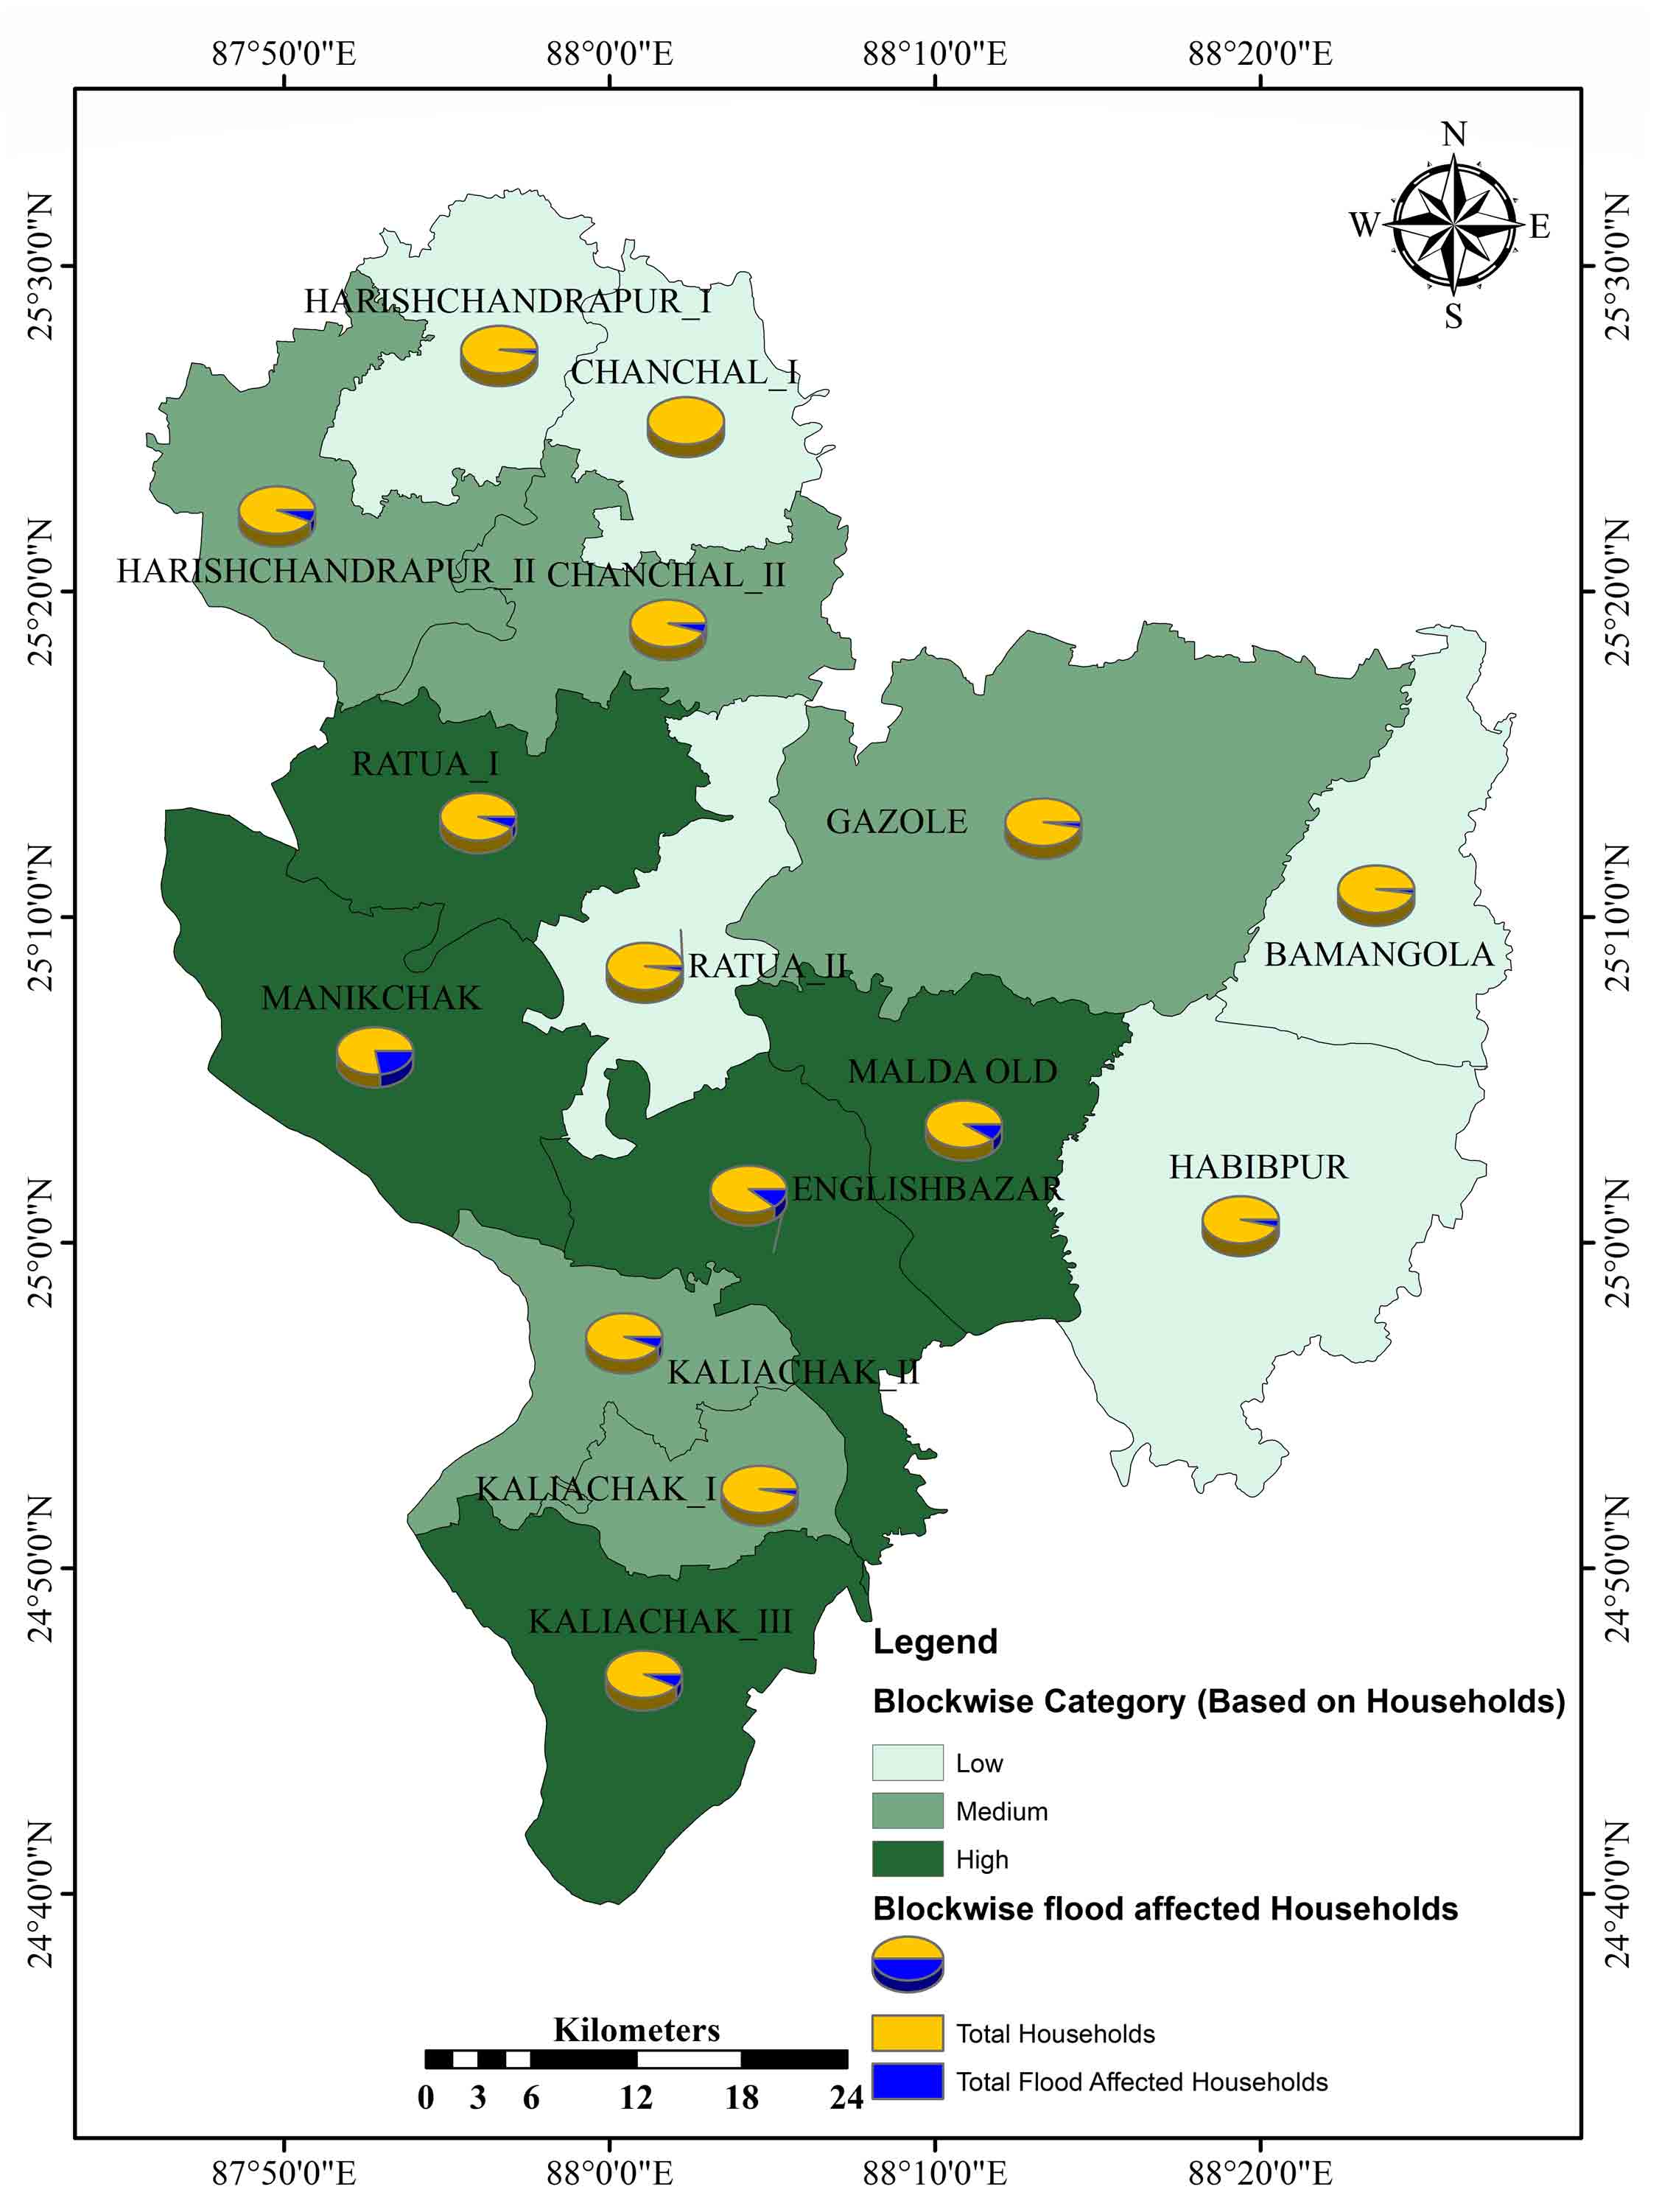
- Figure 1. Study area: Malda district, West Bengal (India)
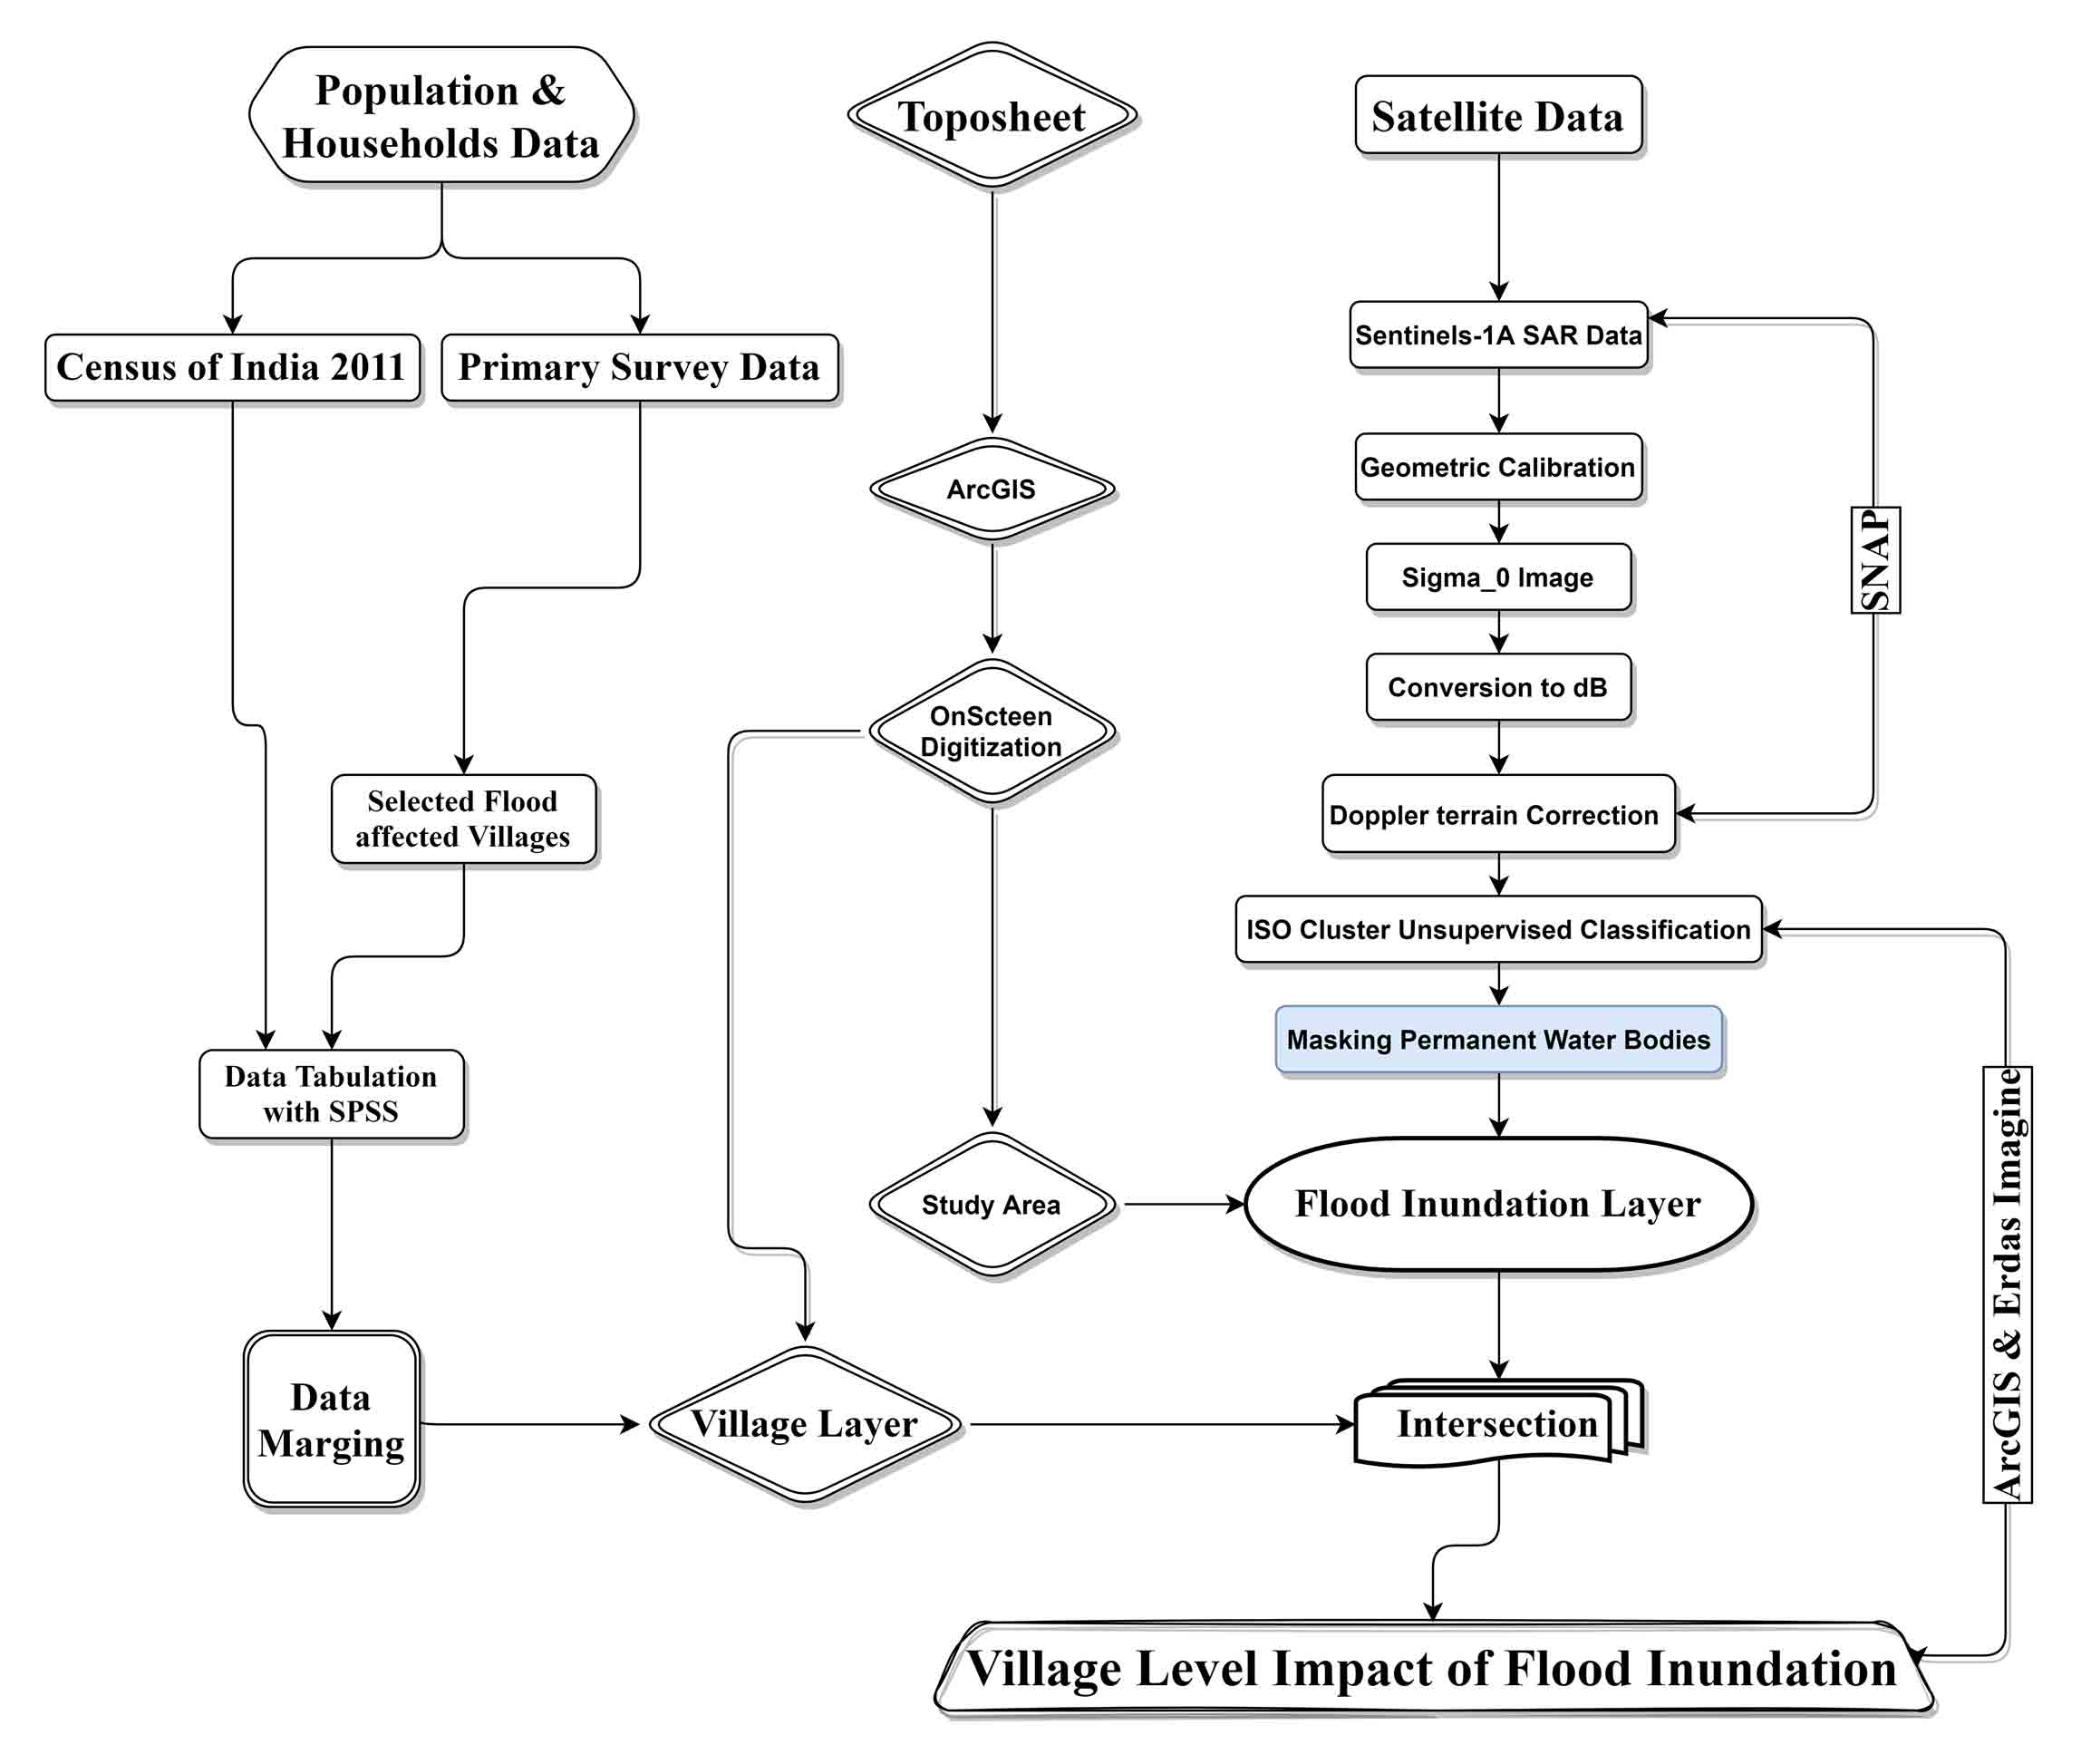
- Figure 2. Methodology
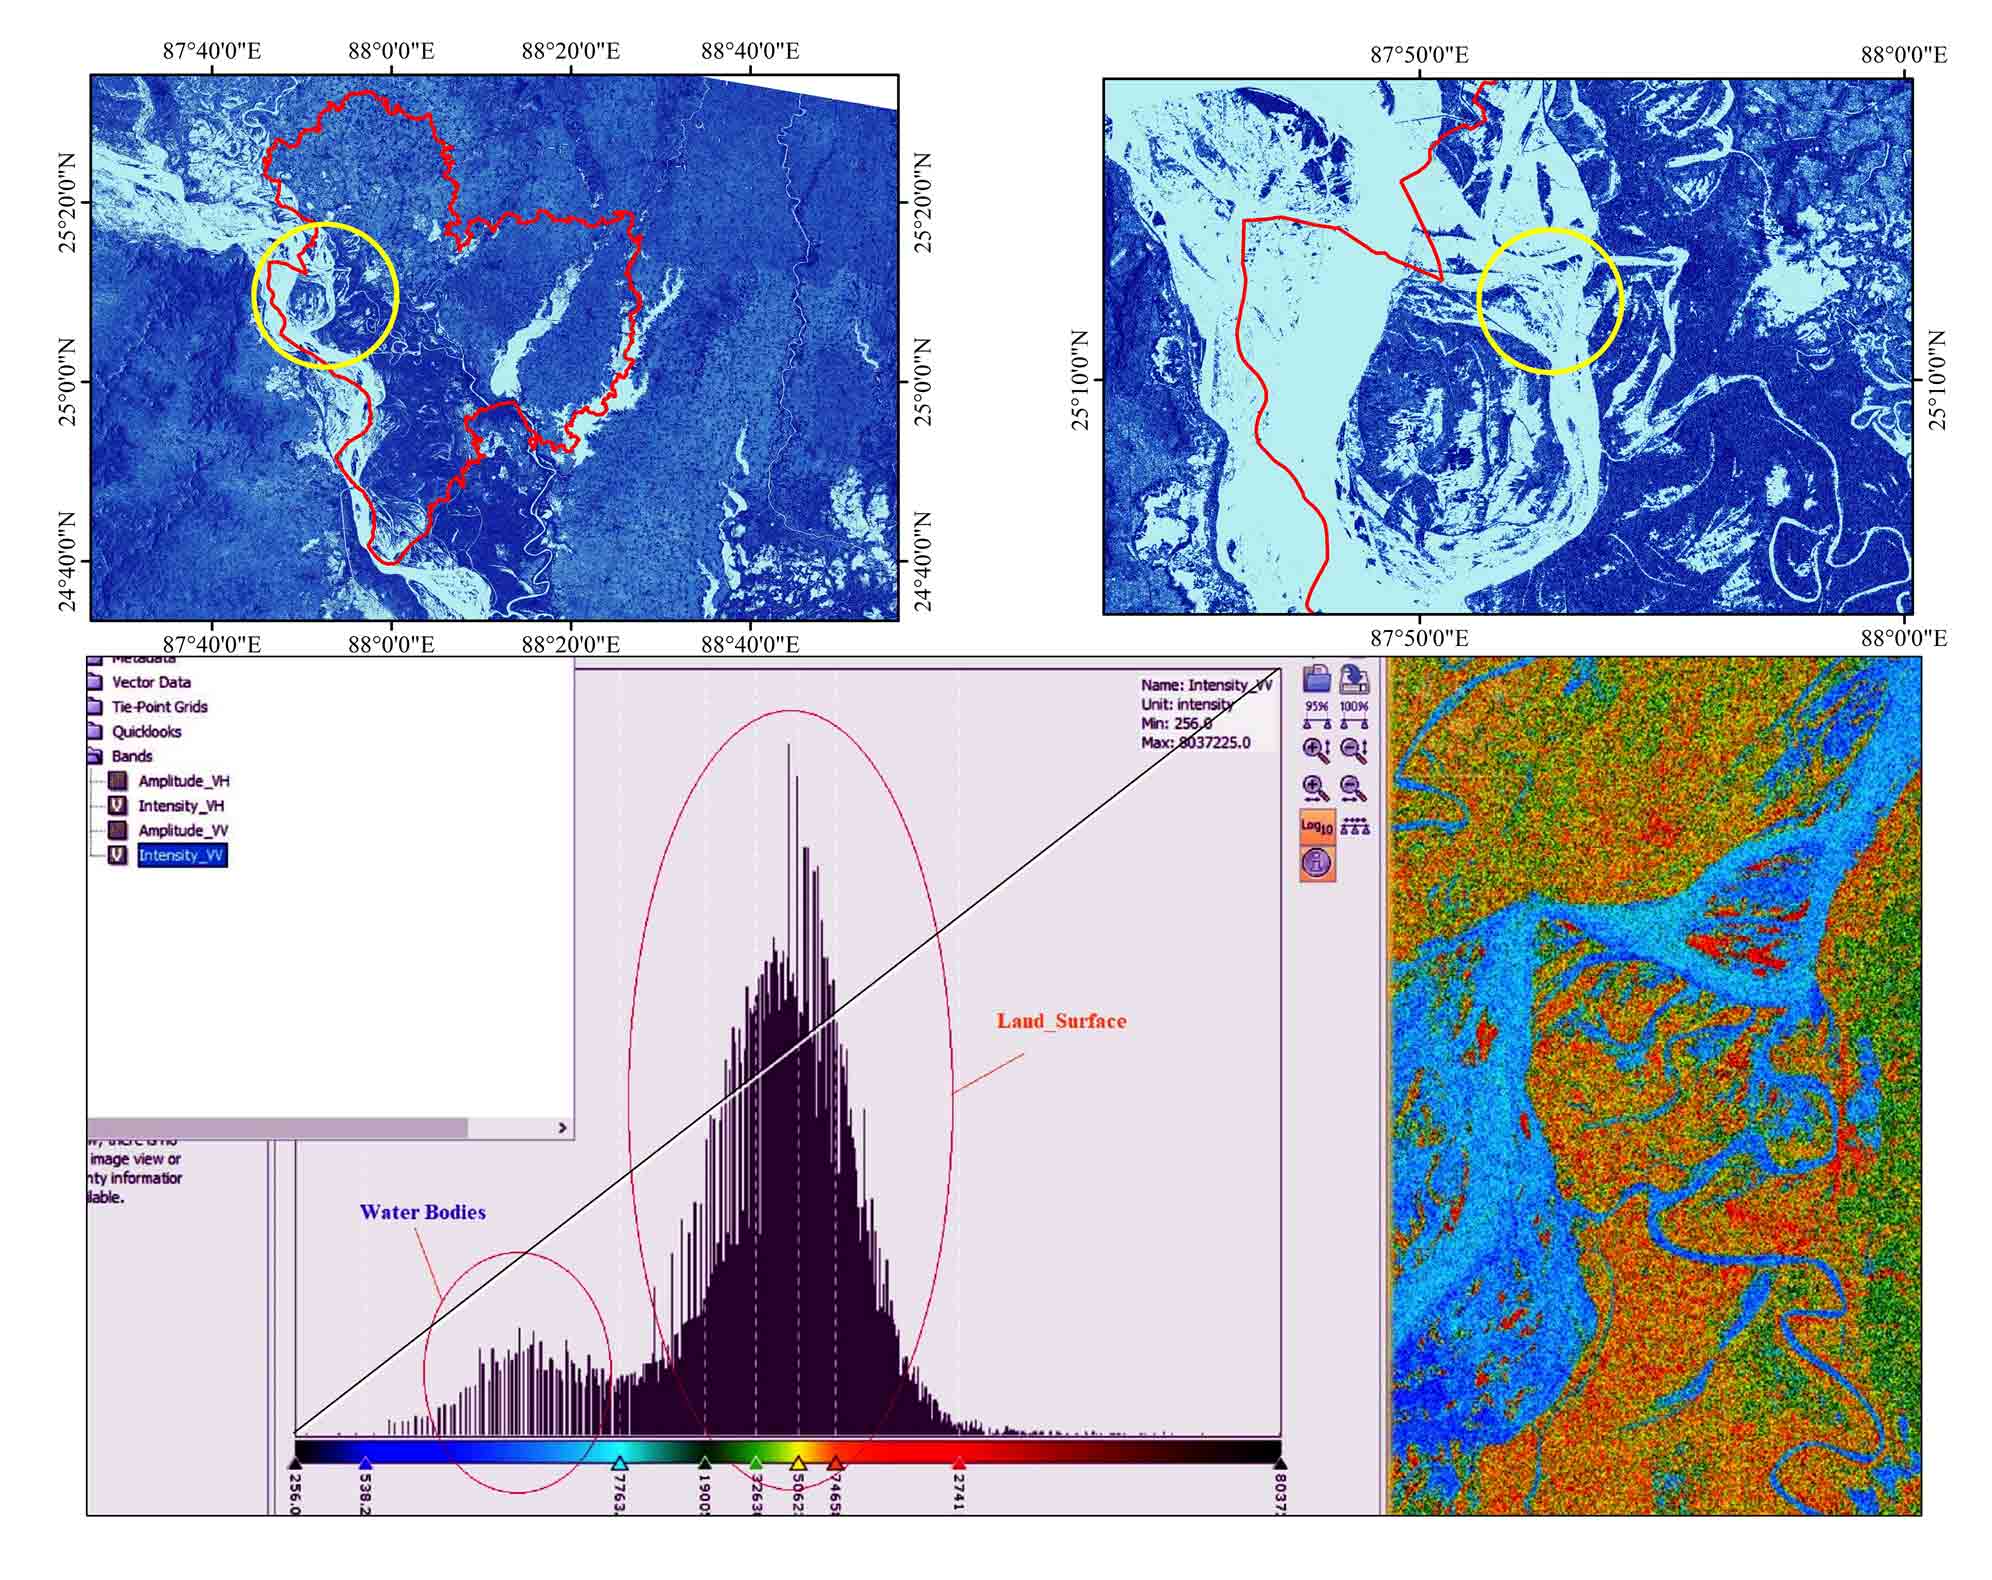
- Figure 3. Backscatter spectral signatures
- Figure 4A. Flood Inundation layers
- Figure 4B. Flood Inundation layers
- Figure 5. Distribution of inundated area
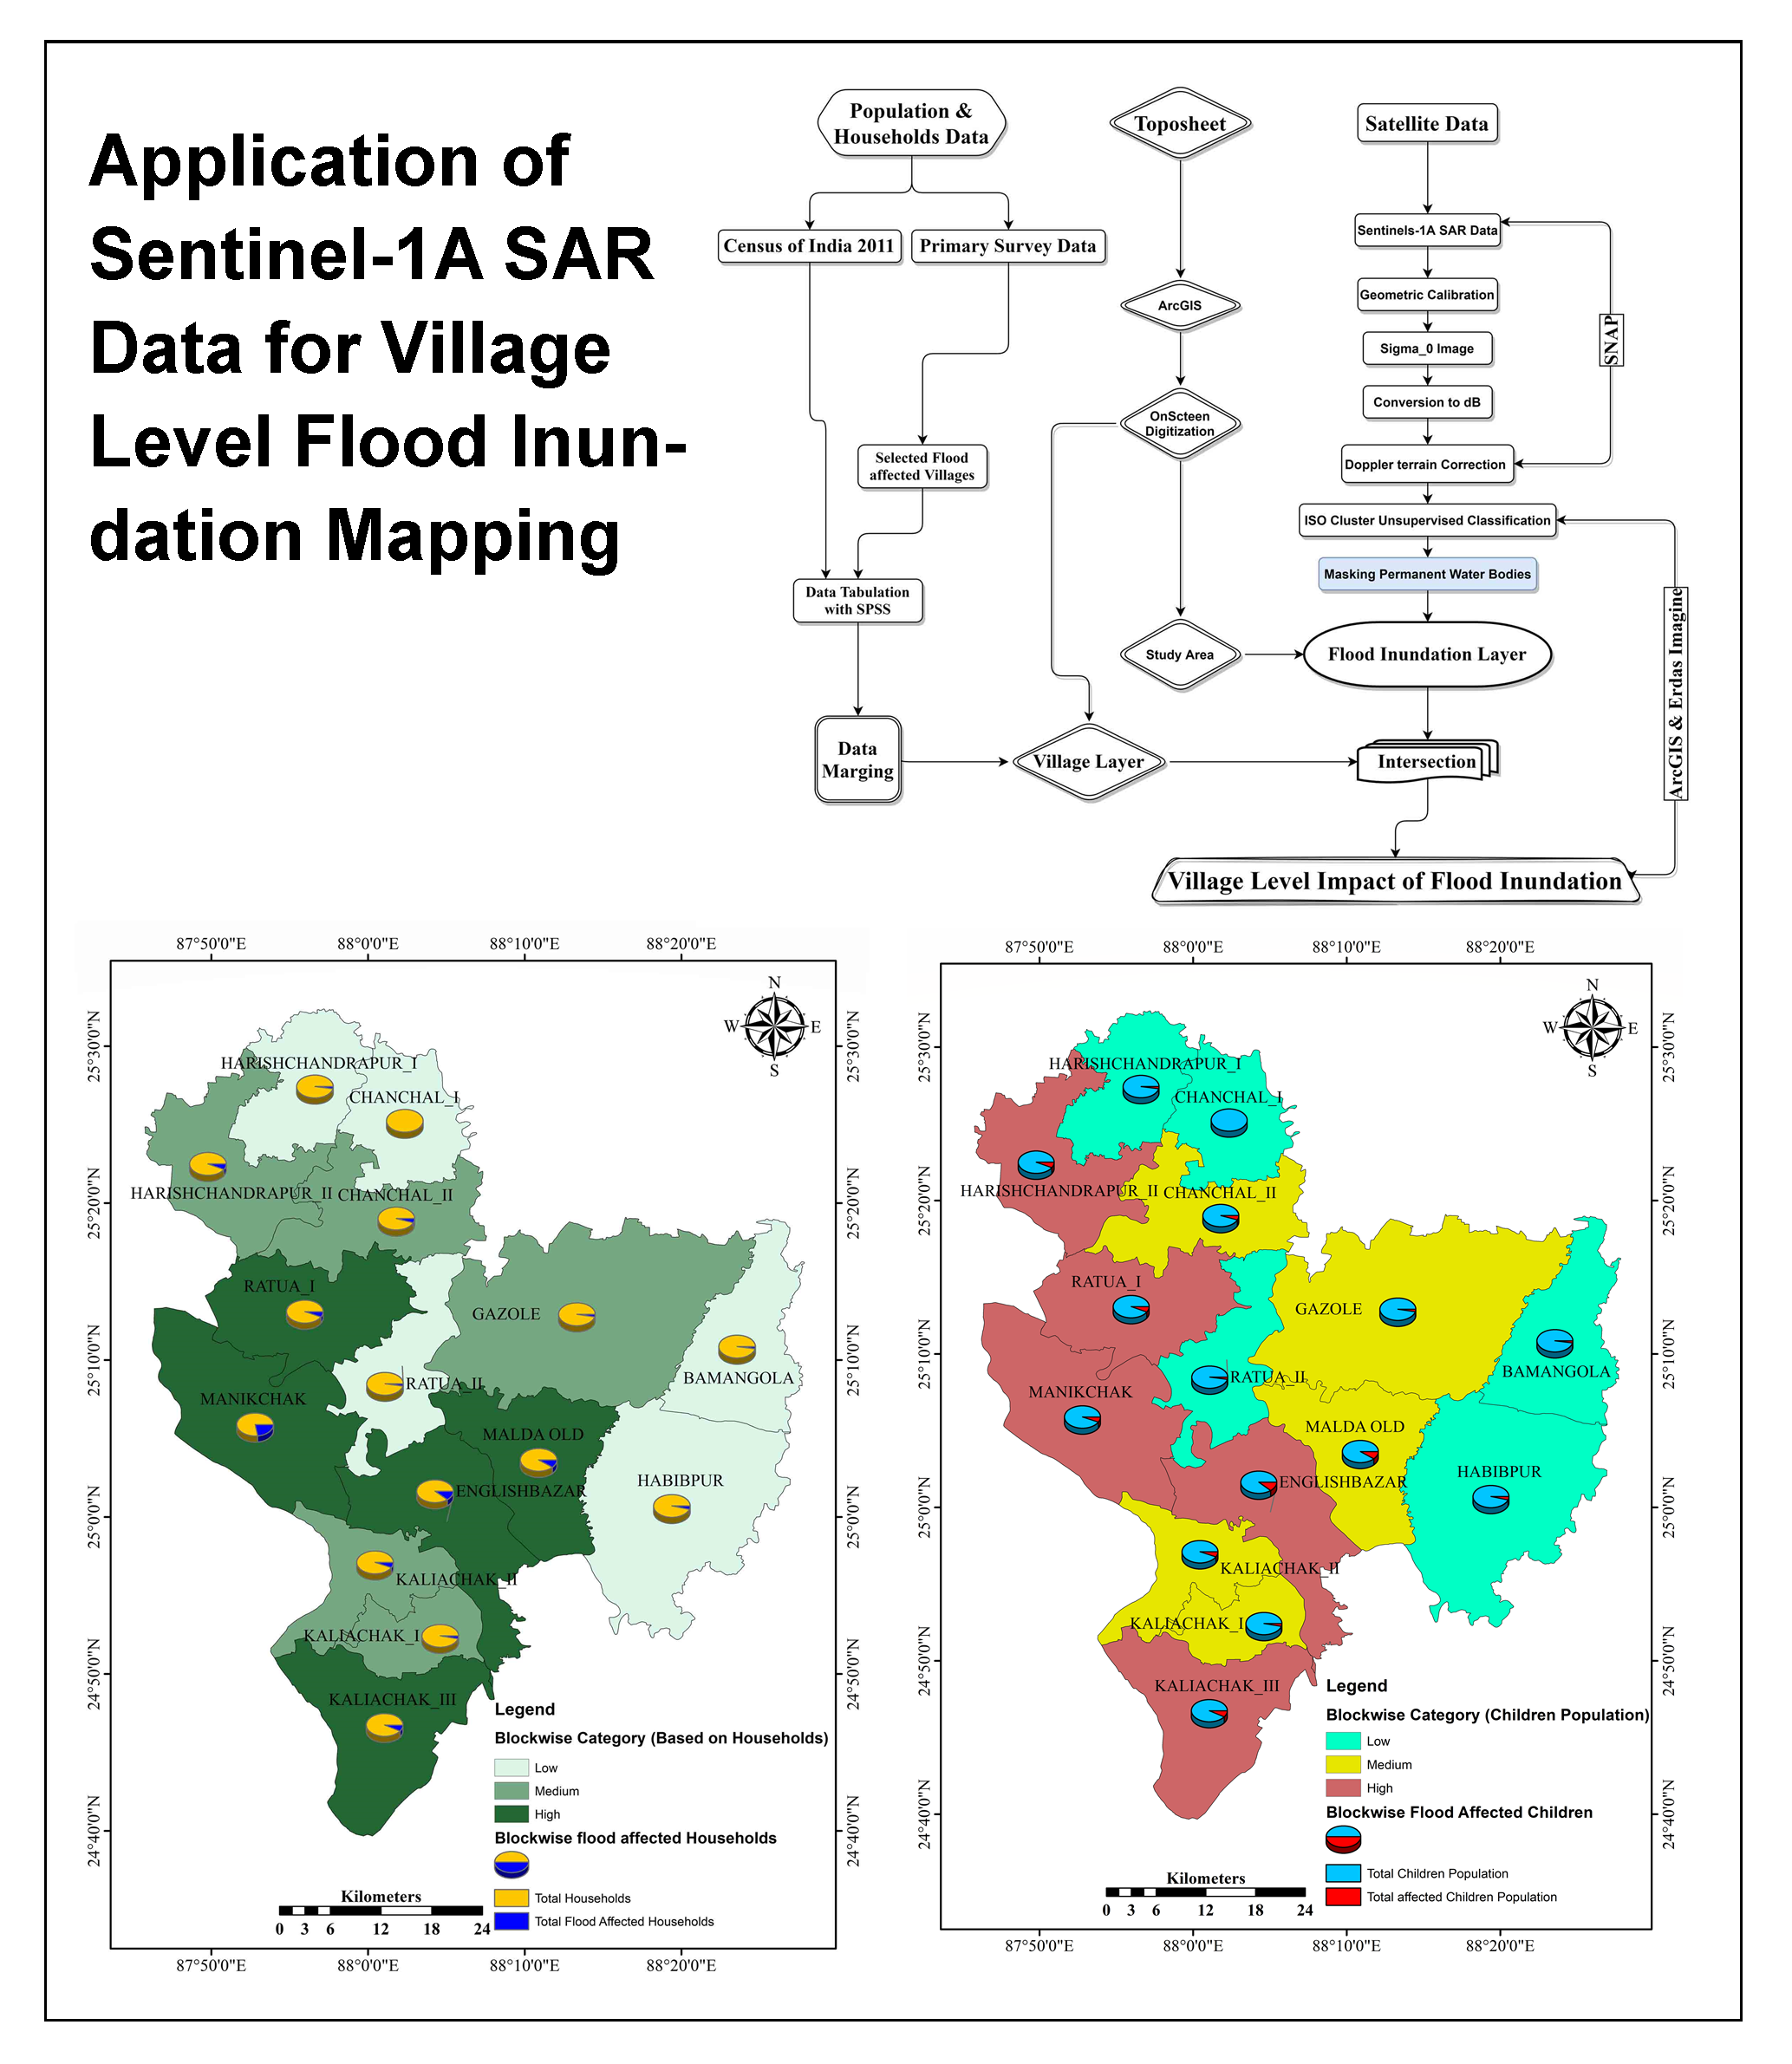
- Figure 6. Flood affected villages
- Figure 7. Vulnerable population
- Figure 8. Effects on population
- Figure 9. Effects on households
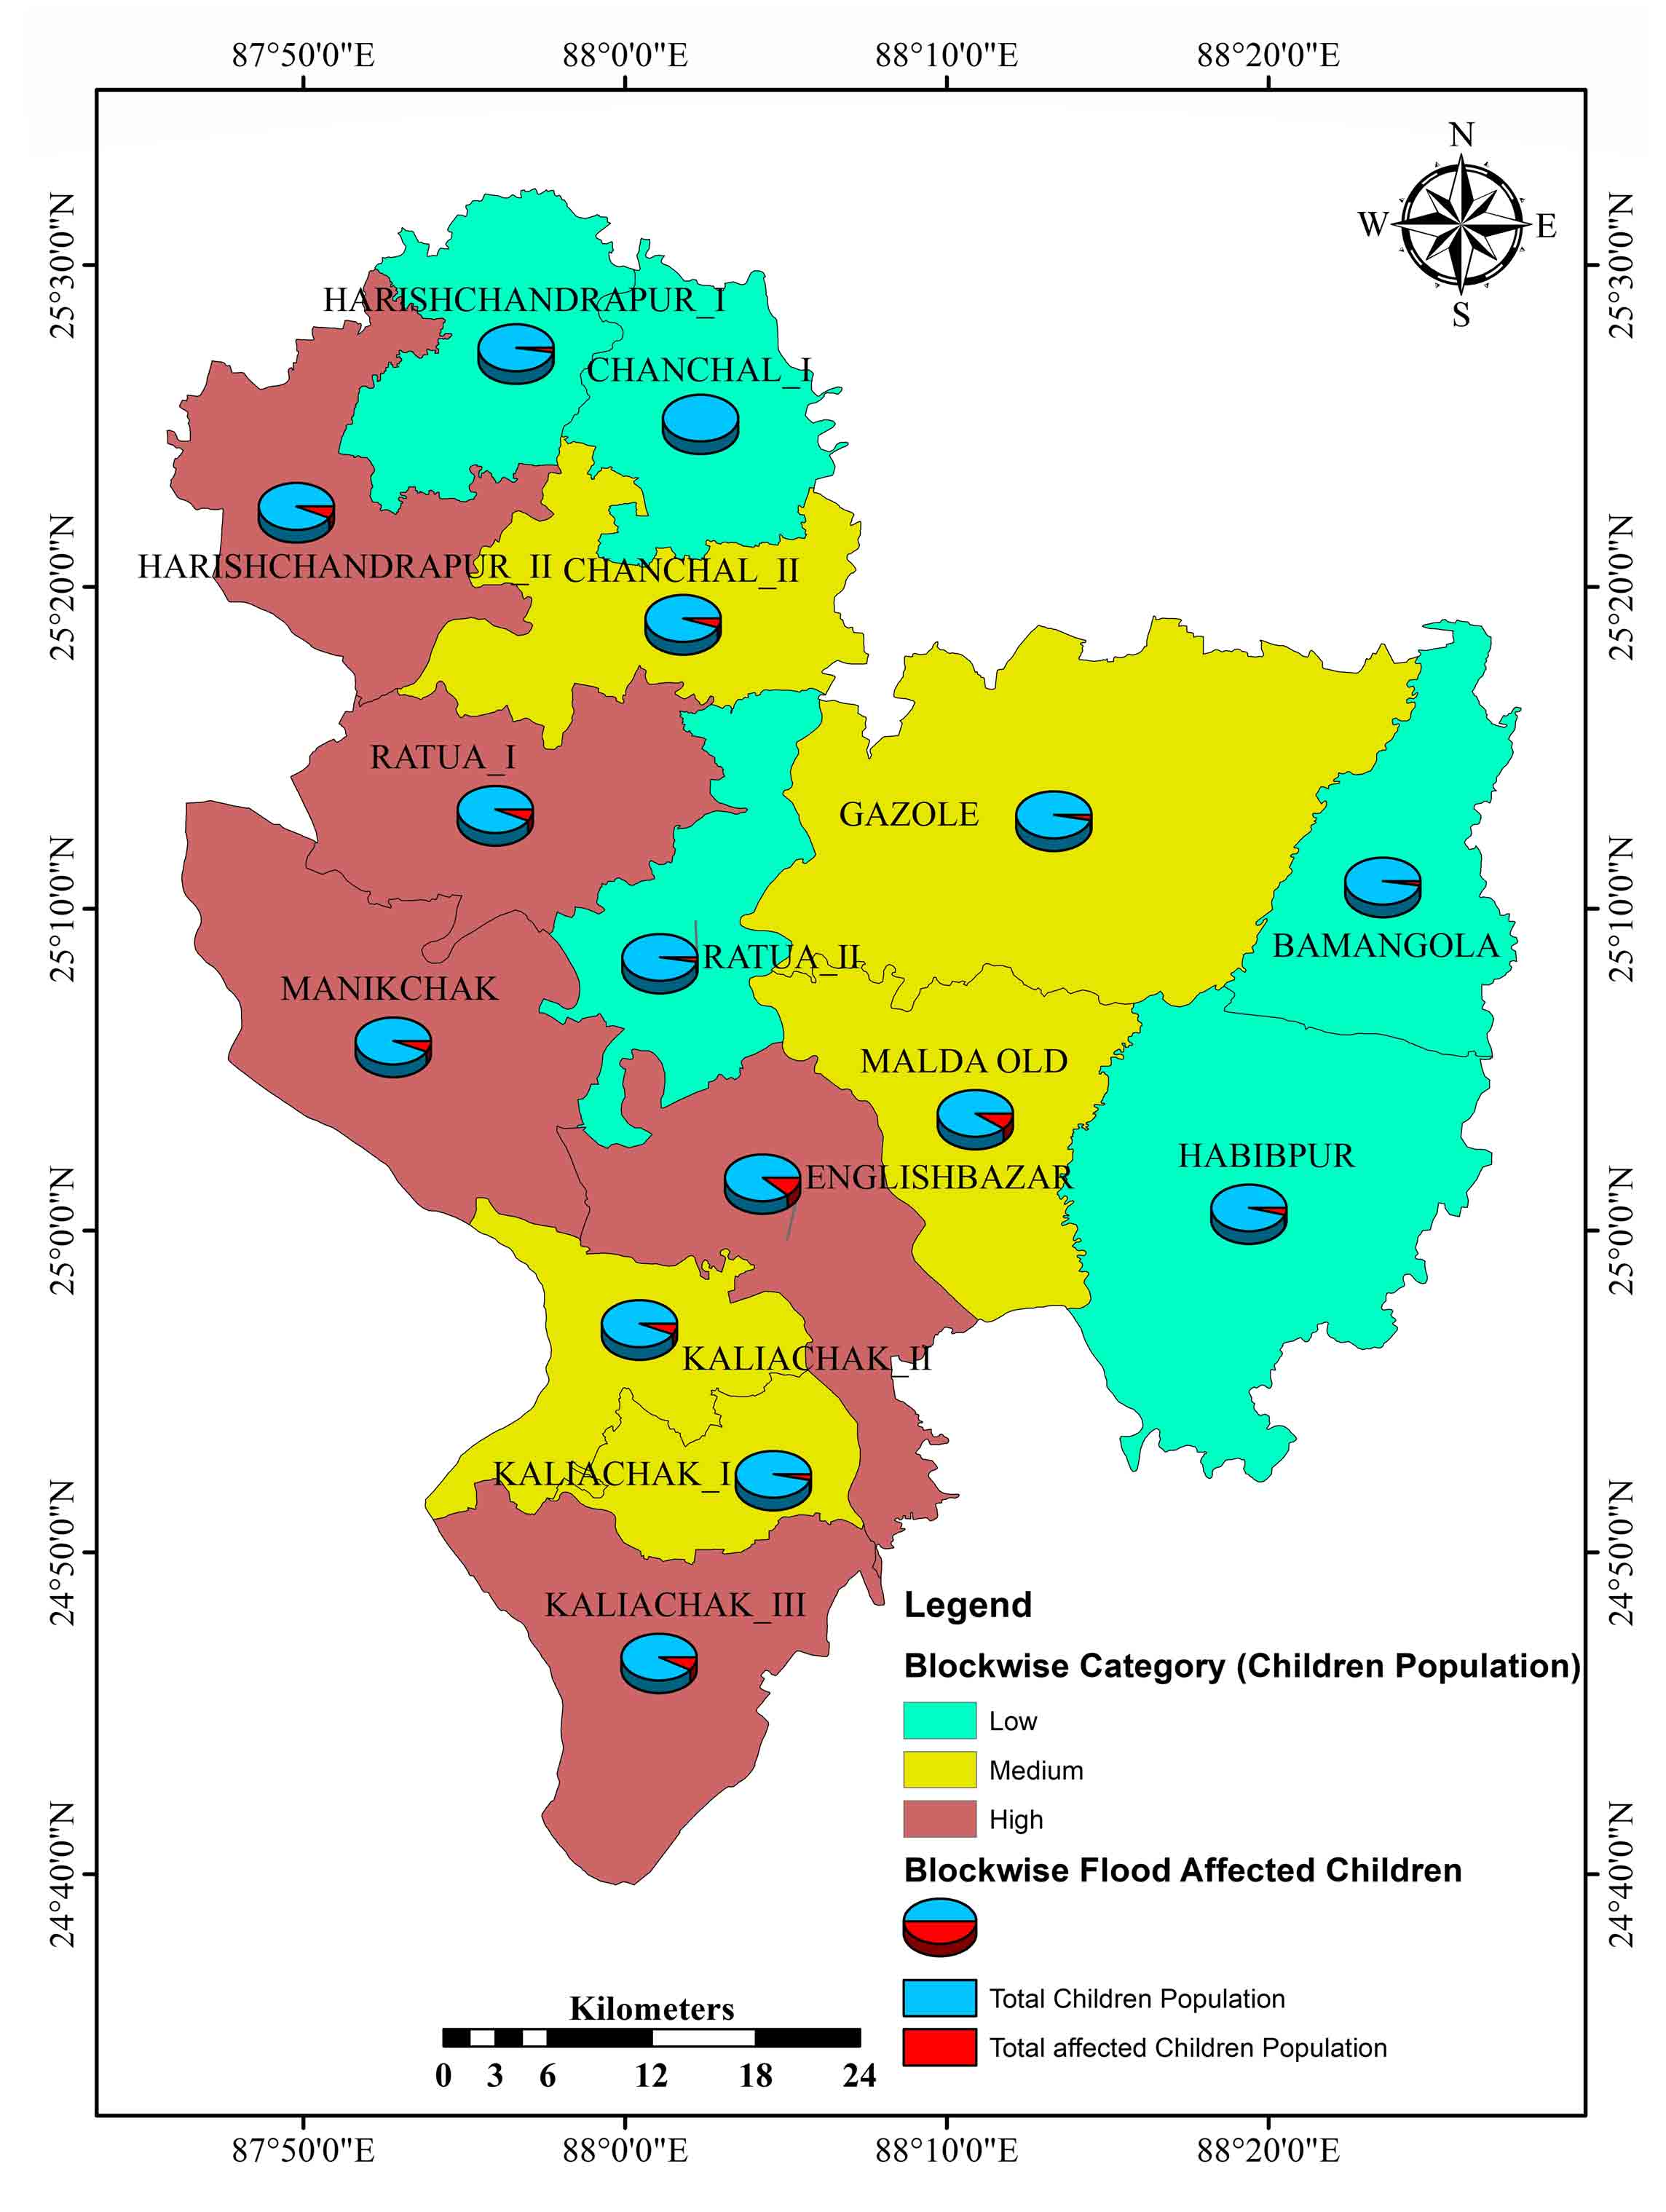
- Figure 10. Effects on children
- Figure 11. vulnerable households
- Figure 12. Vulnerable children
Highlights
- The flood inundated area and land mass were separated based on the backscatter value of SAR data.
- About 380.19 km² on 4th sept 2019 and 338.87 km² on 7th sept 2019 areas were immediately impacted by the flood.
- The delineated inundation layer intersected with the village-level database.
- About 766 (42.81%) villages were highly impacted with 51610 households.
- The children were highly impacted during the floods due to high dependency.
Abstract
It’s no exaggeration to say that floods are among the most common and catastrophic natural disasters, with widespread impacts on ecosystems and human lives. The World Bank has concluded that India is one of the most flood-prone countries in the world. This research has been focused on identification of real-time flood hazard area in the Malda district (India) using SAR data, Sentinel-1A (C-band). ArcGIS, Erdas-Imagine, and SNAP were used for this analysis. These inundation layers were intersected with the Malda district village’s database to determine the full extent of the devastation caused by the floods and finally determined the real-time flood-impacted area (380.19 km² on 4th September and 338.87 km² on 10th September, 2019). It was noted that on 4th September, 766 and 10th September 765 villages were seriously devastated owing to water. Moreover, among the 15 blocks of this district, Harischandrapur-II (75.67%), Manikchak (68.60%) and Kaliachak-III (68.00%) have experienced the most flooding. Finally, in order to estimate the overall population, households and affected by the floods, stratified random sampling was carried out in the flood-impacted villages of the Malda district. The safest blocks are Chanchal-I, Gazole, Harischandrapur-I and Kaliachak-I and the highly vulnerable blocks are Harischandrapur-II, Kaliachak-III and Manikchak. According to the flood influences on children, the most vulnerable blocks are Malda Old, English Bazar, Kaliyachak-III, and Harishchandrapur-II.
Keywords SARRural FloodRiver BasinRemote SensingGangaFlood Inundation
1. Introduction
When it comes to natural disasters, floods consistently rank among the most common and catastrophic (Jonkman, 2005). The danger and economic losses associated with flood disasters are unparalleled by those of any other type of natural disaster. Intense precipitation, melted snow, mudflows, dam or levee failure, tidal waves and storm surges are all potential causes of flooding (Ismail and Mustaquim, 2013; Kumar and Raghav, 2018). The international disaster database and the emergency events database estimate that in the years 2020-2022, 10,741 persons in Asia were killed by natural disasters (Ritchie et al., 2022). They were mostly from Bangladesh, India, China, Indonesia, Nepal, Afghanistan and Pakistan, and the majority of them perished in the floods (Ritchie et al., 2022). Global flood observatory data, data from the Dartmouth Flood Observatory, and data from the near real-time (NRT) Global MODIS Flood Mapping Initiative all point to riverine floods as the primary cause of damage around the world (Wallemacq, 2019; Ahmad et al., 2022). India is a widespread flood-affected country, where on average, 40 million hectares of area (12.17%) are inundated annually, influencing 4.84 million people in the country (Richard Mahapatra, 2020). The lives of individual persons and the Indian economy are both severely impacted by the country’s frequent floods. India spends 0.84 percent of its Gross Domestic Product (GDP) on flood mitigation due to the severity of its flood hazard condition (Wallemacq, 2019). Bihar, Assam, West Bengal, Odisha, Meghalaya, Arunachal Pradesh, Kerala, Tamil Nadu, Karnataka and Tripura are the most prone to flooding due to their proximity to rivers. In 2022, the flooding would spread throughout the Indian states of Gujarat, Maharashtra, Assam, Telangana and West Bengal. Assam, a state with 2,930 villages and a population of 1.9 million, has been hit hard by floods. In the state of Maharashtra, almost nine thousand people had to leave their homes. Eight districts in Gujarat were hit hard by floods. In 2022, flooding affected three districts in West Bengal: Jalpaiguri, Malda and Howrah. In the wake of the floods in West Bengal, eight persons were killed and numerous others are still missing in the Jalpaiguri district flash flood. In West Bengal, the annual monsoon flooding is estimated to cover 8,000 square kilometers. Particularly vulnerable to flooding are the areas surrounding the lower Ganga river (WBDM and CDD, 2020). The rivers which pass through West Bengal are Ganga, Bhagirathi-Hoogly, Damodar, Mahananda, Ajay, Kangsabati, Teesta, Torsa, Jaldhaka, Raidak-I, Raidak-II and Subarnarekha river have been the causes for the floods in the monsoon season in West Bengal (WBDM and CDD, 2020). It affects most South Bengal districts, such as Howrah, Murshidabad, North 24 Parganas, South 24 Parganas, Hooghly, Burdwan, West Midnapore, East Midnapore and Uttar Dinajpur, Darjeeling, Jalpaiguri and Cooch Bihar, Malda in North Bengal.
In this analysis, we looked at the flood scenario in the Malda district at several different times. The flooding in this area is mostly brought on by the tropical monsoon (seasonal) rains and the snowmelt that flows down the Ganga River (Gangotri Glacier). From the historical flood data (1972, 1975, 78, 79, 80, 82, 83, 88, 89, 93, 98, 99, 2000, 2003, 2004, 2009, 2013, 2016, 2017 and 2019) in this area, flooding has been recorded at a frequency of once every three years (WBDM and CDD, 2020). During the recent 2017 flood, approximately 2.5 lakh people were severely affected, covering 5000 households in this district (Richard, 2020). The annual flooding in Malda district affects nearly every blocks. This area regularly suffers from flooding.
The use of remote sensing in the management of water resources has grown over the past two decades. Modeling surface water and assessing flood damage are two more common applications for Geographic Information Systems (GIS) (Tadesse et al., 2022). Satellite Remote Sensing (RS) data provides detailed information about the Earth’s surface (Tiwari et al., 2020) during different time intervals. Many researchers have applied Multispectral Scanner System (MSS) RS data for flood analysis (Samanta et al., 2018), where they tried to delineate the flood inundation layer by creating the band ratio between visible green and near-infrared (NIR) or Middle Infrared (MIR) spectrum (Qi et al., 2009; Munasinghe et al., 2018; Mehebub et al., 2015). In optical remote sensing data, real-time flood mapping is challenging due to the cloud coverage in the study area (Mehebub et al., 2015; Li et al., 2015). The optical RS spectrum cannot penetrate the clouds (Qi et al., 2009). The microwave portion of the remote sensing spectrum is not affected by the day/night cycle or the weather, therefore it can see through clouds (Wang et al., 2019). The data obtained from SAR [Synthetic Aperture Radar] satellites, which is a form of microwave remote sensing, is invaluable for flood mapping (Manjusree et al., 2012). As a result, it’s a powerful resource for keeping an eye on flooding conditions and creating a map of the affected area in real time (Manjusree et al., 2012). This inundation layer can be used for further flood frequency analysis (Anusha and Bharathi, 2020). The flood inundation layers are prepared by applying the various threshold value of backscatter spectral reflectance’s of SAR data. In SAR data, the land surface appears brighter, showing a high reflectance value and water appears in black because of the low reflectance of backscatter (Rahman, 2006). Various researchers have mapped the flood-affected area using the spectral signature thresholding technique of Radarsat-1 (Canadian Satellite) data and Sentinels-1A data (European radar imaging satellite) (Rahman, 2006; Shen et al., 2019). The RADARSAT and Sentinels-1A both are C-Band microwave remote sensing satellite data. Both have four types of polarization data that are HH (horizontal transmit and horizontal receive), VV (vertical transmit and vertical receive), HV (horizontal transmit and vertical receive), and VH (vertical transmit and horizontal receive). In RADARSAT, HH polarization is used for flood mapping and in sentinels-1A, VV polarization is used for flood mapping (Manjusree et al., 2012). The use of optical remote sensing data for flood analysis is common nowadays. In Malda district, various research works have been carried out related to the flood analysis using remote sensing (Optical) data (Mehebub et al., 2015; Sivanpillai et al., 2020; Munasinghe et al., 2018). Notably, the Malda region did not show any evidence of SAR-based flood inundation mapping (Mehebub et al., 2015).
The main objective of this study is to prepare a flood inundation layer for the Malda district (2019 flood) by using SAR data (Sentinels-1A) and finding out how many villages and households were influenced by this 2019 flood.
2. Study Area
Geomorphologically Malda district comes under the older and young alluvial plain area. It occupies the 3733 km² geographical area of this district. On the eastern side of the district is Bangladesh, the western side is Jharkhand and Bihar, the northern side is North Dinajpur district (WB), and the southern side is Murshidabad district (WB). The geographical extent of this district is 24º40΄20΄΄to 25º 32΄08΄΄N and 87º45΄50΄΄ to 88º28΄10΄΄E (Figure 1). The head-quarter of this is Malda Sadar, which is located in the south-eastern part of this district. This district has 15 blocks and 1789 villages under 16 gram-panchayats (Mehebub et al., 2015). The soil of this district is mostly loam type, but sandy, silt and clay types have also been observed (Pal and Talukdar, 2019). Most places have a 20m contour line but some areas (the eastern side of the district) have contour line variations up to 60m (Mazumder, 2004). The settlement pattern is a compact type and the population density of this district is 1100/km² according to the census 2011. This district’s major problem is a severe flood attack, which is very common every year from June to September, due to heavy rainfall (1100mm to 1692mm) and huge water load from the rivers Ganga, Fulahar, Kalindri, Mahananda, Purnovoba, etc. which spreads in the surrounding low-lying areas. On the other hand, these rivers have a local baseline (The Farakka Barrage on the Ganga River) that forces to change the flow direction (Mazumder, 2004; Das et al., 2018; Sarda and Das, 2018). In these conditions, the water enters from the Estuary upward (extra burden water of the Ganga River) (Das and Samanta, 2022). Due to this hydro-geomorphological and climatic (tropical monsoon climate) condition, the entire study area is frequently affected by the flood disaster. Therefore, to minimize the damages and losses caused by floods, it is necessary to prepare a real-time flood inundation map (Bhanumurthy et al., 2017). It has been reported by the Agricultural Department of Malda (2018) that the floodwaters from the Ganga, Mahananda and Fulhar rivers have flooded a huge tract of agricultural land in around 112 gram panchayats of the district. Paddy, jute, maize and vegetables were cultivated on about 76,000 hectares of land and were the most heavily impacted crops.
3. Materials And Methods
3.1 Data Source
This study was carried out based on primary data and microwave remote sensing SAR (synthetic Aperture Radar) data (Shen et al., 2019). The multi-dated (4th September 2019; 07th September 2019) dual-polarized (vertical transmit and vertical receive and horizontal transmit and vertical receive) sentinels-1A (Table 1) data was collected from the Copernicus Data Hub (Wang et al., 2019; Tripathi et al., 2020; Attema et al., 2007). The resolution of the data is 5 20m and its swath size was 250km2, which is Interferometric Wide (IW) mode. That means it has captured three sub-swaths using TOPSAR (Terrain Observation with Progressive Scans Synthetic Aperture Rader) (Table 1). The sentinel-1 mission launched two satellites, Sentinel-1A and sentinel-1B (ESA, 2021), both having C-Band SAR data. Sentinel-1A was launched on 3rd April 2016, whereas Sentinel-1B was launched on 22nd April 2016 (Agnihotri et al., 2019). Another side, social data have been taken from the census of India (2011), village-level flood-affected population and household data were acquired by the primary survey method. The survey was conducted among the blocks’ pre-decided villages (a total of 766). The inundation and village layers were intersected to stain the district’s inundated villages. The most concerning parameters of this survey were the total number of flood-affected population, total number of flood-affected households and total number of flood affected population under 06 years.
Table 1. SAR Data
|
Sensor |
Data |
Pass type |
Resolution |
Source |
|
Sentinel-1A |
4th and 7th September 2019 |
Ascending |
5 × 20m |
Copernicus Data Hub |
3.2 Data Processing
In the present study, the collected data (Sentinel-1A) was processed on SNAP (Sentinel Application Platform) and ArcGIS software (ver. 10.4). The collected data was geometrically, radiometrically and terrain calibrated on SNAP software. The data was also filtered by applying the de-Speckling method (refined Lee-Filter) (Manjusree et al., 2012). Lastly, the data were classified by the unsupervised method and recoded the water pixels (Figure 2). The threshold pixels value of water and land surface were identified (Rahman, 2006) by observing the backscatter spectral reflectance of data (Figure 3). The surveyed primary data was processed on SPSS software (Statistical Package for the Social Sciences); firstly, the collected information was tabularized systematically. It was further analyzed and categorized based on the flood influences.
3.3 Flood Inundation Layer
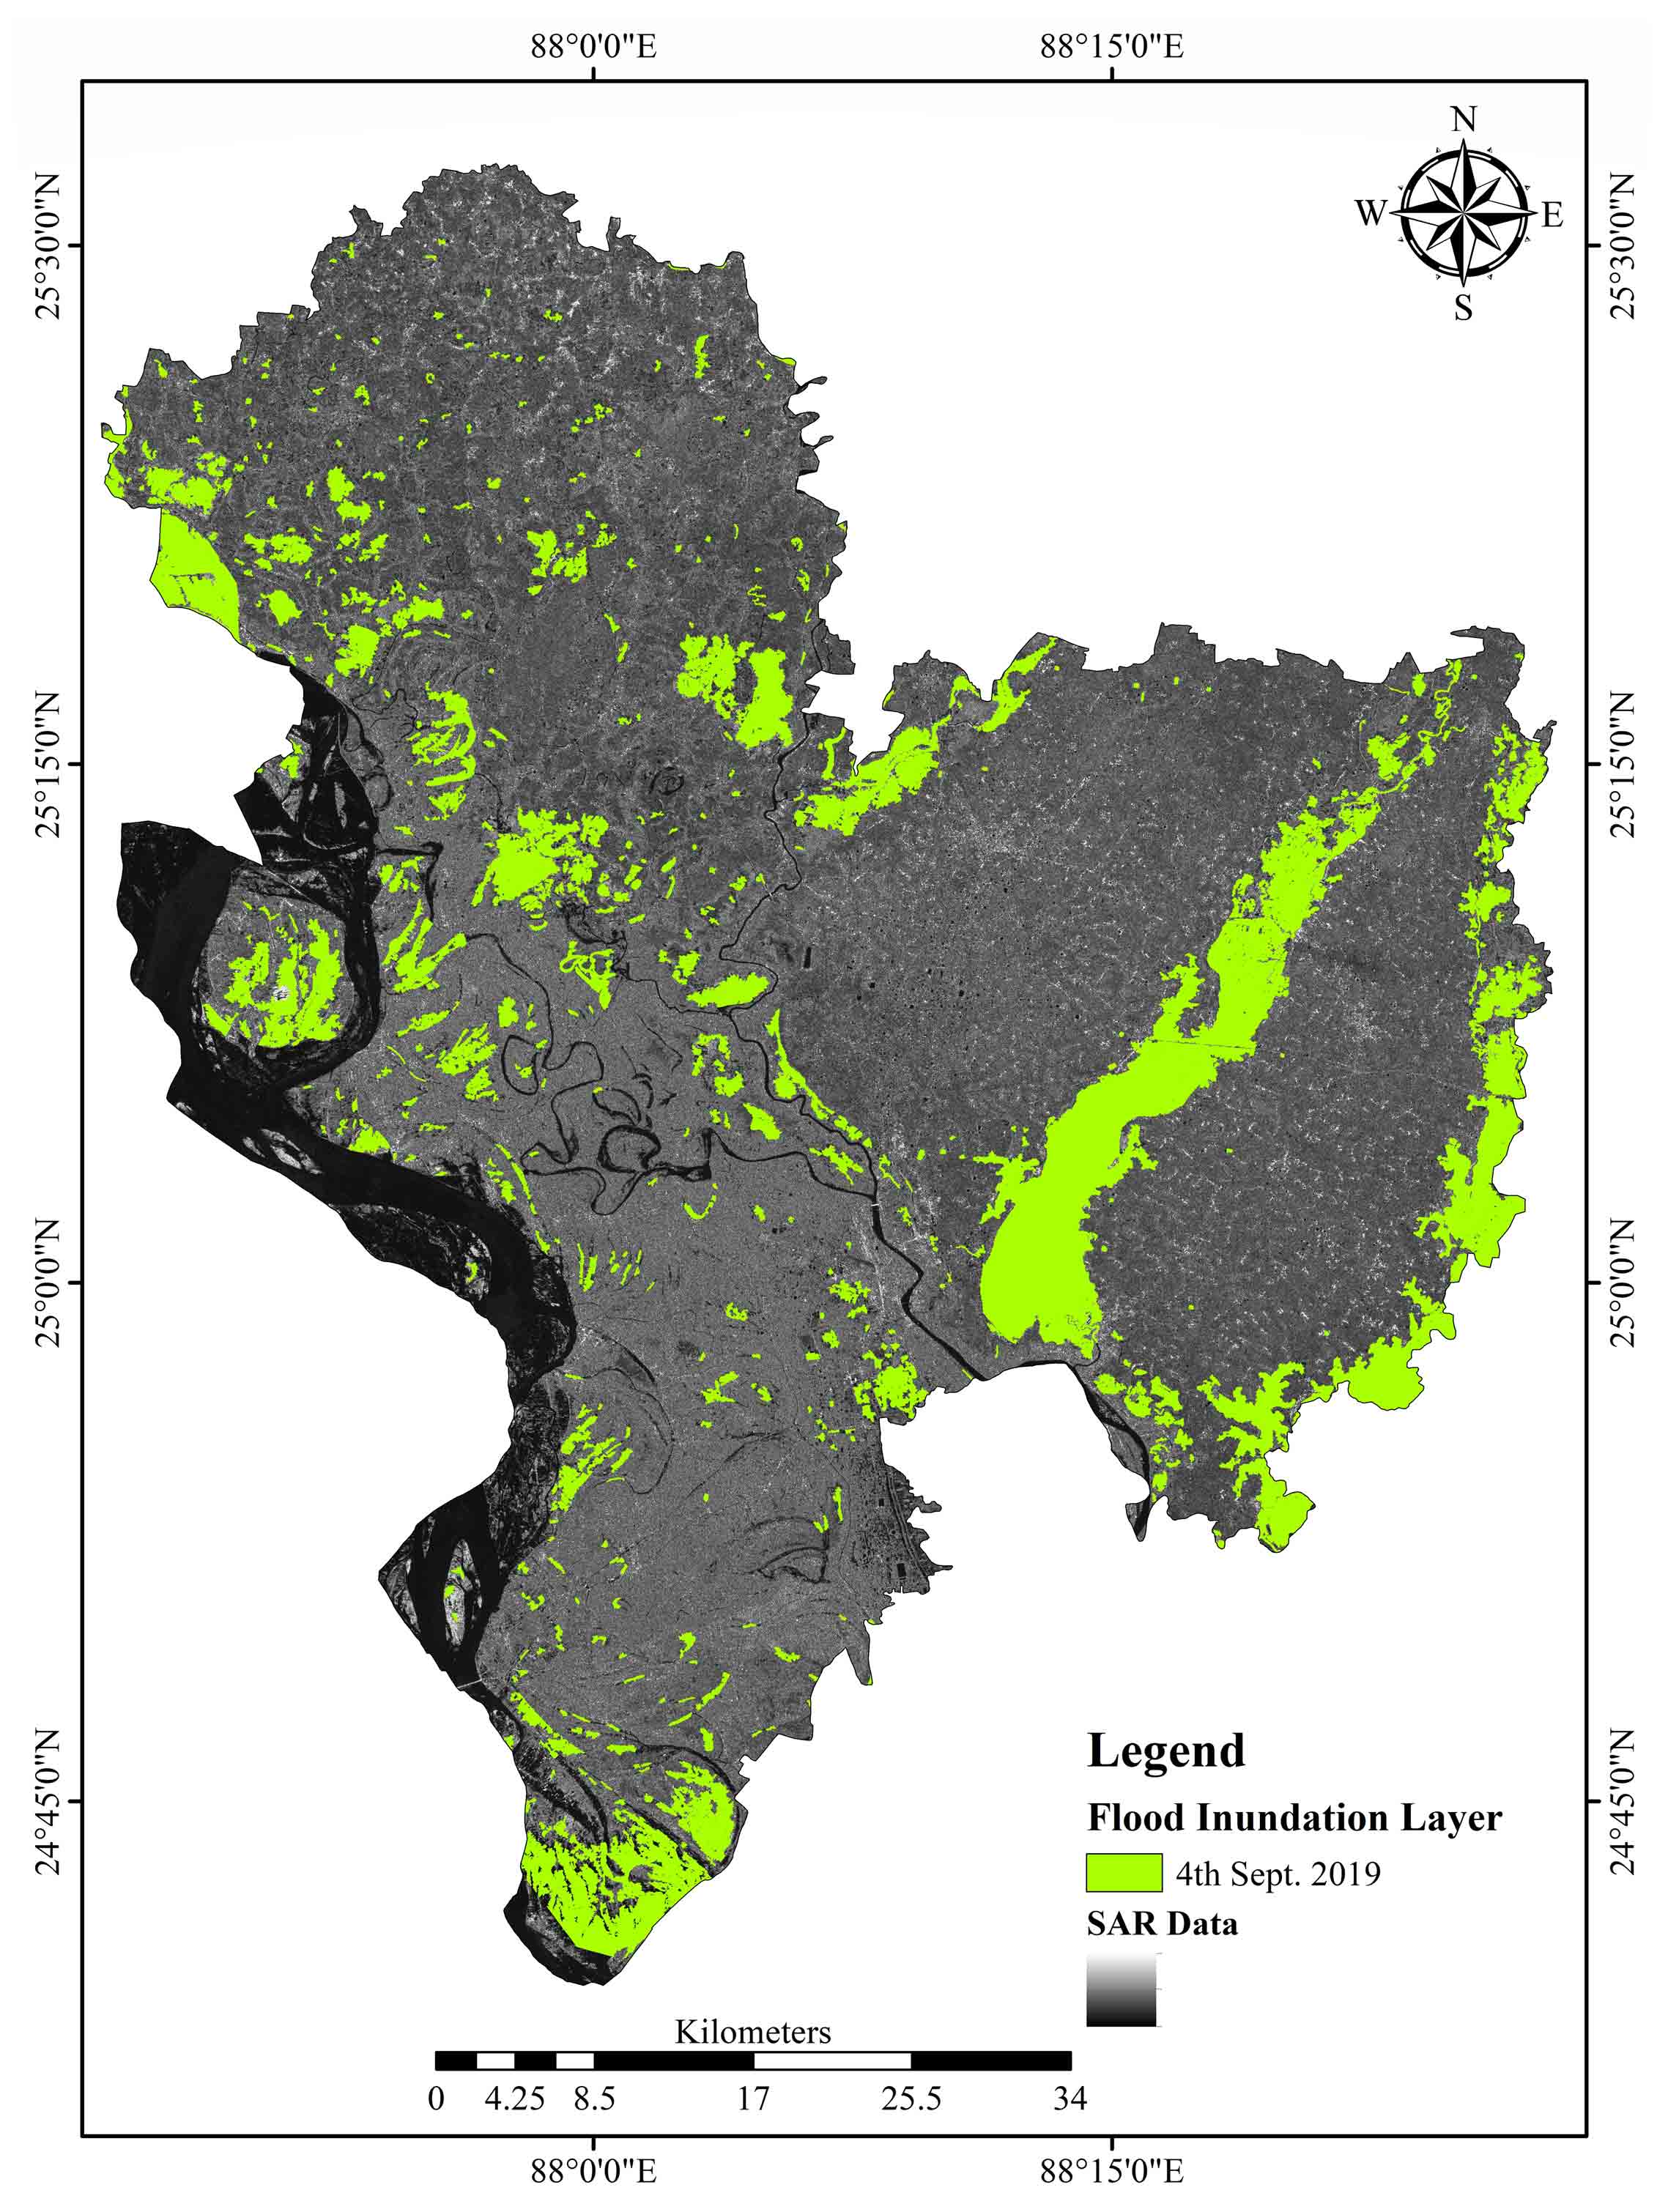
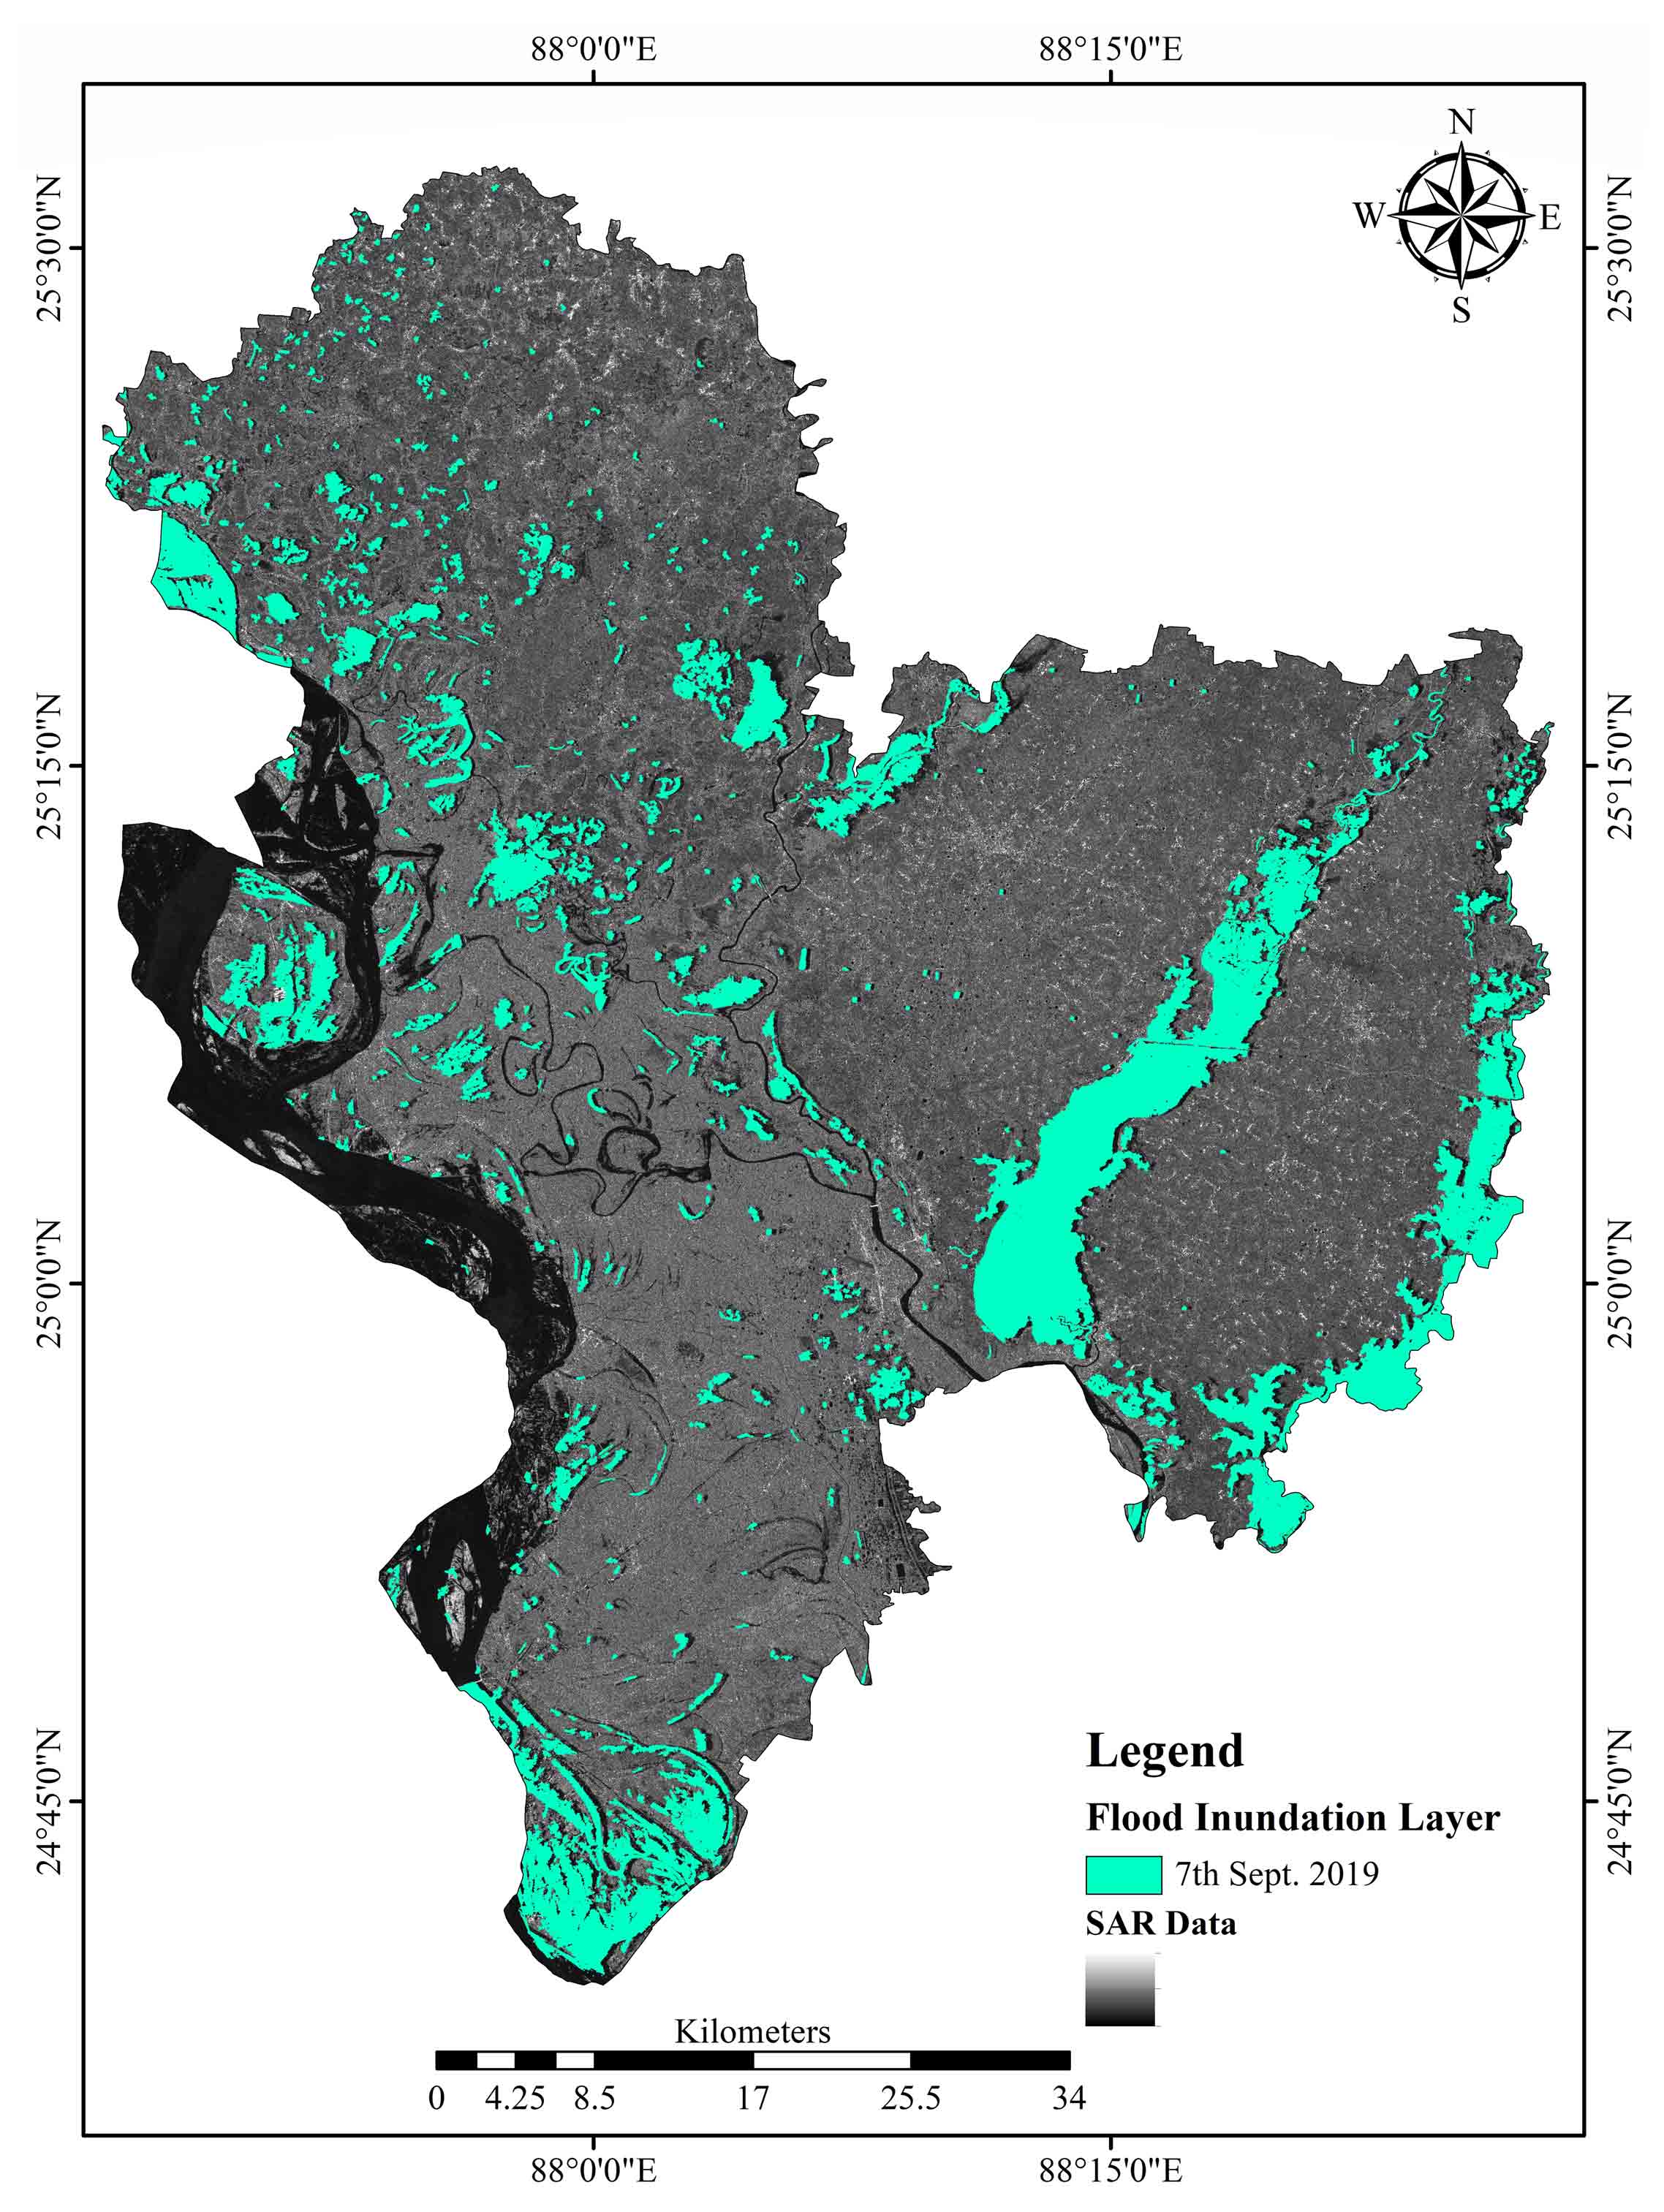
Sentinel-1A data on the geospatial platform SNAP (Sentinel Application Platform) was used to create a map of the flooded region in the Malda district (Mudi and Das, 2022; Tripathi et al., 2020). The sigma_ϴ image band was initially obtained by applying the radiometric calibration method to the data (SAR data). This sigma_ϴ image was converted from linear to non-linear scale (dB, decibel) to create the virtual band (Manjusree et al., 2012) that call dB image. This virtual band clearly distinguishes water bodies from the land masses. In the virtual band, water bodies appear black, and land surfaces appear white. After that, the Doppler terrain correction process was applied to correct this data’s terrain. The terrain corrected sigma_ϴ image was again converted from linear to non-linear scale (dB) band, which provided better visualization of the water signature (Wang et al., 2019). Lastly, the ISO Cluster Unsupervised Classification technique was applied to the sigma_ϴ images on ERDAS IMAGINE 2015 (Munasinghe et al., 2018; Anusha and Bharathi, 2020). The recoding operation and the thresholding methods were used to separate the water pixels from land masses (Anusha and Bharathi, 2020). After that, permanent water bodies (Streams/rivers/lakes/ponds) were masked from the delineated flood inundated layer and the final flood inundation layer was mapped for this district (Shen et al. 2019). The flood inundation layer further intersected with the village-level database to demarcate the district’s total flood-influenced villages (Figure 2).
4. Results And Discussion
The present study was based on the backscatter spectral reflectance (Figure 3) of Sentinel-1A data and using the methodology mentioned earlier, a real-time flood inundation layer was prepared (Mudi et al., 2022; Shen et al., 2019). In 2019, the flood of Malda district was observed between 2nd to 10th September. During this period, the Sentinel-1A satellite passed through the Malda district twice, i.e., 4th September 2019 and 7th September 2019 (both were ascending passes). The first flood inundation layer (4th September 2019) (Figure 4) was observed at 380.19 km² (11.27%) and the second layer (7th September 2019) 338.87 km² (9.99%) area were (Figure 4) inundated of this district during the flood occurred. Also, it was observed that 766 villages and 51610 houses were affected on 4th September 2019, and 765 villages and 49,561 houses were on 7th September 2019 (Figure 5). In the second layer of flooding, which occurred on September 7, 2019, the water level and the affected area gradually began to recede, which was calculated at 41.32km2. Not only had the flooded region shrunk, but so had the total number of villages (765), as well as the number of households impacted by the flood (49561) (Table 2).
Table 2. Flood inundation
|
4th September 2019 |
7th September 2019 |
Difference |
|
|
Area (km²) |
380.19 |
338.87 |
41.32 |
|
Villages |
766 |
765 |
1 |
|
Households |
51610 |
49561 |
2049 |
4.1 Blockwise Distribution
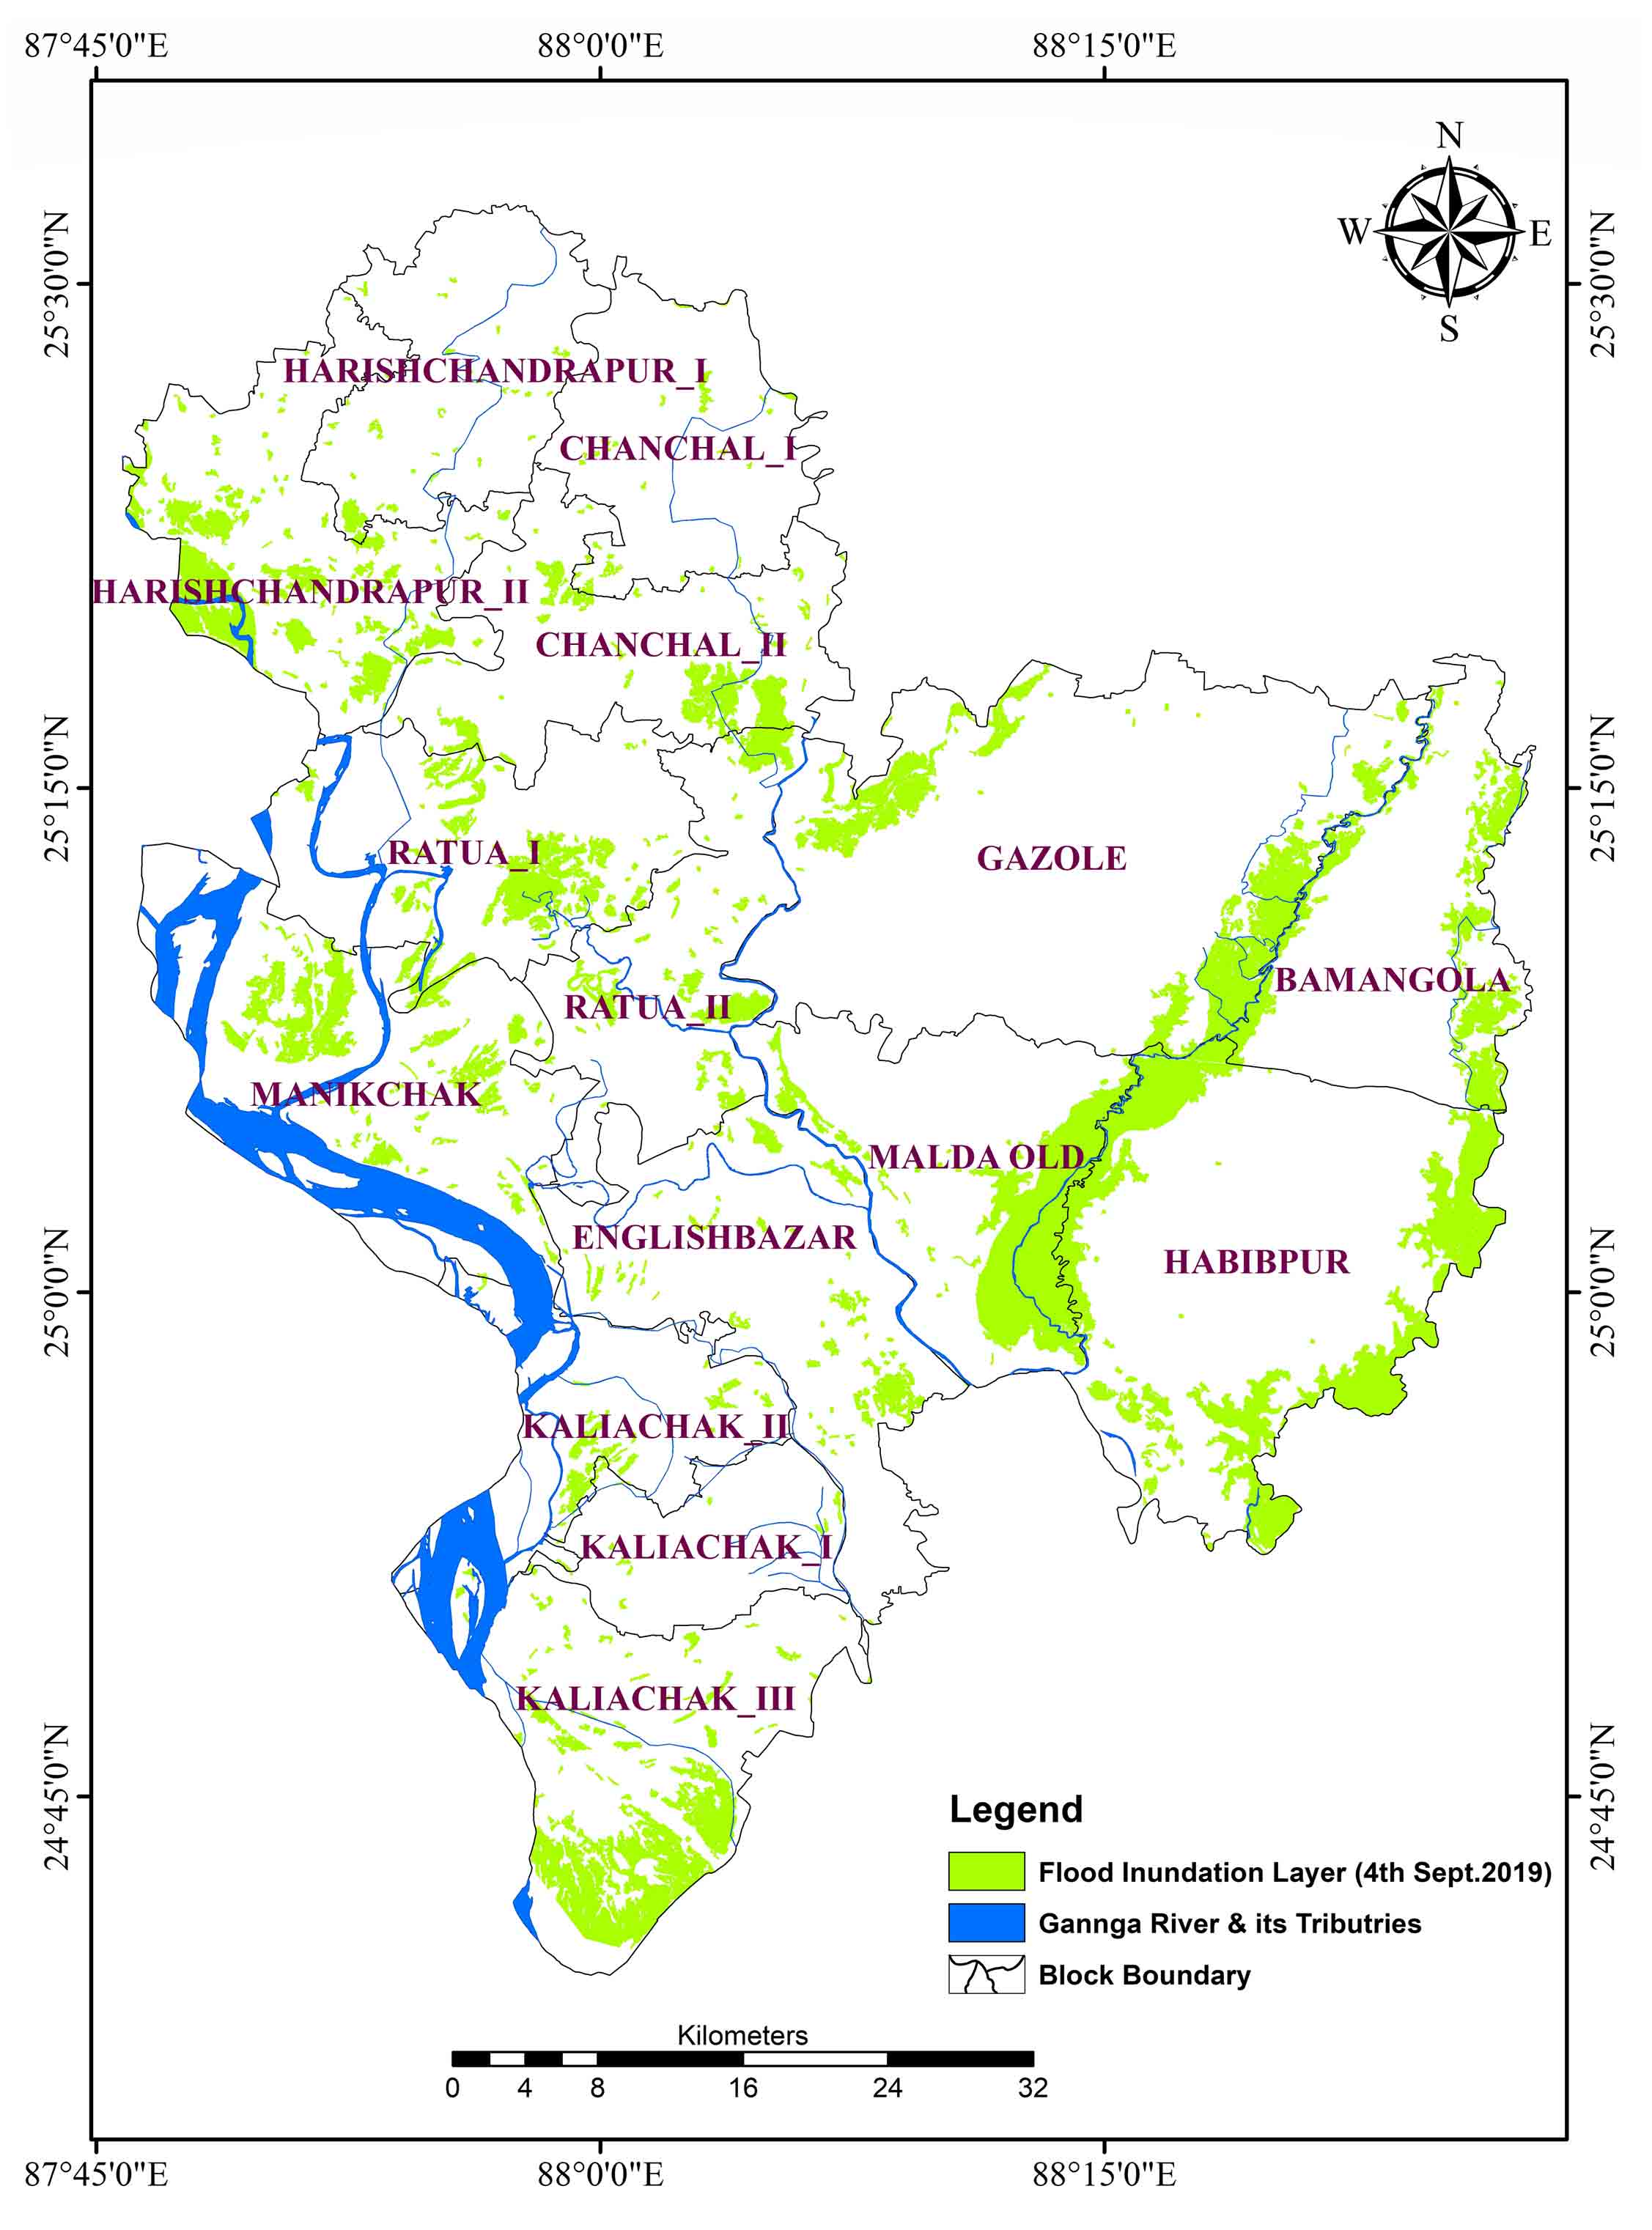
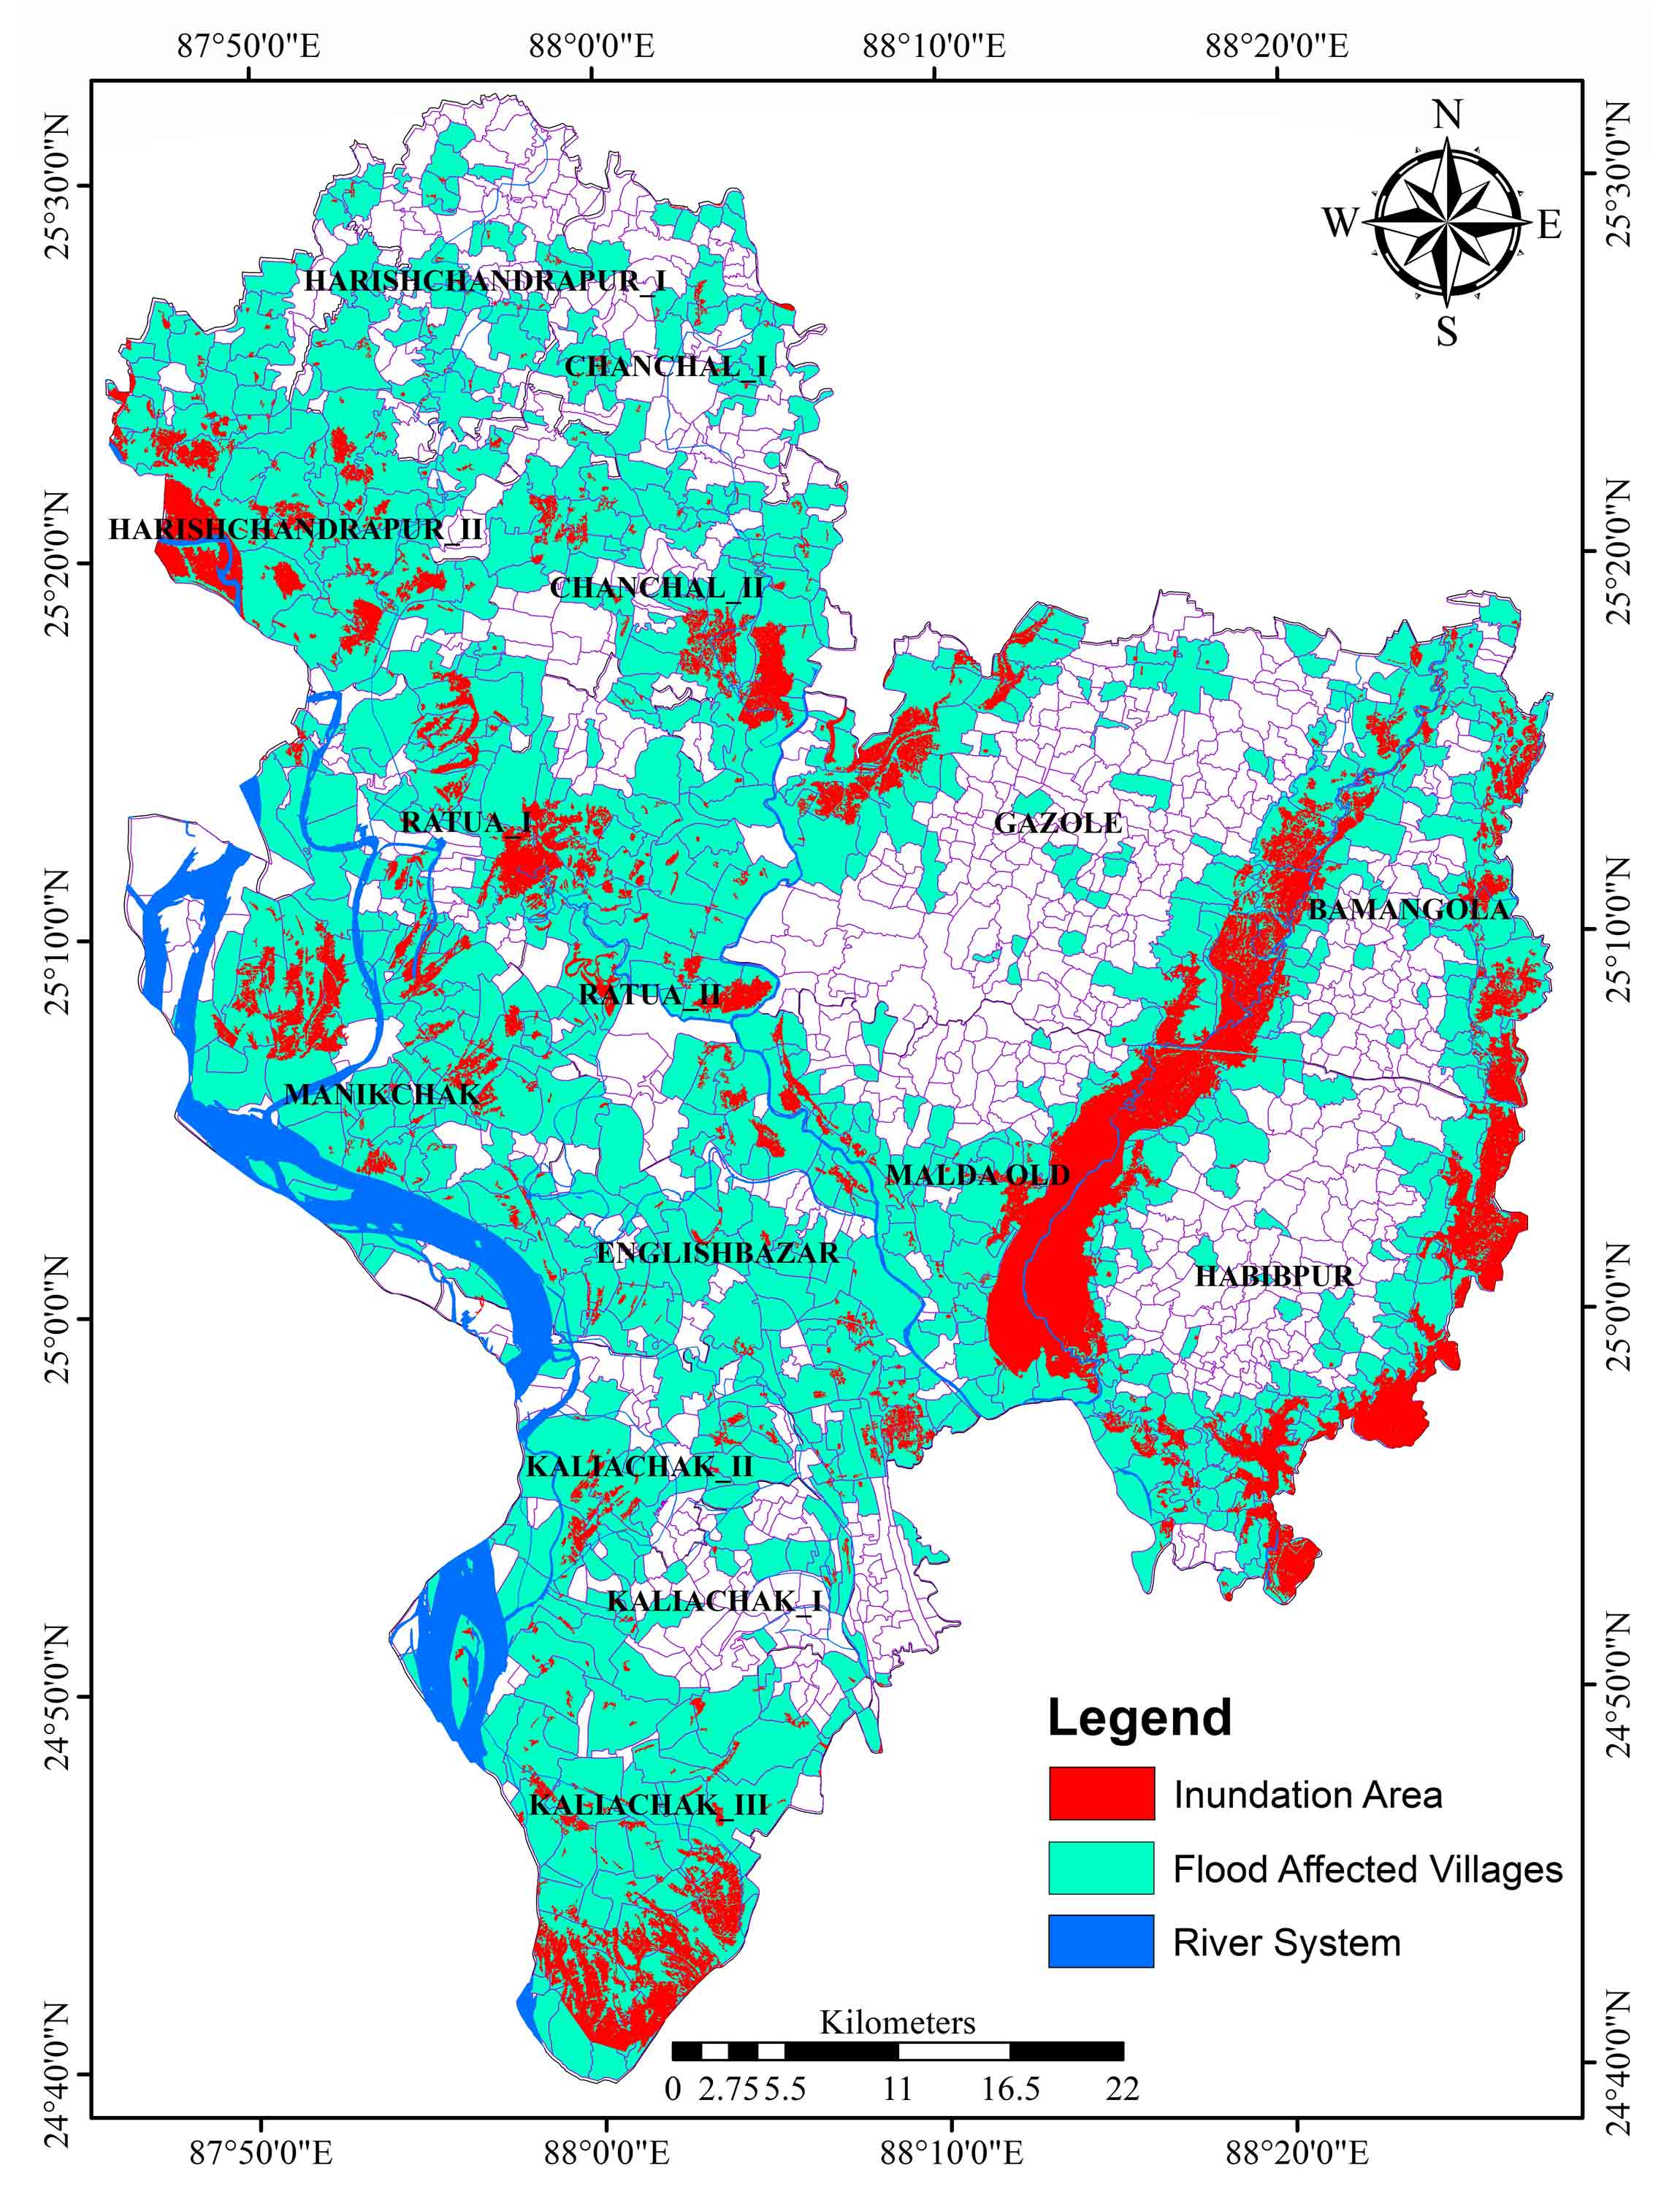
A meso-level investigation of this area would look at the distribution of flood dangers on a block-by-block basis. The Bamangola block comes under this district’s medium-type flood-affected block and is located between the Purnovoba River in the east and the Tangon River in the west. The total population of these blocks is 80917. Among them, 9320 population are under 06 years. The total number of households in these blocks is 17734 (Figure 5 and 6). In the 2019 flood, the blocks of 56 villages (total 143), 3407 persons, 392 children, and 747 households were highly affected (Table 4). Likewise, in Chanchal-I (low type flood-affected block) blocks, total flood-affected villages were 29 (Total 101), the population was 1875 (Total 61278), and children were 243 (Total 7948), and 451 (Total 14748) households (Table 4). The Chanchal-II blocks come under the medium flood-affected block. Chanchal-II blocks 39 (Total 92) villages, 10282 (total 120542) population, 1684 (Total 19745) children, and 2122 (total 24881) households were affected due to the 2019 flood The English Bazar blocks 62 villages were influenced due to floods among 136 villages, 59834 population out of 384044, 9267 children out of 59381, and 12622 households out of 81014 were affected by the flood. According to its inundation area, the Englishbazar blocks fall under the medium types of flood-influenced blocks. Though the Gazole block falls under the low flood-affected zone, 62 villages (Total 293), 9967 Population (Total 100268), 1239 children (Total 12468), and 2131 households (Total 21435) were severely affected by the 2019 flood (Table 4). The Habibpur block is one of the highest flood-affected blocks in this district, with the maximum number of villages affected by the flood. The Habibpur blocks 151 villages (Total 291), 8175 population (Total 127334), 1021 children (Total 15899) and 1836 households (Total 28605) were affected by the flood (Table 4). The Harishchandrapur-I comes under in low flood zone, but the Harishchandrapur-II comes under the high flood-affected zones. In the Harishchandrapur-I block, 31 villages (Total 105), 4717 population (Total 75467), 704 children (Total 11259), and 1046 households out of 16730 were seriously influenced due to the flood (Table 4). Similarly, in the Harishchandrapur-II block, 56 villages were immensely affected by the flood among 74 villages, 17359 population (Total 223981), 3039 children (Total 39211), and 3395 households (Total 43806) were severely affected by the flood (Table 4). Kaliachak-I, Kaliachak-II, Kaliachak-III, and Manikchak blocks are located near the Farakka barrage and the left bank of river Ganga. These four (4) blocks are immensely affected by the floods and bankside failure issue every year. According to the flood influences, the Kaliachak-I block fall under the less affected zone, Kaliachak-II in the medium and Kaliachak-III and Manikchak block fall under the high flooded zones. In Kaliachak-I block, 15 villages (total 66), 13098 population (Total 93958), 2161 children (Total 15500), and 2704 households (Total 19382) were affected due to flood (Table 4).
Table 3. Flood affected villages
|
Blocks |
Total villages |
Flood affected villages |
Category of flood |
|
|
Number |
% |
|||
|
Bamangola |
143 |
56 |
39.16 |
Medium |
|
Chanchal I |
101 |
29 |
28.71 |
Low |
|
Chanchal II |
92 |
39 |
42.39 |
Medium |
|
Englishbazar |
136 |
62 |
45.58 |
Medium |
|
Gazole |
293 |
62 |
21.16 |
Low |
|
Habibpur |
291 |
151 |
51.89 |
High |
|
Harishchandrapur I |
105 |
31 |
29.52 |
low |
|
Harishchandrapur II |
74 |
56 |
75.67 |
High |
|
Kaliachak I |
66 |
15 |
22.72 |
low |
|
Kaliachak II |
56 |
18 |
32.1 |
Medium |
|
Kaliachak II |
75 |
51 |
68.00 |
High |
|
Malda Old |
119 |
53 |
44.53 |
Medium |
|
Manikchak |
86 |
59 |
68.60 |
High |
|
Ratua I |
101 |
52 |
51.48 |
High |
|
Ratua II |
51 |
32 |
62.74 |
High |
|
Total |
1789 |
766 |
42.81 |
Medium |
Table 4. Flood affected population and households
|
Blocks |
TnP |
TnHH |
TnPu06Y |
TnFAP |
TnFAHH |
TnFPu06Y |
|
Bamangola |
80917 |
17734 |
9320 |
3407 |
747 |
392 |
|
Chanchal I |
61278 |
14748 |
7948 |
1875 |
451 |
243 |
|
Chanchal II |
120542 |
24881 |
19745 |
10282 |
2122 |
1684 |
|
Englishbazar |
384044 |
81014 |
59481 |
59834 |
12622 |
9267 |
|
Gazole |
100268 |
21435 |
12468 |
9967 |
2131 |
1239 |
|
Habibpur |
127334 |
28605 |
15899 |
8175 |
1836 |
1021 |
|
Harishchandrapur I |
75467 |
16730 |
11259 |
4717 |
1046 |
704 |
|
Harishchandrapur II |
223981 |
43806 |
39211 |
17359 |
3395 |
3039 |
|
Kaliachak I |
93958 |
19382 |
15500 |
13098 |
2704 |
2161 |
|
Kaliachak II |
120927 |
25969 |
19793 |
13145 |
2823 |
2151 |
|
Kaliachak III |
301907 |
57772 |
55206 |
28651 |
5483 |
5239 |
|
Manikchak |
222198 |
49165 |
35602 |
16798 |
16798 |
2692 |
|
Malda old |
161188 |
33156 |
19201 |
22115 |
4549 |
2634 |
|
Ratua I |
177015 |
35854 |
30022 |
18392 |
3725 |
3119 |
|
Ratua II |
119889 |
25362 |
19096 |
4891 |
1035 |
779 |
TnP: Population; TnHH: Households; TnPu06Y: Population under 06 years, TnFAP: Flood affected population; TnFAHH: Flood affected households; TnFPu06Y: Flood affected population under 06 years.
In the Kaliachak-II block, 18 villages (Total 56), 13145 population (Total 120927), 2151 children (19793), and 2823 households (Total 25969) were severely influenced by the flood (Table 4). Likewise, in Kaliachak-III, 51 villages (Total 75), 28651 population (Total 301907), 5239 children (Total 5506), and 5483 households (Total 5772) were severely influenced due to the flood (Table 4). In Manikchak block, 16798 population were influenced by flood out of 222198 total population and 2692 children were also affected, where 59 villages (Total 86) and 16798 households (Total 49165) were critically affected due to flood (Table 4). The old Malda block is situated between two rivers eastern side is the Tangon River and the western side is the Mahananda River. Because of this geographical location, this block is faced immense flooding. In the Old Malda block, 53 villages (Total 119) were highly affected due to the flood, 222115 population (total 161188), 2634 children (Total 19201), and 4549 households (Total 33156) were influenced because of the flood. The Ratua-I and II blocks come under the high flood-affected zones; among them, Ratua-II is more affected than Ratua-I. In Ratua-I, 52 villages (total 101), 18392 population (Total 177015), 3119 children (Total 30022), and 3725 households (Total 35854) were affected due to flood. In Ratua-II, 32 villages (Total 51), 4891 population out of 119889, 779 children (Total 19096), and 1035 households (Total 25362) were influenced due to the 2019 flood (Table 4).
4.2 Micro-Level Impacts of Flood
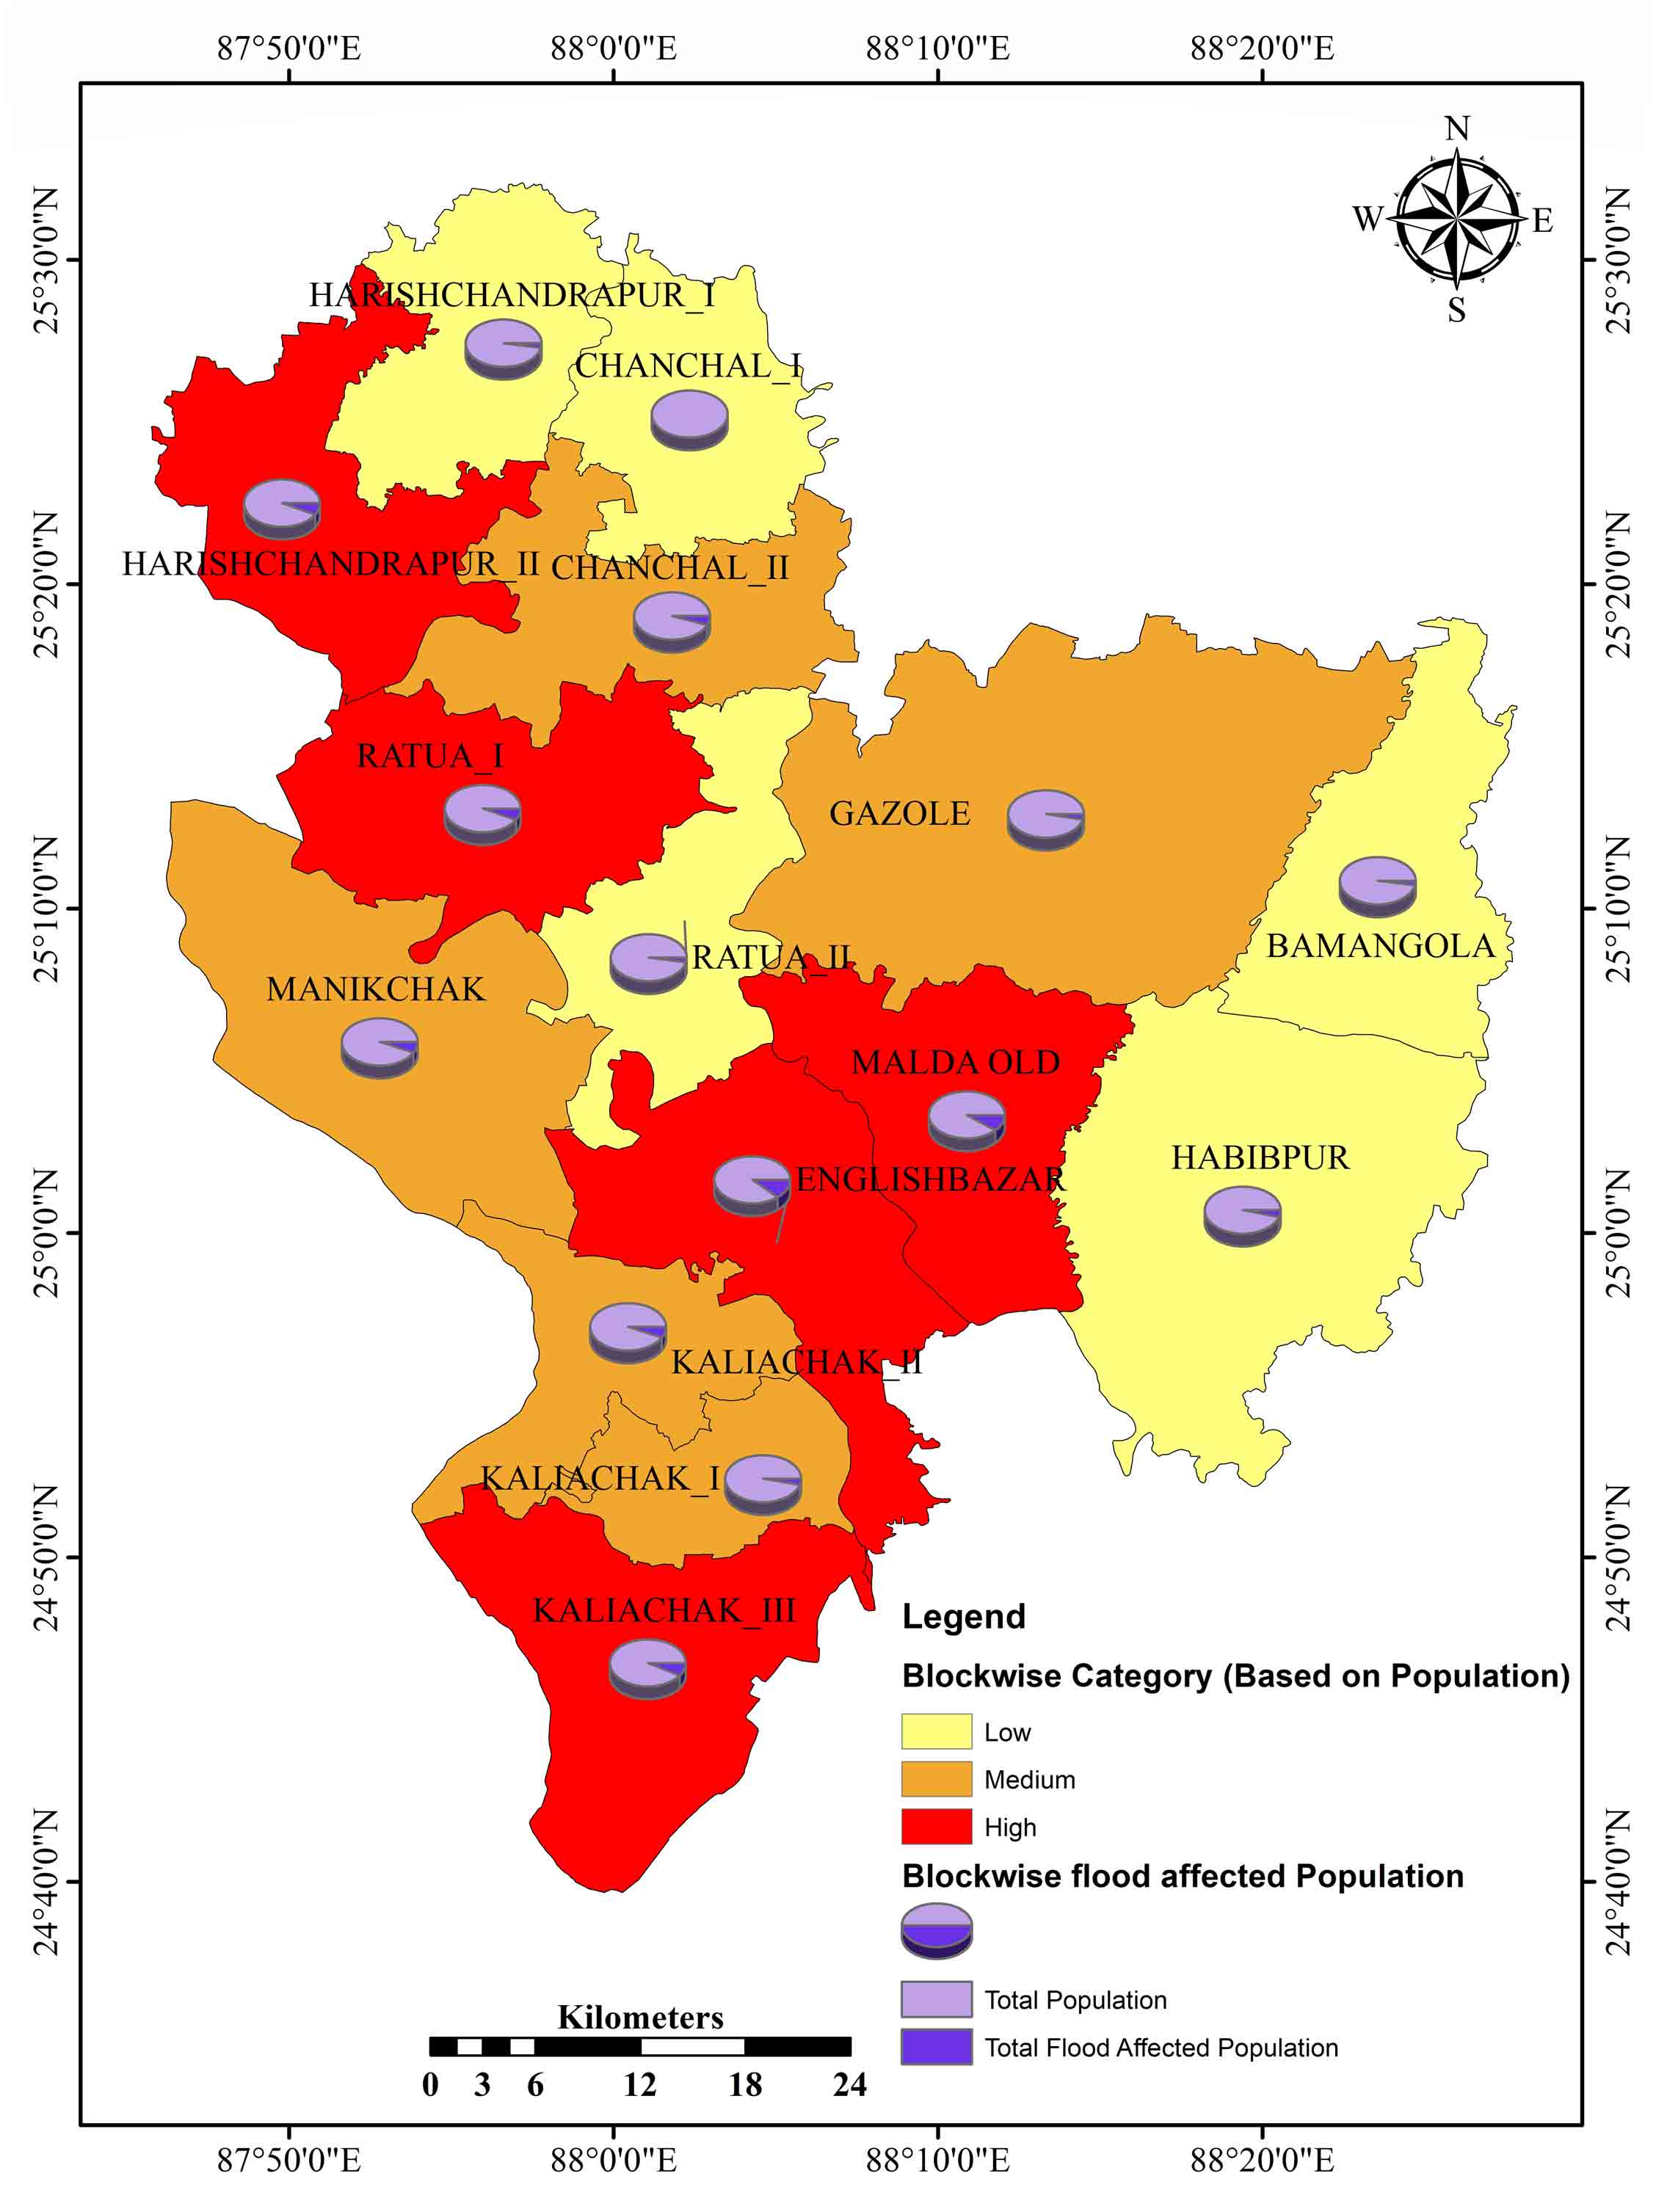
Distribution of flooded areas and their effects on people and residential areas were important considerations. There are 15 blocks in the research area, each of which is further divided into 1789 individual villages. The micro-level (village-level) flood-influencing area in the Malda district was determined by intersecting the flood inundation layer with the district’s village-level database. After intersecting the flood inundation layer with the village layer of this district, it was observed that among 1789 villages, 766 were affected due to the flood (2nd September 2019), which is 42.81%. Based on the flood influencing number of villages and its percentage, the whole blocks of this district were grouped into high (>50%), medium (30-50%) and low (<30%) flood-affected blocks. The high (>50%) flood-affected blocks are Habibpur (51.89%), Harischandrapur-II (75.67%), Kaliachak-III (68.0%), Manikchak (68.60%), Ratua-I (51.48%), and Ratua-II (62.74%). The medium (30- 50%) flood-affected blocks are Bamangola (39.16%), Chanchal-II (42.39%), Englishbazar (45.58%), Kaliachak-II (32.1%) and the Malda old (44.53%). The low (<30%) flood-affecting blocks are Chanchal-I (28.71%), Gazole (21.16%), Harischandrapur-I (29.51%) and Kaliachak-I (22.72%) (Table 3).
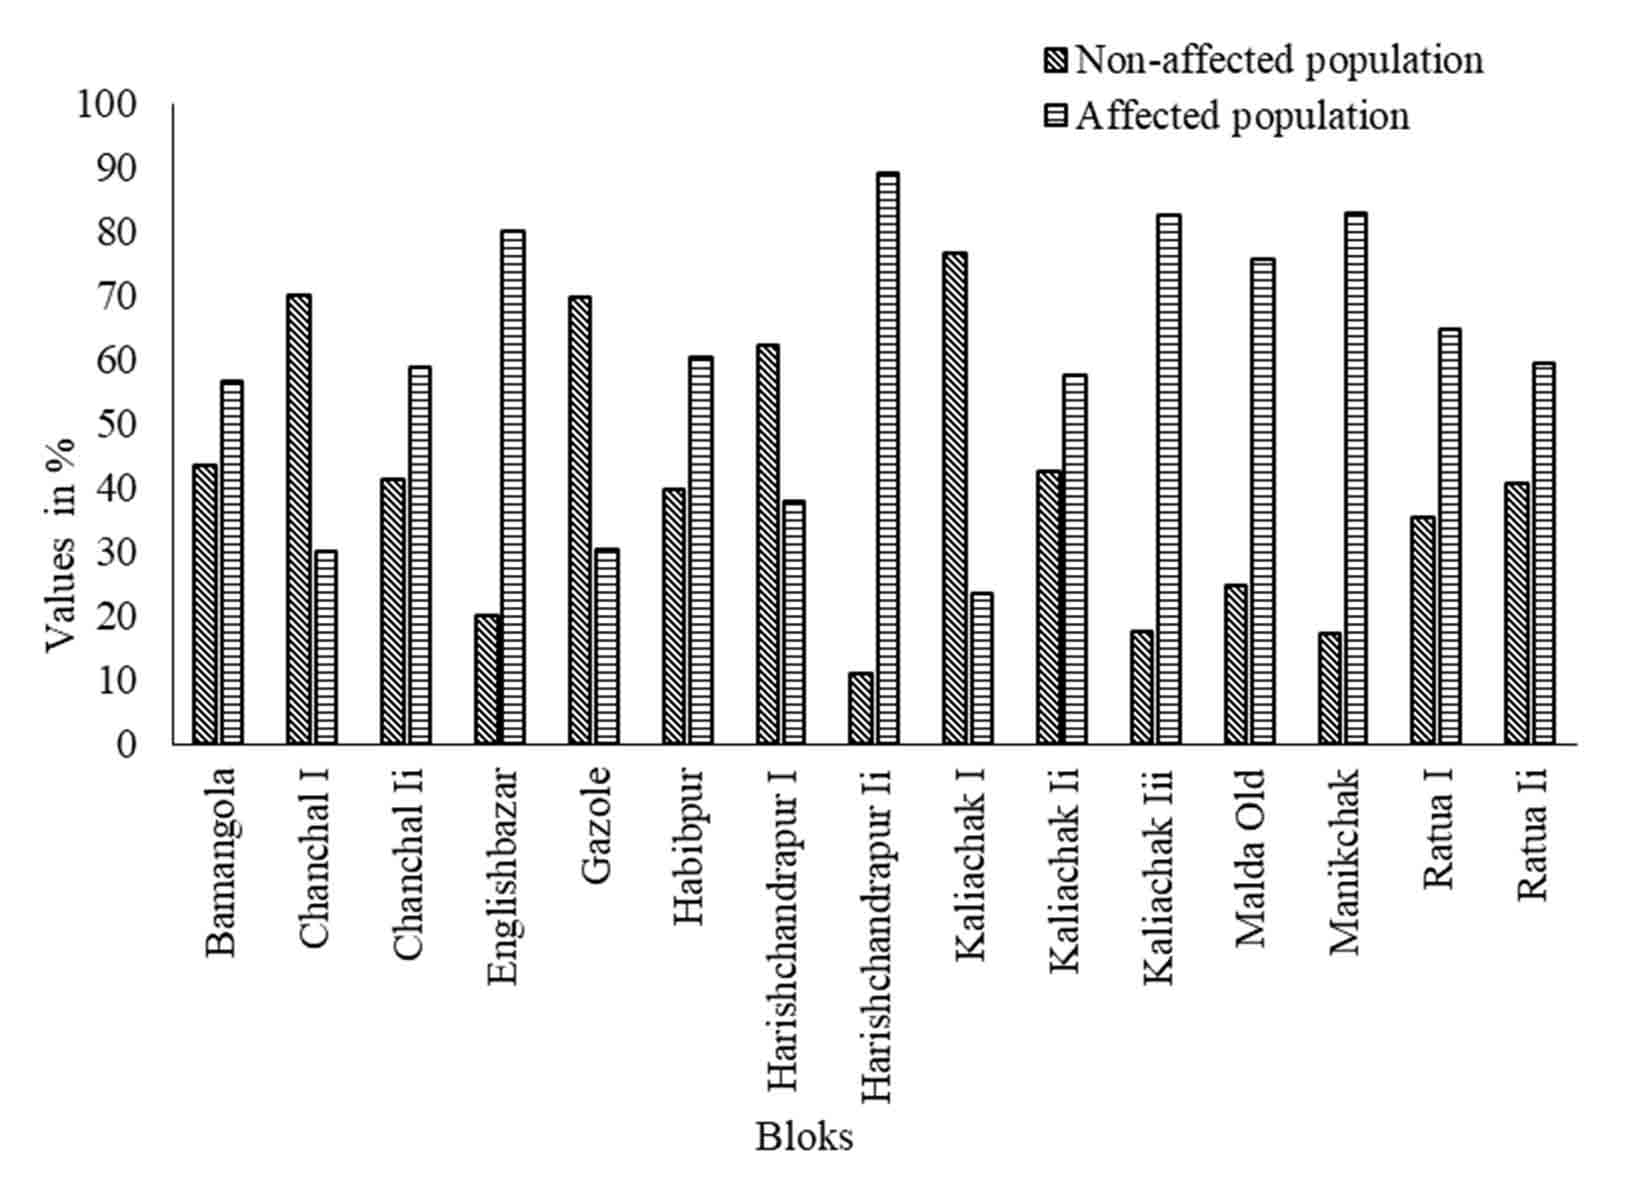
The whole block of this district has been categorized into two groups based on the influences of flood on the population that are flood-affected population group and the non-affected population group (Figure 7). In the study area, it has been observed that only four blocks of the population were less affected that were Chanchal-I (70.07%), Gazole (69.79%), Harishchandrapur-I (62.17%), and Kaliachak-I (76.52%). Another side eleven blocks population were severely affected by the flood, which were Bamangola (56.49%), Chanchal-II (58.71%), Englishbazar (79.98%), Habibpur (60.43%), Harishchandrapur-II (89.11%), Kaliachak-II (57.56%), Kaliachak-III (82.37%), Old Malda (75.47%), Manikchak (82.71%), Ratua-I (64.62%), and Ratua-II (59.33%) (Figure 4). According to the flood impact on all block of this district, it has been categorized into High Flood affected blocks (Harischandrapur-II, Ratua-I, Englishbazar, Malda Old, and Kaliachak-III), Medium Flood affected blocks (Chanchal-II, Gazole, Manikchak, Kaliyachak-I, and Kaliachak-III), and Low Flood affected blocks (Harischandrapur-I, Chanchal-I, Ratua-II, Bamangola, and Habibpur) (Figure 5 and 6).
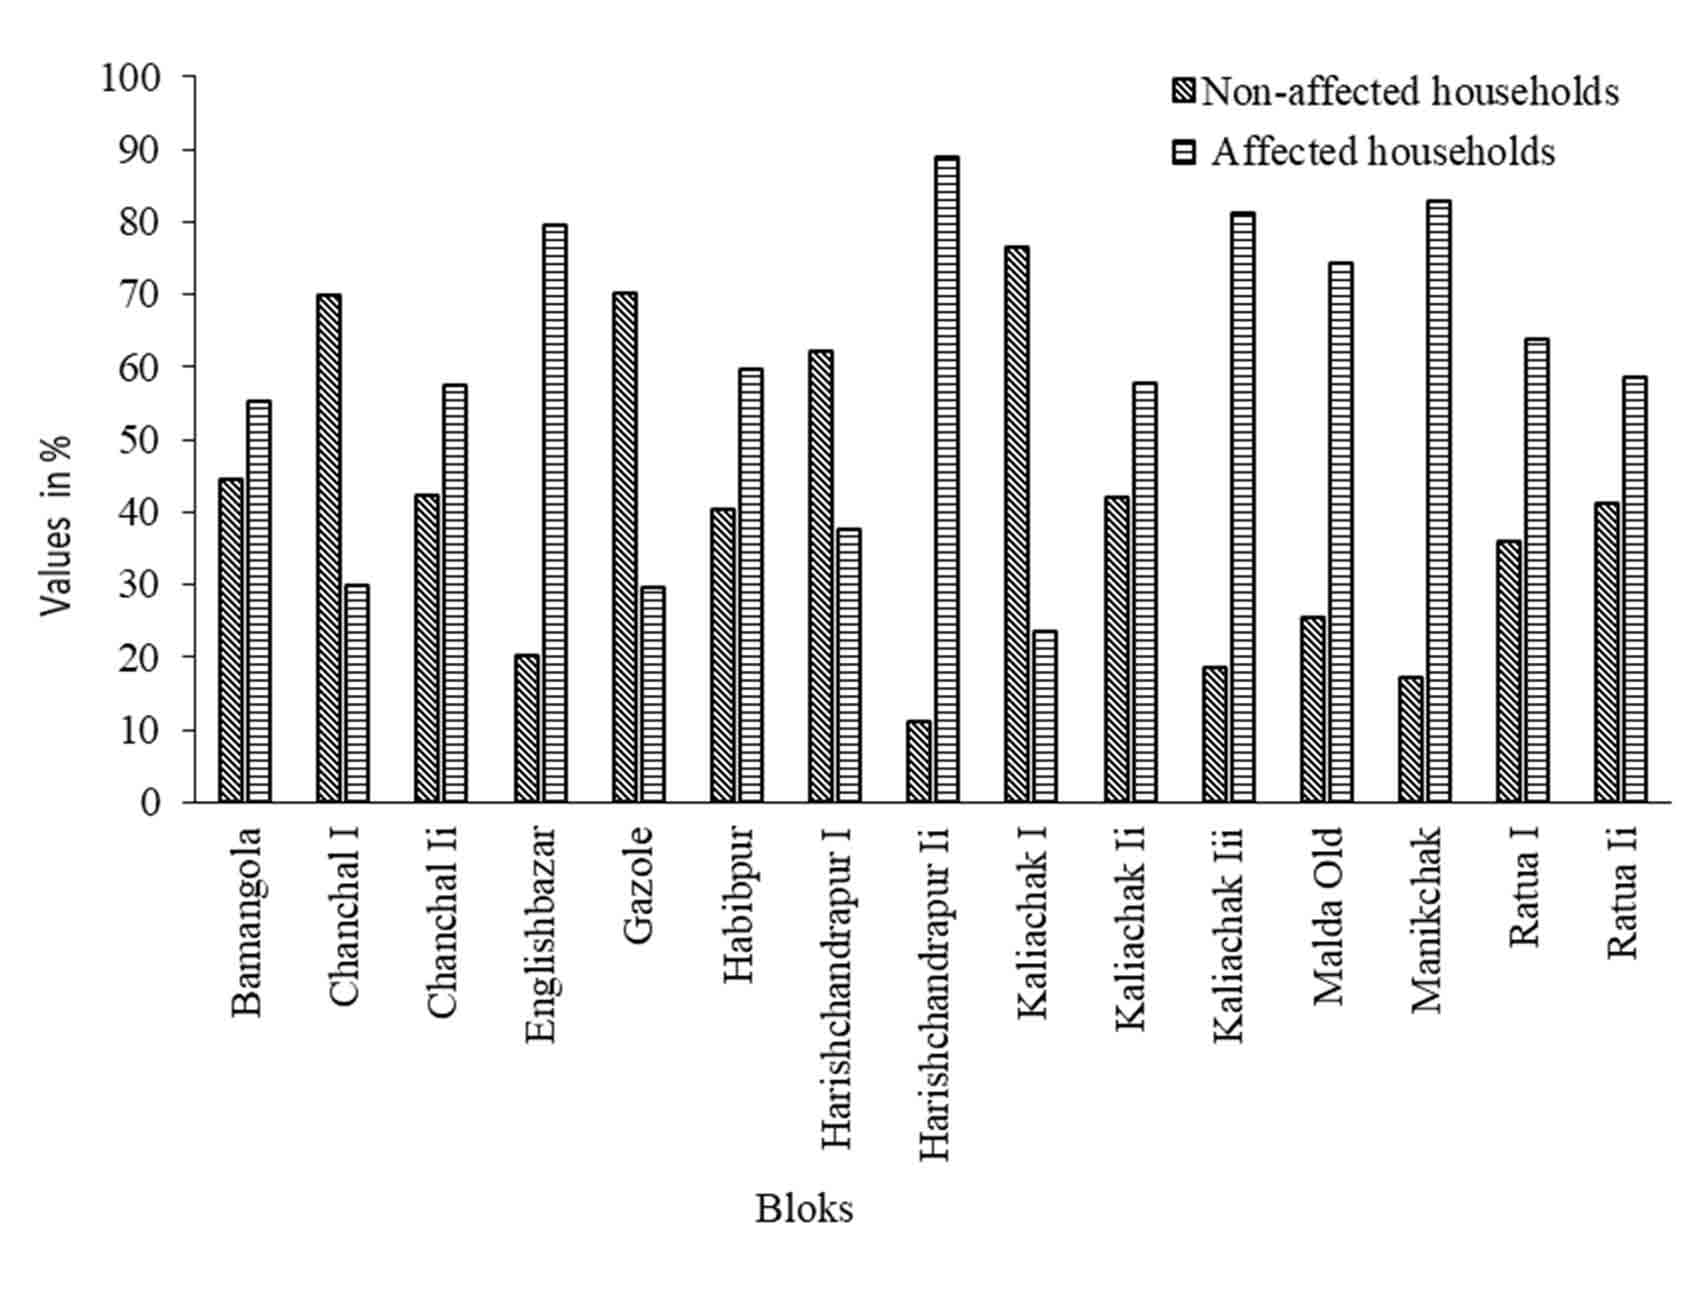
One of the most important things to have on hand during times of potential flooding is a safe place to take refuge in your own home. All homes in this area are divided into two groups: those unaffected by the flooding and those that were flooded (Figure 8). It has been observed that the maximum households affected blocks are Harishchandrapur-II (88.84%), Manikchak (82.88%), Kaliachak-III (81.26%), and Englishbazar (79.67%). And less flood-affected households observed blocks are Kaliachak-I (76.42%), Gazole (70.34%), and Chanchal-I (70.07%). Based on the flood influences on households whole, blocks are categorized into High (Ratua-I, Manikchak, Englishbazar, Malda Old, and Kaliyachak-III), Medium (Harischandrapur-II, Chanchal-II, Gazole, Kaliachak-I, and Kaliyachak-II), low (Harischandrapur-I, Chanchal-I, Ratua-II, Bamangola, and Habibpur) zones (Figure 10).
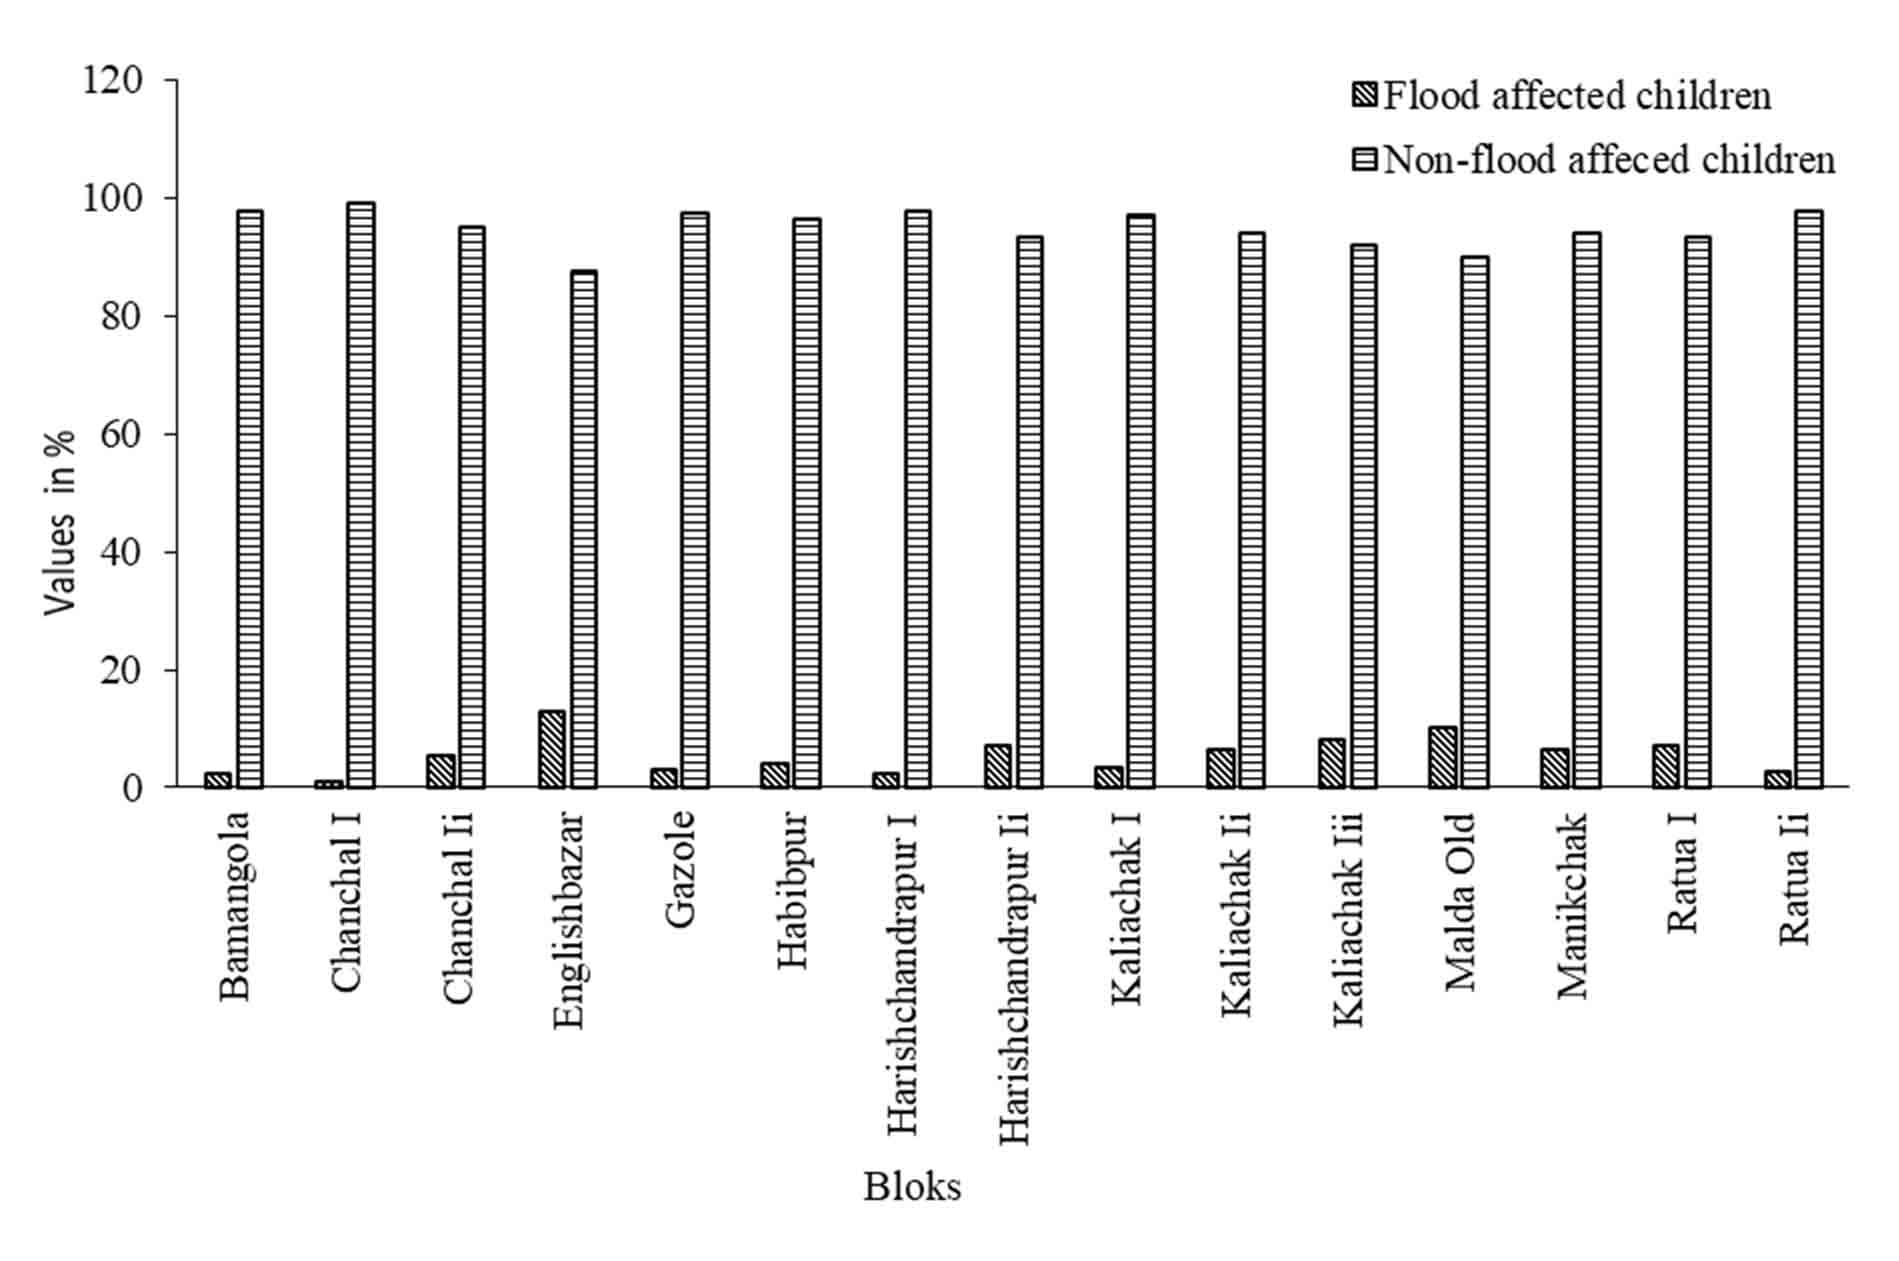
Children (those under the age of six years) are the most at risk in times of flooding. Data on the number of children in the flood-affected population at the village level have been gathered using a primary survey, which was analyzed on SPSS Statistical software. It has been observed that the maximum number of children was influenced in Englishbazar Block (12.66%) and the minimum affected block was observed in the Chanchal-I block (0.90%) (Figure 9). Based on the percentage of floods effected on children, the whole blocks are categorized into high (Harischandrapur-II, Ratua-I, Manikchak, English Bazar, and Kaliachak-III), medium (Chanchal-II, Gazole, Malda old, Kaliachak-I, and Kaliachak-II), and low (Harischandrapur –I, Chanchal-I, Ratua-II, Bamangola, and Habibpur) children influences zones (Figure 11).
5. Conclusion
The flood inundation layer of the Malda district has been prepared using the SAR data (Sentinel-1A). In this study, the flood inundated area and land mass were separated based on the backscatter value of SAR data. Here two inundation layers were prepared based on the satellite passing date between 2nd and 10th September 2019. The first flood inundation layer saw (4th September 2019) 11.27% of the entire district areas under flood. On the second date (7th September 2019) had observed a 9.99% area fell under flood. About 6.13% of houses were copiously influenced at that time (4th Sept.). It has been found that 765 villages were severely affected due to floods. It has been also observed that Harischandrapur-II (75.67%), Manikchak (68.60%) and Kaliachak-III (68.00%) are the highest flood-affected block in this district. According to the flood effects on this district’s household and total population, Harishchandrapur-II, Manikchak, Kaliachak-III and Englishbazar blocks are exceedingly impacted due to flood, and Chanchal-I, Gazole, Harishchandrapur-I and Kaliachak-I are the less influenced by the flood hazards. It might be argued that using SAR data for flood monitoring during the time of a flood is critical and important. In defining the extent of the region currently submerged in water, this is of paramount importance. This study will aid the local government body, the District Disaster Management Authority (DDMA) and the decision-maker by giving critical real-time data for enhanced comprehension and prompt action.
Conflict of interest
The authors declare that there is no conflict of interest.
Acknowledgements
It will be a great ingratitude if we forget to acknowledge the Department of Disaster Management. We are very grateful to the Department of Disaster Management, Pondicherry University for helping us fully to complete this research. We are also thankful to the officials of the Malda District Disaster Department who supported us directly or indirectly with data.
Abbreviations
dB: Decibel;
NTR: Near Real Time;
SAR: Synthetic Aperture Radar;
SNAP: Sentinel Application Platform;
SPSS: Statistical Package for the Social Sciences.
Article information
- Received
- 25 Jun 2022
- Revised
- 3 Jan 2023
- Accepted
- 4 Jan 2023
- Published
- 21 Feb 2023
- Handling editor
- Professor. Masood Ahsan Siddiqui
- Licence
- CC BY-NC-ND 4.0
- Journal
- Journal of Geographical Studies, ISSN 2582-1083
References
-
Agnihotri, A. K., Ohri, A., Gaur, S., Shivam, Das, N. and Mishra, S., 2019. Flood inundation mapping and monitoring using SAR data and its impact on Ramganga River in Ganga basin. Environmental Monitoring and Assessment, 191(12).
Crossref -
Ahmad, F., Talukdar, N. R., Biradar, C. M., Dhyani, S. K. and Rizvi, J., 2022. Harnessing the potentiality of farm landscape for trees based on satellite evaluation: A GIS modeling perspective. Anthropocene Science, 1(2), 278-294.
Crossref -
Anusha, N. and Bharathi, B., 2020. Flood detection and flood mapping using multi-temporal synthetic aperture radar and optical data. Egyptian Journal of Remote Sensing and Space Science, 23(2), 207-219.
Crossref -
Attema, E., Bargellini, P., Edwards, P., Levrini, G., Lokas, S., Moeller, L., Rosich-Tell, B., Secchi, P., Torres, R., Davidson, M. and Snoeij, P., 2007. The radar mission for GMES operational land and sea services. European Space Agency Bulletin, 131, 10-17.
-
Berra, E., Azizi, M., Capron, A., Høieggen, A., Rabbia, F., Kjeldsen, S. E., Staessen, J. A., Wallemacq, P. and Persu, A., 2016. Evaluation of Adherence Should Become an Integral Part of Assessment of Patients with Apparently Treatment-Resistant Hypertension. Hypertension, 68(2), 297-306.
Crossref -
Bhanumurthy, V., Ram Mohan Rao, K., Jai Sankar, G. and Nagamani, P. V., 2017. Spatial data integration for disaster/emergency management: An Indian experience. Spatial Information Research, 25(2), 303-314.
Crossref -
Das, B., Pal, S. C. and Malik, S., 2018. Assessment of flood hazard in a riverine tract between Damodar and Dwarkeswar River, Hugli District, West Bengal, India. Spatial Information Research, 26(1), 91-101.
Crossref -
Das, R. and Samanta, G.. 2022. Impact of floods and river-bank erosion on the riverine people in Manikchak Block of Malda District, West Bengal. Environment, Development and Sustainability.
Crossref -
ESA [European Space Agency]. Copernicus: Sentinel-1 - Satellite Missions- eoPortal Directory. Retrieved February 19, 2021.
-
Ismail, M. and Mustaquim, M., 2013. Socio-economic status of population in flood prone areas of Chanchal sub-division in Malda District, West Bengal. International Journal of Research in Applied, Natural and Social Sciences, 1(3), 141-152.
-
Jonkman, S. N., 2005. Global perspectives on loss of human life caused by floods. Natural Hazards, 34(2), 151-175.
Crossref -
Kumar, A. R. and Raghav, A. A., 2018. A Case study on the flood situation of Assam State. International Research Journal of Engineering and Technology (IRJET), 5(5), 4192-4194.
-
Li, L., Chen, Y., Yu, X., Liu, R. and Huang, C., 2015. Sub-pixel flood inundation mapping from multispectral remotely sensed images based on discrete particle swarm optimization. ISPRS Journal of Photogrammetry and Remote Sensing, 101, 10-21.
Crossref -
Manjusree, P., Prasanna Kumar, L., Bhatt, C. M., Rao, G. S. and Bhanumurthy, V., 2012. Optimization of threshold ranges for rapid flood inundation mapping by evaluating backscatter profiles of high incidence angle SAR images. International Journal of Disaster Risk Science, 3(2), 113-122.
Crossref -
Mazumder, S. K., 2004. Role of Farakka Barrage on the disastrous 1998 flood in Malda (West Bengal). In The Ganges Water Diversion: Environmental Effects and Implications, 39-48. Kluwer Academic Publishers.
Crossref -
Mehebub, S., Raihan, A., Nuhul, H. and Haroon, S., 2015. Assessing flood inundation extent and landscape vulnerability to flood using geospatial technology: A study of Malda district of West Bengal, India. Forum Geografic, 14(2), 156-163.
Crossref -
Mudi, S., A, J. P. and Das, P., 2022. Flood hazard mapping in assam using Sentinel-1 SAR data. In Advances in Geographic Information Science, 459-473.
Crossref -
Munasinghe, D., Cohen, S., Huang, Y. F., Tsang, Y. P., Zhang, J. and Fang, Z., 2018. Intercomparison of Satellite remote sensing-based flood inundation mapping techniques. Journal of the American Water Resources Association, 54(4), 834-846.
Crossref -
Pal, S. and Talukdar, S., 2019. Impact of missing flow on active inundation areas and transformation of parafluvial wetlands in Punarbhaba-Tangon river basin of Indo-Bangladesh. Geocarto International, 34(10), 10551074.
Crossref -
Qi, S., Brown, D. G., Tian, Q., Jiang, L., Zhao, T. and Bergen, K. M., 2009. Inundation extent and flood frequency mapping using LANDSAT imagery and digital elevation models. GIScience and Remote Sensing, 46(1), 101-127.
Crossref -
Rahman, M. R., 2006. Flood inundation mapping and damage assessment using multi-temporal RADARSAT and IRS 1C. Asian Journal of Geoinformatics, 6(2), 1-11.
-
Richard, M., 2020. Floods cost India Rs 4.7 lakh crore in last 6 decades. Down to Earth, , July 21, 2020.
-
Samanta, R. K., Bhunia, G. S., Shit, P. K. and Pourghasemi, H. R., 2018. Flood susceptibility mapping using geospatial frequency ratio technique: a case study of Subarnarekha River Basin, India. Modeling Earth Systems and Environment, 4(1), 395-408.
Crossref - Crossref
-
Shen, X., Anagnostou, E. N., Allen, G. H., Robert Brakenridge, G. and Kettner, A. J., 2019. Near-real-time non-obstructed flood inundation mapping using synthetic aperture radar. Remote Sensing of Environment, 221, 302-315.
Crossref -
Sivanpillai, R., Jacobs, K. M., Mattilio, C. M. and Piskorski, E. V., 2020. Rapid flood inundation mapping by differencing water indices from pre- and post-flood Landsat images. Frontiers of Earth Science, 15, 1-11.
Crossref -
Tadesse, D., Suryabhagavan, K. V., Nedaw, D. and Hailu, B. T., 2022. A model-based flood hazard mapping in Itang District of the Gambella region, Ethiopia. Geology, Ecology, and Landscapes, 1-18.
Crossref -
Tiwari, V., Kumar, V., Matin, M. A., Thapa, A., Ellenburg, W. L., Gupta, N. and Thapa, S., 2020. Flood inundation mapping-Kerala 2018: Harnessing the power of SAR, automatic threshold detection method and Google Earth Engine. PLoS ONE, 15, 1-17.
Crossref -
Tripathi, G., Pandey, A. C., Parida, B. R. and Kumar, A., 2020. Flood Inundation Mapping and Impact Assessment Using Multi-Temporal Optical and SAR Satellite Data: A Case Study of 2017 Flood in Darbhanga District, Bihar, India. Water Resources Management, 34(6), 1871-1892.
Crossref -
Wang, J., Ding, J., Li, G., Liang, J., Yu, D., Aishan, T., Zhang, F., Yang, J., Abulimiti, A. and Liu, J., 2019. Dynamic detection of water surface area of Ebinur Lake using multi-source satellite data (Landsat and Sentinel-1A) and its responses to changing environment. CATENA, 177, 189-201.
Crossref -
WBDM and CDD [West Bengal Disaster Management and Civil Defence Department]. West Bengal Disaster Management and Civil Defence Department. Retrieved January 20, 2021.