

Remote Sensing of Land Volume 7 (2023), Issue 1-2 · pp. 21-31
Original Research Paper Open Access

Assessing Land Use Change and Its Impact on Ecosystem Services in Khulna Conurbation
- BCL Associates Limited, Dhaka Bangladesh.
- Institute of Water and Flood Management (IWFM), Bangladesh University of Engineering and Technology (BUET), Dhaka, Bangladesh.
* Corresponding author: Md. Salman Ferdous, salmaniwfm@gmail.com
Contents
- Highlights
- Abstract
- 1. Introduction
- 2. Methodology
- 3. Results
- 4. Discussion
- 5. Conclusion
- Conflict of interest
- Acknowledgements
- Abbreviations
- Article information
- References
-
- Table 1. Detail of Landsat images
- Table 2. Land use categories equivalents for biomes and the associate…
- Table 3. Land use pattern in Khulna Conurbation
- Table 4. Accuracy assessment: Confusion matrix
- Table 5. Ecosystem service values and the changes (1987 - 2018)
- Table 6. Variations in estimated ecosystem services and coefficient o…
Highlights
- The build-up area increased at the expense of vegetation land, water bodies, and rivers.
- Overall 37% of vegetation area was removed within 31 years.
- The built-up area increased by 223% from 1987 to 2018 due to rapid.
- Water bodies were decreased by 82% from 1987 to 2018 because of encroachment, urban development and waste disposal.
- The river area also decreased during the period 1987 to 2018 from 784 ha to 692 ha (11.7%).
- Ecosystem service value reduced of some of the land uses as vegetation, water bodies and river.
Abstract
In this research, the land-use change of Khulna Conurbation has been dissected utilizing Landsat images from 1987 to 2018 through GIS analysis and its effect on the ecosystem has been decided with the assistance of auxiliary information. The study showed that in Khulna Conurbation, built-up territory expanded from 1343 ha to 4332 ha (223%) from 1987 to 2018. On the contrary, vegetation, water bodies, and river area decreased during that period. The ecosystem service values for all land use categories were negative except for urban built-up. The largest amount of decline was observed in the vegetation area (US $ 11.79 million) followed by rivers and water bodies. The built-up is the major contributor to ecosystem services in this area and has largely affected the ecosystem. Proper district and Upazilla level land use plans should be implemented to maintain the sustainable growth of the city and enhancement natural ecosystem services.
Keywords Valuation Land useKhulnaGISEcosystem services
1. Introduction
The goods and services those humans and other living organisms obtain directly or indirectly from natural systems are referred to as ecosystem services (MEA, 2005; Costanza et al., 2014). The urban ecosystem provides many functions such as food and water, temperature and climate control, waste treatment, soil formation, provision of habitant, production of atmospheric oxygen, management of urban heat islands, etc. (Xie et al., 2017; Langemeyer et al., 2016). A sound ecosystem contributes to livable and green improvement (Rahman and Szabo, 2021). Despite the exceptional provision of services provided by ecosystems to nature and living-being, anthropogenic factors have the potential to modify ecological surroundings and natural ecosystems by altering the formation and arrangement of the usage of land (Belay et al., 2022).
Urban ecosystem services are under threat as a result of fast urbanization, continuous population increase, migration, climate change, and industrialization and the present urban ecosystem services may not be able to survive such strain (Liu et al., 2019). With fast economic development and population expansion during the last five decades, at least two-thirds of ecosystems have degraded resulting in a large drop in ES and severe loss in biodiversity (Wang et al., 2022). The decline of urban environment resources is a clear impediment to meeting the MDGs [Millennium Development Goals] (Chen et al., 2020).
Urban ecosystem services are diminishing because of anthropogenic activities and natural occurrences (Escobedo et al., 2011; De Araujo Barbosa et al., 2016; Liu et al., 2020). Land use and land cover changes are among the most significant influences that overrun or degrade the capacity of environmental processes and services (Li et al., 2007; Liu et al., 2014; Islam et al. 2016). Because of increased urbanization and population mobility, the pace and degree of the changes in land use are occurring at a higher rate than in the past (Lambin et al., 2011). Due to the rapid pace of development efforts and interventions, the conversion of land from natural ecosystems to urban areas has resulted in the loss of ecosystem services (Dewan and Yamaguchi, 2009; Xia et al., 2020). For example, conversion from wetland to built-up is responsible for urban flooding because of heavy rainfall (Zhao et al., 2019).
The field of ecosystem services was first explored on a global scale in the early 1970s (Guo et al., 2022). Since then, numerous types of research have now been conducted to investigate how land utilization and ground cover modification affect ecological services. (Wang et al., 2018; Jiang et al., 2020) and the majority of them are concerned with evaluating how sensitive ecosystem service is to land use and land cover modification (Spake et al., 2017). There are four ways to evaluate ecosystem services, such as the revealed preferential process, stated preferential practice, cost-dependent method and benefits transfer technique (Talberth, 2015). The Benefit Transfer Method, developed in 1997 by Costanza, is the most widely used approach for valuing ecosystem services worldwide. The benefit transfer technique to Ecosystem Service Value (ESV) has been criticized for failing to account for local variability, which is a fundamental aspect of the environment (Baveye et al., 2013; Horlings et al., 2020). Despite these disadvantages, the Benefit Transfer Process is applied to assess the worth of ecosystems in data-poor locations (Costanza et al., 2014). Being inspired by the work of Costanza et al. (2014), several efforts had been undertaken to quantify the value of changing ecosystem services such as Kreuter et al. (2001), Liu et al. (2011) Kindu et al. (2016), Yi et al. (2017), Tian et al. (2021), Tolessa et al. (2021), Anley et al. (2022), etc.
Bangladesh has also seen enormous land-use changes in recent decades as a result of growing urbanization and population pressures (Hasan, 2017; Mukhopadhay, 2018). Urbanization has taken over rural areas and it is projected that 199908 hectares of agricultural land are urbanized (Sayed and Haruyama, 2015). In Bangladesh, a number of research projects have been conducted to evaluate the impact of land use shifts and the significance of alterations in ecosystem services (Dewan et al., 2010; Khan et al., 2014; Islam et al., 2015; Islam et al., 2016; Hasan et al., 2017; Mukul et al., 2017; Hasan et al., 2020; Dey et al., 2021) but those are very limited, especially the use of satellite image-derived land use and ground cover shift for the assessment urban ecosystem service. Land-use changes are pronounced in Bangladesh’s southwest coastal areas (Khan et al., 2014). Khulna conurbation, both a divisional city and one of Bangladesh’s coastal zones, has seen significant changes in its land cover over the last several decades because of accelerated urbanization, economic expansion, rising mean sea level, climate emergencies, and natural catastrophic events (Moniruzzaman et al., 2018). Land-use change in urban areas is responsible for slimming down agricultural land and wetland. Therefore, the land turning into urban areas has detrimental effects on several ecosystem services of this city such as provisioning services (rice, fisheries production, and livestock), regulating services (natural drainage system), and cultural services (aesthetic view). Research on land use change and valuation of ecosystem services in Khulna is scarce; however, there are some studies in southwest coastal regions. For instance, Akber et al. (2018) investigated the outcome of land use changes on ecosystem services in the Khulna, Satkhira, and Bagerhat districts. In addition, as part of the coastal region research, Hoque et al. (2022) also examined the effects of land use change on the ecosystem service functions of Khulna. As a result, this is the first research of its type to use satellite images to quantify the impact of land use shifts on ecosystem services in Khulna Conurbation. The specific objectives of this study: i) to explore land use scenarios in the years 1987, 1996, 2007, and 2018 of Khulna conurbation; ii) to evaluate the worth of individual ecosystem services; iii) to determine the influence of land use change on ecosystem services in the study region. The findings should be beneficial in developing remuneration for environmental services, and they should have a favorable impact on natural resource management and urban development strategies.
2. Methodology
2.1 Study Area
The research was carried out in the Khulna Conurbation, formally known as Khulna City Corporation- KCC (Figure 1), is situated on the Bhairab-Rupsha River’s bank and has been the main center of commerce, manufactory, administration, health, and education in the southwest region (Haque et al., 2020).
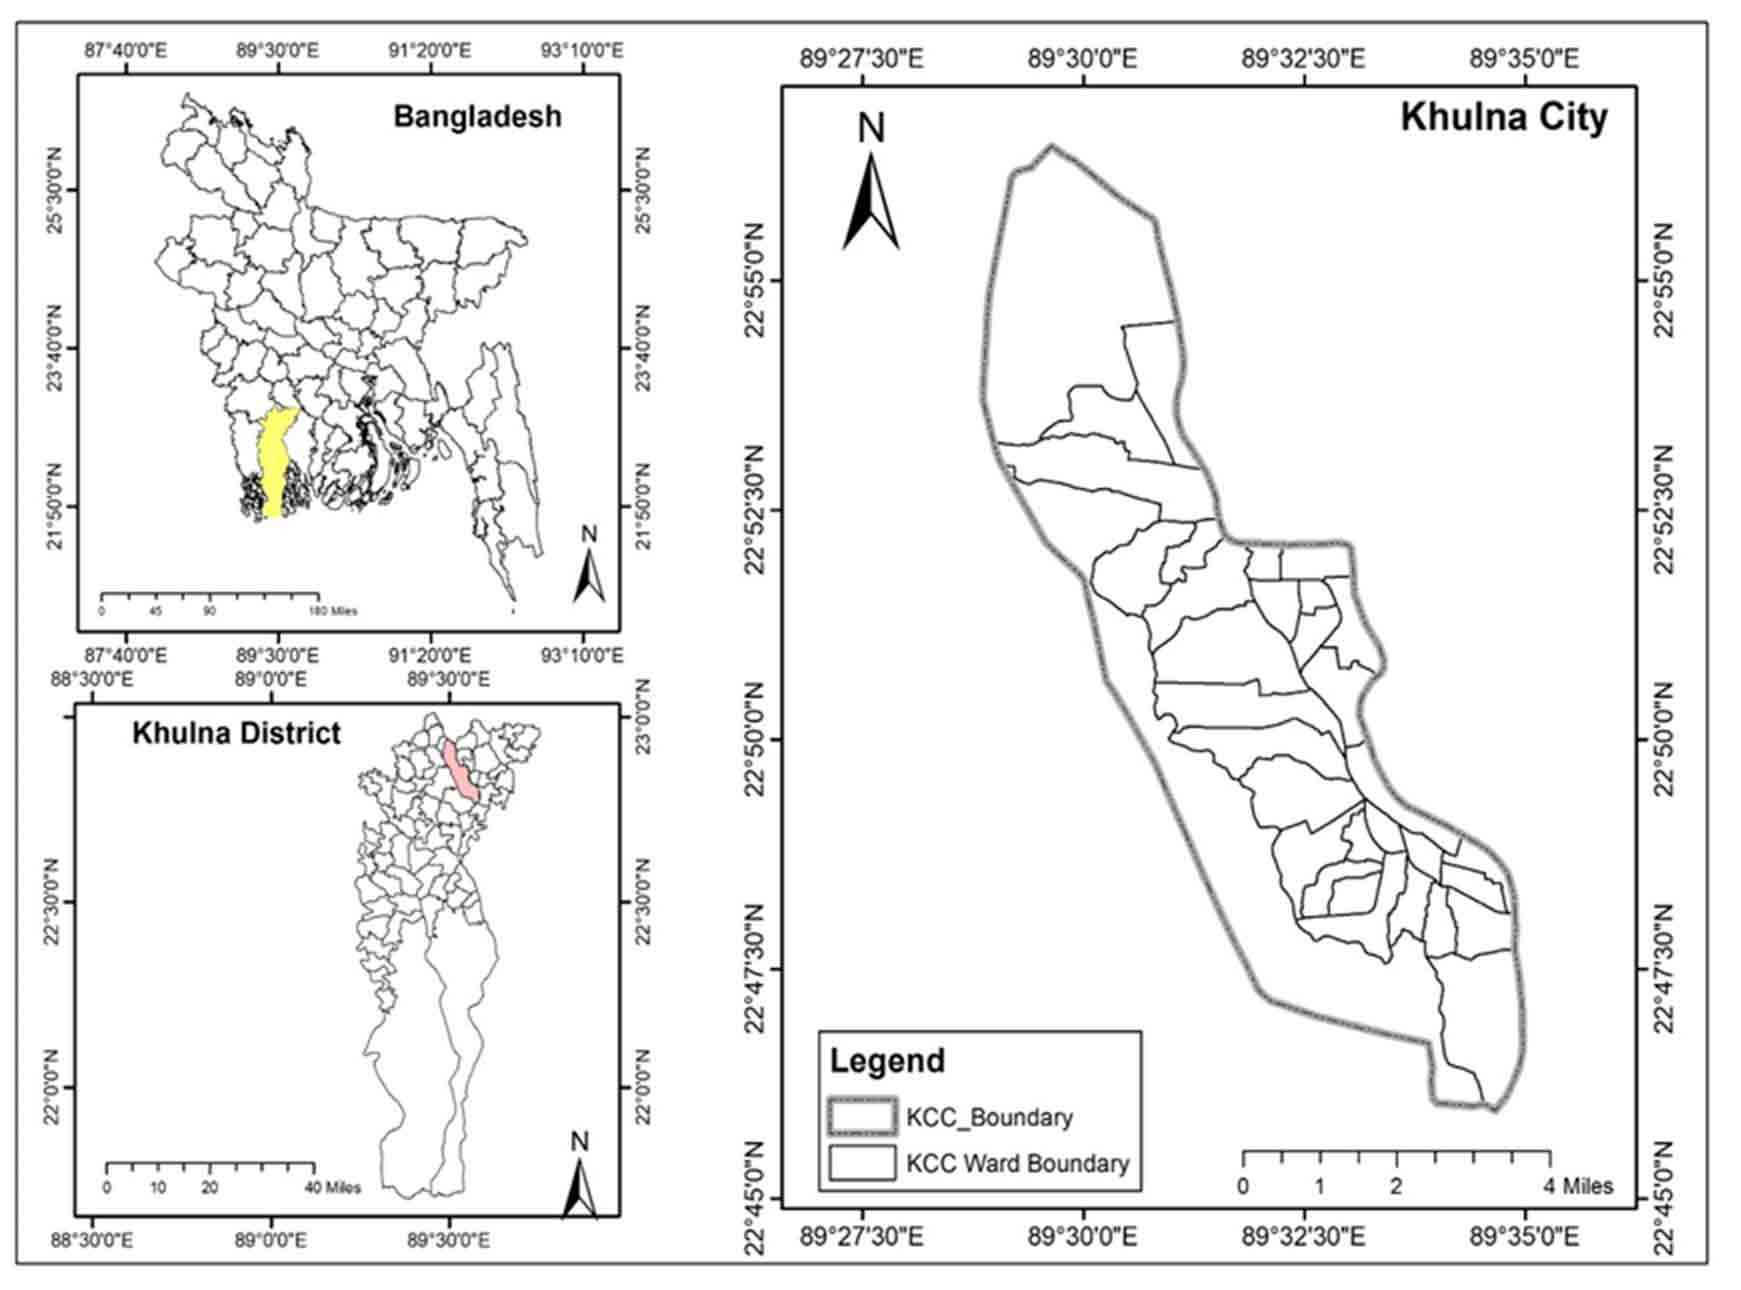
This city boasts an excellent transit system and a diverse range of urban facilities and services, resulting in a substantial influx of citizens from neighboring cities and places. This land modification is taking underway to accommodate the additional arrivals (Haque et al., 2020). Khulna is bordered on the north, east, south, and west by the Bhairab River, Fultala Upazilla, Rupsha River, and Dumuria Upazilla (BBS, 2022).
The total area of the city is 6478 ha. Khulna Conurbation comprises 31 wards within 5 Thanas with a population of 1.5 million (Morshed et al., 2022). There are about 528 kilometers of drainage networks in the KCC area. There are six regulators and eight gates that let storm water out of Khulna City Corporation (Zannat, 2012). Khulna has an average temperature of 26.37 °C and it has increased by 0.005 °C/year in the last few decades. There is also 1630 mm of precipitation annually. The average elevation of the study area is about 1.8 meters above sea level. This region experiences a tropical monsoon climate, with cold winters and humid, scorching summers (Mondal et al., 2017).
2.2 Satellite Image Acquisition and Land Classification
The remote sensing method is one of the most important methods of identifying land use features with multispectral satellite imagery. The methods for classifying remotely sensed images are supervised and non-supervised (Kafy et al., 2020). Due to the unavailability of Landsat images for the year 1985, Landsat satellite images of 1987, 1996, 2007, and 2018 were analysed to determine the land-use changes (Table 1). The satellite imagery was sourced from the U.S. Geological Survey’s official website. In order to eliminate the possibility of seasonal variations between land use change seasons, Landsat images were all downloaded for the dry period (Johansen et al., 2015; Birhanu et al., 2019; Anley et al., 2022). As there is no rain in the dry season, this guarantees that there are water bodies in fact. The projection system was Universal Transverse Mercator (UTM).
Table 1. Detail of Landsat images
|
Satellites |
Path and Row |
Date |
Resolution (m) |
|
Landsat Multispectral Scanner (MSS) |
138 and 44 |
24-12-1987 |
60 |
|
Landsat Thematic Mapper (TM) |
138 and 44 |
16-02-1996 |
30 |
|
Landsat Enhanced Thematic Mapper Plus (ETM+) |
137 and 44 |
23-02-2007 |
30 |
|
Landsat Operational Land Imager (OLI) and Thermal Infrared Sensor (TIRS) |
137 and 44 |
20-01-2018 |
30 |
The supervised classification techniques were used to classify the present and past land use of the research area. To prevent any interference with the spectrum information, radiometric augmentation of the pictures was not performed before hybrid categorization (Akber et al., 2018). Similar techniques were applied in the previous studies (Zhaoa et al., 2004; Zang et al., 2011; Rawat and Kumar, 2015; Temesgen et al., 2018; Sumari et al., 2020).
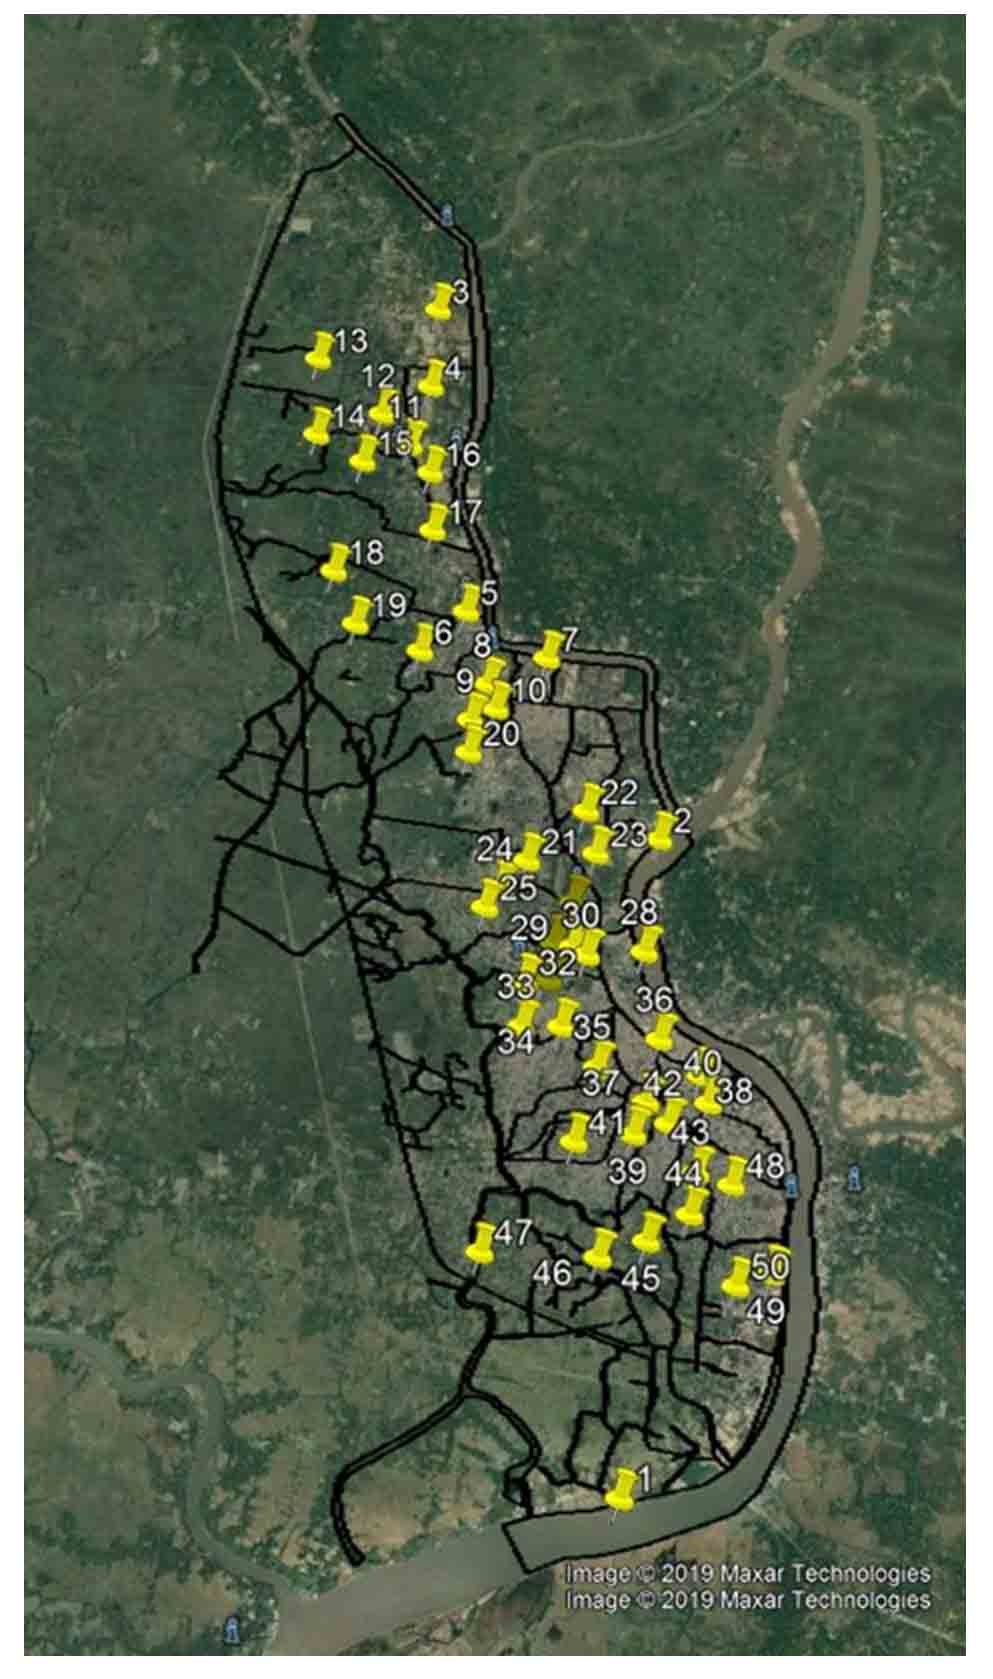
This study classified land use into four distinct sub-categories including Built-up Area (Residential zone, mixed zone, industry, transport), Water Bodies (Permanent open water, Streams, Khal), Vegetation (Park, Stadium, Urban Green, Crop Field), and Rivers (Lakes and Rivers) as those are the main types of land uses in the study area. As Khulna Conurbation is an urban area, these are the primary land categories in the city. These usages of land were selected considering the biomes close to these land-use types to calculate the ecosystem values (Rahman and Szabo, 2021). Estimating the uncertainties in land use change must be handled carefully. Therefore, a ground-truthing survey which is a remote sensing field verification technique was utilized to evaluate the accuracy of the categorized map (Islam et al., 2016). A set of 50 ground-truthing locations were selected for field verification of as much land area as possible. Based on the ground-truthing information, a confusion matrix was constructed to illustrate the classification’s overall precision as a percentage of categorized land use versus actual land use (Rotich et al., 2022).
2.3 Assessment of Ecosystem Services
In recent years, numerous research projects have been conducted on the quantification of ecosystem services. Among them, the ecosystem service assessment method suggested by Costanza et al. (1997) is regarded as the most reliable technique for evaluating the economic worth of ecosystem services. For the purpose of calculating ecosystem service values, 17 ecosystem services were identified across 16 biomes. The methodology of Costanza et al. (1997) has been subject to some criticism due to inaccurate estimations of agricultural units and uncertainty however, it provides the most extensive set of initial estimates for the valuation of ecosystem services (Rahman and Szabo, 2021). As a result, we employed this technique in our study to value ecosystem services in Khulna Conurbation.
Each land use type was compared to distinct biomes found in the global ecosystem to assess ecosystem services. The valuation coefficient in the most ideal biome was utilized as a substitute for each type. In this study, the urban biome for ‘built-up area’, cropland for ‘vegetation’, wetland biome for ‘water bodies’, and river or lakes for ‘river’ was used. Then the updated value of world ecosystem services was applied. Land use patterns, corresponding biome, and value coefficient are included in (Table 2).
Table 2. Land use categories equivalents for biomes and the associated ecosystem value coefficients
|
Land use types |
Equivalent biome |
Ecosystem service coefficient (US$ ha−1 per year) |
|
Vegetation |
Cropland |
5567 |
|
Built-up |
Urban |
6661 |
|
Water bodies |
Wetland |
952 |
|
River |
River or lake |
12512 |
The ecosystem services value was determined by applying the following formula (Long et al., 2014; Arowolo et al., 2018; Liu et al., 2020).
\(ESV= ∑(Ak× VCk)\) (1)
Where, ESV is the estimated ecosystem services value, AK is the area (ha) and VCK is the value coefficient for each land use category. We analysed the differences between the projected ecosystem services value for each land use category in 1987, 1998, 2007, and 2018 to determine the change in ecosystem service value.
2.4 Coefficient of Sensitivity
This study looked at how much each piece of land was worth compared to other parts of the world’s biomes. There may be some ambiguities in this, and they may not be precisely matched. As a result, the coefficient values used to compute ecosystem services value are subject to uncertainty. For this reason, sensitivity analysis must be conducted to determine the extent to which absolute ecosystem service value is dependent on a variation in the coefficient value of a particular land use type. The coefficient of sensitivity (CS) is used to evaluate the performance of biome portrayal and the relative value of the CS in different land use categories. As a result, sensitivity analysis is required to establish the degree of reliance of total ecosystem services value on a shift in the coefficient value of certain land use nature (Wang et al., 2020). The formula used to calculate the CS is as follows (Tolessa et al., 2017; Akber et al., 2018).
\(CS=((ESVj-ESVi)/ESVi)/((vCjk-vCik)/vCik)\) (2)
Where, ESV is the estimate of ecosystem services value, \(vC\) is the value component, ‘i’ and ‘j’ represent the original and adjusted values, respectively, and ‘k’ is the land use category.
The ecosystem value ratios for each land use were modulated by a margin of ± 50% (Akber et al., 2018). The coefficient of sensitivity is the ratio between the change in the estimated ecosystem services value and the change in the modified valuation coefficient (Li et al., 2007). If the difference is less than 1, the estimate of ecosystem service is flexible and reliable; if it’s more than 1, it’s not (Zhao et al., 2004). If the proxy representation and its estimated ecosystem service value are rigid in relation to the value coefficient, then it is reliable.
3. Results
3.1 Land Use Modification Analysis
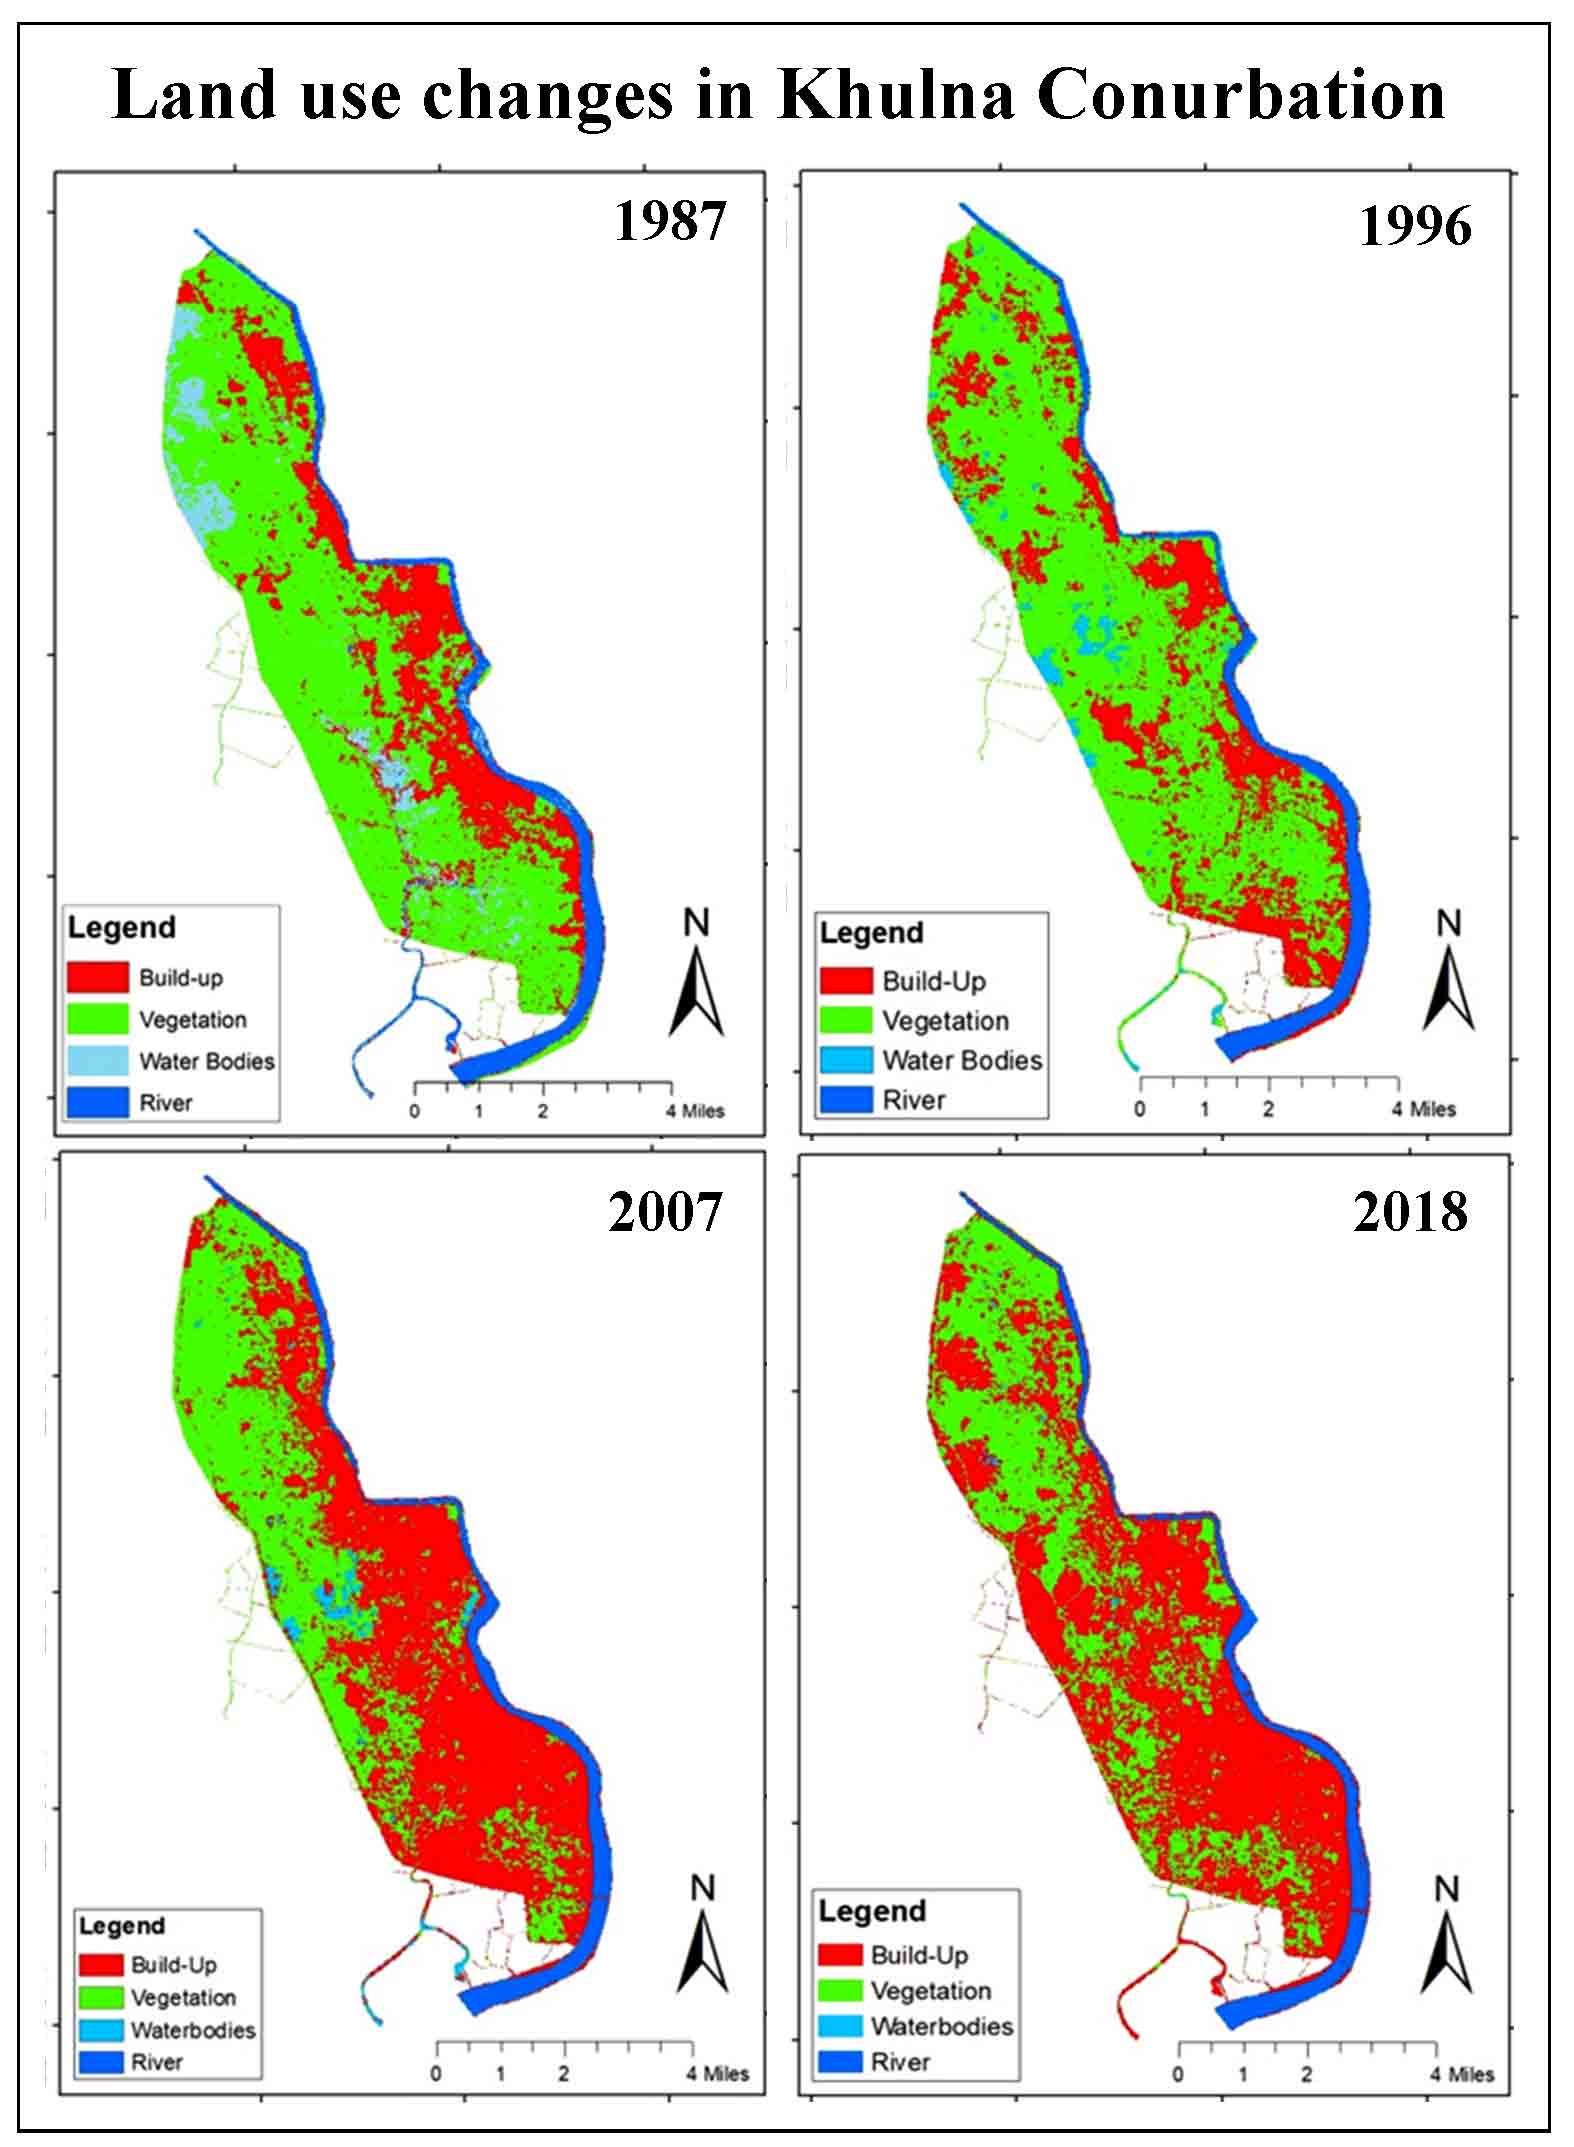
Land use classification was carried out using cloud-free Landsat images of the research area from the years 1987, 1996, 2007, and 2018, which was presented in Figures 2 and 3. The number of changes in each type of land was shown in Table 3.
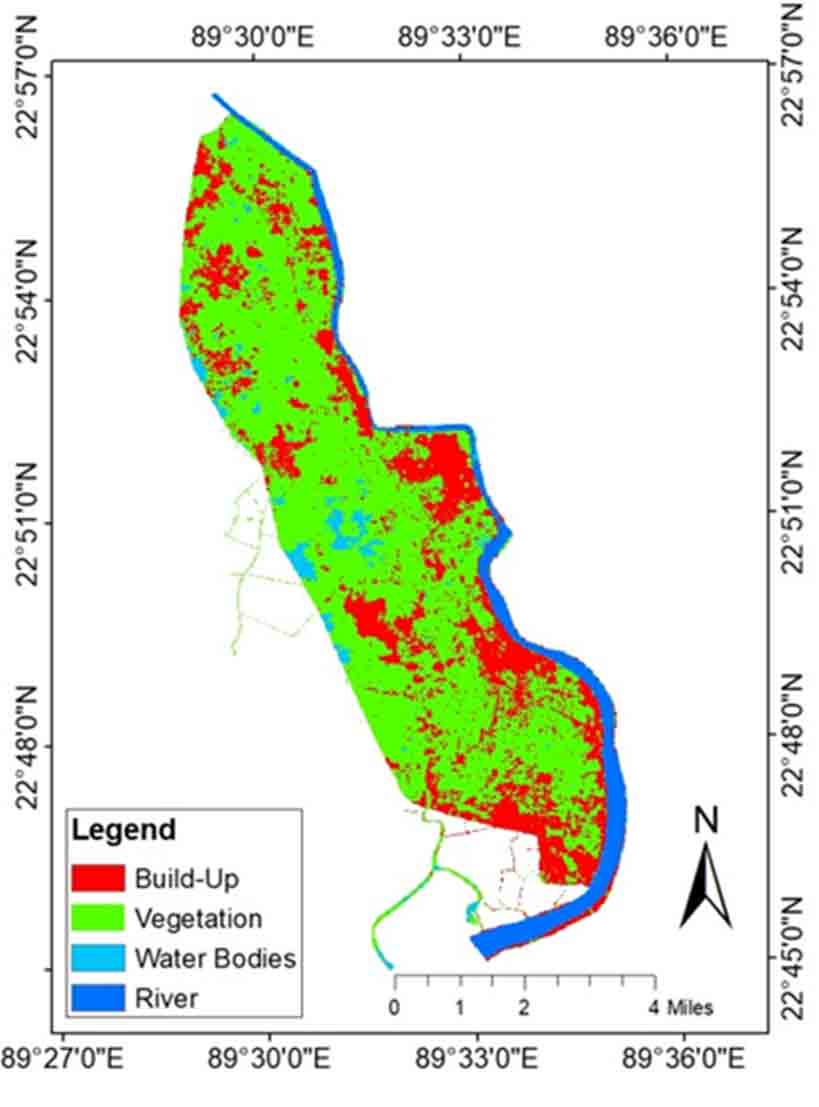
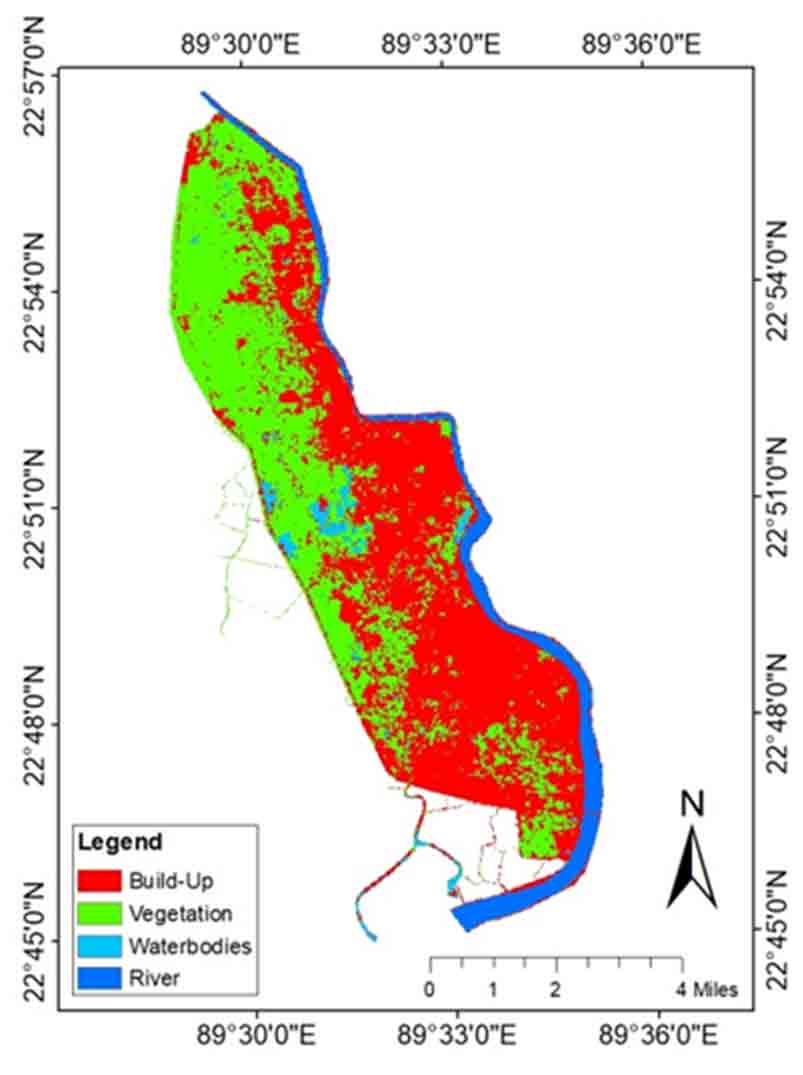
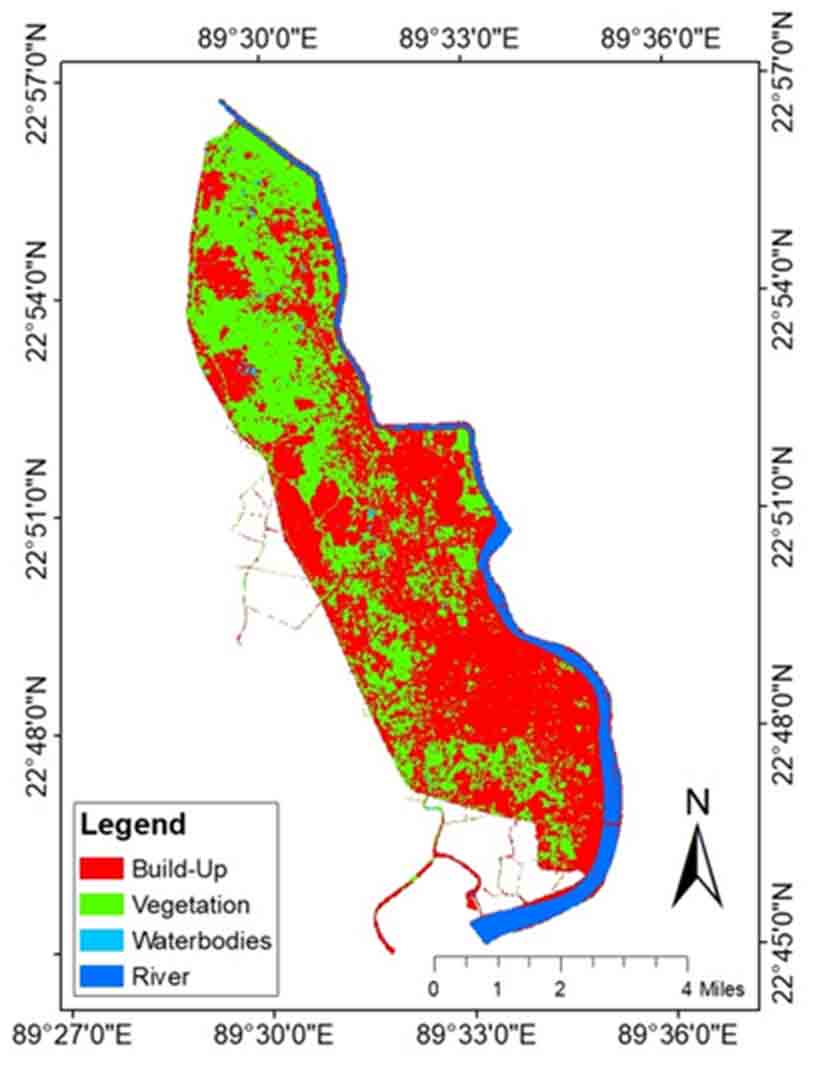
Table 3. Land use pattern in Khulna Conurbation
|
Land use types |
1987 |
1996 |
2007 |
2018 |
||||
|
Area (ha) |
% of Total |
Area (ha) |
% of Total |
Area (ha) |
% of Total |
Area (ha) |
% of Total |
|
|
Vegetation |
5716 |
65.09 |
5577 |
63.50 |
3967 |
45.17 |
3597 |
40.96 |
|
Built-up Area |
1342 |
15.28 |
1964 |
22.36 |
3890 |
44.30 |
4332 |
49.33 |
|
Water Bodies |
940 |
10.70 |
538 |
6.13 |
234 |
2.66 |
172 |
1.96 |
|
Rivers |
784 |
8.93 |
703 |
8.00 |
702 |
7.99 |
692 |
7.88 |
|
Total |
8782 |
8782 |
8782 |
8782 |
||||
A significant increase was shown in the built-up or settlement area. In 1987, the total built-up area was 1342 ha and in 2018 it was 4332 ha of land which was more than three times. The built-up area grew by 223% between 1987 and 2018 due to the rapid growth of the city, particularly in the northwest and mid-city areas. During this time, the vegetation, water bodies, and river area all showed a downward tendency. The vegetation area decreased from 5716 ha to 3597 ha during the period from 1987 to 2018. Overall, 37% of vegetation area was removed within 31 years because of urban sprawling.
The wetland area decreased from 940 ha to 172 ha from 1987 to 2018. The reduction was driven by the expansion of the developed area specially the construction land. The water body area was also replaced by vegetation or agricultural land but the amount was less than the built-up area. The river area decreased from 784 ha to 692 ha from 1987 to 2018 due to the expansion of the built-up area, dumping of waste into the river, and adjacent canal, which reduced the navigability of the river.
The confusion matrix was used to determine the precision of land use. The overall accuracy of the land use in the years 1987, 1996, 2007 and 2018 was 86%, 83%, 81%, and 82% (Table 4). As a dynamic area, the land use pattern of Khulna City Conurbation is changing continuously. Therefore, determining the accuracy of ancient satellite photos is challenging. The most recent land use classification in 2018 was based on a comprehensive ground-based analysis (Figure 6). For this study’s purposes, 50 spots across the study area were chosen at random for ground-truthing. The results revealed that of the 50 sites sampled, 44 sites corresponded to the 2018 land use map with an accuracy of 88%.
Table 4. Accuracy assessment: Confusion matrix
|
Year |
Land use types |
Built-up |
Vegetation |
River |
Water bodies |
Classification overall |
Producer’s accuracy |
Overall accuracy |
|
1987 |
Built-up |
42 |
5 |
2 |
4 |
53 |
0.79 |
86% |
|
Vegetation |
2 |
34 |
0 |
1 |
37 |
0.92 |
||
|
River |
0 |
2 |
6 |
0 |
8 |
0.75 |
||
|
Water bodies |
0 |
1 |
0 |
8 |
9 |
0.89 |
||
|
Truth overall |
44 |
42 |
8 |
13 |
107 |
|||
|
User’ accuracy |
0.95 |
0.81 |
0.75 |
0.61 |
||||
|
1996 |
Built-up |
40 |
4 |
0 |
3 |
47 |
0.85 |
83% |
|
Vegetation |
2 |
29 |
0 |
3 |
34 |
0.85 |
||
|
River |
0 |
1 |
8 |
0 |
9 |
0.89 |
||
|
Water bodies |
2 |
3 |
0 |
12 |
17 |
0.71 |
||
|
Truth overall |
44 |
37 |
8 |
18 |
107 |
|||
|
User’ accuracy |
0.91 |
0.78 |
1 |
0.67 |
||||
|
2007 |
Built-up |
36 |
5 |
2 |
5 |
48 |
0.75 |
81% |
|
Vegetation |
2 |
36 |
0 |
2 |
40 |
0.90 |
||
|
River |
0 |
1 |
7 |
0 |
8 |
0.87 |
||
|
Water bodies |
2 |
1 |
0 |
8 |
11 |
0.72 |
||
|
Truth overall |
40 |
43 |
9 |
15 |
107 |
|||
|
User’ accuracy |
0.90 |
0.83 |
0.78 |
0.53 |
||||
|
2018 |
Built-up |
36 |
4 |
0 |
5 |
45 |
0.80 |
82% |
|
Vegetation |
1 |
27 |
1 |
0 |
29 |
0.93 |
||
|
River |
1 |
0 |
12 |
0 |
13 |
0.92 |
||
|
Water bodies |
4 |
3 |
0 |
13 |
20 |
0.65 |
||
|
Truth overall |
42 |
34 |
13 |
18 |
107 |
|||
|
User’ accuracy |
0.85 |
0.79 |
0.92 |
0.72 |
3.2 Ecosystem Services Valuation
The ecosystem valuation in this study was determined by cross-referencing the four land uses against the biomes proposed by Costanza et al. (1997) in their valuation methodology. Here, the ‘cropland’ biome was used for vegetation; the ‘wetland’ biome was used for water bodies; the ‘river or lake’ biome was used for rivers, and the ‘urban’ for built-up area. Equation 1 was applied to identify individual ecosystem services derived from land use and associated ecosystem service value coefficient. To calculate the ecosystem service value, the ecosystem service value was calculated by multiplying the ecosystem service value by the surface area of the current land use categories derived from the land use analysis using ArcGIS.
The values of ecosystem services in the Khulna conurbation were calculated by applying the value coefficient and area of land purpose types for 1987, 1996 and 2007, as well as for 2018. The total ecosystem value for existing land use of Khulna Conurbation in 1987 was 51.465 million US$, 53.40 million US$ in 1996, 56.97 million US$ in 2007, and 57.74 million US$ in 2018. From 1987 to 2018, the ecosystem service values for all land use categories were negative except for urban built-up. The largest amount of decline was observed in the case of vegetation which was about 11.79 million US$.
Table 5. Ecosystem service values and the changes (1987 - 2018)
|
Land use type |
ESV (US$ × 106/year) |
ESV (US$ × 106/year) Change |
||||||
|
1987 |
1996 |
2007 |
2018 |
1996 |
2007 |
2018 |
||
|
Vegetation |
31.82 |
31.05 |
22.10 |
20.03 |
-00.80 |
-08.95 |
-02.07 |
|
|
Built-up |
08.94 |
13.08 |
25.91 |
28.90 |
04.14 |
12.83 |
02.99 |
|
|
Water bodies |
00.89 |
00.51 |
00.22 |
00.16 |
-00.38 |
-00.29 |
-00.01 |
|
|
River |
09.81 |
08.76 |
08.74 |
08.65 |
-01.05 |
-00.02 |
-00.09 |
|
|
Total |
51.47 |
53.40 |
56.97 |
57.74 |
01.90 |
03.57 |
00.82 |
|
3.3 Ecosystem Services Sensitivity Analysis
Table 6 shows the change in total estimated ecosystem services and coefficient of sensitivity (CS) after modifying the ecosystem services valuation coefficient. The predicted coefficient of sensitivity for all land use categories was less than unity in all years. In terms of value coefficients, the projected overall ecosystem service values for the study region are mainly inelastic. Thereafter modifying the value coefficient by 50%, the coefficient of sensitivity value ranged from a lower 0.003 to 0.017 for water bodies to a higher 0.174 to 0.501 for built-up areas. This also confirms the robustness of the estimates for ecosystem service values.
Table 6. Variations in estimated ecosystem services and coefficient of sensitivity
|
Change in value coefficient |
1987 |
1996 |
2007 |
2018 |
||||
|
% |
CS |
% |
CS |
% |
CS |
% |
CS |
|
|
Vegetation ± 50% |
30.90 |
0.618 |
29.05 |
0.581 |
19.40 |
0.388 |
17.35 |
0.347 |
|
Built-up area± 50% |
08.70 |
0.174 |
12.25 |
0.245 |
22.75 |
0.455 |
25.05 |
0.501 |
|
Water bodies± 50% |
00.85 |
0.017 |
00.50 |
0.010 |
00.20 |
0.004 |
00.15 |
0.003 |
|
River± 50% |
09.55 |
0.191 |
08.2 |
0.164 |
07.65 |
0.153 |
07.50 |
0.150 |
4. Discussion
In order to comprehend the influence of human activities on the quality and amount of ES, it is necessary to provide a measure of alterations in ecosystem services associated with land use alteration (Rimal et al., 2015). In this study, we observed the loss of vegetation, water bodies, and rivers and a corresponding increase in urban areas between 1987 and 2018. According to earlier studies in other regions of Bangladesh urban development has mostly come at the expense of vegetative land and marsh (Dewan and Yamaguchi, 2009; Ullah and Enan, 2016; Hasan et al., 2020; Kafy et al., 2020). All ecosystem services delivered by the other three land use categories studied for this study were impacted by land use changes in the area.
The key influencing factors for land-use changes in Khulna Conurbation are population increase, fast urbanization, and economic development (Patwary et al., 2020). Before the 60s or 70s, the geographical expansion of Khulna City was not as challenging (Ahmed, 2011). However, after the liberation war, Khulna City is changing rapidly. The city has gone through drastic transformations because of urbanization and land-use changes. The city’s landscape is changing as wetlands, lowlands, open areas, and farmland are being used for construction and development, which is impacting the ecosystem services and values (Rahman et al., 2009). From 2001 to 2011, the Khulna conurbation is facing rapid urbanization with an urbanization level of 28.49% and during that period the population of Khulna increased by 37% (Khan et al., 2014). This form of fast urban expansion and population rise was accountable for land change as well as the value of ecological services.
Only four types of land were considered for this research, which limit the detailed valuation of ecosystem service value. The next one is the correctness of land use arrangement. More accurate results are obtained from higher-resolution land use data (Wang et al., 2018). However, due to a lack of up-to-date reference data and complex topography, our overall classifications for the years were only 86%, 83%, 81%, and 82% accurate. Due to the low resolution of the remote sensing image, it was not able to distinguish grassland, forest, and other types of land in the built-up region. To overcome these constraints, it is required to further categorize land use and land cover and to construct high-resolution land use and cover databases (Liu et al., 2020). In this research, we used the benefit transfer model to assess the monetary worth of ecosystem services. Despite widespread criticism, we continued to apply this technique for the value of ecosystem services due to the low cost and speedy evaluation involved with assembling raw input to meet research aims (Troy and Wilson, 2006).
5. Conclusion
The purpose of this paper is to analyse the effects of land use shifts on ecosystem services in the Khulna Conurbation. In the past three decades, Khulna City has seen a significant shift in its land use due to the rapid growth in population and the intensification of development. Changes in land use patterns have influenced overall ecosystem services. An increase in settlement area is a major threat as the conversion of land from agriculture and wetland into urban area led to a decreased ecosystem.
Since this study focused on inspecting the four types and their effects on ecosystem values, it is possible that the results may be different if more land types are used. Besides, there were fewer studies of ecosystem services and valuation in Khulna Conurbation, so there is a great opportunity to conduct more studies of the nearby regions and make a comparison among the regions. The value of urban ecosystem services has several implications for feasible land zoning planning due to its enormous influence on the well-being of urban dwellers. Urban vegetation, for example, regulates the urban heat island effect. Land conversion from vegetation to built-up can raise the power needed for air conditioning and warming buildings, escalating the number of public suffering from gasping ailments, and have a variety of other consequences. The findings would be used to create a model to guide future land use decisions by identifying declining land types and ecosystem services that need more attention. The result would also be helpful for decision-makers and policymakers as they should consider the development of old Khulna city as lesson learning and should consider different urban planning techniques and principles for the further development of the city and enforce various environmental and ecosystem conservation measures to improve ecosystem services.
Conflict of interest
The authors declare no conflict of reported in this paper.
Acknowledgements
We are thankful to the United States Geological Survey (USGS) for the Landsat images. We are also grateful to the Khulna Development Authority for supplying GIS details for Khulna City.
Abbreviations
ES: Ecosystem Services; ESV: Ecosystem Services Value; GIS: Geographic Information System; LULC: Land Use Land Cover.
Article information
- Received
- 12 Jan 2023
- Revised
- 7 Jul 2023
- Accepted
- 8 Jul 2023
- Published
- 16 Dec 2023
- Handling editor
- Dr. Suresh Kumar
- Licence
- CC BY-NC-ND 4.0
- Journal
- Remote Sensing of Land, ISSN 2582-3019
References
-
Ahmed, B., 2011. Modelling spatio-temporal urban land cover growth dynamics using remote sensing and GIS techniques: A case study of Khulna City. J. Bangladesh Instit. Plan, 4, 43.
-
Akber, M. A., Khan, M. W. R., Islam, M. A., Rahman, M. M. and Rahman, M. R., 2018. Impact of land use change on ecosystem services of southwest coastal Bangladesh. Journal of land use science, 13(3), 238-250.
Crossref -
Anley, M. A., Minale, A. S., Haregeweyn, N. and Gashaw, T., 2022. Assessing the impacts of land use/cover changes on ecosystem service values in Rib watershed, Upper Blue Nile Basin, Ethiopia. Trees, Forests and People, 7, 100212.
Crossref -
Arowolo, A. O., Deng, X., Olatunji, O. A. and Obayelu, A. E., 2018. Assessing changes in the value of ecosystem services in response to land-use/land-cover dynamics in Nigeria. Science of the total Environment, 636, 597-609.
Crossref -
BBS [Bangladesh Bureau of Statistics] 2022. Statistical Year Book of Population and Housing Census.
-
Baveye, P. C., Baveye, J. and Gowdy, J., 2013. Monetary valuation of ecosystem services: It matters to get the timeline right. Ecological Economics, 95, 231-235.
Crossref -
Belay, T., Melese, T. and Senamaw, A., 2022. Impacts of land use and land cover change on ecosystem service values in the Afroalpine area of Guna Mountain, Northwest Ethiopia. Heliyon, 8(12), e12246.
Crossref -
Birhanu, L., Hailu, B. T., Bekele, T. and Demissew, S., 2019. Land use/land cover change along elevation and slope gradient in highlands of Ethiopia. Remote Sensing Applications: Society and Environment, 16, 100260.
Crossref -
Chen, Y., Lu, H., Li, J. and Xia, J., 2020. Effects of land use cover change on carbon emissions and ecosystem services in Chengyu urban agglomeration, China. Stochastic Environmental Research and Risk Assessment, 34, 1197-1215.
Crossref -
Costanza, R., d’Arge, R., de Groot, R., Farber, S., Grasso, M., Hannon, B. and Van den Belt, M., 1997. The value of the world’s ecosystem services and natural capital. Nature, 387, 253-260.
Crossref -
Costanza, R., de Groot, R., Sutton, P., van der Ploeg, S., Anderson, S. J., Kubiszewski, I. and Turner, R. K., 2014. Changes in the global value of ecosystem services. Global Environmental Change, 26(1), 152-158.
Crossref -
De Araujo Barbosa, C. C., Atkinson, P. M. and Dearing, J. A., 2016. Extravagance in the commons: Resource exploitation and the frontiers of ecosystem service depletion in the Amazon estuary. Science of the Total Environment, 550, 6-16.
Crossref -
Dewan, A. M. and Yamaguchi, Y., 2009. Land use and land cover change in Greater Dhaka, Bangladesh: Using remote sensing to promote sustainable urbanization. Applied Geography, 29, 390-401.
Crossref -
Dewan, A. M., Yamaguchi, Y. and Rahman, M. Z., 2010. Dynamics of land use/cover changes and the analysis of landscape fragmentation in Dhaka metropolitan, Bangladesh. Geo Journal, 77, 315-330.
Crossref -
Dey, N. N., Al Rakib, A., Kafy, A. A. and Raikwar, V., 2021. Geospatial modelling of changes in land use/land cover dynamics using Multi-layer perception Markov chain model in Rajshahi City, Bangladesh. Environmental Challenges, 4, 100148.
Crossref -
Escobedo, F. J., Kroeger, T. and Wagner, J. E., 2011. Urban forests and pollution mitigation: Analyzing ecosystem services and disservices. Environmental pollution, 159(8-9), 2078-2087.
Crossref -
Guo, P., Zhang, F. and Wang, H., 2022. The response of ecosystem service value to land use change in the middle and lower Yellow River: A case study of the Henan section. Ecological Indicators, 140, 109019.
Crossref -
Haque, M. N., Saroar, M., Fattah, M. A. and Morshed, S. R., 2020. Public-private partnership for achieving sustainable development goals: a case study of Khulna, Bangladesh. Public Administration and Policy: An Asia-Pacific Journal, 23(3), 283-298.
Crossref -
Hassan, M. M., 2017. Monitoring land use/land cover change, urban growth dynamics and landscape pattern analysis in five fastest urbanized cities in Bangladesh. Remote Sensing Applications: Society and Environment, 7, 69-83.
Crossref -
Hasan, S. S., Deng, X., Li, Z. and Chen, D., 2017. Projections of future land use in Bangladesh under the background of baseline, ecological protection and economic development. Sustainability, 9(4), 505.
Crossref -
Hasan, S. S., Sarmin, N. S. and Miah, M. G., 2020. Assessment of scenario-based land use changes in the Chittagong hill tracts of Bangladesh. Environmental Development, 34, 100463.
Crossref -
Hoque, M. Z., Islam, I., Ahmed, M., Hasan, S. S. and Prodhan, F. A., 2022. Spatio-temporal changes of land use land cover and ecosystem service values in coastal Bangladesh. The Egyptian Journal of Remote Sensing and Space Science, 25(1), 173-180.
Crossref -
Horlings, E., Schenau, S., Hein, L., Lof, M., de Jongh, L. and Polder, M., 2020. Experimental monetary valuation of ecosystem services and assets in the Netherlands. Wageningen University and Research, The Netherlands, 100.
-
Islam, G. T., Islam, A. S., Shopan, A. A., Rahman, M. M., Lázár, A. N. and Mukhopadhyay, A., 2015. Implications of agricultural land use change to ecosystem services in the Ganges delta. Journal of environmental management, 161, 443-452.
Crossref -
Islam, M. R., Miah, M. G. and Inoue, Y., 2016. Analysis of land use and land cover changes in the coastal area of Bangladesh using landsat imagery. Land Degradation and Development, 27(4), 899-909.
Crossref -
Jiang, W., Lü, Y., Liu, Y. and Gao, W., 2020. Ecosystem service value of the Qinghai-Tibet Plateau significantly increased during 25 years. Ecosystem Services, 44, 101146.
Crossref -
Johansen, K., Phinn, S. and Taylor, M., 2015. Mapping woody vegetation clearing in Queensland, Australia from Landsat imagery using the Google Earth Engine. Remote Sensing Applications: Society and Environment, 1, 36-49.
Crossref -
Kafy, A. A., Faisal, A. A., Sikdar, S., Hasan, M., Rahman, M., Khan, M. H. and Islam, R., 2020. Impact of LULC changes on LST in Rajshahi district of Bangladesh: A remote sensing approach. Journal of Geographical Studies, 3(1), 11-23.
Crossref -
Khan, H. M., Rahman, M., Faruque, F and Haque, U., 2014. Natural disasters and landuse/land cover change in the southwest coastal areas of Bangladesh. Regional Environmental Change, 87(1).
-
Kindu, M., Schneider, T., Teketay, D. and Knoke, T., 2016. Changes of ecosystem service values in response to land use/land cover dynamics in Munessa-Shashemene landscape of the Ethiopian highlands. Science of the Total Environment, 547, 137-147.
Crossref -
Kreuter, U. P., Harris, H. G., Matlock, M. D. and Lacey, R. E., 2001. Change in ecosystem service values in the San Antonio area, Texas. Ecological economics, 39(3), 333-346.
Crossref -
Lambin, E. F. and Meyfroidt, P., 2011. Global land use change, economic globalization, and the looming land scarcity. Proceedings of the national academy of sciences, 108(9), 3465-3472.
Crossref -
Langemeyer, J., Gómez-Baggethun, E., Haase, D., Scheuer, S. and Elmqvist, T., 2016. Bridging the gap between ecosystem service assessments and land-use planning through Multi-Criteria Decision Analysis (MCDA). Environmental Science and Policy, 62, 45-56.
Crossref -
Li, R. Q., Dong, M., Cui, J. Y., Zhang, L. L., Cui, Q. G. and He, W. M., 2007. Quantification of the impact of land-use changes on ecosystem services: A case study in Pingbian County, China. Environmental monitoring and assessment, 128(1), 503-510.
Crossref -
Liu, W., Zhan, J., Zhao, F., Yan, H., Zhang, F. and Wei, X., 2019. Impacts of urbanization-induced land-use changes on ecosystem services: A case study of the Pearl River Delta Metropolitan Region, China. Ecological Indicators, 98, 228-238.
Crossref -
Liu, Y., Hou, X., Li, X., Song, B. and Wang, C., 2020. Assessing and predicting changes in ecosystem service values based on land use/cover change in the Bohai Rim coastal zone. Ecological Indicators, 111, 106004.
Crossref -
Liu, J., Kuang, W., Zhang, Z., Xu, X., Qin, Y., Ning, J. and Chi, W., 2014. Spatiotemporal characteristics, patterns, and causes of land-use changes in China since the late 1980s. Journal of Geographical sciences, 24(2), 195-210.
Crossref -
Liu, Y. G., Zeng, X. X., Xu, L., Tian, D. L., Zeng, G. M., Hu, X. J. and Tang, Y. F., 2011. Impacts of land-use change on ecosystem service value in Changsha, China. Journal of Central South University, 18(2), 420-428.
Crossref -
Long, H., Liu, Y., Hou, X., Li, T. and Li, Y., 2014. Effects of land use transitions due to rapid urbanization on ecosystem services: Implications for urban planning in the new developing area of China. Habitat international, 44, 536-544.
Crossref -
MEA [Millennium Ecosystem Assessment], 2005. Ecosystems and Human Well-being: Synthesis. Island Press, Washington DC.
-
Mondal, K. K., Akhter, M. A., Mallik, M. and Hassan, S. Q., 2017. Study on rainfall and temperature trend of Khulna division in Bangladesh. Dew-Drop, 4, 77-83.
-
Moniruzzaman, M., Roy, A., Bhatt, C. M., Gupta, A., An, N. T. T. and Hassan, M. R., 2018. Impact analysis of urbanization on land use land cover change for Khulna City, Bangladesh using temporal landsat imagery. Int Arch Photogramm Remote Sens Spatial Inf Sci, 42(5), 757-760.
Crossref -
Morshed, S. R., Fattah, M. A., Haque, M. N. and Morshed, S. Y., 2022. Future ecosystem service value modeling with land cover dynamics by using machine learning based Artificial Neural Network model for Jashore city, Bangladesh. Physics and Chemistry of the Earth, Parts a/b/c, 126, 103021.
Crossref -
Mukhopadhay, A., Hornby, D. D., Hutton, C. W., Lazar, A. N., Johnson, F. A. and Ghosh., T., 2018. Land cover and land use analysis in coastal Bangladesh. Ecosystem Services for Well-Being in Deltas, 367-381.
Crossref -
Mukul, S. A., Sohel, M. S. I., Herbohn, J., Inostroza, L. and König, H., 2017. Integrating ecosystem services supply potential from future land-use scenarios in protected area management: A Bangladesh case study. Ecosystem Services, 26, 355-364.
Crossref -
Patwary, M. M., Ashraf, S. and Shuvo, F. K., 2020. Land Use Changes and their Effects on urban Ecosystem services value: a study of Khulna City, Bangladesh. In 2020 IEEE India Geoscience and Remote Sensing Symposium (InGARSS), 62-65.
-
Rahman, M. M., Akteruzzaman, A. K. M., Khan, M. M. H., Jobber, A. and Rahman, M. M., 2009. Analysis of water logging problem and its environmental effects using GIS approaches in Khulna City of Bangladesh. Journal of Socioeconomic Research and Development, 6(2), 572-577.
-
Rahman, M. M. and Szabó, G., 2021. Impact of land use and land cover changes on urban ecosystem service value in Dhaka, Bangladesh. Land, 10(8), 793.
Crossref -
Rawat, J. S. and Kumar, M., 2015. Monitoring land use/cover change using remote sensing and GIS techniques: A case study of Hawalbagh block, district Almora, Uttarakhand, India. The Egyptian Journal of Remote Sensing and Space Sciences, 18, 77-84.
Crossref -
Rimal, B., Sharma, R., Kunwar, R., Keshtkar, H., Stork, N. E., Rijal, S. and Baral, H., 2019. Effects of land use and land cover change on ecosystem services in the Koshi River Basin, Eastern Nepal. Ecosystem services, 38, 100963.
Crossref -
Rotich, B., Kindu, M., Kipkulei, H., Kibet, S. and Ojwang, D., 2022. Impact of land use/land cover changes on ecosystem service values in the cherangany hills water tower, Kenya. Environmental Challenges, 8, 100576.
Crossref -
Sayed, B. M. and Haruyama, S., 2015. Dynamics of land use/cover change in Manikganj District, Bangladesh: A case study of Manikganj Sadar Upazila. Journal of Geographic Information System, 2015, 7, 579-587.
Crossref -
Spake, R., Lasseur, R., Crouzat, E., Bullock, J. M., Lavorel, S., Parks, K. E. and Eigenbrod, F., 2017. Unpacking ecosystem service bundles: Towards predictive mapping of synergies and trade-offs between ecosystem services. Global Environmental Change, 47, 37-50.
Crossref -
Sumari, N. S., Cobbinah, P. B., Ujoh, F. and Xu, G., 2020. On the absurdity of rapid urbanization: Spatio-temporal analysis of land-use changes in Morogoro, Tanzania. Cities, 107, 102876.
Crossref -
Talberth, J., 2015. Valuing ecosystem services in the lower Mekong basin: Country report for Cambodia. Washington DC: USAID Mekong ARCC.
-
Temesgen, H., Wu, W., Shi, X., Yirsaw, E., Bekele, B. and Kindu, M., 2018. Variation in ecosystem service values in an agroforestry dominated landscape in Ethiopia: Implications for land use and conservation policy. Sustainability, 10(4), 1126.
Crossref -
Tian, P., Li, J., Cao, L., Pu, R., Gong, H., Liu, Y. and Chen, H., 2021. Impacts of reclamation derived land use changes on ecosystem services in a typical gulf of eastern China: A case study of Hangzhou Bay. Ecological Indicators, 132, 108259.
Crossref -
Tolessa, T., Kidane, M. and Bezie, A., 2021. Assessment of the linkages between ecosystem service provision and land use/land cover change in Fincha watershed, North-Western Ethiopia. Heliyon, 7(7), e07673.
Crossref -
Tolessa, T., Senbeta, F. and Kidane, M., 2017. The impact of land use/land cover change on ecosystem services in the central highlands of Ethiopia. Ecosystem services, 23, 47-54.
Crossref -
Troy, A. and Wilson, M. A., 2006. Mapping ecosystem services: Practical challenges and opportunities in linking GIS and value transfer. Ecological economics, 60(2), 435-449.
Crossref -
Ullah, M. S. and Enan, M. E., 2016. Landuse and land cover change in Dhaka metropolitan area during. Orient Geogr, 60(1, 2), 12-20.
Crossref -
Wang, X., Zhang, X., Feng, X., Liu, S., Yin, L. and Chen, Y., 2020. Trade-offs and synergies of ecosystem services in karst area of China driven by grain-for-green Program. Chinese Geographical Science, 30, 101-114.
Crossref -
Wang, Y., Dai, E., Yin, L. and Ma, L., 2018. Land use/land cover change and the effects on ecosystem services in the Hengduan Mountain region, China. Ecosystem Services, 34, 55-67.
Crossref -
Wang, Y., Li, X., Zhang, Q., Li, J. and Zhou, X., 2018. Projections of future land use changes: Multiple scenarios-based impacts analysis on ecosystem services for Wuhan city, China. Ecological Indicators, 94, 430-445.
Crossref -
Wang, Y., Zhang, Z. and Chen, X., 2022. Spatiotemporal change in ecosystem service value in response to land use change in Guizhou Province, southwest China. Ecological Indicators, 144, 109514.
Crossref -
Xia, X. X., Zhu, L., Yang, A. M., Jin, H. and Zhang, Q. Q., 2020. Evaluate the positive and negative value of ecosystem services based on Mountain-Desert-Oasis system (MODS): A case study of Manas River Basin in Xinjiang. Acta Ecol. Sin, 40, 3921-3934.
Crossref -
Xie, G., Zhang, C., Zhen, L. and Zhang, L., 2017. Dynamic changes in the value of China’s ecosystem services. Ecosystem services, 26, 146-154.
Crossref -
Yi, H., Güneralp, B., Filippi, A. M., Kreuter, U. P. and Güneralp, İ., 2017. Impacts of land change on ecosystem services in the San Antonio River Basin, Texas, from 1984 to 2010. Ecological Economics, 135, 125-135.
Crossref -
Zang, S., Wu, C., Liu, H. and Na, X., 2011. Impact of urbanization on natural ecosystem service values: A comparative study. Environmental monitoring and assessment, 179(1), 575-588.
Crossref -
Zannat, E.U., 2012. A Study on Land Use Policies of Khulna Structure Plan 2000-2020 in the Light of Climate Change Induced Flood Scenario. MURP (Urban and Regional Planning) Thesis, Department of Urban and Regional Planning, Bangladesh University of Engineering and Technology (BUET).
-
Zhao, Q., Wen, Z., Chen, S., Ding, S. and Zhang, M., 2020. Quantifying land use/land cover and landscape pattern changes and impacts on ecosystem services. International journal of environmental research and public health, 17(1), 126.
Crossref -
Zhao, B., Kreuter, U., Li, B., Ma, Z., Chen, J. and Nakagoshi, N., 2004. An ecosystem service value assessment of land-use changes on Chongming Island, China. Land Use Policy, 21(2), 139-148.
Crossref