

Hydrospatial Analysis Volume 7 (2023), Issue 1 · pp. 19-27
Original Research Paper Open Access

Spatial Interpolations of Annual Rainfall in Ethiopia Using Simple and Universal Kriging Techniques
- Department of Soil Resource and Watershed Management, Assosa University, Assosa, Ethiopia P. O. Box 18, Assosa, Ethiopia.
* Corresponding author: Kasye Shitu, kasye6@gmail.com
Contents
Highlights
- The distribution of precipitation is an important aspect of water-related research like, hydrological modeling, disaster prediction and watershed management.
- This study was focused on to select the best fit semivarogram model for annual rainfall interpolation.
- The long term mean annual rainfall collected from 931 meteorological stations were interpolated using different mathematical variogram models of Kriging.
- Spherical model was found to be the best fitted variogram model and most accurate model for interpolation using both Simple and Universal Kriging.
Abstract
The study of spatial distribution of precipitation is an important aspect of water-related research like, hydrological modeling, disaster prediction and watershed management. But, spatial interpolations of annual average rainfall in Ethiopia using Simple and Universal Kriging type through different models has not yet investigated. This study was focused on to select the best fit semivarogram model for annual rainfall interpolation and to map the spatial distribution of rainfall of Ethiopia. In this study, long term mean annual rainfall which was collected from 931 meteorological station were interpolated using different mathematical variogram models of Kriging to select the best fit variogram model useful to predict continuous surface values of annual average rainfall in Ethiopia. Spherical model was found to be the best fitted variogram model and most accurate model for interpolation using both Simple and Universal Kriging with the value of ME (0.005), RMSE (1.21) and MSDR (121.32) and ME (0.001), RMSE (0.88) and MSDR (144.11), respectively. Since the kriging results of spherical model indicate good model efficacy for this study, it may be useful to map spatial pattern of annual rainfall in Basin level in Ethiopia.
Keywords EthiopiaInterpolationRainfallSimple KrigingUniversal Kriging
1. Introduction
Rainfall trends are often cited as one of the most important factors in explaining various socio-economic problems, such as food insecurity, in the country whose economy is heavily dependent on low productivity rainfed agriculture (Cheung et al., 2008). The study of spatial distribution of precipitation is an important aspect of water-related research like, hydrological modeling, disaster prediction and watershed management (Chen et al., 2017). Geostatistical methods are widely applied in spatial interpolation from point measurement to continuous surfaces (Ly et al., 2011).
Kriging/cokriging, areral interpolation and Baysisan kriging are geostatistical approaches in estimating spatial distribution of environmental variables through geostatistical wizard in Arc GIS environment. Kriging/cokriging consist several methods, including ordinary, simple, universal, indicator, probability and disjunctive, which are commonly applied for estimating spatial distribution of variables in the environment (Dindaroğlu, 2014; Gyamfi et al., 2016).
In Ethiopia, Najnin and Sahalu (2019) has analyzed the spatial pattern of precipitation in the north-western part of Ethiopia (Gojjam) using spatial interpolation (Inverse Distance Weighting) and different geostatistical interpolation methods, like, ordinary kriging, simple kriging and universal kriging. Taye et al. (2018) also, analysis the spatial patterns of rainfall across the agro-climatic zones of Jema watershed in the northwestern highlands of Ethiopia using the Ordinary Kriging (OK), Simple Kriging (SK), Universal Kriging (UK), Disjunctive Kriging (DK), Ordinary Cokriging (OCK), Inverse Distance Weighting (IDW), Global Polynomial Interpolation (GPI), Local Polynomial Interpolation (LPI) and Radial Basis Function (RBF) interpolation models.
Spatial interpolations of annual average rainfall in Ethiopia using Simple and Universal Kriging types by different models like stable, spherical, gaussian and RQ has not yet investigated. Therefore, the present study was conducted to select the best fit semivarogram model for annual rainfall interpolation in Ethiopia using simple and universal kriging and to map the spatial distribution map of the average annual rainfall of Ethiopia. The study may have advantages to understand spatial variations in rainfall in a given area and useful in the field of irrigation for water management, water resource planning and management for different organization in Ethiopia.
2. Study Area
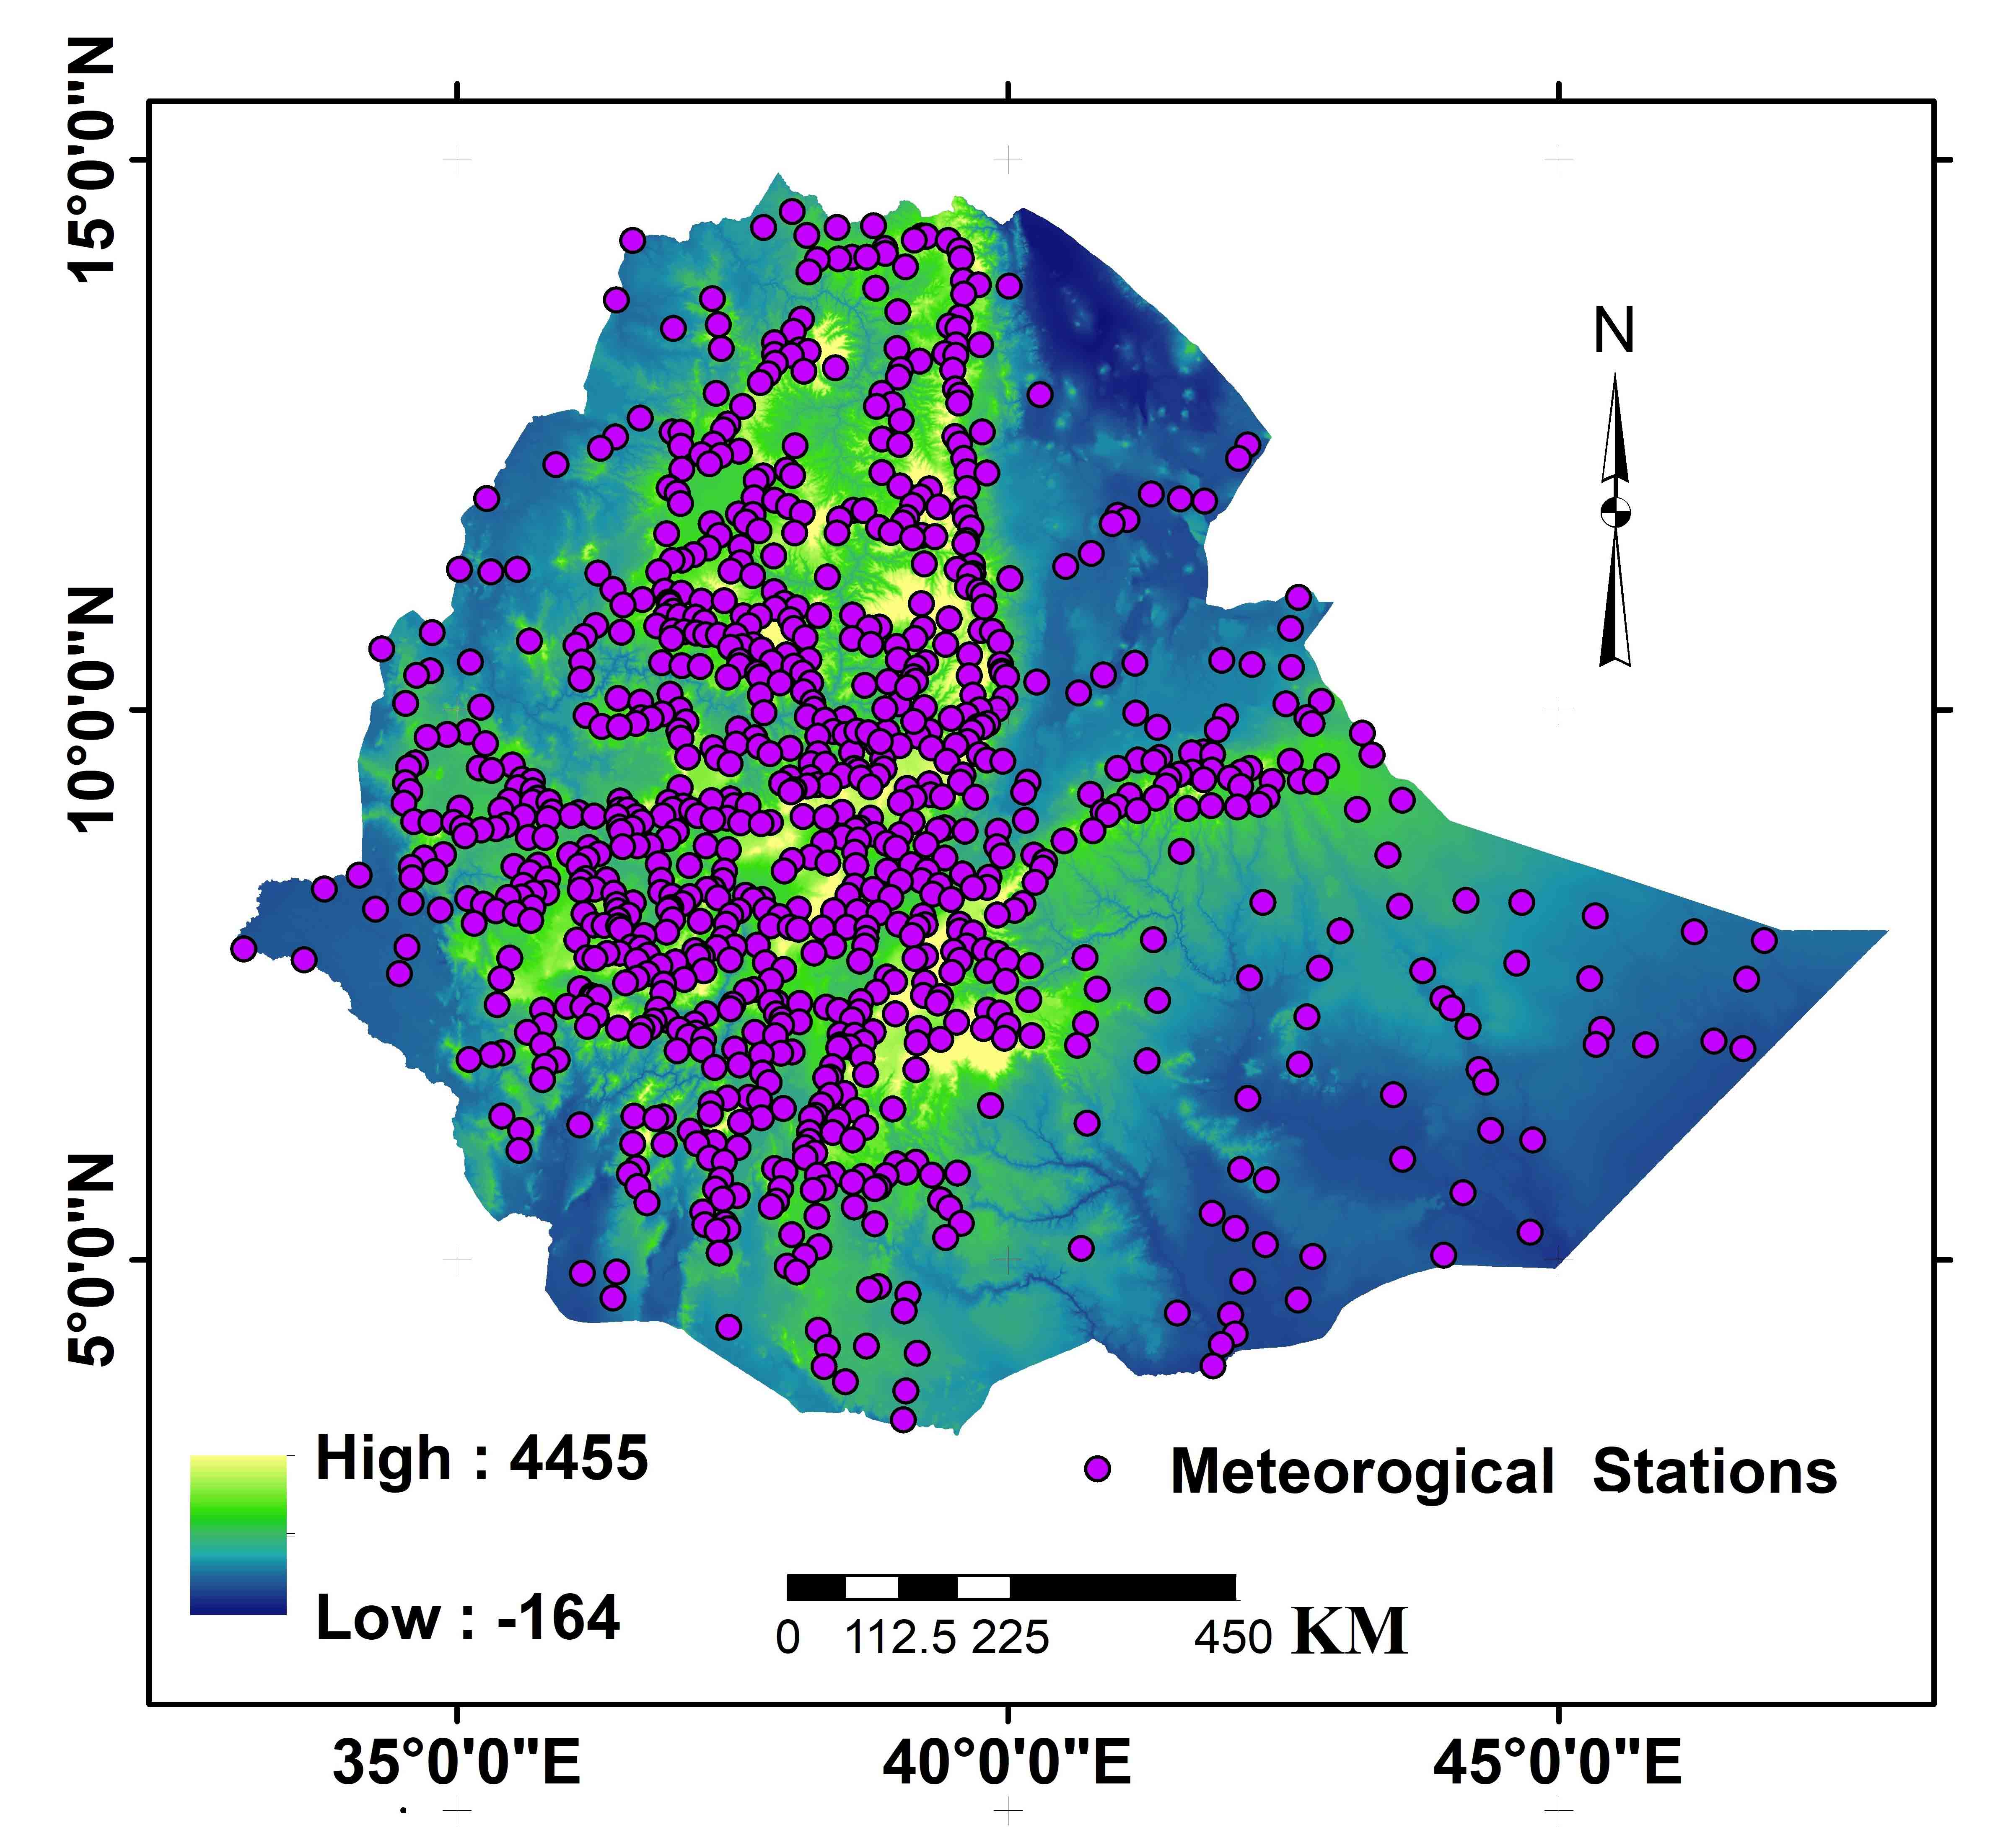
The geographic locations of meteorological stations are shown on the map (Figure 1). Ethiopia has various climate zones that oscillating from semi-arid desert in the lowlands to humid and warm (temperate) in the southwest of the country. According to Berhanu et al. (2014), the mean annual rainfall in Ethiopia ranges from 141 mm in the arid region of the country’s eastern borders to 2275mm in the southwest highland. The mean annual temperature also varies widely based on the altitude difference from 15°C on the highlands to 25°C on the lowlands (Regassa et al., 2010).
3. Methodology
3.1 Rainfall Data
In this particular study long term mean annual rainfall which was collected from 931 meteorological station of Ethiopia (Figure 1) distributed randomly throughout the Ethiopia. The data was collected from the Ethiopia meteorological agency.
3.2 Geostatistical Methods
Geostatistical method is an application of the theory of random functions to spatially distributed data (Wackernagel, 2004). A continuous surface values can be predicted between the known locations from a scattered set of known points through a geostatistical methods like Kriging or Cokriging (Belkhiri et al., 2020). From a scattered set of annual average rainfall data recorded at meteorological station, continuous surface values of the rainfall were forecasted among the known locations using Kriging or Cokriging (ordinary, simple, universal, indicator, probability and disjunctive).
Simple and Universal kriging interpolation techniques were used to estimate continuous surface maps of the annual rainfall in Ethiopia. The change in semivariance between metrological stations displayed through semivariogram as the distance between them increases. At a given lag (h), the semivariance function γ(h) is calculated using the following formula (Trangmar et al., 1986):
\(γ(h)= {{1 \over 2N(k)} \sum^{N(k)}_{i=1} [z(x_i)-z(x_1}+h)]^2\) (1)
where, \(γ(h)\) = semi-variance, Z = regionalized variable (i.e. annual mean rainfall), \(z(x_i)\) = measured sample at point \(x_i\) , \(z(x_i+h)\) = measured sample at point \((x_i+h)\) , N(k) = number of pairs separated by distance.
The estimation of unknown true value \(Z(x_o)\) through kriging can be stated as:
\(Z(x_o)= \sum^{N(k)}_{i=1} \lambda_i Z(x_i)\) (2)
where, \(\lambda_i(h)\) = estimate of unknown true value, \(\lambda_i\) = weighted coefficient, n= number of neighboring observation used in kriging.
Information about the arrangement of the spatial variation as well as the input parameters for kriging can deliver through mathematical models (Belkhiri et al., 2020). In this study, four mathematical models were fitted to the long year average annual rainfall variables in the entire area of Ethiopia. In its effective ranges, the year average annual rainfall data of the country had a spatial autocorrelation. Stable, spherical, gaussian and rational quadratic models were used to fit the variogram of average annual rainfall data through simple and universal kriging.
3.2.1 Simple Kriging
Estimating values of continuous random spatial variables from the given data set without bias and with minimum variance is possible using simple kriging technique (Webster and McBratney, 1987). According to Cressie (1991) and Radhakrishna and Helge (1995), It is the simplest case of geostatistical prediction and can be introduced as heterogeneously linear predictor in the form of:
\(Ẑ(s_0 )=p(Z,s_0 )=λ_0 λ^T Z(s) \) (3)
3.2.2 Universal Kriging
Universal kriging is an estimation procedure within the context of the regionalized variable theory (Olea, 1974). It is a type of interpolation method for producing contour maps from irregularly spaced sample points, taking into account the trend which is of known form through assuming a known covariance model to express correlation of points at a short distance apart (Warnes, 1986). Based on the universal kriging theory, the relationship of the predicted value \(Û(s_0 )\) and measured values \(U(s_i )\) on n locations can be expressed as a linear combination of the following formula (Kastelec and Košmelj, 2002):
\(Û(s_0 )= \sum^{N(k)}_{i=1} \lambda_i U(s_i)\) (4)
where, \(\lambda_i\) = linear coefficients, \(Û(s_0 )\) = predicted annual rainfall value, \(U(s_i )\) = measured annual values
3.2.3 Model Validation and Error Assessments
The validation and uncertainty of models of the two kriging techniques (simple and universal kriging) of this study were estimated by the difference between the observations and the predictions at the validation sites and were calculated by the following terms and equation.
- The mean error (ME): It is used to determine the degree of bias during estimation and expressed as in the form of:
\(ME = {{\sum^n_1 [Ẑ(s_i )-Z(s_i )]} \over n}\) (5)
- The root mean square error (RMSE): This gives an estimate value of the standard deviation of the residuals (prediction errors) and calculated by the following equation:
\(RMSE = { \sqrt{{{\sum^n_1) [Ẑ(s_i )-Z(s_i )]} \over n}} }\) (6)
- The mean squared deviation ratio (MSDR): It is the mean of the ratio of the squared prediction errors to the kriging variance and expressed as follows:
\(MSDR = {1 \over 2} \sum^n_{1} {{[Ẑ(s_i )-Z(s_i )]^2} \over \sigma^2(s_i)}\) (7)
According toTziachris et al. (2017), in order to say beast fit model the ME should be close to zero for unbiased predictions, the MSDR should be close to one for a good model, and a low RMSE is associated with greater predictive accuracy of the model.
The spatial dependence of the average annual rainfall in Ethiopia was determined by semivariance analysis: the average annual rainfall in each metrological station were modeled with stable, spherical, gaussian, exponential and rational quadratic semivariograms with a nugget effect and it’s spatial dependency was evaluated in terms of the ratio of nugget ( C0 ) to sill ( C0+C ) in percentage. The spatial continuity of average annual rainfall data at close distances can be expressed using an indicator of nugget effect (Paz-Gonzalez et al., 2000). The semivariogram with lower nugget effect was selected as the best semivariogram model for the study and the kriging value of this model was then used to map the spatial pattern of annual rainfall in Ethiopia.
According to Belkhiri et al. (2020) the environmental variable is considered as a strong spatial dependence when the value of nugget ( C0 ) to sill ( C0+C ) ratio is less than 25%, a moderate spatial dependence when this value is between 25% and 75%, and a weak spatial dependence when the value is greater than 75%.
4. Results And Discussion
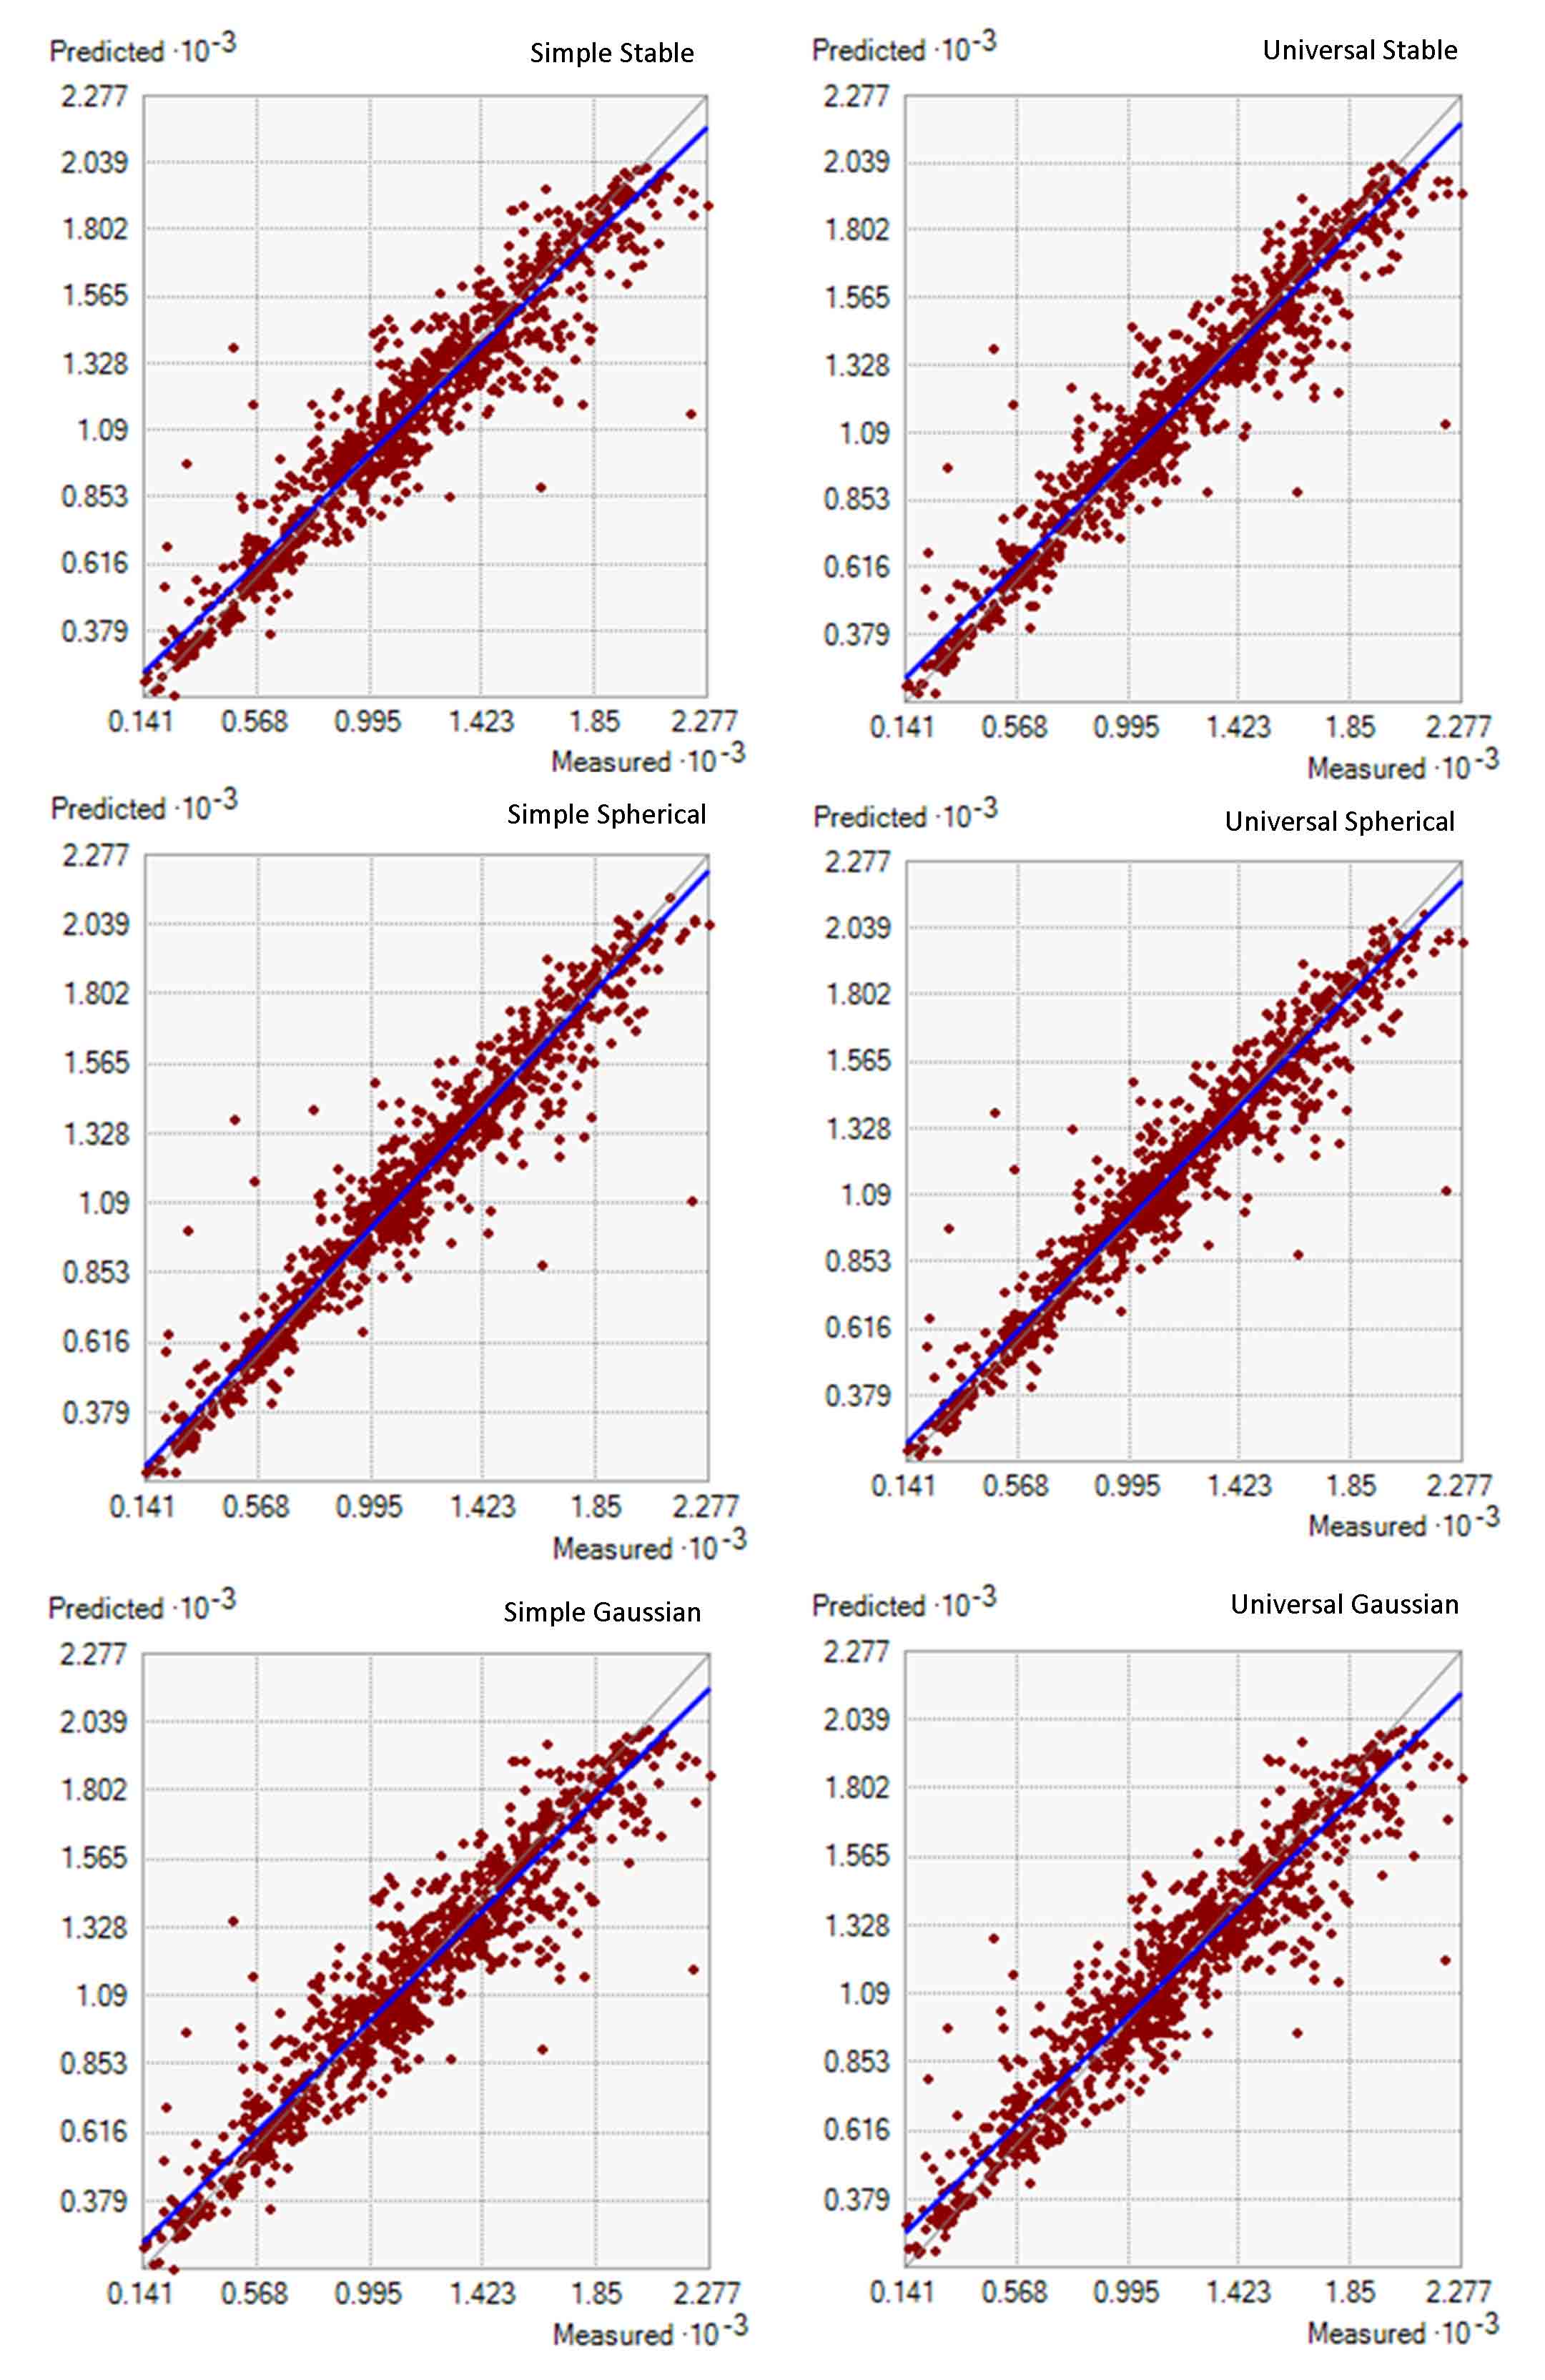
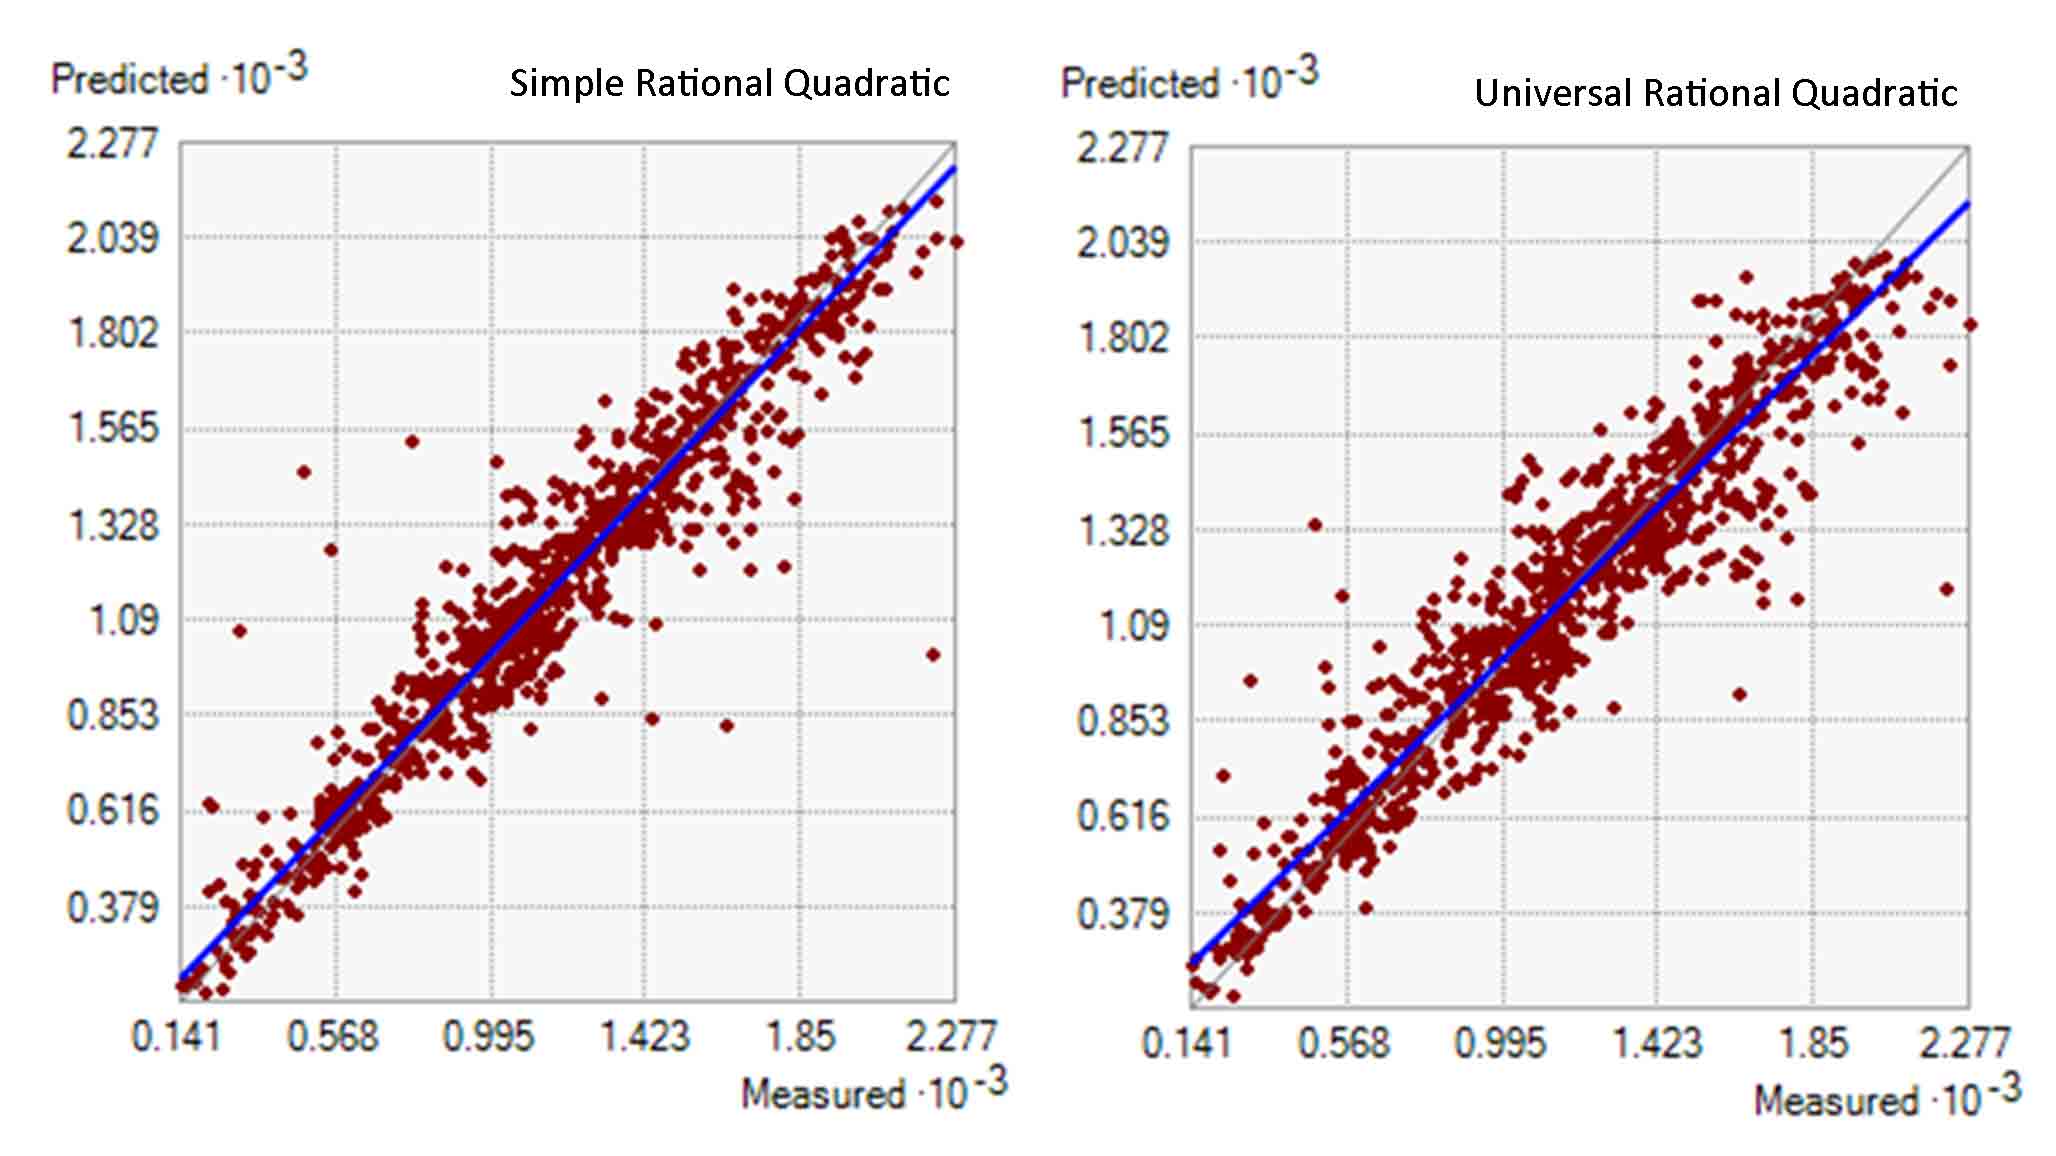
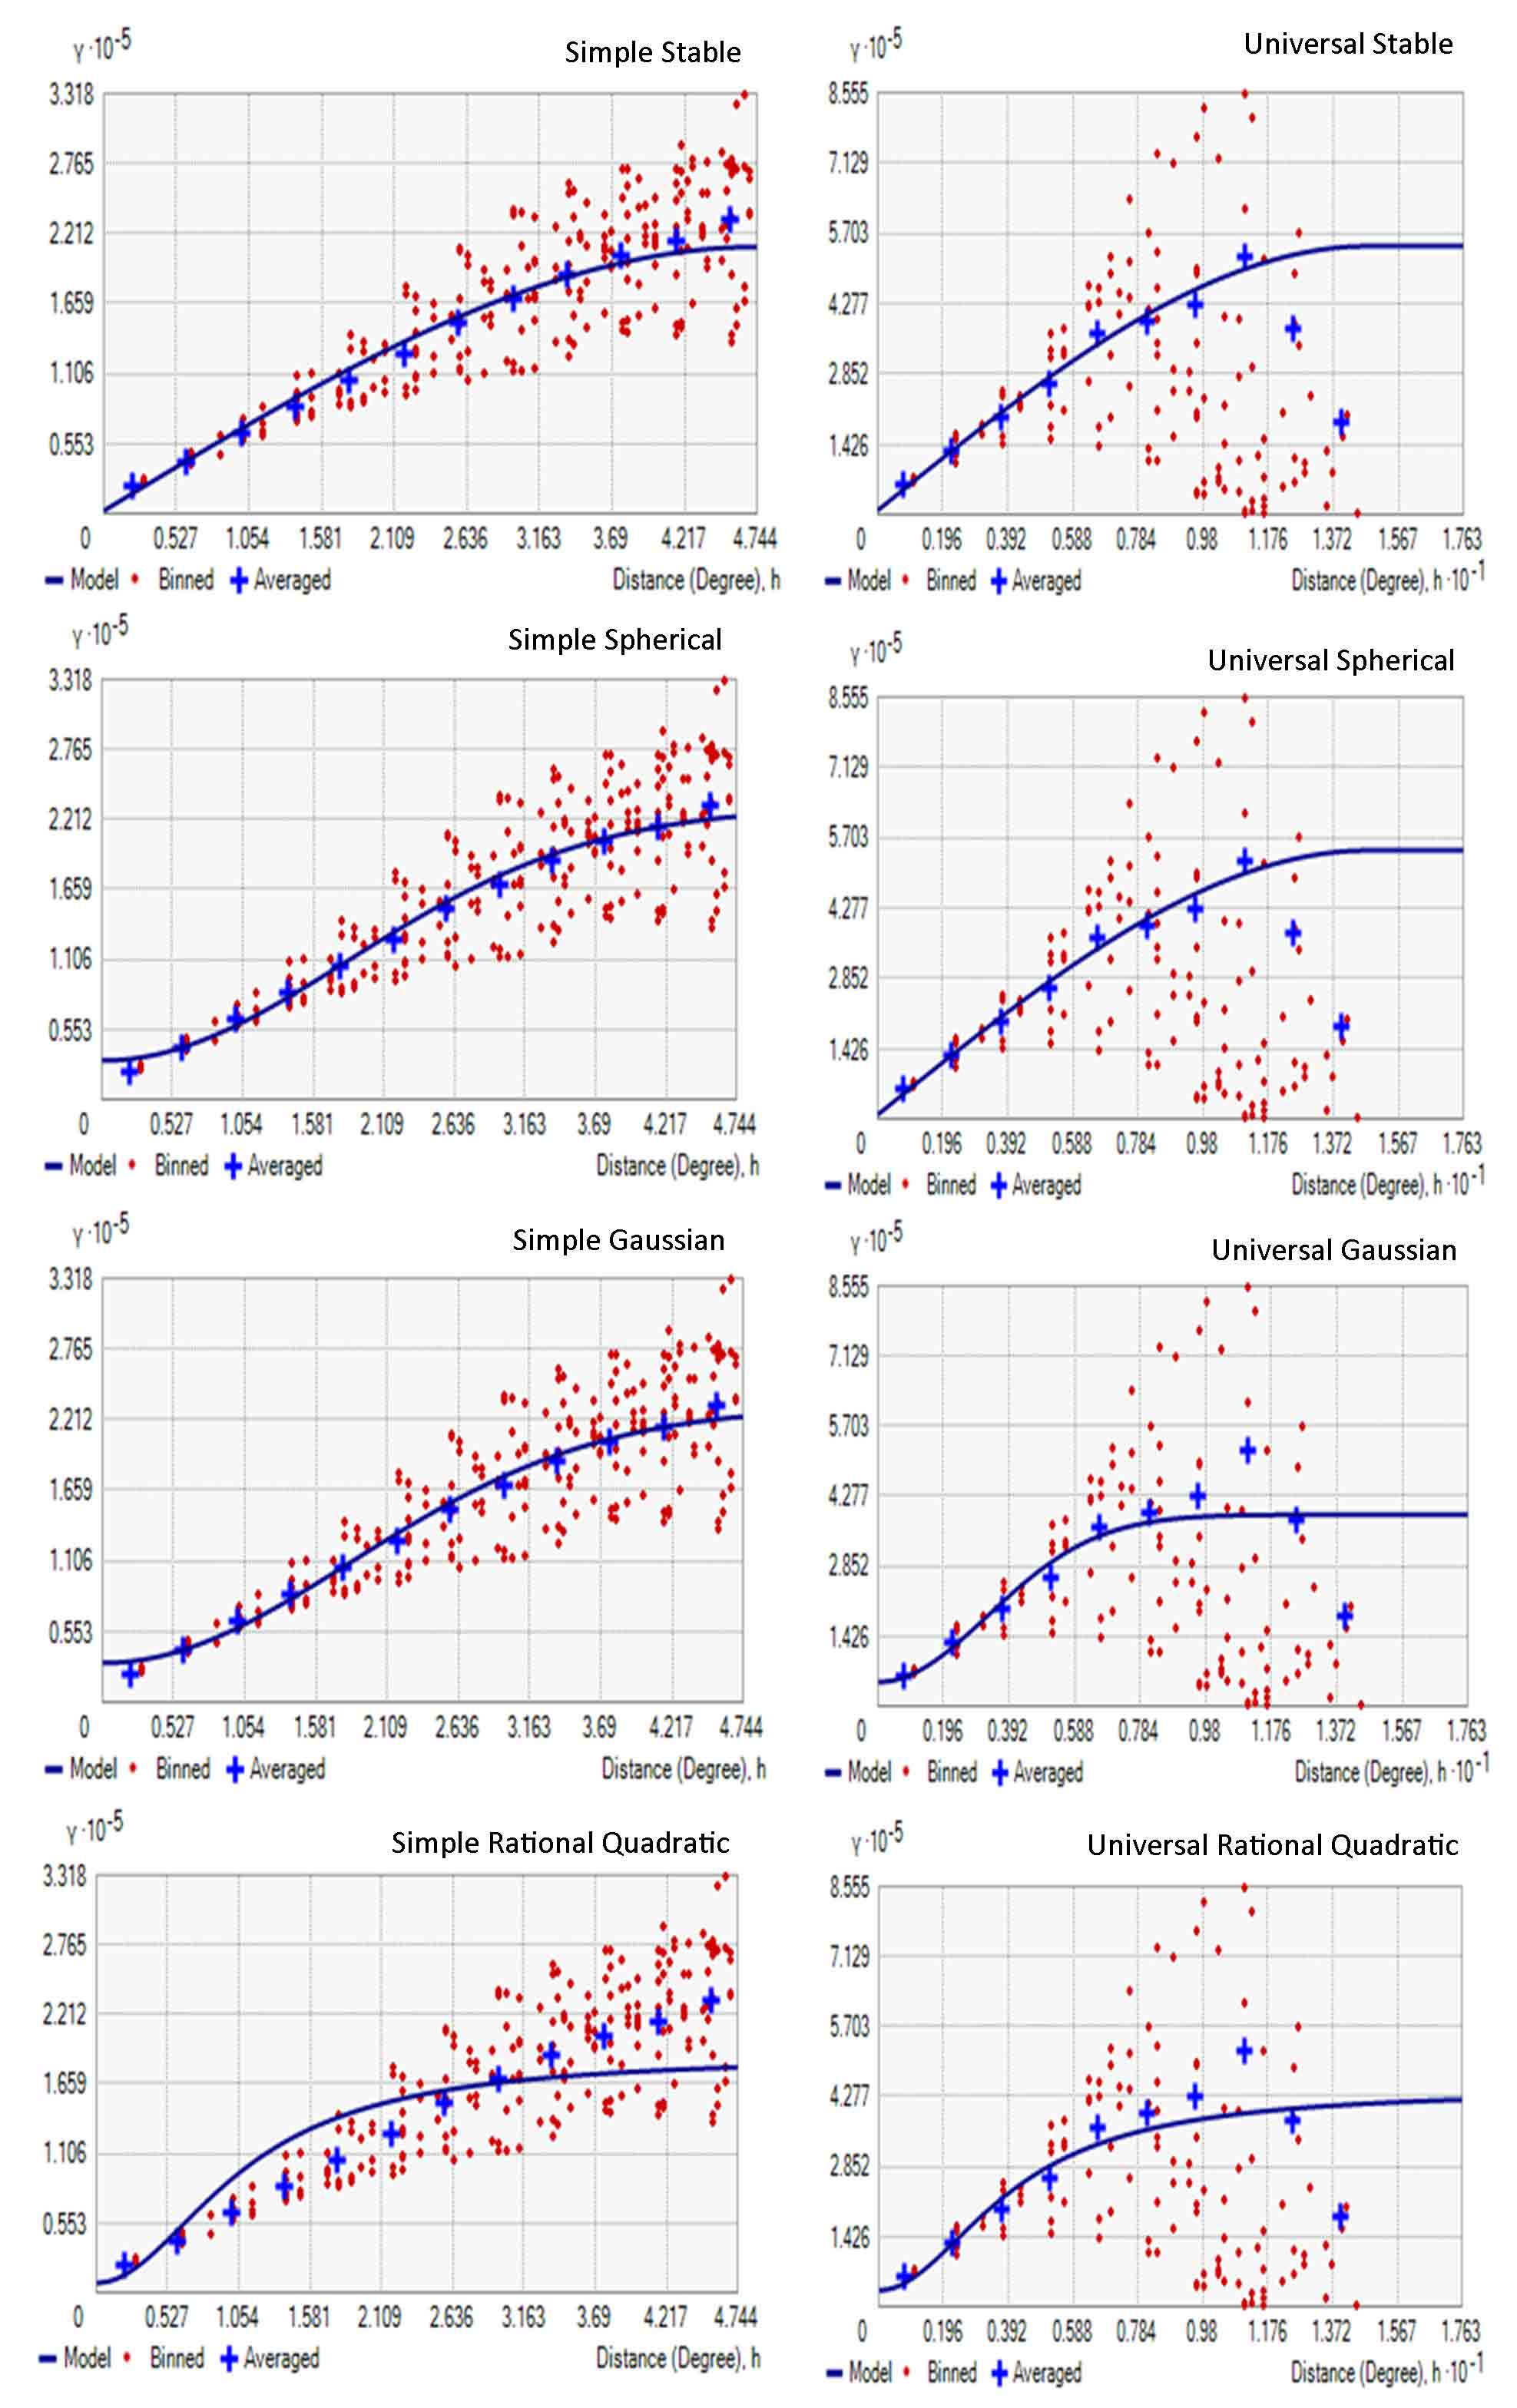
The average annual rainfall of Ethiopia from 931 meteorological stations in the country was interpolated through simple and universal kriging in different mathematical models of stable, spherical, gaussian and rational quadratic to predict the continuous surface annual average rainfall values from scatter pointed rainfall data. The graph of predicted average annual rainfall from the different models and the measured values indicate positive correlation (Figure 2). This is an indicator that different models of kriging can interpolate the continuous surface data of amount rainfall in good manner for the whole area of Ethiopia from pointed measured meteorological rainfall data.
4.1 Best Fitted Variogram Models
In this study, the average annual rainfall spatial dependence was determined by semivariance analysis using different mathematical models. The result of these models indicated that the amount of average annual rainfall which was modeled with different semivariogram models with a nugget effect in good conditions. The Mean Error (ME), Root Mean Square Error (RMSE) and Mean Square Deviation Ratio (MSDR) provided precise measure of how well the model suitable with the variogram data.
The different fitted models, parameter values of this study are presented in Table1. The results of the study indicated that, spherical model was the best fitted variogram model and most accurate model for average annual rainfall interpolation of Ethiopia in both simple and universal Kriging with the value of ME (0.005), RMSE (121.32) and MSDR (1.021) and ME (0.001), RMSE (144.112) and MSDR (0.876), respectively (Table 1).
Table 1. Evaluation value for different models of simple and universal kriging
|
Models |
Kriging Types |
|||||
|
Simple |
Universal |
|||||
|
ME |
MSDR |
RMSE |
ME |
MSDR |
RMSE |
|
|
Stable |
-0.024 |
0.875 |
169.667 |
-0.005 |
0.819 |
164.668 |
|
Spherical |
0.005 |
1.021 |
121.322 |
0.001 |
0.876 |
144.112 |
|
Gaussian |
-0.04 |
0.86 |
183.352 |
-0.023 |
0.705 |
229.876 |
|
RQ |
0.017 |
1.233 |
111.961 |
-0.026 |
0.829 |
191.336 |
Spatial dependency of the average annual rainfall of Ethiopia was assessed in terms of the ratio of nugget ( C0 ) to sill ( C0+C ) and indicates a strong spatial dependence values for all models. Because, as indicated in Table 2 the value of nugget ( C0 ) to sill ( C0+C ) ratio is less than 25%, for all models of this study. Table 2, clearly indicates that the spatial dependence of average annual rainfall for the best fitted semivariogram of spherical model is strong with a nugget ( C0 ) to sill ( C0+C ) ratio of 1.23% and 1.66% for simple and universal kriging, respectively.
Table 1. Evaluation value for different models of simple and universal kriging
|
Models |
Kriging Types |
|||||
|
Simple |
Universal |
|||||
|
ME |
MSDR |
RMSE |
ME |
MSDR |
RMSE |
|
|
Stable |
-0.024 |
0.875 |
169.667 |
-0.005 |
0.819 |
164.668 |
|
Spherical |
0.005 |
1.021 |
121.322 |
0.001 |
0.876 |
144.112 |
|
Gaussian |
-0.04 |
0.86 |
183.352 |
-0.023 |
0.705 |
229.876 |
|
RQ |
0.017 |
1.233 |
111.961 |
-0.026 |
0.829 |
191.336 |
This strong spatial dependence values of annual rainfall in Ethiopia found in line with the research result of climatic variability and drought characterization in Ethiopia over three decades by Suryabhagavan and extremes (2017), spatial and temporal trends and variability of rainfall using long‑term satellite product over the Upper Blue Nile Basin in Ethiopia by Ayehu et al. (2021) and Spatio-temporal rainfall variability and trend analysis in the Tekeze-Atbara river basin, northwestern Ethiopia by Abebe et al. (2022).
4.2 Spatial Distribution of Average Annual Rainfall
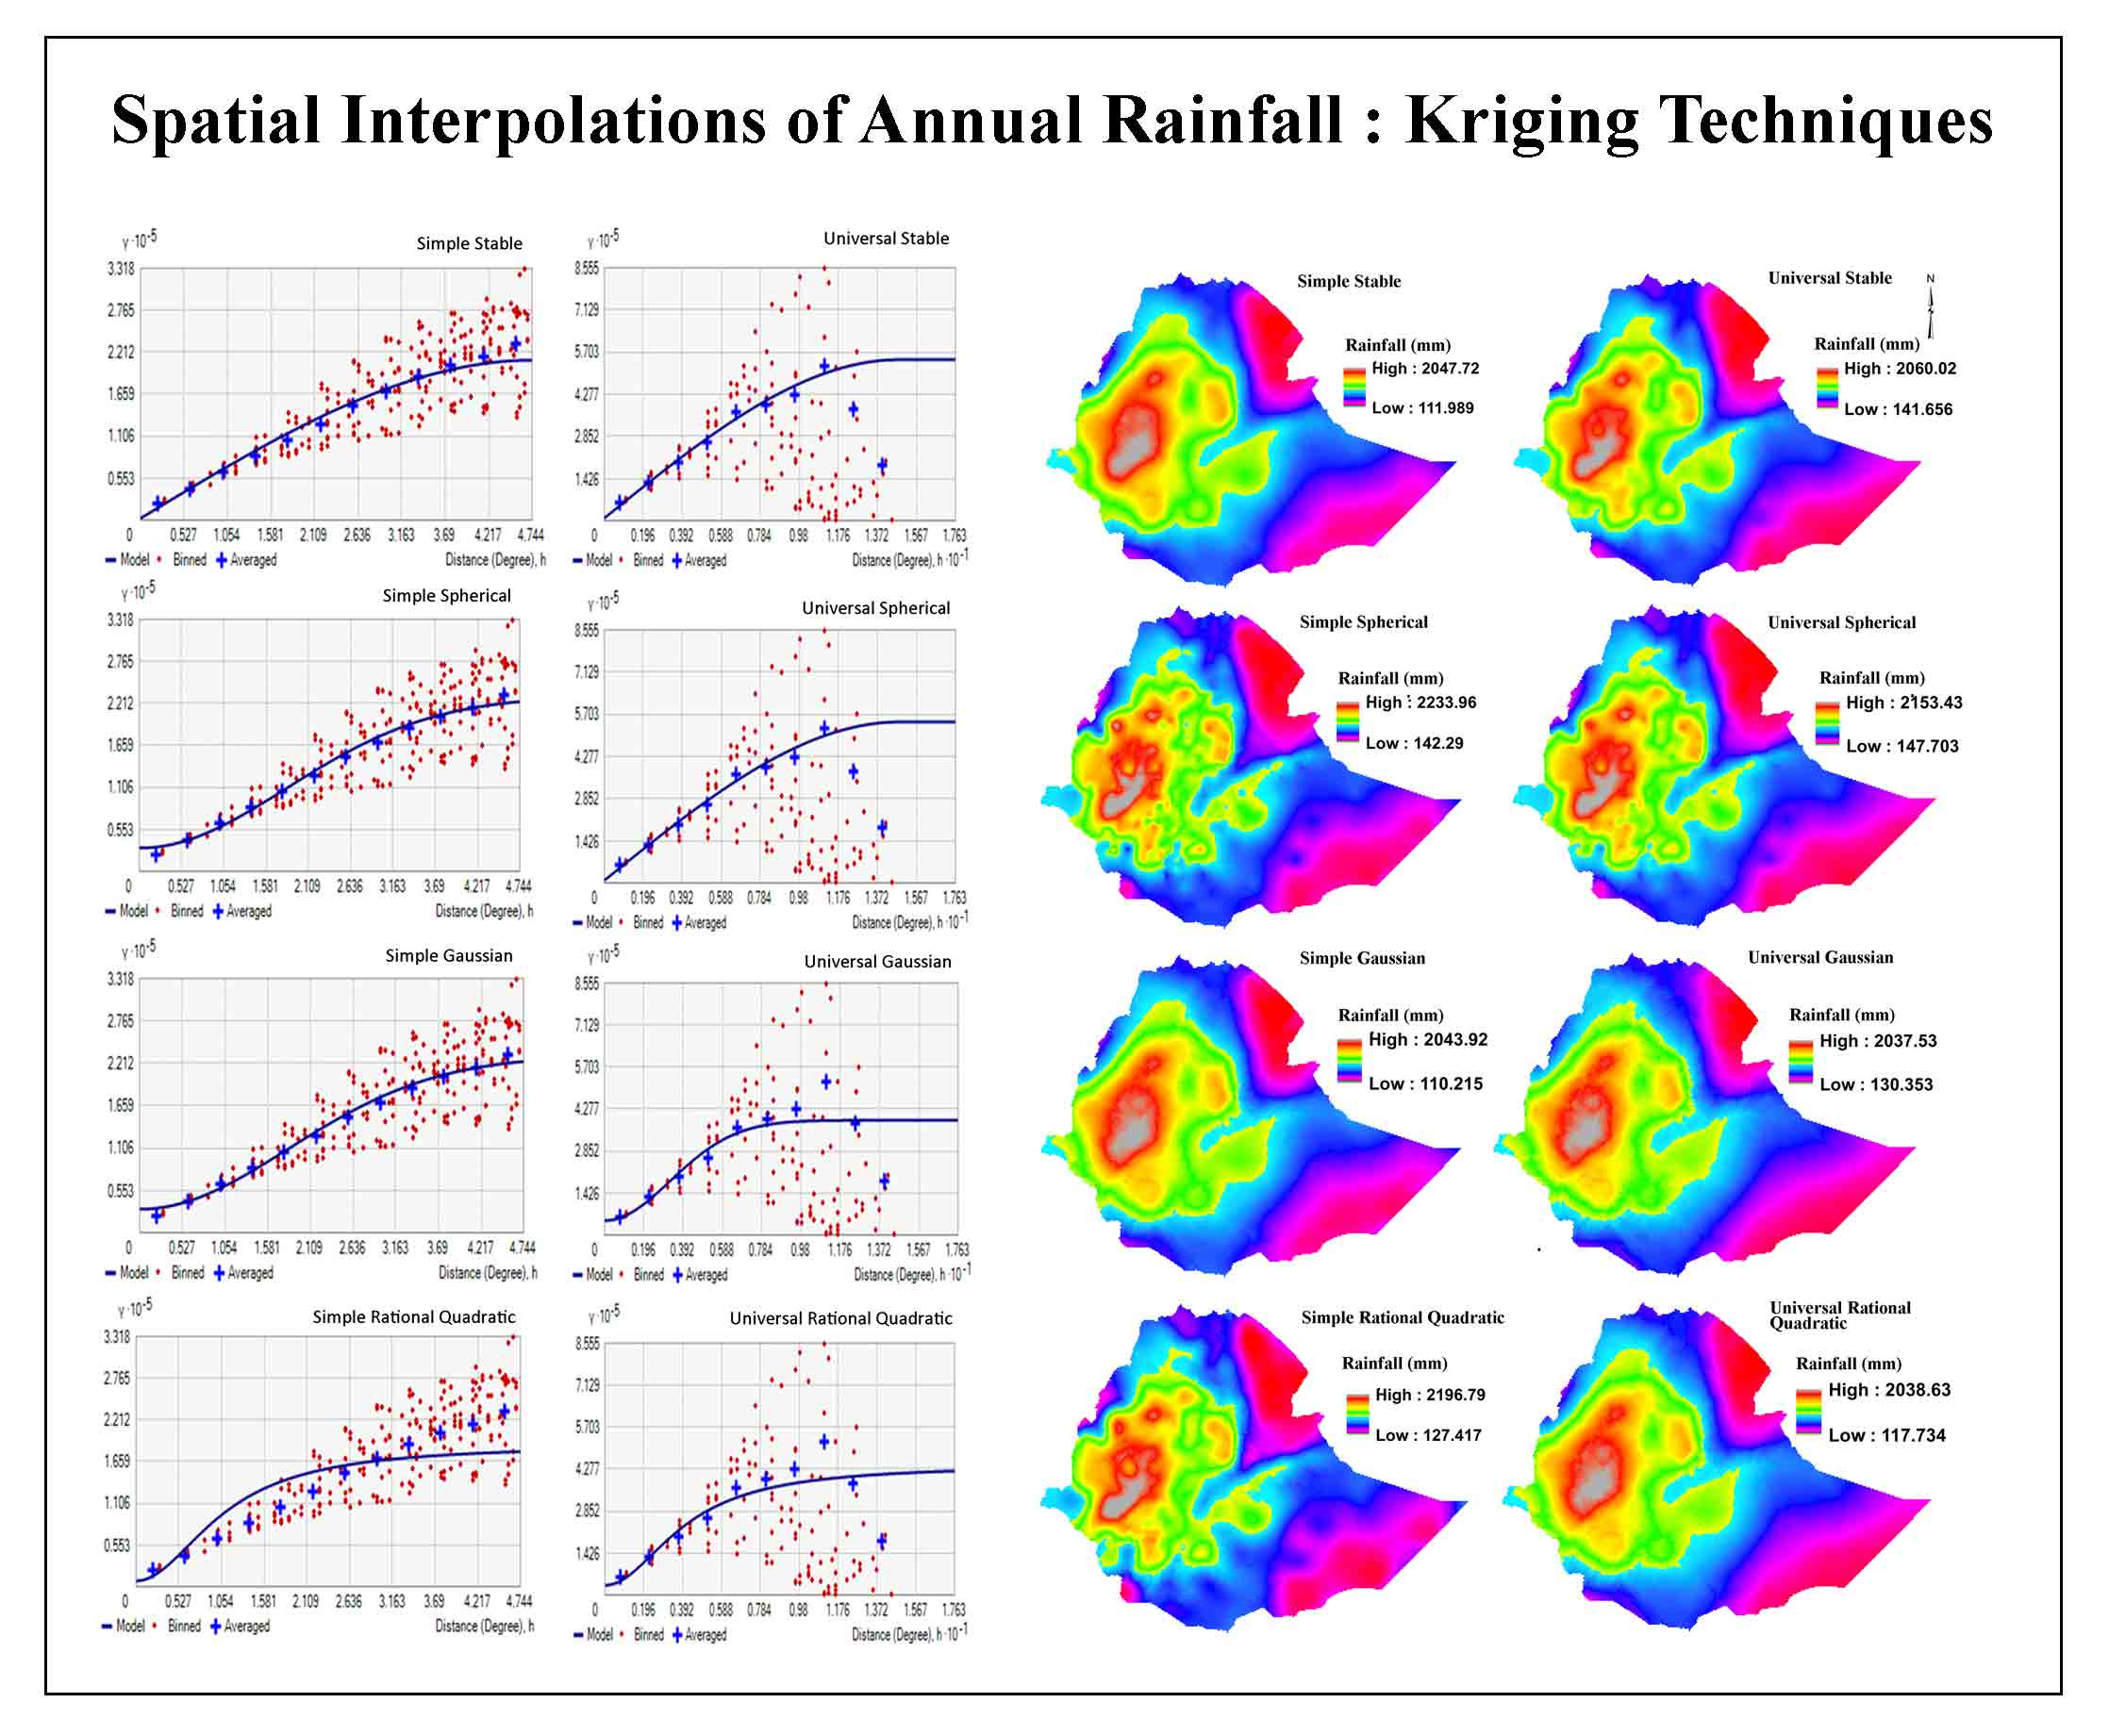
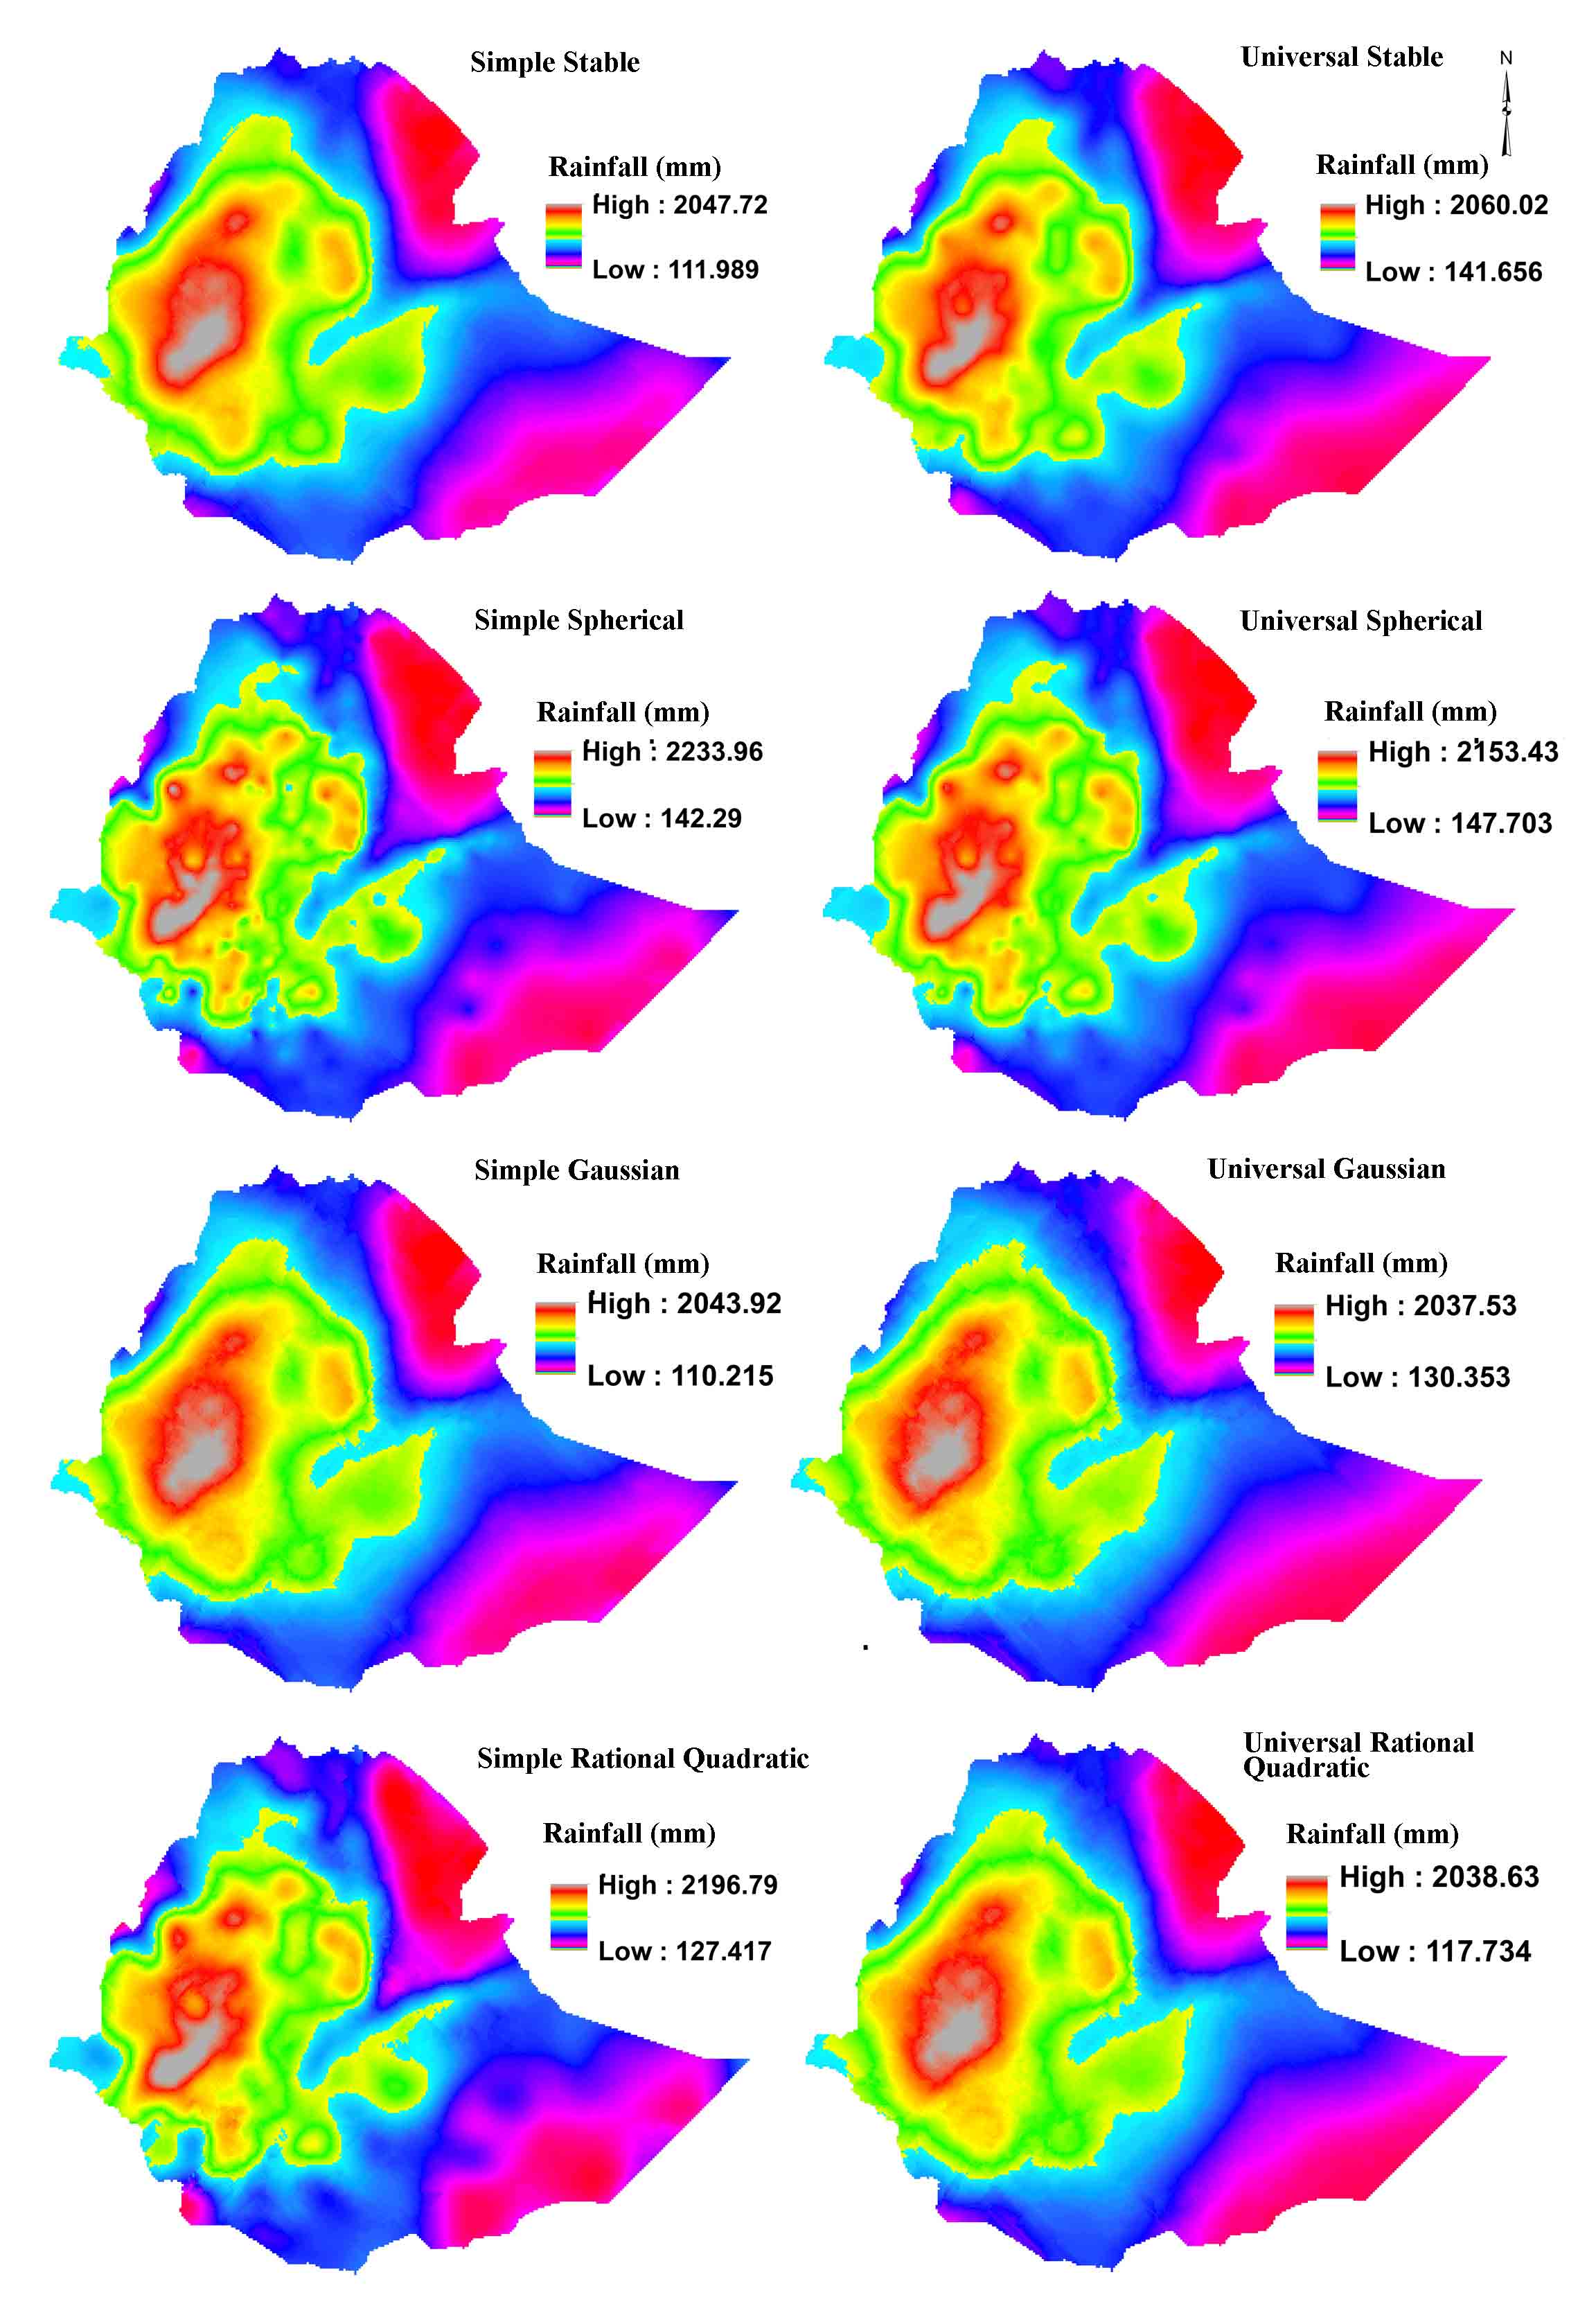
The spatial patterns of annual average rainfall of Ethiopia are investigated for selected models using universal and simple kriging. The spatial maps of universal and simple kriging for the models of stable, gaussian, exponential, spherical and rational quadratic are shown in figure4. The map of stable and gaussian models for both simple and universal kriging and universal rational quadratic are smooth.
All models of this study in dictated that the higher value of annual average rainfall is found in the central and western high land of the country. The southeastern (Somali Region and low land area of Oromia and SNNP) and northeastern (Afar and some part of Amhara) part of the country get lowest value average annual rainfall. According to Mera (2018), this part of the country (southeastern and northeastern) get less than 600mm annual average rainfall and severe drought has 30% chance of occurrence in each year. The medium range of average annual rainfall is found in the northern and eastern high lands of the country.
5. Conclusion
Kriging/cokriging consist several methods, including ordinary, simple, universal, indicator, probability and disjunctive, which commonly applied in estimating spatial distribution of variables in the environment. In this study different mathematical variogram models of Simple and Universal Kriging were conducted to select the best fit variogram model to predict continuous surface values of annual average rainfall of Ethiopia between the known locations.
An exact measure of how well the model fit with the data in variogram may be expressed using the Mean Error (ME), Root Mean Square Error (RMSE) and Mean Square Deviation Ratio (MSDR). This was measured with the value of ME close to zero, the MSDR close to one, and a low RMSE value. Based on these points, spherical model was the best fitted variogram model and most accurate model for average annual rainfall interpolation of Ethiopia in both Simple and Universal Kriging.
In this study, the spatial dependence of the average annual rainfall in Ethiopia was expressed by ratio of nugget ( C0 ) to sill ( C0+C ) of variogram model also indicate that spherical model as the best semivariogram model. Based on this study in Ethiopia higher value of annual average rainfall is found in the central and western high land of the country and the southeastern (Somali Region and low land area of Oromia and SNNP) and northeastern (Afar and some part of Amhara) part of the country get lowest value average annual rainfall. This is a clear indicator that the spatial dependence of rainfall. As a recommendation, since the kriging result of spherical model indicate good model efficacy for this study, it may use to map spatial pattern of annual rainfall at Basin level in Ethiopia.
Conflict of interest
No conflict of interest exists to publish the article.
Acknowledgements
The authors sincerely appreciate the National Meteorological Agency of Ethiopia (NMA), since they were proved annual pointed rainfall data of 931 meteorological stations for this research.
Abbreviations
DK: Disjunctive Kriging; GPI: Global Polynomial Interpolation; IDW: Inverse Distance Weighting; LPI Local Polynomial Interpolation; ME: Mean Error; MSDR: Mean Square Deviation Ratio; OCK: Ordinary Cokriging; OK: Ordinary Kriging; RBF: Radial Basis Function; RMSE: Root Mean Square Error; SK: Simple Kriging; UK: Universal Kriging.
Article information
- Received
- 24 Oct 2022
- Revised
- 7 Dec 2022
- Accepted
- 8 Dec 2022
- Published
- 26 Mar 2023
- Handling editor
- Dr. Suresh Kumar
- Licence
- CC BY-NC-ND 4.0
- Journal
- Hydrospatial Analysis, ISSN 2582-2969
References
-
Abebe, B. A., Grum, B., Degu, A. M. and Goitom, H., 2022. Spatio‐temporal rainfall variability and trend analysis in the Tekeze‐Atbara river basin, northwestern Ethiopia. Meteorol Appl. 29(2), e2059.
Crossref -
Ayehu, G. T., Tadesse, T. and Gessesse, B., 2021. Spatial and temporal trends and variability of rainfall using long-term satellite product over the Upper Blue Nile Basin in Ethiopia. Remote Sensing in Earth Systems Sciences, 4(3), 199-215.
Crossref -
Belkhiri, L., Tiri, A. and Mouni, L., 2020. Spatial distribution of the groundwater quality using kriging and co-kriging interpolations. Groundwater for Sustainable Development, 11, 100473.
-
Berhanu, B., Seleshi, Y. and Melesse, A. M., 2014. Surface Water and Groundwater Resources of Ethiopia : Potentials and Challenges of Water Resources Development. Melesse, A., Abtew, W., Setegn, S. (Eds), Nile River Basin, Springer.
Crossref -
Chen, T., Ren, L., Yuan, F., Yang, X., Jiang, S., Tang, T., Liu, Y., Zhao, C. and Zhang, L., 2017. Comparison of spatial interpolation schemes for rainfall data and application in hydrological modeling. Water, 9(5), 342.
Crossref -
Cheung, W. H., Senay, G. B. and Singh, A., 2008. Trends and spatial distribution of annual and seasonal rainfall in Ethiopia. International Journal of Climatology, 28(13), 1723-1734.
Crossref -
Cressie, N., 1991. Statistics for spatial data. John Wiley and Sons, New-York, 900.
-
Dindaroğlu, T., 2014. The use of the GIS Kriging technique to determine the spatial changes of natural radionuclide concentrations in soil and forest cover. Journal of Environmental Health Science and Engineering, 12(1), 1-11.
Crossref -
Gyamfi, C., Ndambuki, J., Diabene, P., Kifanyi, G., Githuku, C. and Alexander, A., 2016. Using GIS for spatial exploratory analysis of borehole data: A firsthand approach towards groundwater development. Journal of Science and Technology (Ghana), 36(1), 38-48.
-
Kastelec, D. and Košmelj, K., 2002. Spatial interpolation of mean yearly precipitation using universal kriging. Developments in statistics, 17, 149-162.
Crossref -
Ly, S., Charles, C. and Degre, A., 2011. Geostatistical interpolation of daily rainfall at catchment scale: The use of several variogram models in the Ourthe and Ambleve catchments, Belgium. Hydrology and Earth System Sciences, 15(7), 2259-2274.
Crossref -
Mera, G. A., 2018. Drought and its impacts in Ethiopia. Weather and climate extremes, 22, 24-35.
Crossref -
Najnin, A., and Sahalu, A. G., 2019. Spatial Pattern Analysis of Precipitation in the north-western part of Ethiopia (Gojjam) by Using Different Interpolation Methods.
-
Olea, R. A., 1974. Optimal contour mapping using universal kriging. Journal of Geophysical Research, 79(5), 695-702.
Crossref -
Paz-Gonzalez, A., Vieira, S., and Castro, M. T. T., 2000. The effect of cultivation on the spatial variability of selected properties of an umbric horizon. Geoderma, 97(3-4), 273-292.
Crossref -
Radhakrishna, R. C. and Helge, T., 1995. Linear models: least squares and alternatives, Springer.
-
Regassa, S., Givey, C. and Castillo, G., 2010. The Rain Doesn't Come On Time Anymore: Poverty, vulnerability, and climate variability in Ethiopia.
-
Suryabhagavan, K. J. 2017. GIS-based climate variability and drought characterization in Ethiopia over three decades. Wheather and Climate, 15, 11-23.
Crossref -
Taye, M., Simane, B., Zaitchik, B. F., Setegn, S. and Selassie, Y. G., 2018. Analysis of the Spatial Patterns of Rainfall across the Agro-Climatic Zones of Jema Watershed in the Northwestern Highlands of Ethiopia. Geosciences, 9(1), 22.
Crossref -
Trangmar, B. B., Yost, R. S. and Uehara, G., 1986. Application of geostatistics to spatial studies of soil properties. Advances in agronomy, 38, 45-94.
Crossref -
Tziachris, P., Metaxa, E., Papadopoulos, F. and Papadopoulou, M., 2017. Spatial modelling and prediction assessment of soil iron using kriging interpolation with pH as auxiliary information. ISPRS International Journal of Geo-Information, 6(9), 283.
Crossref -
Wackernagel, H., 2004. Geostatistics. Encyclopedia of Statistical Sciences.
-
Warnes, J. J., 1986. A sensitivity analysis for universal kriging. Mathematical Geology, 18(7), 653-676.
Crossref -
Webster, R., and McBratney, A. B., 1987. Mapping soil fertility at Broom’s Barn by simple kriging. Journal of the Science of Food and Agriculture, 38(2), 97-115.
Crossref