

Hydrospatial Analysis Volume 3 (2019), Issue 1 · pp. 22-36
Original Research Paper Open Access

Groundwater Quality Assessment Using Geospatial Techniques and WQI in North East of Adama Town, Oromia Region, Ethiopia

- Department of Applied Geology, School of Applied Natural Science, Adama Science and Technology University, Adama, Ethiopia.
- African Centre of Excellence for Water Management, Addis Ababa University, Addis Ababa, Ethiopia School of Civil Engineering and Architecture, Adama Science and Technology University, Adama, Ethiopia
* Corresponding author: SHANKAR KARUPPANNAN, geoshankar1984@gmail.com
Contents
- Highlights
- Abstract
- 1. Introduction
- 2. Study Area
- 3. Geology
- 4. Methodology
- 5. Results And Discussions
- 6. Conclusions
- Conflict of interest
- Acknowledgements
- Abbreviations
- Article information
- References
-
- Table 1. Statistical details and WHO-Ethiopian standard limits for de…
- Table 2. Classification of groundwater samples for irrigation purposes
- Table 3. Relative weight of chemical parameters
- Table 4. Water Quality Index and their status of groundwater (Sahu an…
- Table 5. Calculation of WQI for individual water samples
Highlights
- Groundwater samples were analysed to understand the concentration of major cation and anions.
- Groundwater quality was analysed for drinking and irrigation purposes using WQI.
- WQI ranges between good to poor category for majority of the samples.
- The most of the groundwater samples are excellent and suitable for irrigation purposes.
Abstract
Assessment of groundwater quality is vital for the sustainable use of the resources for domestic and agricultural purposes. In this study spatial variation of physicochemical parameters were analyzed for Northeast Adama Town. Water Quality Index (WQI) and irrigation indices were used to determine the suitability of groundwater for drinking and irrigation purposes, respectively. Further, the physical-chemical results were compared with the Ethiopian standards and the World Health Organization (WHO) standards for drinking and public health. Using GIS interpolation methods in Arc GIS 10.3.1, spatial distribution maps of pH, TDS, EC, Cl−, HCO32−, SO42−, Ca2+, Mg2+, Na+ and K+, RSC, SAR, Na% were prepared. Results indicated that except ASTU well 2, all samples are below the desirable limits of WHO. The WQI results indicated that 85% of samples and 15% of samples were in good and poor categories, respectively. Irrigation indices show that most groundwater samples have excellent water classes, indicating that they are suitable for irrigation purposes.
Keywords EthiopiaGroundwaterGISWater Quality IndexSpatial Interpolation
1. Introduction
Groundwater is the primary source for drinking, domestic, industrial and agricultural purposes in different parts of the world (Fienen and Arshad, 2016; Wagh et al., 2016). Groundwater is widely used for drinking purposes in numerous urban areas (Altchenko et al., 2011; Lapworth et al., 2017). Rapid population growth, irrigation expansion, and increasing industrialization have prompted an increasing demand for groundwater. In recent decades, there is a rapid expansion of the urban areas, improper waste disposal from domestic and industrial areas. Many cities have no well-developed sewer and drainage systems (Kazi et al., 2009). These expansions and increasing demands are resulting in depletion and contamination of the resources. According to Farooq and Ustad, (2015) groundwater pollution has been increasing rapidly in many parts of the world, due to industrial effluents, agricultural fertilizers, municipal wastewater, landfill, and animal waste. Mohanakavitha et al. (2019a, 2019b) stated that the discharge of untreated wastewater and leachate from waste disposal site is contaminating groundwater in south India. Anthropogenic activities are causing degradation of groundwater quality and limiting the availability of freshwater resources.
Groundwater is extremely used for drinking water supply in the Main Ethiopian rift (Reimann et al., 2003). Many research studies (UNDP, 1973; Chernet, 1982; Wood and Talling, 1988; Halcrow, 1989; Gizaw, 1996, 2002; Kebede et al., 2005; Berhanu, 2007; Ayenew et al., 2008; Ayenew, 2008; Kebede et al., 2008; Demlie and Wohnlich, 2006; Demlie et al., 2007a, 2007b, 2008; Yitbarek et al., 2012; Amanial, 2015; Kawo and Shankar, 2018) reported on the groundwater chemistry in the Ethiopian rift. These finding reported that the chemical composition of groundwater in highland and rift valley aquifers are different. Many researchers have already reported high F- concentrations in the groundwater from rift valley (Ayenew, 2005; Tekle-Haimanot et al., 2006; Reimann et al., 2003; Rango et al., 2010; Furi et al., 2011; Haji et al., 2018). Mica-based volcanic aquifers; pyroxene and amphiboles are sources of fluoride in the rift valley groundwater (Furi et al., 2011). Further, liquid waste discharges from cities found in the rift valley are polluting groundwater. Taye (1988) reported that pollution of groundwater in the Dire Dawa groundwater basin. Tamiru (2004) studies status and groundwater vulnerability in Addis Ababa and reported that pollution of groundwater due to untreated waste discharge to rivers. Water quality studies conducted in the East Shewa Zone reported that pollution of groundwater. For instance, Haile Gashaw, (1999) stated that high TDS and fluoride concentration in the lake Ziway area. Dinka, (2015) studies the hydrochemical properties of different surface water bodies and groundwater available at Matahara region and reported that variations of chemical parameters in different water sources. Dinka, (2017) also stated pollution of groundwater by anthropogenic activities in Matahara region. Eliku and Suleiman, (2015) studied physicochemical and bacteriological parameters in Adama town and reported that water quality degradation due to inadequate sanitation and hygienic practices.
Worldwide, a number of hydrogeochemical studies have been conducted to identify geochemical processes and evolution of groundwater quality (Aravindan et al., 2008, 2011; Rango et al., 2010; Aravindan and Shankar, 2011a, 2011b; Kumar and Balamurugan, 2018; Wagh et al., 2018; Narsimha and Rajitha, 2018). The IDW interpolation method of a geographical information system (GIS) is widely used to map groundwater quality. GIS-based research is the best idea to observe the evolutionary tendency of water quality that keeps changing from time to time. This modern approach allows environment executives and decision-makers in the process of precise monitoring and rapid decision-making, tremendously. Spatial variation of groundwater quality is controlled by geology and anthropogenic activities within a groundwater basin (Subramani et al., 2005; Aravindan et al., 2010; Aravindan and Shankar, 2011a; Shankar et al., 2010, 2011, 2011a, 2011b; Venkateswaran et al., 2012; Li et al., 2016; Mahlknecht et al., 2017; Wu et al., 2017; Kawo and Shankar, 2018). Further, water quality index (WQI) has been widely used to evaluate the suitability of groundwater for domestic purposes (Rabeiy, 2017). Details of WQI were presented in Babiker et al. (2006), Gebrehiwot et al. (2011), Singh and Khan (2011), Selvam et al. (2013), Boateng et al. (2016), Jhariya et al. (2017), Keraga et al. (2017), Wagh et al. (2017), Ramya Priya and Elango (2018), Kawo and Shankar (2018) and Lad et al. (2018).
In this study, major cations and anions were analyzed and IDW interpolation in GIS was used to produce spatial variation map. In addition, spatial variation map of the Water Quality Index and suitability of groundwater for irrigation purposes were analyzed.
2. Study Area
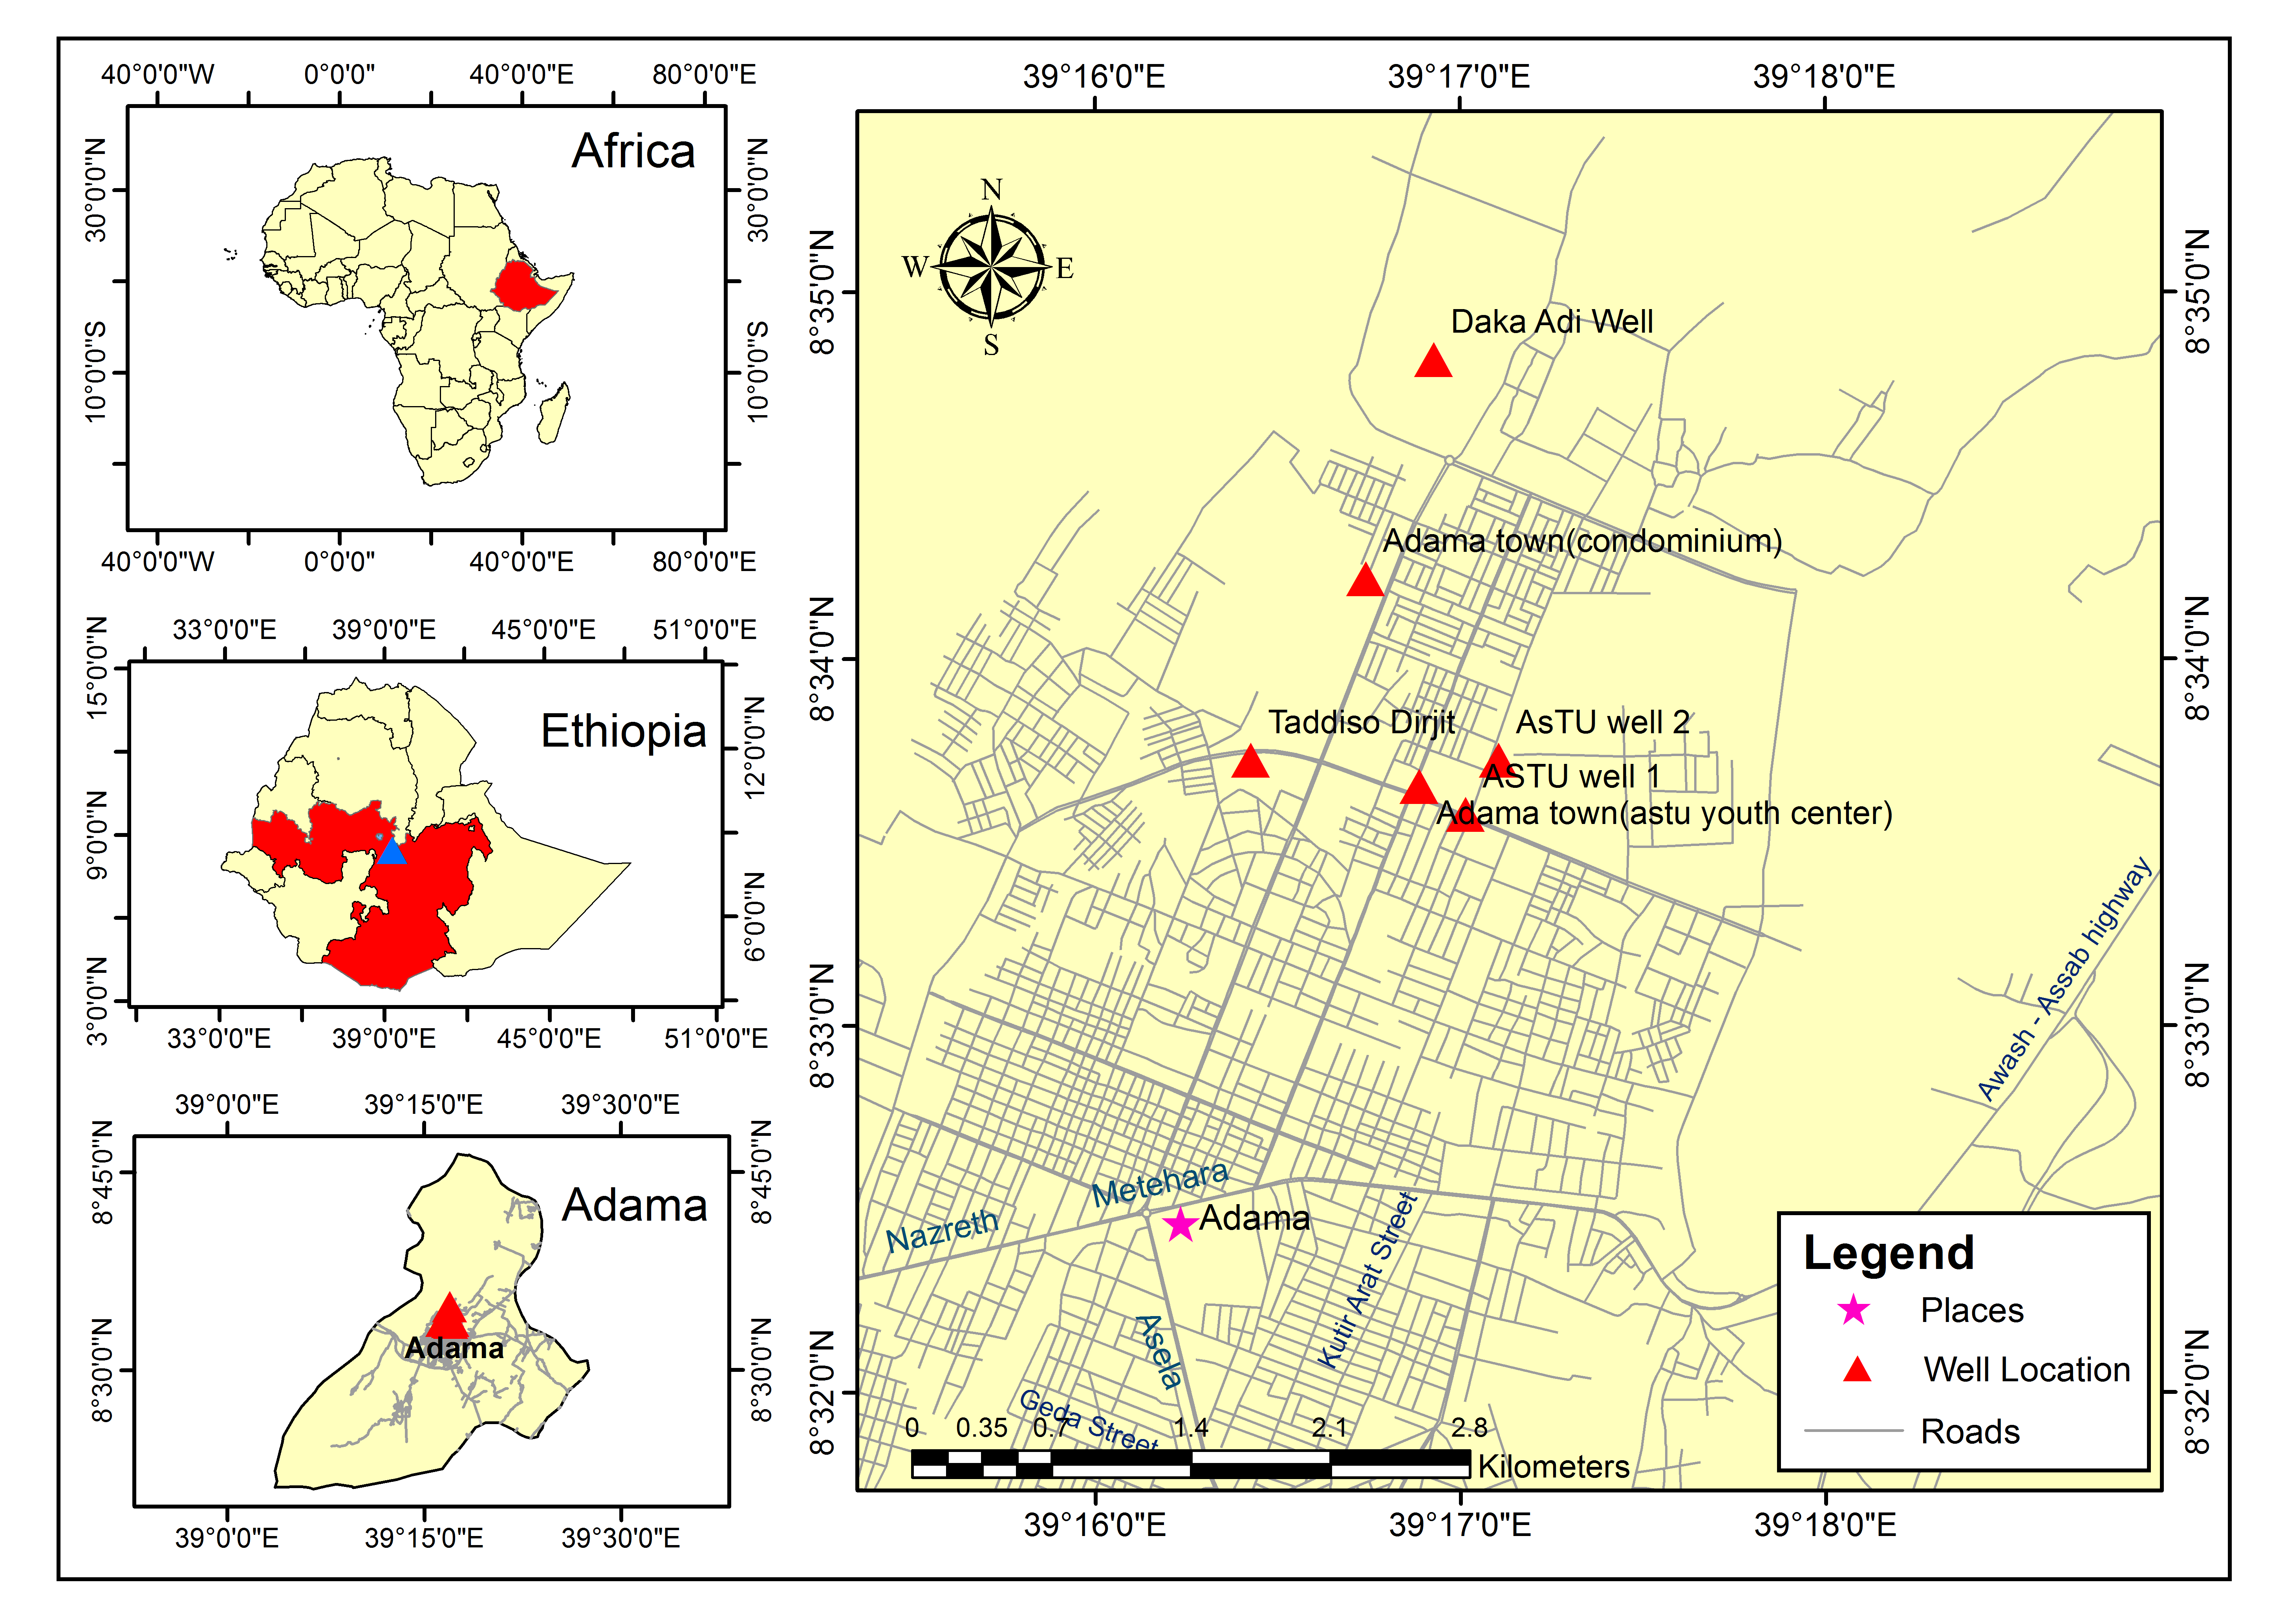
Adama is located in the north-central part of the Main Ethiopian Rift (MER), within the East Showa zone of Oromia National Regional State. It’s located about 100 km southeast of the capital city Addis Ababa. Adama city is one of the largest cities in Oromiya and it’s found between escarpment and the Great Rift Valley in West and East, respectively. Adama is found in the Rift valley area in the upper Awash River Basin. Geographically the study area is located at 8º32ʹ0" N – 8º36ʹ0" N latitude and 39º16ʹ0" E – 39º20ʹ0" E longitude (Figure 1). The areal extent of Northeast Adama is 45 km2. The location of the map of our study area drawn from a toposheet number of 0839A4 and 0839C2 published in 1975 by the survey and mapping department of Ethiopia at a scale of 1:50,000. It is situated in a flatland area surrounded by sloping hills on all sides except the one facing the south. The soil is light sand and fine clay, which is easily blown into storms during the dry season. Climatically, Adama falls within the kola zone /low land zone and the average annual temperature is about 20 degrees centigrade with maximum temperature slightly exceeding 30-32 degrees centigrade during the month of May. Summer temperatures are low giving mild and pleasant weather conditions. Annual rainfall, which comes during the month of June, July and August, ranges between700 mm and 900 mm.
3. Geology
The geology of the study area is covered by different types of volcanic rocks with different occurrences and ages. Mafic and felsic volcanic rock are dominant geological units in the study area. These rocks consist of alkaline transactional basaltic lavas, and pantellerite, dacitic and rhyolite, ignimbrite sheets, generally strongly welded, and sporadic lava domes. In general, ignimbrites, slightly welded tuffs, unwelded tuffs, rhyolite lava flows, pumice fall deposits, obsidian flows, and basaltic lava flows and scoria are the main lithological units identified in the study area. The study area is characterized by a number of minors and major normal types of faults running almost parallel to each other in an NNE-SSW direction and is usually arranged in the form of an “en echelon” feature, commonly in a right stepping manner (Furi et al., 2011, 2012; Agostini et al., 2011). These faults are commonly associated with volcanic activities and in general younger in the central part and get older towards the rift margins. They form steps and local graben-horst structures and dissect almost all lithological units outcropping in the area and recent volcanism has been observed to be associated with these faults. Some faults are reported to be presently buried under the lacustrine sediments. The faults of the floor which are part of the Wonji Fault Belt (Mohr, 1960) form several tectonic depressions like the ones found in the area of Boku, and Wagillo and the orientation of the fault is NNE-SSW direction (Assiged, 2007).
4. Methodology
To assess groundwater quality in the North East of Adama Town, 7 groundwater samples were collected from existing pumping wells and analyzed in 2017 using standard methods (APHA, 1995). Before filling the bottle with the sample, the water sample bottles (High-density polythene bottles) were washed using dilute HNO32- acid and then with distilled water. The bottles were sealed after water sample collection and labeled, systematically. Then, water analyses were carried out by using standard procedures (APHA, 1995). pH, Total dissolved solids (TDS) and electrical conductivity (EC) were measured in the field using portable devices while the concentration of chemical constituents such as Ca2+, Mg2+, Na+, K+, Cl−, HCO32−, F- and SO42− in groundwater samples were determined in the laboratory. A titrimetric method was used to determine Cl− and HCO32− in groundwater samples. F- and SO42− were determined using the ion-selective electrode and spectrophotometer, respectively. Na+, K+ and Ca2+, Mg2+ were determined by flame photometric and EDTA titrimetric method, respectively. In this study, duplicates were used for quality assurance and quality control (QA/QC).
Groundwater types were determined using Piper plot (Piper, 1944). Data were made available in a format that is accessible via GIS (ArcGIS -Spatial Analyst tool). Further, IDW method was used to analyze spatial variation of major cations and anions in groundwater of the study area. Water Quality Index (WQI), Sodium Adsorption Ratio (SAR), Sodium Percentage (Na%), and Residual Sodium Carbonate (RSC) were used to assess the suitability of groundwater for drinking and irrigation purposes, respectively.
5. Results And Discussions
The descriptive statistics and WHO-Ethiopian standard limits for determined cations and anions were presented in Table 1. The pH values range from 7.3 to 8.4, with a mean value of 8.0. EC and TDS values range from 220.7 to 869.1 μS/cm and 141.2 to 556.2 mg/L, with mean values of 532.1 μS/cm and 340.6 mg/L, respectively. Ca2+ and Mg2+ ranges from 11 to 116 and 2.4 to 52.3 mg/L, with average values of 50.9 and 12.9 mg/L, respectively. Na+ and K+ ranges from 57 to 214 mg/L and 5.9 to 31.5 mg/L, with mean values of 101.6 and 14.7 mg/L, respectively. Major anion concentrations in the study area ranges from 7.9 to 263.9 mg/L for Cl−, from 0.8 to 496.1 mg/L for SO42−, from 256.2 to 349.6 mg/L for HCO32− and from 0.88 to 1.5 for F−.
Table 1. Statistical details and WHO-Ethiopian standard limits for determined hydrochemical parameters
|
Hydrochemical Parameters |
WHO 2011 |
Ethiopian limit |
|||
|
Ions |
Minimum |
Maximum |
Average |
||
|
pH |
7.3 |
8.4 |
8.0 |
6.5-8.5 |
6.5-8.5 |
|
EC (µS/cm) |
220.7 |
869.1 |
532.1 |
1000 |
- |
|
TDS (mg/L) |
141.2 |
556.2 |
340.6 |
500 |
1776 |
|
Ca2+ (mg/L) |
11.0 |
116.0 |
50.9 |
75 |
200 |
|
Mg2+ (mg/L) |
2.4 |
52.3 |
12.9 |
50 |
150 |
|
Na+ (mg/L) |
57.0 |
214.0 |
101.6 |
200 |
358 |
|
K+ (mg/L) |
5.9 |
31.5 |
14.7 |
- |
- |
|
Cl− (mg/L) |
7.9 |
263.9 |
50.5 |
250 |
533 |
|
HCO32− (mg/L) |
256.2 |
349.6 |
283.5 |
200 |
- |
|
SO42− (mg/L) |
0.8 |
496.1 |
83.5 |
200 |
483 |
|
F- (mg/L) |
0.88 |
1.5 |
0.95 |
1.5 |
3 |
5.1 Physical Characteristics of Ground Water (pH, Conductivity, TDS)
pH value shows that the groundwater of the study area is mainly alkaline in nature. Figure 2(a) shows an interpolated spatial variation map of pH of the groundwater. The lowest pH is recognized in ASTU Well 2 and the highest pH is observed in the central part of Taddiso Dirjit and ASTU Well 1. According to WHO (2011) standards, the pH of the water should between 6.5 and 8.5 (Table 1). The study area is dominated by the alkaline water due to the presence of alkalies in carbonate ions present (Davis, 1966). If pH < 8.2, it is a measure of bicarbonate ions. Groundwater in the rift valley has high pH values due to Na- rich igneous rock aquifer (Kawo and Shankar, 2018; Haji et al., 2018). The spatial variation map (Figure 2(b)) of EC values indicates that the Southwestern part of Adama town has a high EC concentration. As per WHO (2011), the allowable limit for EC is 1000 µs/cm and all groundwater samples are found to be within the drinking limits.
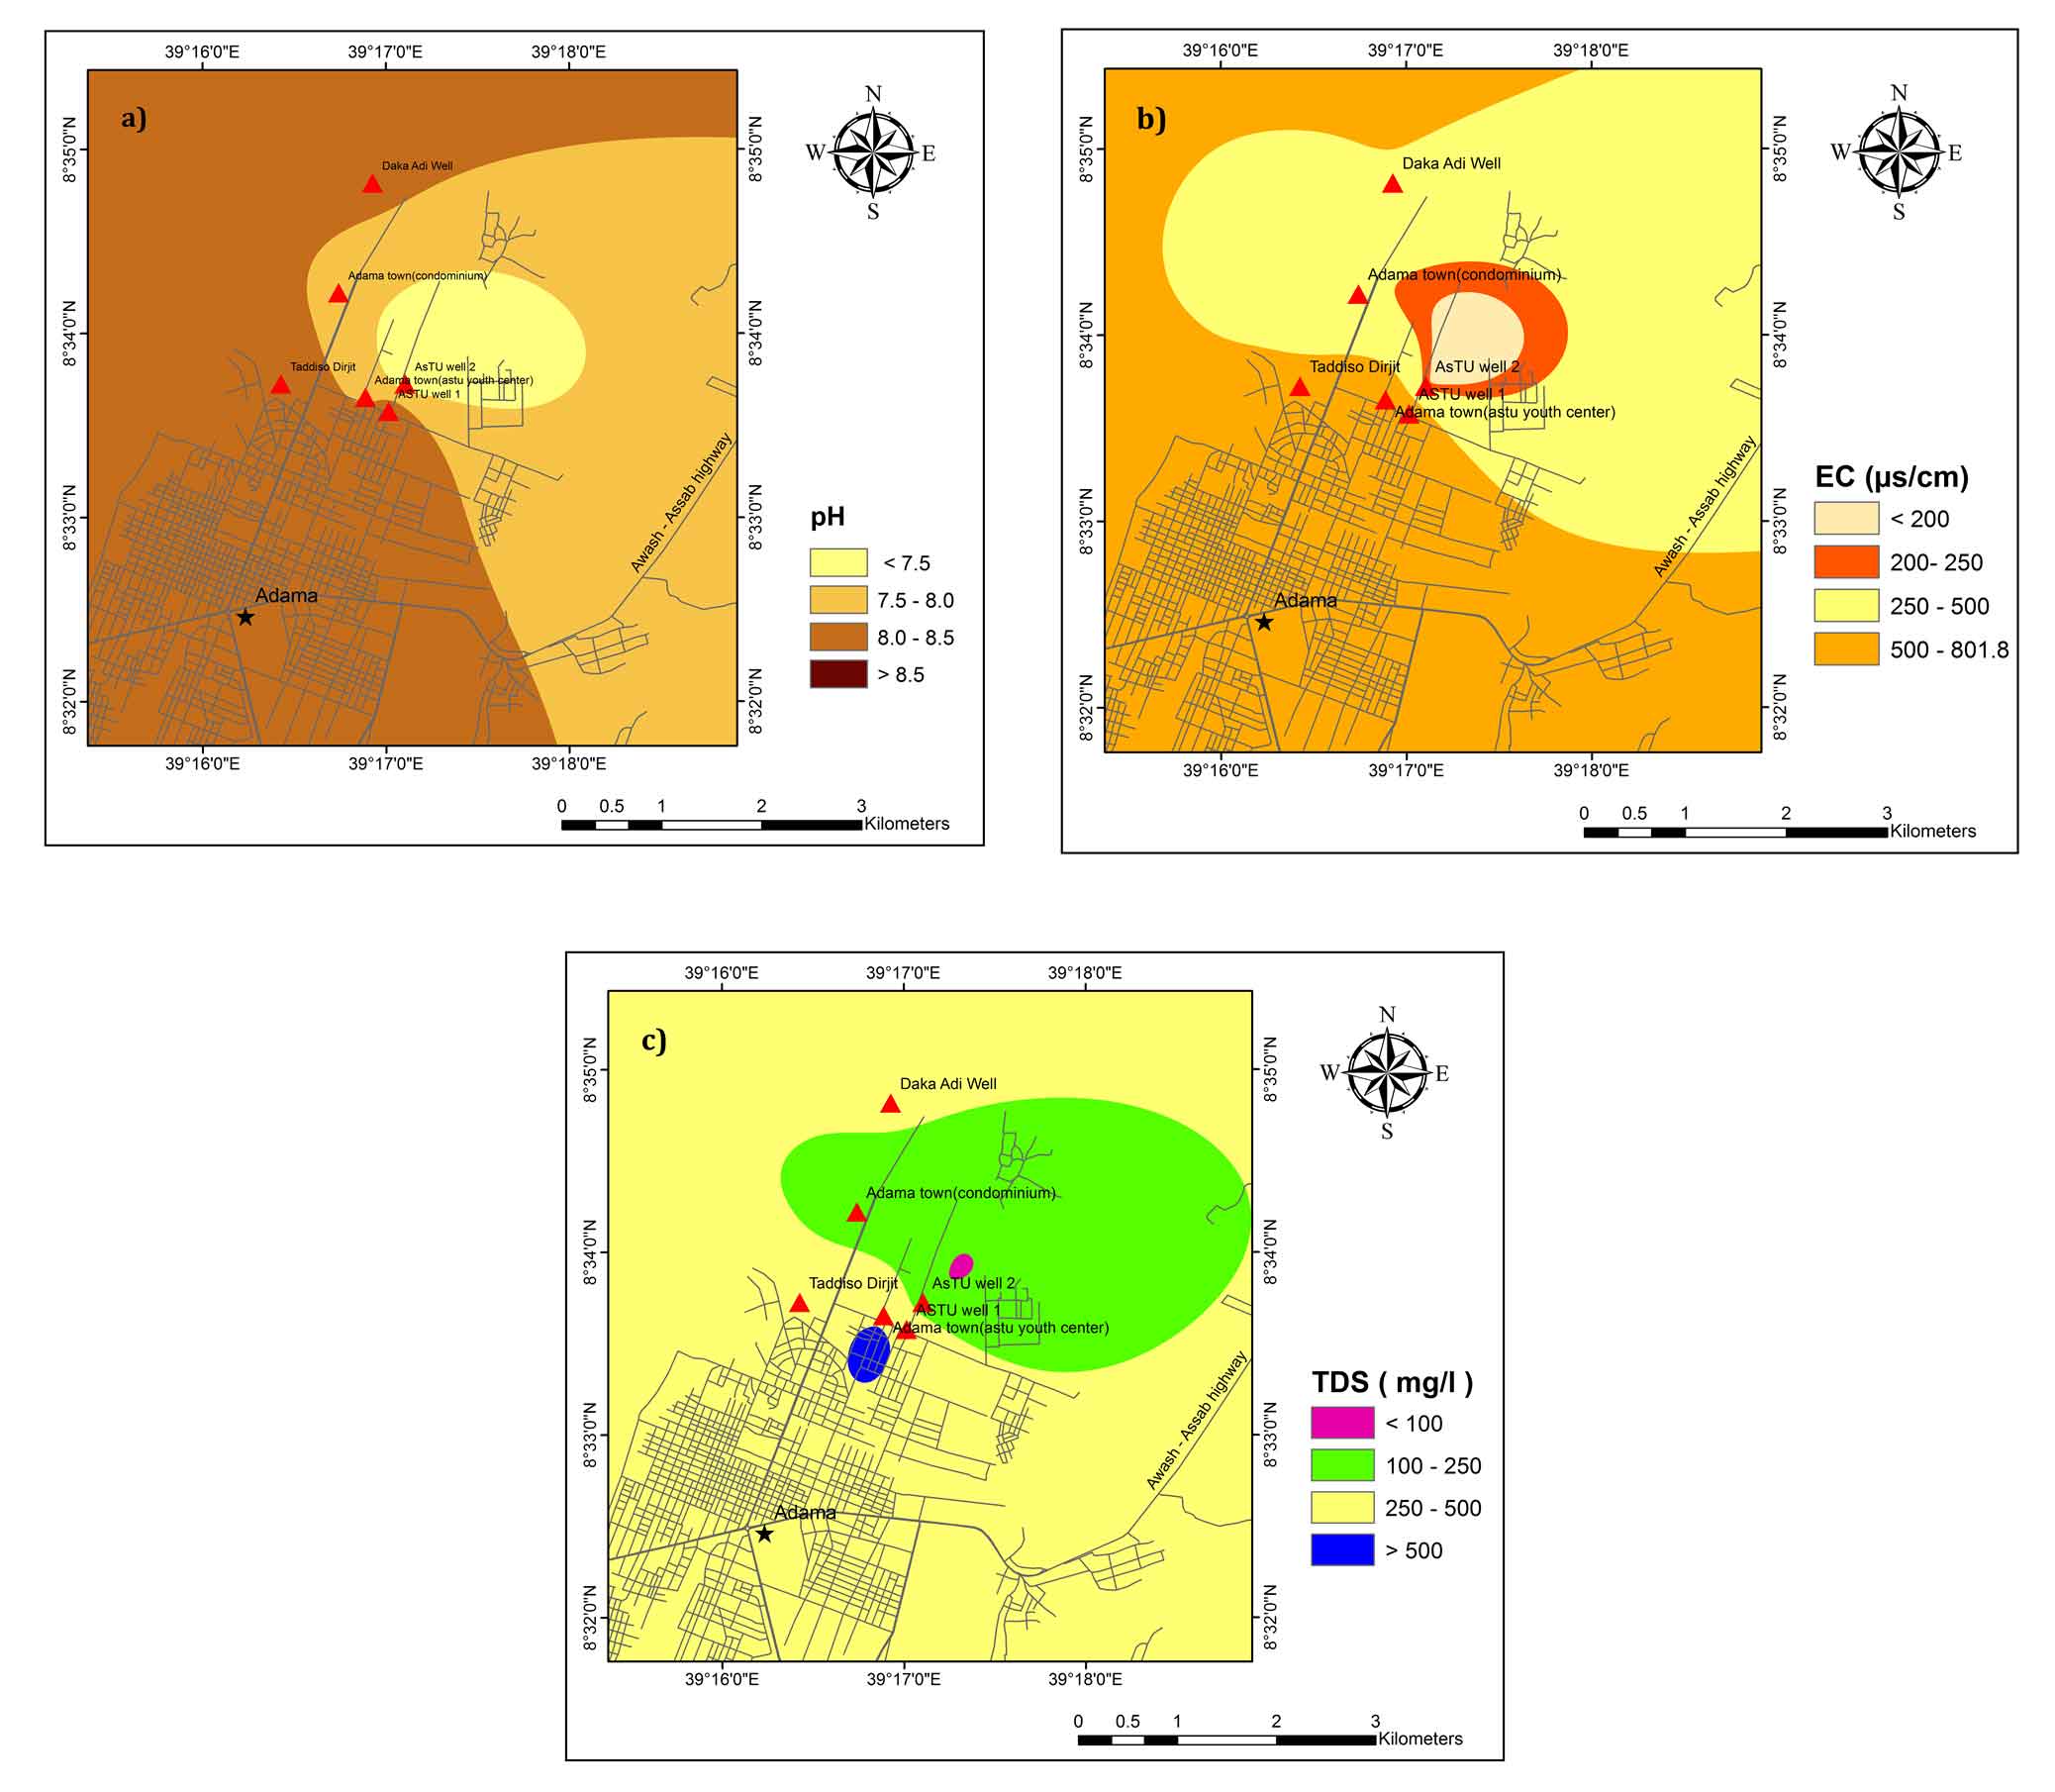
The source of high EC values in the study area might be agricultural activities and wastewater discharged from industries and cities (Amanial, 2015). Figure 2(c) shows the spatial variation map of TDS. The larger part of the study area has a TDS value of less than 500 mg/L and falls in the freshwater group except small areas found in the central part (BH4 kebele 03). BH4 kebele 03 shows brackish water type. Higher content of TDS is from the weathered media of the rock and longer residence time of groundwater in the aquifer (Rango et al., 2013; Mechal et al., 2017).
5.2 Chemical Characteristics of Ground Water
5.2.1 Major Cations
Calcium (Ca2+)
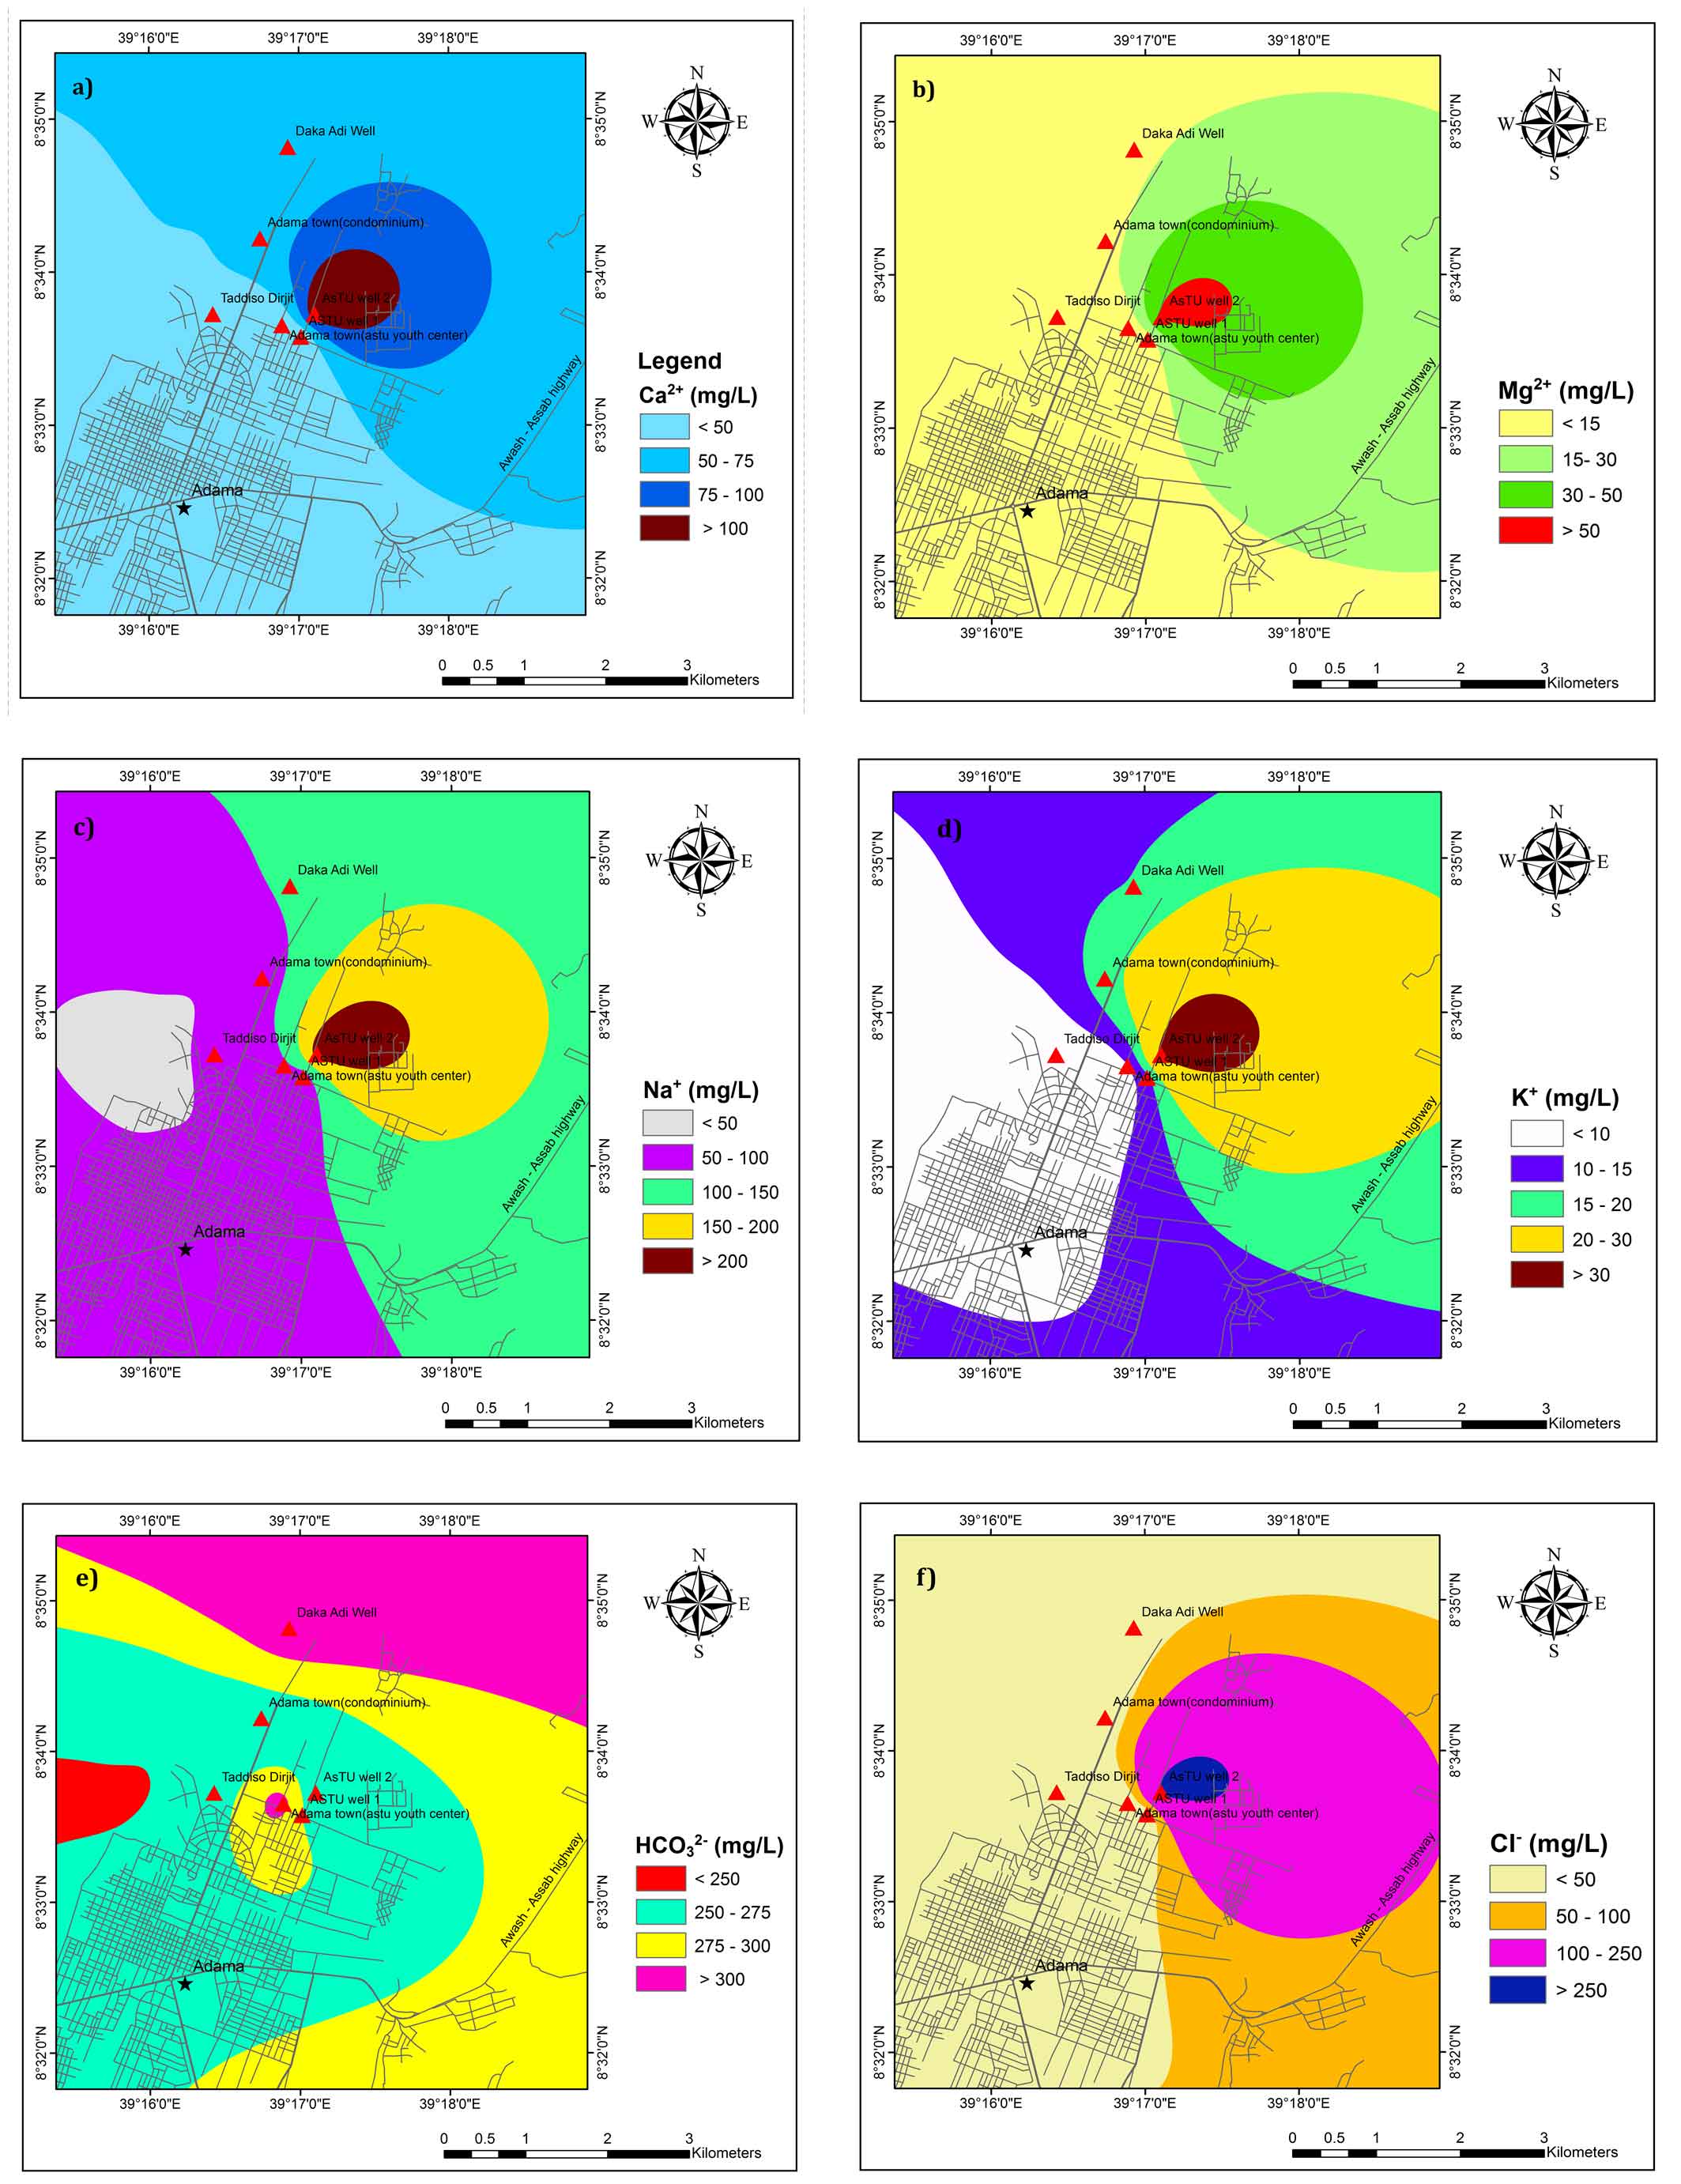
As per WHO (2011), the permissible limit for Ca2+ is 75 mg/L and 30 mg /L as a safer zone for drinking (Table 1). It is observed that most of the groundwater samples are found to be within the permissible limit of drinking water and fall in good groundwater quality zones except ASTU well 2 (Figure 3a). The possible source of high Ca2+ in samples from ASTU well 2 might be due to chemical and mineralogical composition of basic rocks through which it percolates.
Magnesium (Mg2+)
As per WHO (2011), the permissible limit for Mg2+ is 50 mg/L (Table 1). Spatially, Mg2+ in groundwater is above 50 mg/L in and around ASTU well 2 (Figure 3b). Basalt that contains ferromagnesian minerals such as olivine, pyroxenes, and amphibole are source of Mg2+ (Hem, 1985; Wagh et al., 2019a). On the basis of Mg2+ content, almost all the groundwater samples are suitable for drinking.
Sodium (Na+)
Sodium concentration is higher in ASTU Well 2. Deep percolating water from the topsoil layers could be a possible source of sodium due to longer residence time and water-rock interaction (Wagh et al., 2019b). Spatially, around ASTU Well 2 of the study area has greater than the desirable limit of sodium concentration in drinking water standard (Figure 3c).
Potassium (K+)
According to WHO’S standard, potassium concentration < 50 mg/L, 50-100 mg/L and > 200 mg/L is fall in a good zone, moderate zone and poor groundwater quality zones, respectively. Good zone and moderate zone are suitable for drinking purposes. The maximum concentration of potassium in groundwater samples of the study area is 31.5 mg/L (Table 1) which falls in the good zone. Spatial variation map of potassium shows that, groundwater samples fall in the good zone (Figure 3d).
5.2.2 Major Anions
Bicarbonate (HCO32−)
In the study area, bicarbonate concentration is high. Silicate and carbonate weathering process are sources of bicarbonate (Bala Krishna Prasad and Ramanathan, 2005). According to the WHO standard, HCO32− < 100 mg/L is categorized as a poor zone which is suitable only for industrial activity. The larger part of the study area has HCO32− concentration greater than 250 mg/L except for few areas in the Western part (Figure 3e). The possible source of HCO32− could be the magmatic release of CO2 by the active fault zones (Mechal et al., 2017; Rango et al., 2010).
Chloride (Cl-)
The chloride concentration in groundwater of the study area below desirable limit except ASTU well 2 which is exceeding the maximum allowable limit of 200 mg/L (Table 1). The spatial distribution of chloride concentration in the groundwater of the study area is illustrated in Figure 3f. ASTU well 2 of the study area has a poor groundwater quality zone (Figure 3f). The possible source of chloride is agricultural activities and leachate from waste disposal sites.
Sulphate (SO42−)
The highest desirable limit of Sulphate in drinking water quality is 200 mg/L and 483 mg/L according to WHO, 2011 and Ethiopian standard, respectively. In the study area, most of the samples are found to be within the prescribed limit for drinking purposes except ASTU well 2 (Table 1). This high content of SO42− in the basin might be associated with volcanic activity and lacustrine sediments (Ayenew, 2005; Kawo and Shankar, 2018).
Fluoride (F-)
The highest desirable limit of fluoride in drinking water quality is 1.5 mg/L and 3 mg/L according to WHO, 2011 and Ethiopian standards, respectively. Fluoride concentration in groundwater is within the desirable limit of WHO standards and Ethiopian standard in the study area (Table 1). Higher concentration of fluoride (1.5 mg/L) is observed at BH4 Kebele 03. The F- in Ethiopian rift groundwater comes from acidic volcanic rocks such as tuffs, fluvio/volcano lacustrine sediments, pyroclastic deposits, ignimbrite and rhyolite (Furi et al., 2011; Haji et al., 2018).
5.3 Hydrogeochemical Facies
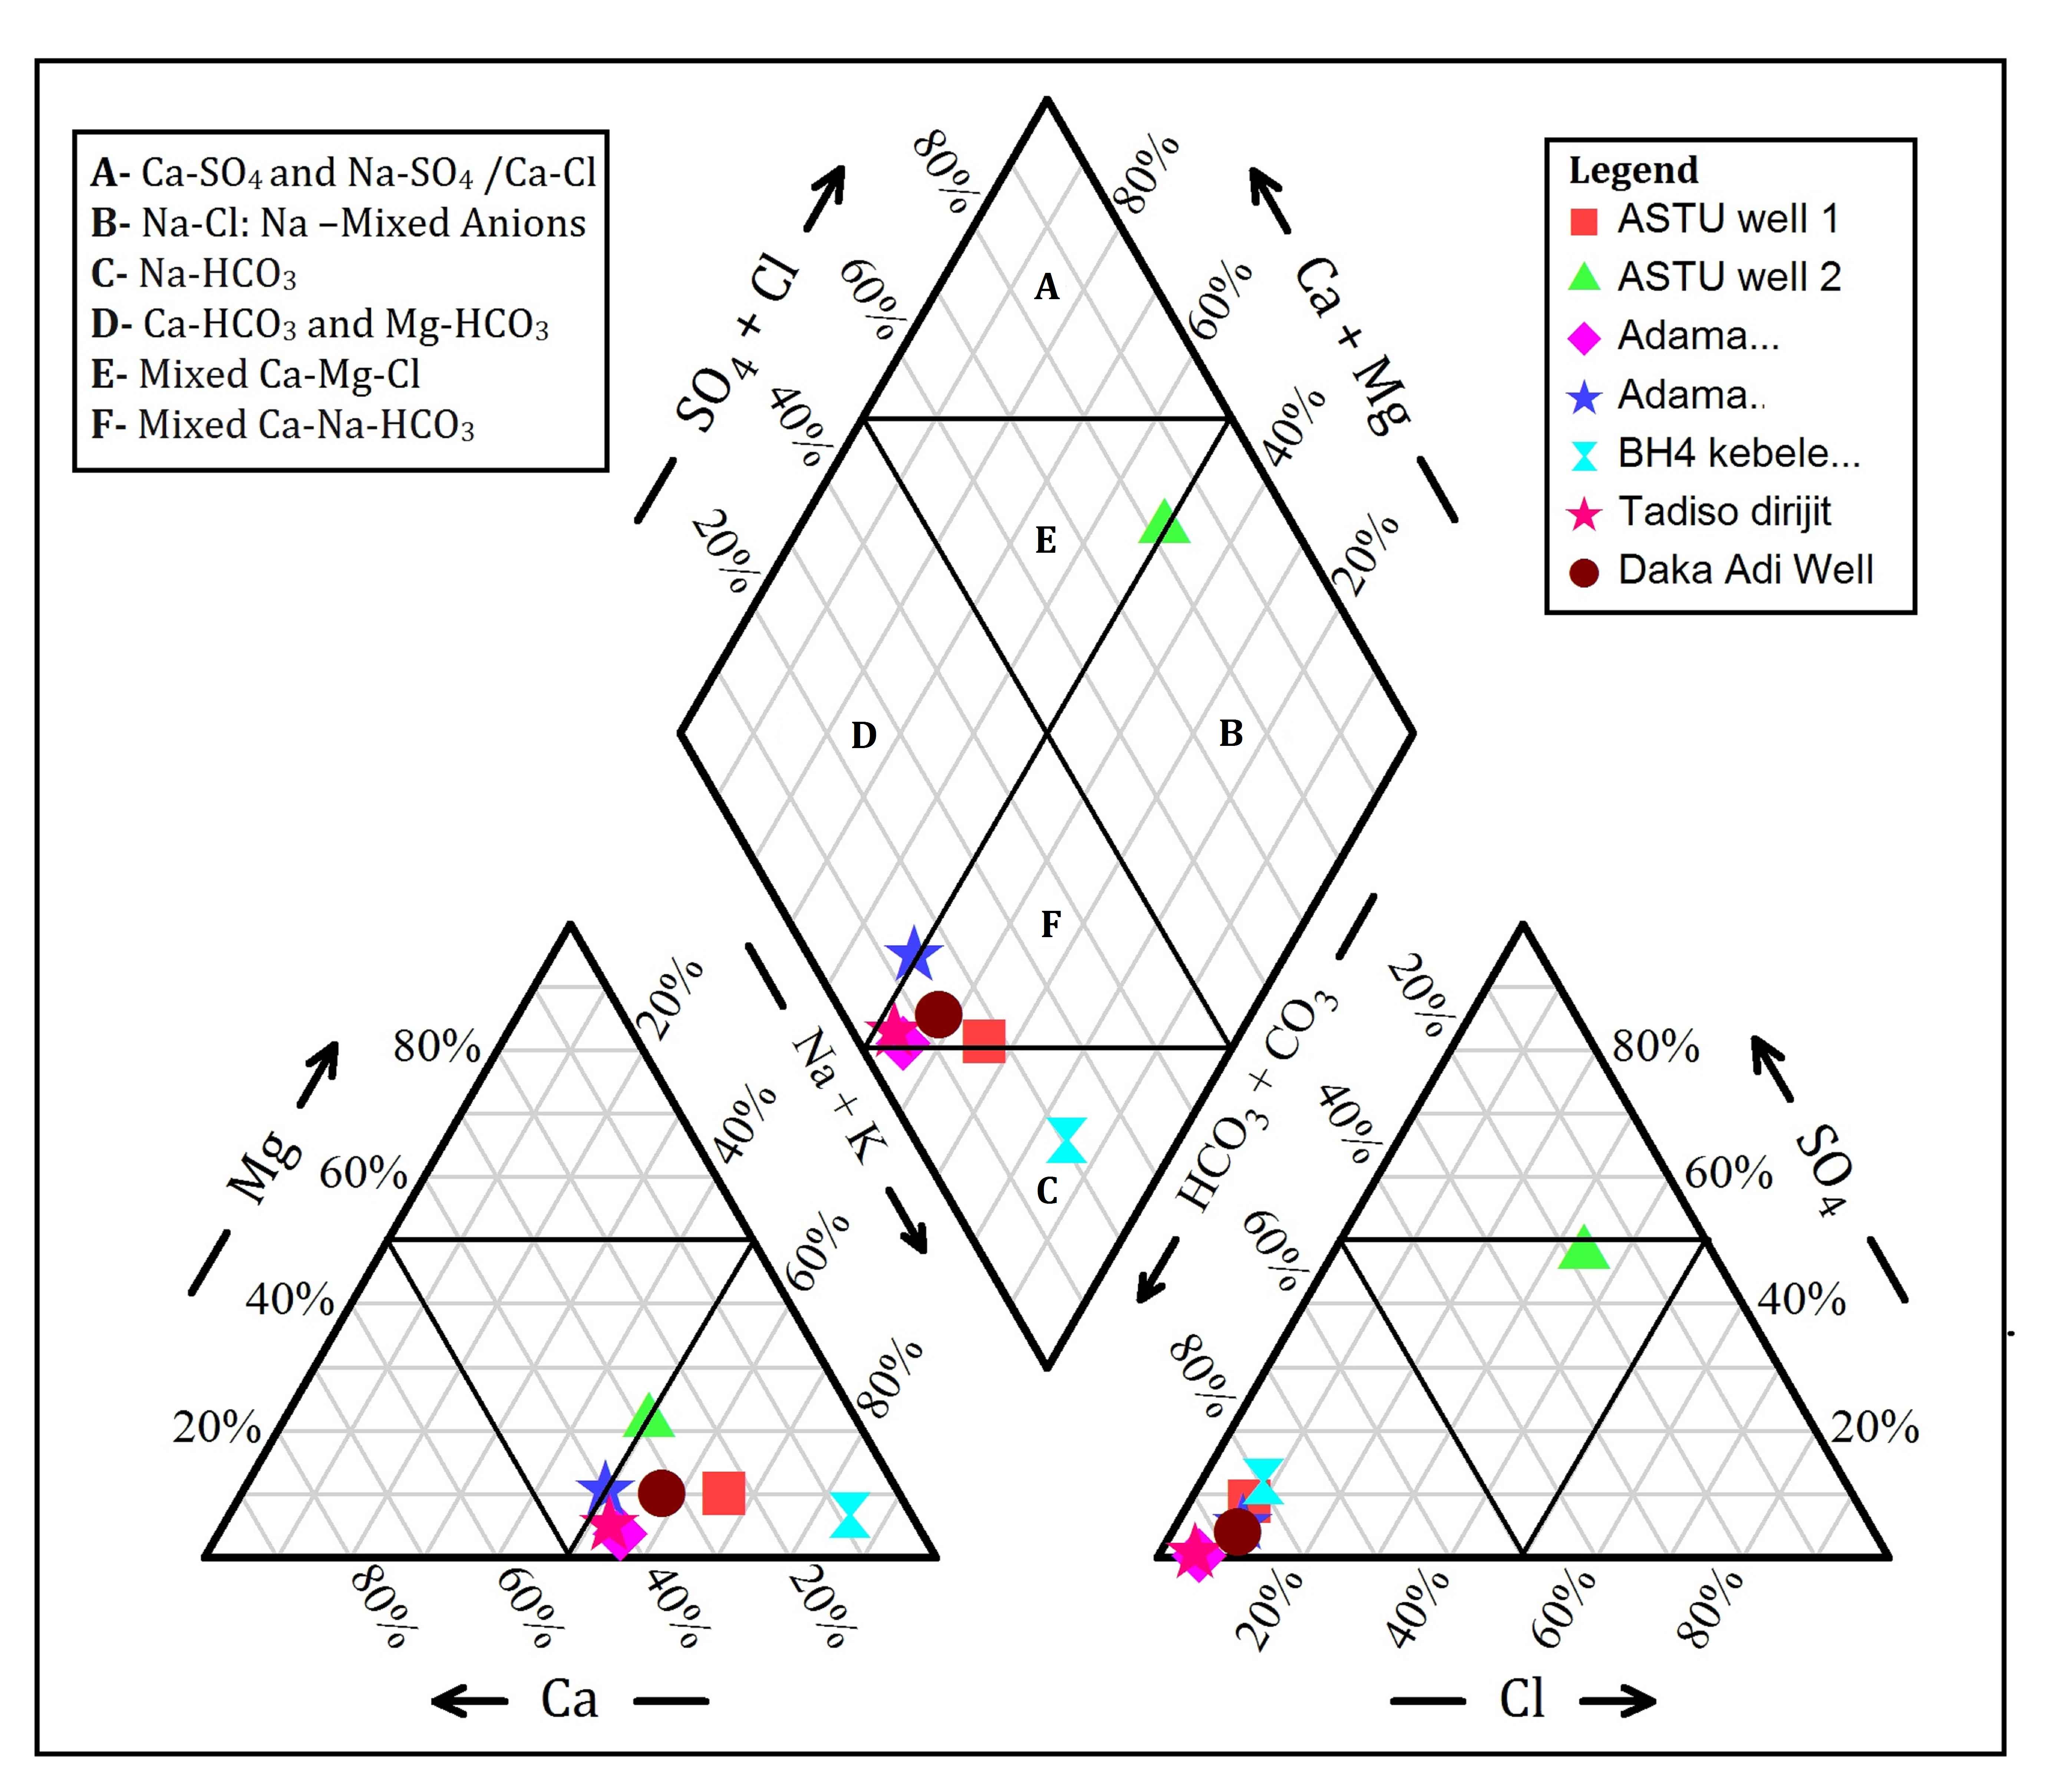
The dominant water type in the study area is Mixed Ca–Na–HCO3 type facies type (Figure. 4). According to Kawo and Shankar (2018), Na/Ca–HCO3 water is dominant in escarpment and Na–HCO3 type of water is dominant in the rift floor. Ayenew, (2005) also reported that hot springs and groundwater in the rift valley has a Na–HCO3 water type, with high Na+ and HCO32− concentration. Haji et al., (2018), stated that a high concentration of fluoride which is related to Na–HCO3 type of waters.
5.4 Suitability of Groundwater for Irrigation Purposes
Irrigation water quality indices such as Sodium Adsorption Ratio (SAR), Residual Sodium Carbonate (RSC), Sodium Percent (Na%) were used to investigate the suitability of groundwater. Higher concentration of dissolved ions in irrigation water has a negative effect on soil properties and decline productivity (Kaka et al., 2011; Li et al., 2011). Chemically, irrigation water should contain less dissolved ions and has no poisonous constituents (Shankar et al., 2011c).
Sodium Adsorption Ratio (SAR)
The SAR was used to evaluate the suitability of water for irrigation. It measures the proportion of sodium ions to calcium and magnesium in irrigation water (Kalra and Maynard, 1991). In this study, SAR was calculated using equation (equation (1)) (Richards, 1954).
\(SAR = {Na^+ \over {\sqrt{{Ca^{2+}+Mg^{2+}}}\over 2}}\) (1)
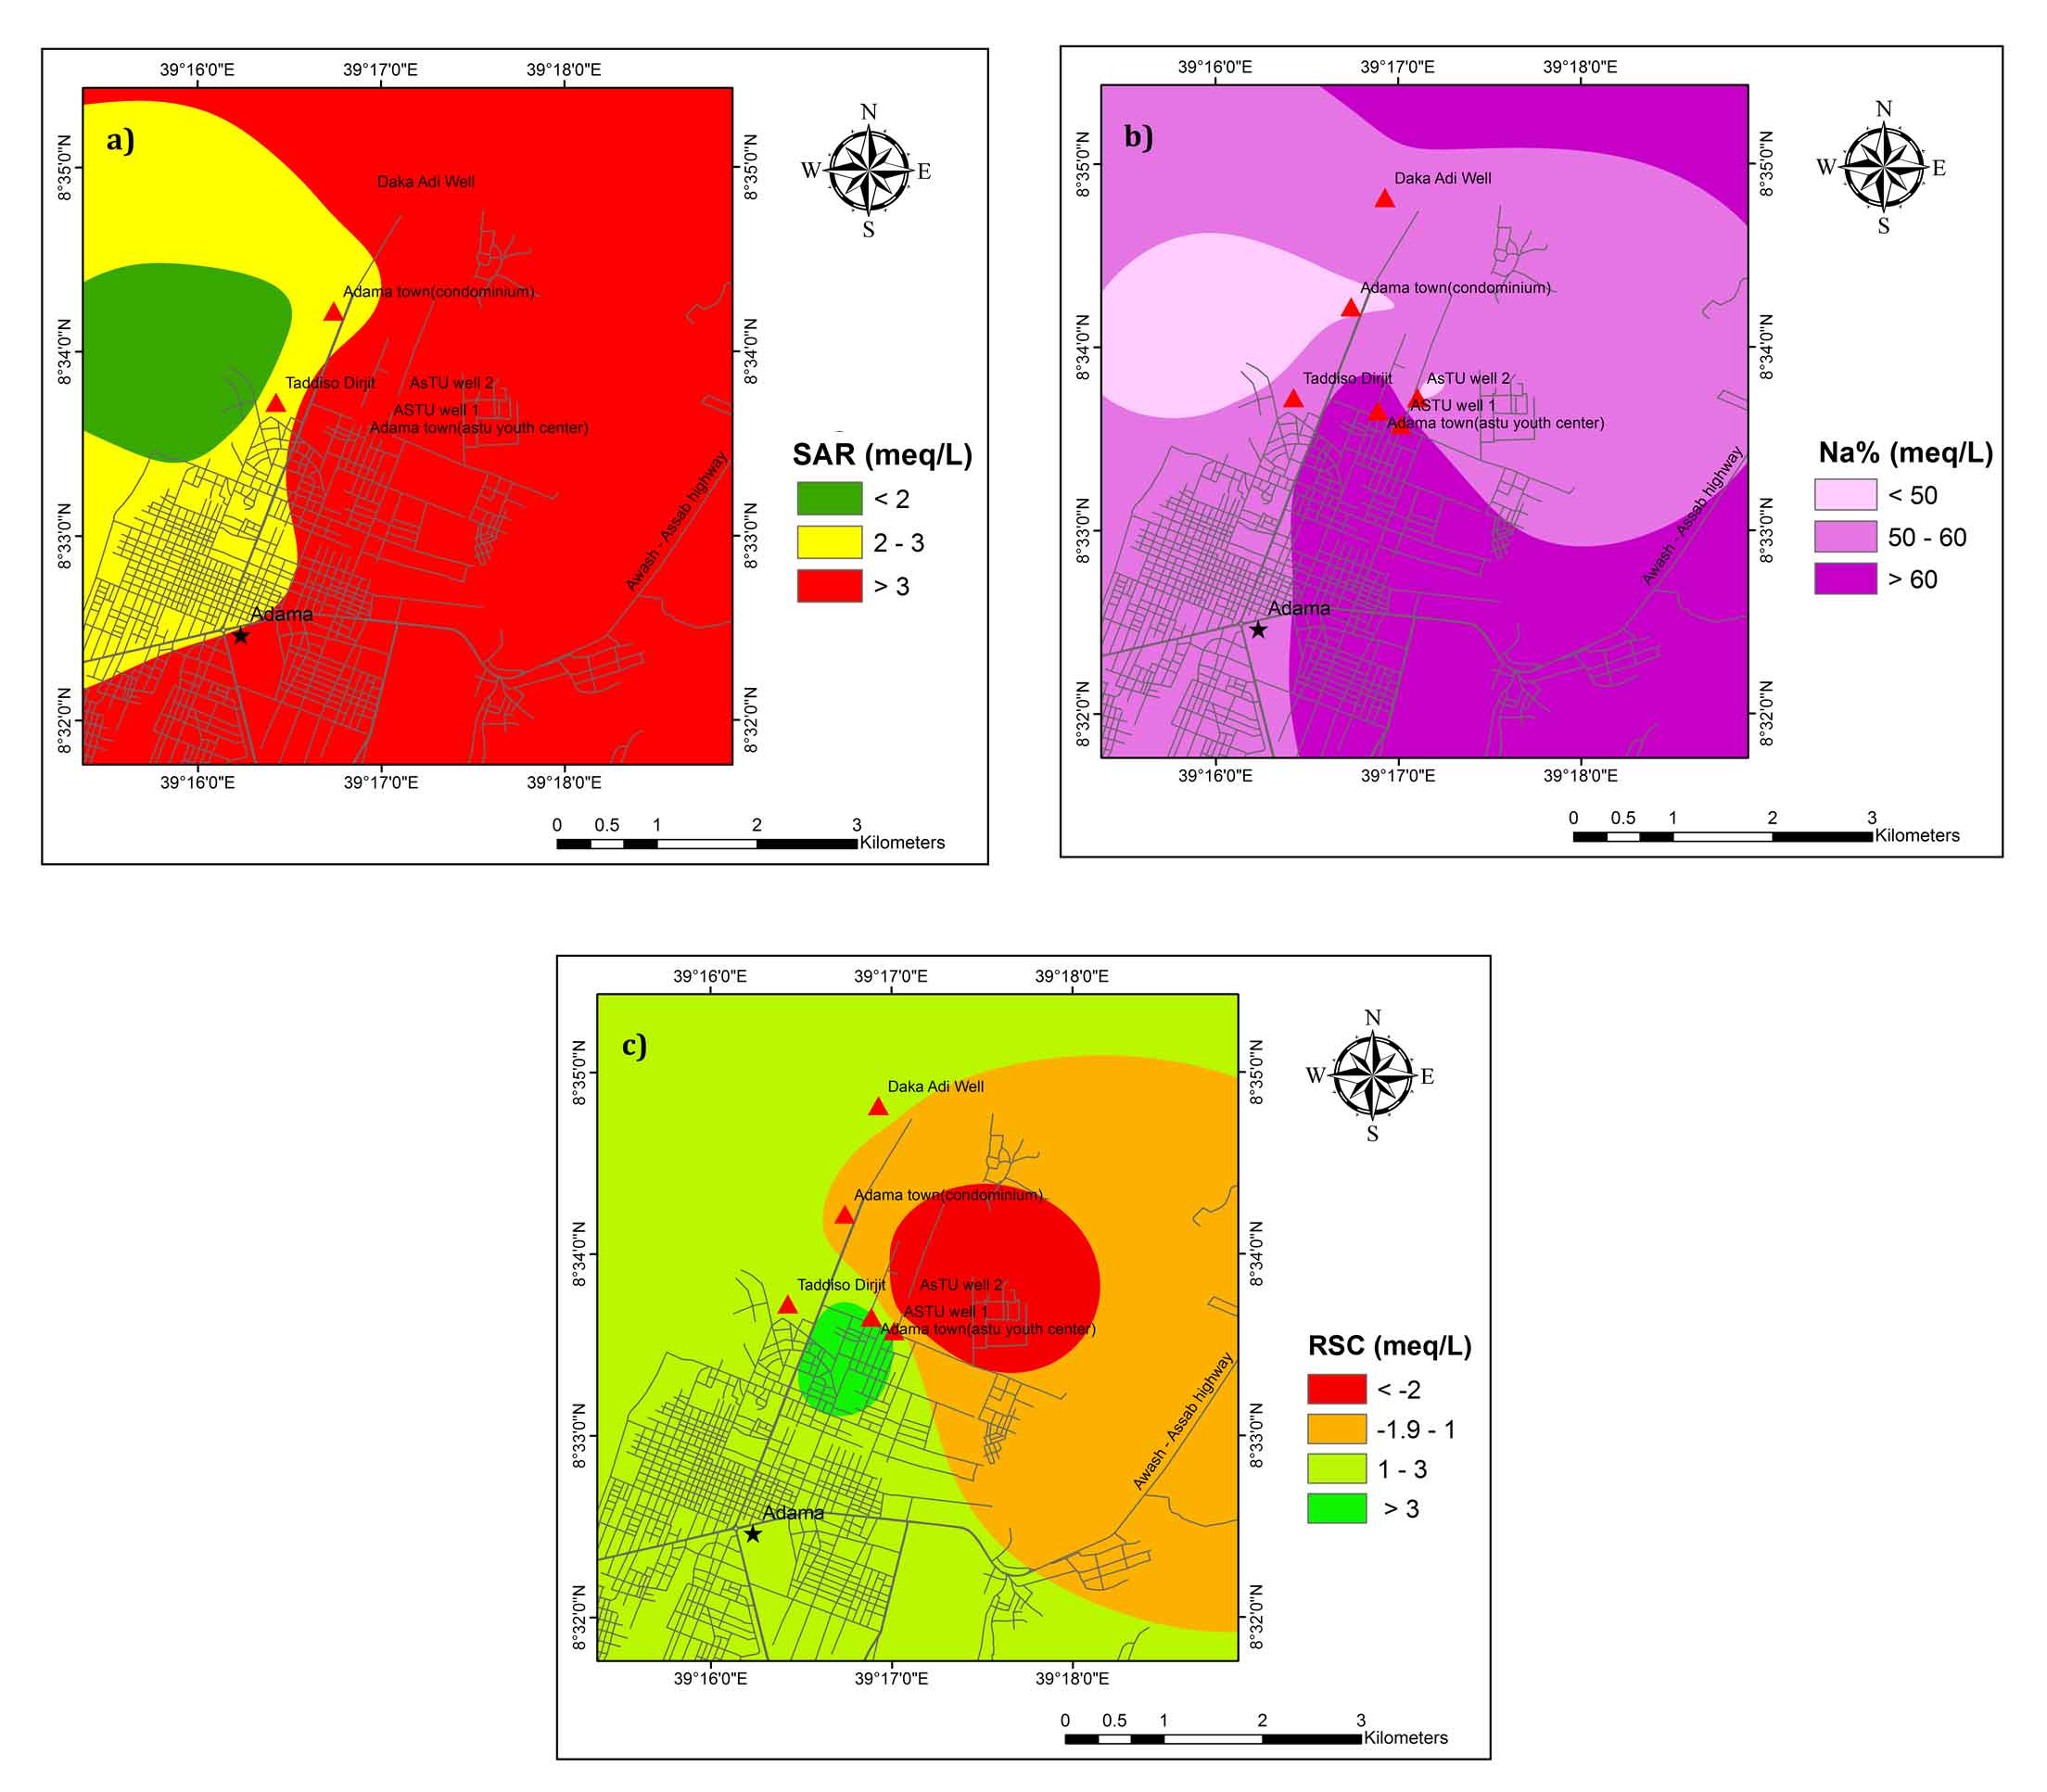
According to Richards, (1954) SAR <10, is considered excellent for irrigation (Table 2) and all the groundwater samples fall in the excellent water class. The calculated SAR value in the study area ranges from 2.3 to 7.4 and suitable for irrigation (Figure 5a).
Table 2. Classification of groundwater samples for irrigation purposes
|
Parameters (meq/L) |
Sample range |
Range |
Classification |
Number of samples |
||
|
Min. |
Max. |
Average |
||||
|
Alkalinity hazard (SAR) (Richards 1954) |
2.29 |
7.36 |
3.64 |
< 10 |
Excellent |
7 |
|
10 – 18 |
Good |
0 |
||||
|
18 – 26 |
Doubtful |
0 |
||||
|
> 26 |
Unsuitable |
0 |
||||
|
Na% (Wilcox 1955) |
49.57 |
84.81 |
59.36 |
< 20 |
Excellent |
0 |
|
20 – 40 |
Good |
0 |
||||
|
40 – 60 |
Permissible |
5 |
||||
|
60 – 80 |
Doubtful |
1 |
||||
|
> 80 |
Unsuitable |
1 |
||||
|
RSC (Raghunath 1987) |
-5.89 |
4.75 |
1.04 |
< 1.25 |
Good |
2 |
|
1.25 - 2.5 |
Doubtful |
3 |
||||
|
> 2.5 |
Unsuitable |
2 |
||||
Sodium Percentage (Na%)
High concentration of sodium in irrigation water reduces soil permeability and eventually causes soil to have poor internal drainage (Belkhiri and Mouni, 2012). Hence, it restricts air and water movements in the soil and this type of soils become hard when dry (Saleh et al., 1999). In this study, Sodium percentage was computed using equation (equation (2)):
Na% = [(Na++K+)/(Ca2++Mg2++Na++K+)]×100meq/l (2)
In the study area, the Na% ranges between 49.6 and 84.8 (Table 2). Na% indicates that around 70 % of samples fall in the field of the permissible limit. It was revealed from the analysis that the groundwater of doubtful and bad quality (ASTU well 1 and BH4 Kebele 03) was found 30% of the area (Figure 5b). Na% in irrigation water results in sodium accumulation and calcium deficiency in the soil. Therefore, good drainage, high leaching process and application of organic matter are possible solution to manage property of the soil (Beyene et al., 2019).
Residual sodium carbonate (RSC)
The high concentration of carbonate and bicarbonate in groundwater affects the suitability of groundwater for irrigation (Kawo and Shankar, 2018). High concentrations of bicarbonate in irrigation water causes precipitation of calcium and magnesium in the soil and the soils become more concentrated (Eaton, 1950; Srinivasamoorthy et al., 2014). The relative proportion of sodium in the water is increased in the form of sodium carbonate denoted as residual sodium carbonate (RSC) (Eaton, 1950; Ragunath 1987). In this study, RSC was calculated using equation (equation (3)):
RSC = {(HCO3- + CO32-) – (Ca2++ Mg2+)} (3)
RSC more than 2.50meq/L of is unsuitable for irrigation purposes (Ragunath 1987). The results of RSC values show that 28.6% of the samples are fall in good quality whereas 42.9 % and 28.6 % of samples fall in the category of doubtful and unsuitable class, respectively (Table 2; Figure 5c) for irrigation purpose.
5.5 Water Quality Index (WQI)
Many researchers have been used WQI to map groundwater quality and its suitability for drinking purposes (Singh, 1992; Subba Rao, 1997; Avvannavar and Shrihari, 2008). In WQI the rating system was used for individual water quality parameters to determine the overall drinking water quality (Mitra et al., 2006; Sahu and Sikdar, 2008). In this study, the WHO (2011) guideline for drinking purpose was considered to calculate of WQI. pH, TH, TDS, major cations and anions were given weight (wi) to compute WQI. The highest wi was assigned to parameters that has a significant health effect. F- was assigned the highest wi followed by pH, TDS, TH, Ca2+, Mg2+, Na+, and SO42- as shown in Table 3. The least weight is assigned for chloride. Then, the relative weight (Wi) for each parameter is computed from the using (equation (4)). A quality rating scale (qi) for each parameter also calculated using (equation (5)). Finally WQI is calculated using equation (equation (6)). Categories of WQI are presented in Table 4. The categories of WQI for each samples is represented in Table 5.
Wi = wi/Σni = 1 wi (4)
qi = (Ci/Si) × 100 (5)
SIi = Wi × qi and WQI = ΣSIi (6)
where, Wi is the relative weight, wi is the weight of each parameter, n is the number of parameters, qi is the quality rating, Ci is the concentration of each chemical parameter in each water sample, Si is the WHO standard for each chemical parameter, SIi is the sub-index of ith parameter.
Table 3. Relative weight of chemical parameters
|
Chemical parameters |
WHO (2011) |
Weight (wi) |
Relative weight |
|
F- |
1.5 |
5 |
0.179 |
|
pH |
6.5 - 8.5 |
4 |
0.143 |
|
TH |
300 |
4 |
0.143 |
|
TDS |
500 |
4 |
0.143 |
|
Ca2+ |
75 |
3 |
0.107 |
|
Mg2+ |
50 |
3 |
0.107 |
|
SO42- |
200 |
2 |
0.071 |
|
Na+ |
200 |
2 |
0.071 |
|
Cl- |
250 |
1 |
0.036 |
|
Σwi = 28 |
Σwi = 1.000 |
||
Table 4. Water Quality Index and their status of groundwater (Sahu and Sikdar, 2008)
|
Range |
Type of water |
Number of the samples |
% of the samples |
|
< 50 |
Excellent water |
0 |
0 |
|
50 - 100 |
Good water |
06 |
85 |
|
100-200 |
Poor water |
01 |
15 |
|
200-300 |
Very poor water |
0 |
0 |
|
> 300 |
Unsuitable |
0 |
0 |
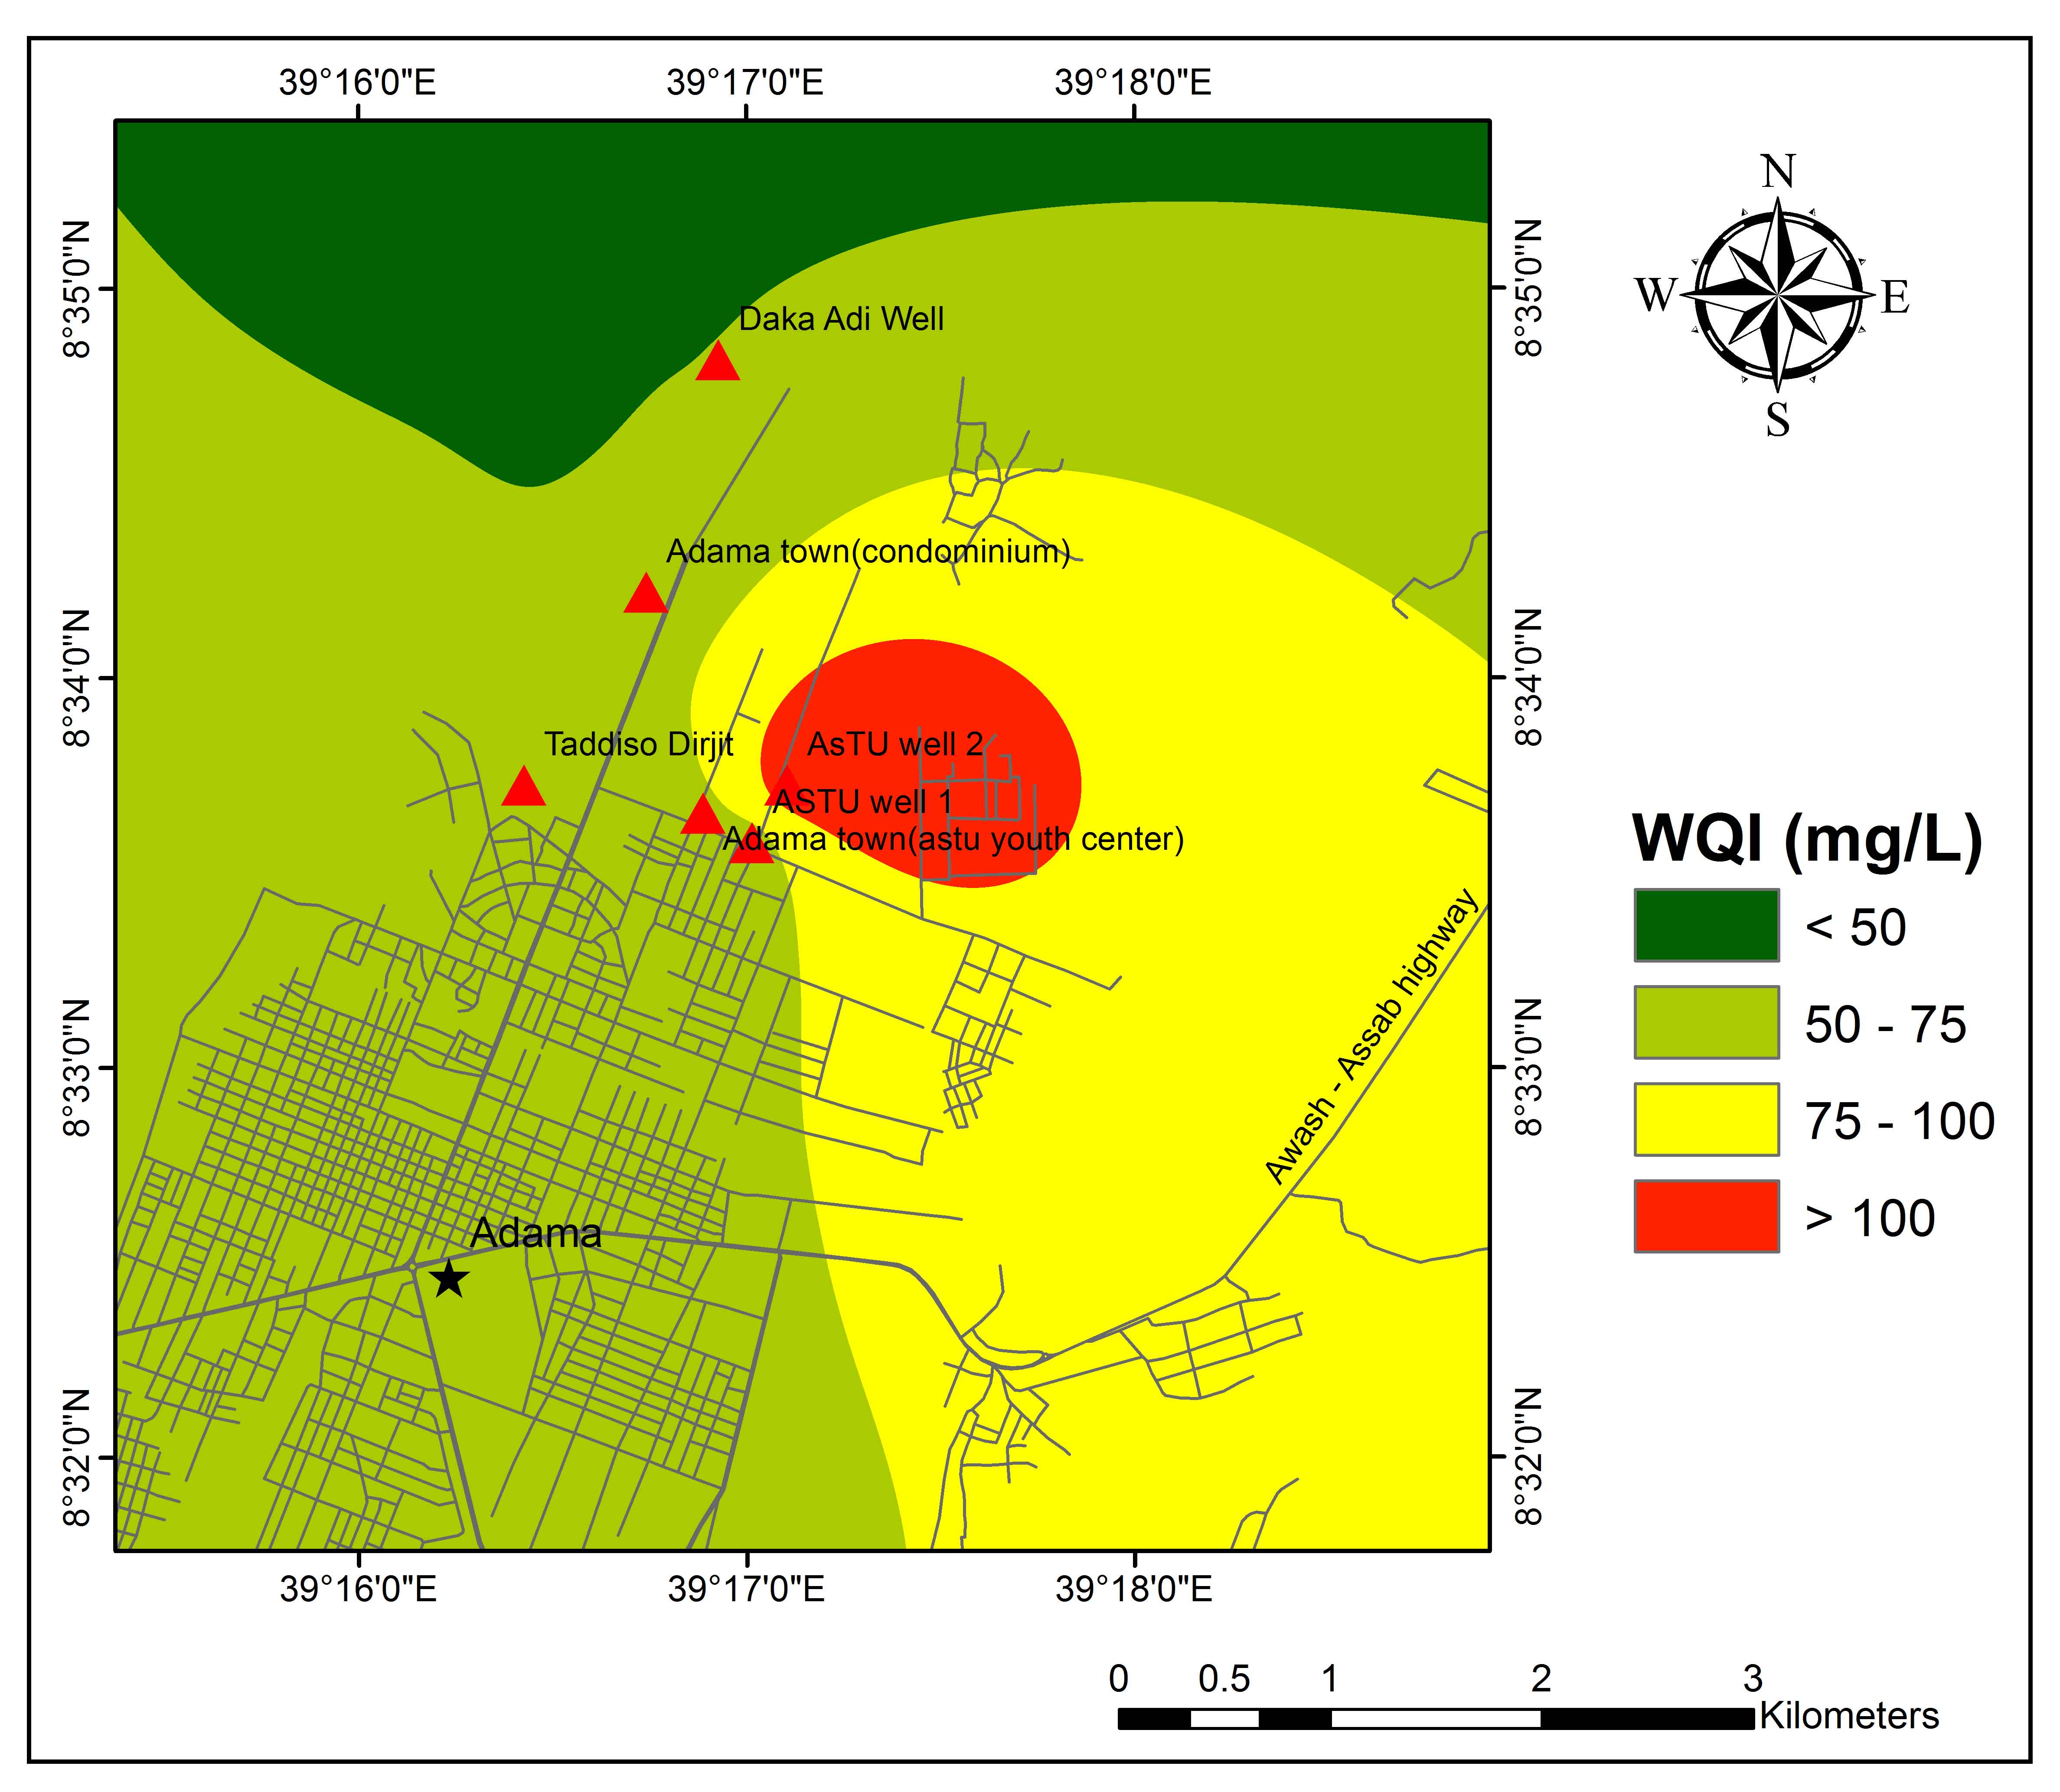
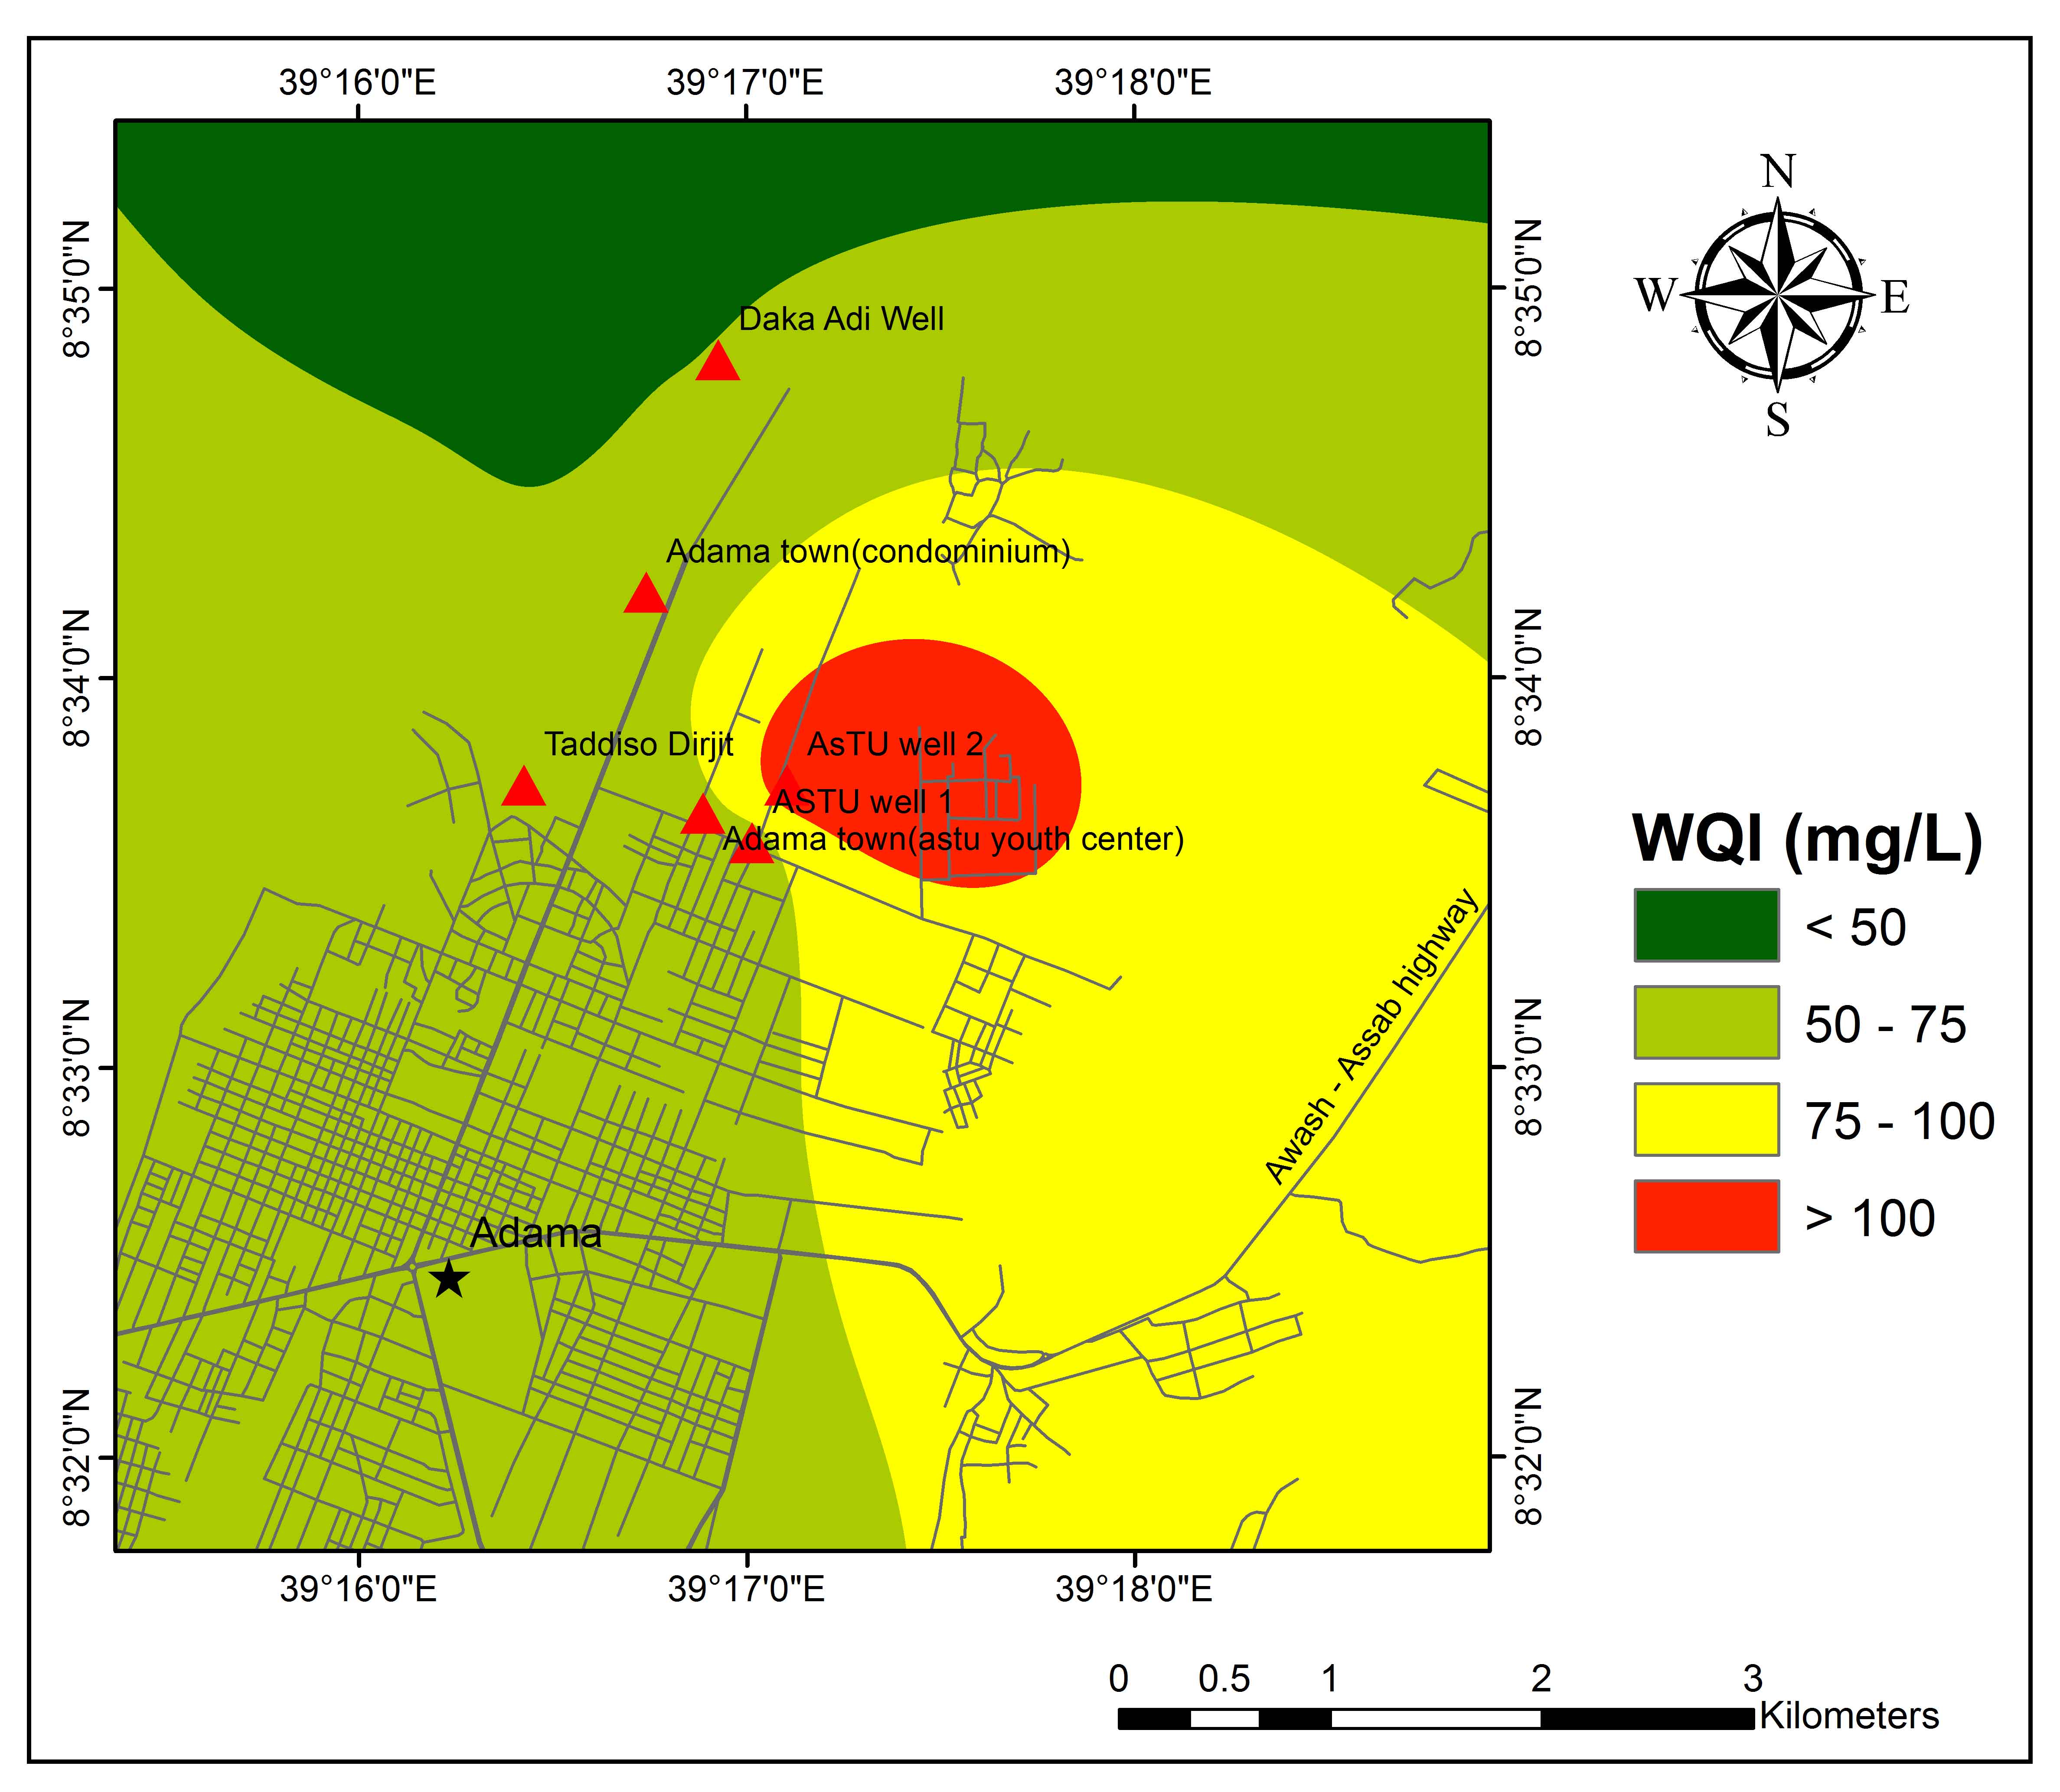
WQI of the study area ranges between 51 and 114 (Table 5). The result of WQI indicates that 85 % and 15% of water samples fall in the category of good and poor water quality, respectively. The spatial distribution of WQI, (Figure 6) represents most of the regions with good quality groundwater. Except ASTU Well 2 which is fall in poor quality groundwater all other samples fall in good quality for drinking purposes.
Table 5. Calculation of WQI for individual water samples
|
Well No. |
Well Name |
WQI |
Classification |
|
1 |
ASTU well 1 |
65 |
Good water |
|
2 |
ASTU well 2 |
114 |
Poor water |
|
3 |
Adama town (ASTU youth center) |
60 |
Good water |
|
4 |
Adama town (condominium) |
59 |
Good water |
|
5 |
BH4 kebele 03 |
78 |
Good water |
|
6 |
Taddiso Dirjit |
64 |
Good water |
|
7 |
Daka Adi Well |
51 |
Good water |
6. Conclusions
The present study was aimed at groundwater quality assessment using geospatial techniques in Northeast of Adama Town, Oromia Region, Ethiopia. The study draws out the following conclusions:
- The pH of groundwater samples indicate alkaline in nature. EC of groundwater samples are found within the Good limit of drinking and BH4 Kebele 03 is permissible limit. The TDS values within the desirable limit of drinking. BH4 Kebele 03 shows brackish water type.
- The concentration of Calcium, Magnesium, Sodium and Potassium are found within the desirable limit of drinking except ASTU Well 2.
- A larger part of the study area has HCO32− concentration greater than 250 mg/L except for few areas in the western part.
- The chloride concentration in groundwater of the study area below the desirable limit except ASTU well 2 which is exceeding the maximum allowable limit of 200 mg/L.
- The Piper Trilinear diagram indicates that most of the groundwater samples fall in Mixed Ca–Na–HCO3 types.
- The Na% indicates that around 70 % of samples fall in the field of the permissible limit. It was observed that doubtful and bad quality at ASTU well 1 and BH4 Kebele 03, respectively.
- The results of RSC values show that 28.6% of the samples are fall in good quality whereas 42.9% and 28.6% of samples fall in the category of doubtful and unsuitable class, respectively for irrigation purpose.
- The result of WQI indicates that 85% and 15% of water samples fall in the category of good and poor water quality, respectively. Except ASTU Well 2 which is fall in poor quality groundwater all other samples fall in good quality for drinking purposes.
Overall, groundwater quality parameters (major and trace elements) should be monitored in the central part of the study area to avoid problems related to human health and ensure socio-economic development in the area.
Conflict of interest
The authors declare no conflict of interest.
Acknowledgements
The authors are grateful to the Adama Science and Technology University, School of Applied Natural Science for support during this research. We are grateful to the Editor-in-Chief and two anonymous reviewers for their meticulous comments and suggestions which helped us to improve the manuscript.
Abbreviations
APHA: American Public Health Association; ASTU: Adama Science and Technology University; EC: Electrical Conductivity; GIS: Geographic Information System; IDW: Inverse Distance Weighting; MER: Main Ethiopian Rift; RSC: Residual Sodium Carbonate; SAR: Sodium Adsorption Ratio; TDS: Total Dissolved Solids; TH: Total Hardness; UNDP: United Nations Development Programme; WHO: World Health Organization; WQI: Water Quality Index.
Article information
- Received
- 11 Nov 2019
- Revised
- 25 Feb 2020
- Accepted
- 27 Dec 2019
- Published
- 2 Jan 2020
- Handling editor
- Dr. Pramodkumar Hire
- Licence
- CC BY-NC-ND 4.0
- Journal
- Hydrospatial Analysis, ISSN 2582-2969
References
-
Agostini, A., Bonini, M., Corti, G., Sani, F. and Mazzarini, F., 2011. Fault architecture in the Main Ethiopian Rift and comparison with experimental models: Implications for rift evolution and Nubia-Somalia kinematics. Earth and Planetary Science Letters, 301(3-4), 479-492.
Crossref -
Altchenko, Y., Awulachew, S.B., Brida, A.B., Diallo, H.A., Mogbante, D., Pavelic, P., Tindimugaya, C. and Villholth, K.G., 2011. Management of groundwater in Africa including transboundary aquifers: implications for food security, livelihood and climate change adaptation. African climate policy centre working paper 6. Addis Ababa, Ethiopia: U. Nations Econ. Comm. for Africa (UNECA).
-
Amanial, H. R., 2015. Study on the pollution levels of trace metals from modjo tannery effluent in the Surrounding river water and soil. Science Journal of Analytical Chemistry. 3(5), 56-60.
Crossref -
APHA, 1995. Standard methods for the examination of water and wastewater, 19th Ed. American public Health Association, Washington, DC.
-
Aravindan, S., Manivel, M., Rajendran. S., Bhuvaneshwari and Shankar, K., 2008. Groundwater investigations in the hard rock region of gadilam river basin, Tamil Nadu, Journal of Eco-chronicle, 3(1), 21-30.
-
Aravindan, S. and Shankar, K., 2011a. Ground water quality maps of Paravanar River sub basin, Cuddalore District, Tamil Nadu, India, Journal of Indian Society of Remote Sensing, 39(4), 565-581.
Crossref -
Aravindan, S. and Shankar. K., 2011b. Groundwater quality in Paravanar River sub-basin, Cuddalore District, Tamilnadu, India, Gondwana Geological Magazine, 26(2), 139 - 146.
-
Aravindan, S., Shankar, K. and Mini, S. S., 2011. Integrated geohydrological studies in the sedimentary part of Gadilam River Basin, Cuddalore District, Tamil Nadu. Asian Journal of Earth Sciences, 4, 183-192.
Crossref -
Aravindan, S., Shankar, K., Poovalinga Ganesh, B. and Dharani Rajan, K., 2010. Groundwater geochemical mapping of in the hard rock area of Gadilam River basin, using GIS technique, Tamil Nadu, Indian Journal of Applied Geochemistry, 12(2), 209-216.
-
Assegide, G., 2007. Geology of Addis Ababa city (NC 37-10/ X and Y and NC 476/ E and Sub sheets, Geological Survey of Ethiopia, Addis Ababa, Ethiopia.
-
Avvannavar, S. M., Shrihari, S., 2008. Evaluation of water quality index for drinking purposes for river Netravathi, Mangalore, South India. Environ Monit Assess, 143, 279-290.
Crossref -
Ayenew, T., 2005. Major ions composition of the groundwater and surface water systems and their geological and geochemical controls in the Ethiopian volcanic terrain. SINET, Ethiopian J. Sci. 28 (2), 171-188.
-
Ayenew, T., 2008. The distribution and hydrogeological controls of fluoride in the groundwater of central Ethiopian rift and adjacent highlands. Environmental Geology, 54(6), 1313-1324.
Crossref -
Ayenew, T., Kebede, S., Alemyahu, T., 2008. Environmental isotopes and hydrochemical study as applied to surface water and groundwater interaction in the Awash river basin. Hydrological Processes, 8.
Crossref -
Babiker, I. S., Mohamed, M. A. A. and Hiyama, T., 2006. Assessing groundwater quality using GIS. Water Resources Management, 214: 699-715.
Crossref -
Bala Krishna, P. M. and Ramanathan, A. L., 2005. Solute Sources and Processes in the Achankovil River Basin, Western Ghats, Southern India, Hydrological Sciences Journal, 50(2), 341-354.
Crossref -
Belkhiri, L. and Mouni, L., 2012. Hydrochemical analysis and evaluation of groundwater quality in El Eulma area, Algeria. Applied Water Science, 2(2), 127-133.
Crossref -
Berehanu, B., 2007. Impact of industries and urbanization on water resource in Modjo river catchment. Unpublished M.Sc. Thesis, Addis Ababa University, Addis Ababa, Ethiopia.
-
Beyene, G., Fufa, F. and Aberra, D., 2019. Evaluation of the suitability of groundwater for drinking and irrigation purposes in Jimma Zone of Oromia, Ethiopia. Groundwater for Sustainable Development, 100216.
Crossref -
Boateng, T. K., Opoku, F., Acquaah, SO. and Akoto, O., 2016. Groundwater quality assessment using statistical approach and Water Quality Index in Ejisu- Juaben Municipality, Ghana. Environ Earth Sci, 75, 489.
Crossref -
Chernet, T., 1982. Hydrogeology of the Lakes Region, Ethiopia. Ministry of Mines and Energy, Addis Ababa, Ethiopia.
-
Davis, S. N. and Dewiest, R. J. M., 1966. Hydrogeology, Willey, New York, 463.
-
Demlie, M. and Wohnlich, S., 2006. Soil and groundwater pollution of an urban catchment by trace metals: case study of the Addis Ababa region, central Ethiopia. Environmental Geology, 51 (3), 421 431.
Crossref -
Demlie, M., Wohnlich, S., Ayenew, T., 2008. Major ion hydrochemistry and environmental isotope signatures as a tool in assessing groundwater occurrence and its dynamics in a fractured volcanic aquifer system located within a heavily urbanized catchment, central Ethiopia. J. Hydrol. 353, 175-188.
Crossref -
Demlie, M., Wohnlich, S., Gizaw, B. and Stichler, W., 2007a. Groundwater recharge in the Akaki catchment, central Ethiopia: evidence from environmental isotopes (d18O, d2H and 3H) and chloride mass balance. Journal of Hydrological Processes, 21 (6), 807-818.
Crossref -
Demlie, M., Wohnlich, S., Gizaw, B. and Stichler, W., 2007b. Groundwater recharge, flow and hydrogeochemical evolution in a complex volcanic aquifer system, central Ethiopia. Hydrogeol. J. 15, 1169-1181.
Crossref -
Dinka, M. O., Loiskandl, W. and Ndambuki, J. M., 2015. Hydrochemical characterization of various surface water and groundwater resources available in Matahara areas, Fantalle Woreda of Oromiya region. Journal of Hydrology: Regional Studies, 3, 444-456.
Crossref -
Dinka, M. O., 2017. Hydrochemical composition and origin of surface water and groundwater in the Matahara area, Ethiopia. Inland Waters, 7, 297-304.
Crossref -
Eaton, F. M., 1950. Significance of carbonates in irrigation water. Soil Science, 69, 127-128.
-
Eliku, T. and Sulaiman, H., 2015. Assessment of physico-chemical and Bacteriological quality of drinking water supply at sources and household in Adama town, Oromia Regional State, Ethiopia. African Journal of Environmental Science and Technology, 9(5), 413-419.
Crossref -
Farooq, G. and Ustad, I., 2015. Investigation of physico-chemical properties of groundwater from Commercial Boreholes in Altamash Colony, Aurangabad. World Journal of Pharmacy and Pharmaceutical Sciences 4, 1625-1630.
-
Fienen, M. N. and Arshad, M., 2016. The International Scale of the Groundwater Issue. In: Jakeman A.J., Barreteau O., Hunt R.J., Rinaudo JD., Ross A. (eds) Integrated Groundwater Management. Springer, Cham, 21-48.
Crossref -
Furi, W., Razack, M., Abiye, T.A., Ayenew, T. and Legesse, D., 2011. Fluoride enrichment mechanism and geospatial distribution in the volcanic aquifers of the Middle Awash basin, Northern Main Ethiopian Rift, Journal of African Earth Sciences, 60: 315-327.
Crossref -
Furi, W., Razack, M., Abiye, T.A., Kebede, S. and Legesse, D., 2012. Hydrochemical characterization of complex volcanic aquifers in a continental rifted zone: the Middle Awash basin, Ethiopia. Hydrogeol J., 20(2), 385.
Crossref -
Gebrehiwot, A. B., Tadesse, N. and Jigar, E., 2011. Application of water quality index to assess suitability of groundwater quality for drinking purposes in Hantebet watershed. Tigray, Northern Ethiopia, ISABB Journal of Food and Agriculture Science, 1, 22-30.
-
Gizaw, B., 1996. The origin of high bicarbonate and fluoride concentrations in waters of the Main Ethiopian Rift Valley, East African Rift system. Journal of African Earth Sciences, 22 (4), 391-402.
Crossref -
Gizaw, B., 2002. Hydrochemical and Environmental Investigation of the Addis Ababa Region, Ethiopia. PhD Thesis, Ludwig- Maximilians-University of Munich, Germany, 157.
-
Haile G., 1999. Hydrogeochemistry of waters in Lake Ziway area. Paper presented at the 25th WEDC Conference on Integrated Development for Water Supply and Sanitati, 286-189.
-
Haji, M., Wang, D., Li, L., Qin, D. and Guo, Y., 2018. Geochemical Evolution of Fluoride and Implication for F− Enrichment in Groundwater: Example from the Bilate River Basin of Southern Main Ethiopian Rift. Water, 10(12), 1799.
Crossref -
Halcrow, 1989. Rift valley lakes integrated natural resources development master plan. Ethiopian Valleys Development Studies Authority. Unpublished report.
-
Hem, J. D., 1985. Study and interpretation of the chemical characteristics of natural water, USGS water supply paper, 2254, 117-120.
-
Jhariya, D. C., Kumar, T., Dewangan, R., Dharm Pal. and Dewangan, P. K., 2017. Assessment of groundwater quality index for drinking purpose in the Durg district, Chhattisgarh using Geographical Information System (GIS) and Multi-Criteria Decision Analysis (MCDA) techniques. J Geol Soc India. 89, 453.
Crossref -
Kaka, E. A., Akiti, T. T., Nartey, V. K., Bam, E. K. P. and Adomako, D., 2011. Hydrochemistry and evaluation of groundwater suitability for irrigation and drinking purposes in the southeastern Volta river basin: manya krobo area, Ghana. Elixir Agriculture, 39, 4793-4807.
-
Kalra, Y. P. and Maynard, D. G., 1991. Methods manual for forest soil and plant analysis. Information report NOR-X-319, Northwest Region, Northern Forestry Centre, Forestry Canada.
-
Kawo, N. S. and Shankar, K., 2018. Groundwater quality assessment using water quality index and GIS technique in Modjo River Basin, central Ethiopia. Journal of African Earth Sciences, 147, 300-311.
Crossref -
Kazi, T. G., Arain, M., Jamali, M. K., Jalbani, N., Afridi, H. I., Sarfraz, R. A., Baig, J. A. and Shah, A. Q., 2009. Assessment of water quality of polluted lake using multivariate statistical techniques: A case study. Ecotoxicology and Environmental Safety, 72, 301-309.
Crossref -
Kebede, S., Travi, Y., Alemayehu, T. and Ayenew, T., 2005. Groundwater recharge, circulation and geochemical evolution in the source region of the Blue Nile River, Ethiopia. Appl. Geochem, 20 (9), 1658-1676.
Crossref -
Kebede, S., Travi, Y., Asrat, A., Alemayehu, T., Ayenew, T. and Tessema, Z., 2008. Groundwater origin and flow along selected transects in Ethiopian rift volcanic aquifers. Hydrogeology Journal.
Crossref -
Keraga, A. S., Kiflie, Z. and Engida, A. N., 2017. Evaluating water quality of Awash River using water quality index. International Journal of Water Resources and Environmental Engineering, 9(11), 243-253.
Crossref -
Kumar, P. S. and Balamurugan, P., 2018. Evaluation of groundwater quality for irrigation purpose in Attur Taluk, Salem, Tamilnadu, India. Water and Energy International, 61(4), 59-64.
-
Lad, S., Mukherjee, S. and Umrikar, B., 2019. Suitability of groundwater for drinking purposes by physico-chemical parameters and water quality index from Haveli region India. Hydrospatial Analysis, 2(2), 83-90.
Crossref -
Lapworth, D. J., Nkhuwa, D. C. W., Okotto-Okotto, J., Pedley, S., Stuart, M. E., Tijani, M. N. and Wright, J., 2017. Urban groundwater quality in sub-Saharan Africa: Current status and implications for water security and public health. Hydrogeol. J., 25, 1093.
Crossref -
Li, P., Qian, H. and Wu, J., 2011. Groundwater suitability for drinking and agricultural usage in Yinchuan Area, China. Int. J. Environ. Sci., 1, 1241-1249.
-
Li, P., Wu, J., Qian, H., Zhang, Y., Yang, N., Jing, L. and Yu, P., 2016. Hydrogeochemical characterization of groundwater in and around a wastewater irrigated forest in the southeastern edge of the Tengger Desert, Northwest China. Exposure and Health 8(3), 331-348.
Crossref -
Mahlknecht, J., Merchán, D., Rosner, M., Meixner, A. and Ledesma-Ruiz, R., 2017. Assessing seawater intrusion in an arid coastal aquifer under high anthropogenic influence using major constituents, Sr and B isotopes in groundwater. Sci Total Environ, 587, 282-295.
Crossref -
Mechal, A., Birk, S., Dietzel, M., Leis, A., Winkler, G., Mogessie, A. and Kebede, S., 2017. Groundwater flow dynamics in the complex aquifer system of Gidabo River Basin (Ethiopian Rift): A multi-proxy approach. Hydrogeology Journal, 25(2), 519-538.
Crossref -
Mitra, B. K., Sasaki, C. and Keijirou, E., 2006. Spatial and temporal variation of ground water quality in sand dune area of Aomori Prefecture in Japan. In: ASAE Annual Meeting American Society of Agricultural and Biological Engineers.
Crossref -
Mohanakavitha, T., Divahar, R., Meenambal, T., Shankar, K., Vijay Singh, R., Tamirat D. H. and Chimdi G., 2019a. Dataset on the assessment of water quality of surface water in Kalingarayan Canal for heavy metal pollution, TamilNadu. Data in Brief, 22, 878-884.
Crossref -
Mohanakavitha, T., Shankar, K., Divahar, R., Meenambal, T. and Saravanan, R., 2019b. Impact of industrial wastewater disposal on surface water bodies in Kalingarayan canal, Erode district, Tamil Nadu, India. Archives of Agriculture and Environmental Science, 4(4), 379-387.
Crossref -
Mohr, P. A., 1967. The Ethiopian rift system. Bulletin. Geophysical Observatory. Addis Ababa, 268.
-
Narsimha, A. and Rajitha, S., 2018. Spatial distribution and seasonal variation in fluoride enrichment in groundwater and its associated human health risk assessment in Telangana State, South India. Human and Ecological Risk Assessment: An International Journal, 24(8), 2119-2132.
Crossref -
Piper, A. M., 1944. A graphic procedure in the chemical interpretation of water analysis. Am. Geophys. Union Trans. 25, 914-923.
Crossref -
Rabeiy, R. E., 2017. Assessment and modeling of groundwater quality using WQI and GIS in Upper Egypt area, Environ. Sci. Pollut. Res.
Crossref -
Raghunath, H. M., 1987. Ground water: Hydrogeology, ground water survey and pumping tests, rural water supply and irrigation systems. New Age International (P) Ltd. Publishers.
-
Ramya Priya, R. and Elango, L., 2018. Evaluation of geogenic and anthropogenic impacts on spatio-temporal variation in quality of surface water and groundwater along Cauvery River, India. Environ Earth Sci. 77, 2.
Crossref -
Rango, T., Bianchini, G., Beccaluva, L. and Tassinari, R., 2010. Geochemistry and water quality assessment of central Main Ethiopian Rift natural waters with emphasis on source and occurrence of fluoride and arsenic. Journal of African Earth Sciences, 57, 479-491.
Crossref -
Rango, T., Vengosh, A., Dwyer, G. and Bianchini, G., 2013. Mobilization of arsenic and other naturally occurring contaminants in groundwater of the Main Ethiopian Rift aquifers. Water Research, 47(15), 5801-5818.
Crossref -
Reimann, C., Bjorvatn, K., Frengstad, B., Melaku, Z., Tekle-Haimanot, R. and Siewers, U., 2003. Drinking water quality in the Ethiopian section of the East African Rift Valley I - data and health aspects. Sci. Total Environ. 311, 65-80.
Crossref -
Richards, L. A., 1954. Diagnosis and improvement of saline and alkali soils. Agri. Handbook 60. U.S. Department of Agriculture, Washington, DC, 160.
-
Sahu, P. and Sikdar, P. K., 2008. Hydrochemical framework of the aquifer in and around East Kolkata wetlands, West Bengal, India. Environ. Geol., 55, 823-835.
Crossref -
Saleh, A., Al-Ruwaih, F., Shehata, M., 1999. Hydrogeochemical processes operating within the main aquifers of Kuwait. J. Arid. Environ., 42, 195-209.
Crossref -
Selvam, S., Manimaran, G., Sivasubramanian, P., Balasubramanian, N. and Seshunarayana, T., 2013. GIS-based evaluation of water quality index of groundwater resources around Tuticorin coastal city, south India. Environ. Earth Sci., 716, 2847-2867.
Crossref -
Shankar, K., Aravindan, S. and Rajendran, S., 2011c. Assessment of Ground Water Quality in Paravanar River Sub-Basin, Cuddalore district, Tamil Nadu, India. Advances in Applied Science Research, 2 (5), 92-103.
-
Shankar, K, Aravindan, S. and Rajendran, S., 2011a. Spatial distribution of groundwater quality in Paravanar river sub basin, Cuddalore district, Tamil Nadu. International Journal of Geomatics and Geosciences, 1(4), 914-931.
-
Shankar, K., Aravindan, S., Rajendran, S., 2010. GIS based groundwater quality mapping in Paravanar River Sub-Basin, Tamil Nadu, India. International Journal of Geomatics and Geosciences, 1(3), 282-296.
-
Shankar, K., Aravindan, S. and Rajendran, S., 2011. Hydrochemical profile for assessing the groundwater quality of Paravanar River Sub-Basin, Cuddalore district, Tamil Nadu, India, Current World Environment, 6(1), 45-52.
Crossref -
Shankar, K., Aravindan, S. and Rajendran, S., 2011b. Hydrogeochemistry of the Paravanar River Sub-Basin, Cuddalore District, Tamilnadu, India. E-Journal of Chemistry, 8(2), 835-845.
Crossref -
Singh, D. F., 1992. Studies on the water quality index of some major rivers of Pune, Maharashtra. Proceedings of the Academy of Environmental Biology, 1(1), 61-66.
-
Singh, P., Khan, I., 2011. Ground water quality assessment of Dhankawadi ward of Pune by using GIS. International Journal of Geomatics and Geosciences, 2, 688-703.
-
Srinivasamoorthy, K., Gopinath, M., Chidambaram, S., Vasanthavigar, M. and Sarma, V. S., 2014. Hydrochemical characterization and quality appraisal of groundwater from Pungar sub basin, Tamilnadu, India. Journal of King Saud University- Science, 26, 37-52.
Crossref -
Subba Rao, N., 1997. Studies on water quality index in hard rock terrain of Guntur district, Andhra Pradesh, India. National Seminar on Hydrology of Precambrian Terrains and hard rock areas, 129-134.
-
Subramani, T., Elango, L. and Damodarasamy, S. R., 2005. Groundwater quality and its suitability for drinking and agricultural use in Chithar River Basin, Tamil Nadu, India. Environ. Geol., 47, 1099-1110.
Crossref -
Tamiru, A., 2004. Assessment of pollution status and groundwater vulnerability mapping of the Addis Ababa water supply aquifers, Ethiopia, Unpublished.
-
Taye, A., 1988. Pollution of the hydrogeologic system of Dire Dawa groundwater basin. Unpublished.
-
Tekle-Haimanot, R., Melaku, Z., Kloos, H., Reimann, C., Fantaye,W., Zerihun, L. and Bjorvatn, K., 2006. The geographic distribution of fluoride in surface and groundwater in Ethiopia with an emphasis on the Rift Valley. Sci. Total Environ. 367, 182-190.
Crossref -
Todd, D. K., 1980. Ground Water Hydrology - John Wiley & Sons, New York, 535.
-
UNDP, 1973. Geology, geochemistry and hydrology of hot springs of the East African Rift system within Ethiopia. UNDP report DD/SF/ON-11, UNDP, New York, 300.
-
Venkateswaran, S., Karuppannan, S. and Shankar, K., 2012. Groundwater quality in Pambar Sub-Basin, Tamil Nadu, India Using GIS. International Journal of Recent Scientific Research, 3(10), 82- 787.
-
Wagh, V. M., Mukate, S. V., Panaskar, D. B., Muley, A. A. and Sahu, U. L., 2019b. Study of groundwater hydrochemistry and drinking suitability through Water Quality Index (WQI) modelling in Kadava river basin, India. SN Applied Sciences, 1(10).
Crossref -
Wagh, V. M., Panaskar, D. B., Jacobs, J. A., Mukate, S. V., Muley, A. A. and Kadam, A. K., 2019a. Influence of hydro-geochemical processes on groundwater quality through geostatistical techniques in Kadava River basin, Western India. Arabian Journal of Geosciences, 12(1).
Crossref -
Wagh, V. M., Panaskar, D. B., Muley, A. A. and Mukate, S. V., 2017. Groundwater suitability evaluation by CCME WQI model for Kadava River Basin, Nashik, Maharashtra, India. Modeling Earth Systems and Environment, 3(2), 557-565.
Crossref -
Wagh, V. M., Panaskar, D. B., Varade, A. M., Mukate, S. V., Gaikwad, S. K., Pawar, R. S., Muley A. A. and Aamalawar, M. L., 2016. Major ion chemistry and quality assessment of the groundwater resources of Nanded tehsil, a part of southeast Deccan Volcanic Province, Maharashtra, India. Environmental Earth Sciences, 75(21), 1418.
Crossref -
Wagh, V., Panaskar, D., Aamalawar, M. L., Lolage, Y. P., Mukate, S., and Narshimma, A., 2018. Hydrochemical characterisation and groundwater suitability for drinking and irrigation uses in semiarid region of Nashik, Maharashtra, India. Hydrospatial Analysis, 2(1), 43-60.
Crossref -
WHO [World Health Organization], 2011. Guidelines for Drinking-Water Quality, 4th ed., Geneva, Switzerland.
-
Wilcox, L.V., 1955. Classification and use of irrigation waters. U.S. Department of Agriculture. Circ, Washington, DC, 969.
-
Wood, R. B. and Talling, J. F., 1988. Chemical and algal relationships in a salinity series of Ethiopian inland waters. Hydrobiologia, 158, 29-67.
Crossref -
Wu, J., Wang, L., Wang, S., Tian, R., Xue, C., Feng, W. and Li, Y., 2017. Spatiotemporal variation of groundwater quality in an arid area experiencing long-term paper wastewater irrigation, northwest China. Environmental Earth Sciences, 76(13), 460.
Crossref -
Yitbarek, A., Razack M., Ayenew, T. Zemedagegnehu, E. and Azagegn. T., 2012. Hydrogeological and hydrochemical framework of Upper Awash River basin, Ethiopia: With special emphasis on inter-basins groundwater transfer between Blue Nile and Awash Rivers, Journal of African Earth Sciences, 65, 46-60.
Crossref