

Hydrospatial Analysis Volume 9 (2025), Issue 1 · pp. 20-42
Review Article Open Access

Techniques and Indices for Groundwater Quality Assessment: A Comprehensive Review
- Department of Geography, K.V.N. Naik Shikshan Prasarak Sanstha’s Arts, Commerce and Science College, Nasik-422002 (India) Maharashtra, India.
* Corresponding author: Rajendra Zolekar, raj4mezolekar@gmail.com
Contents
- Highlights
- Abstract
- 1. Introduction
- 2. Empirical Studies On Groundwater Quality Evaluation
- 3. Methodological Insights Into Gwqi Studies: A Literature Synthesis
- 4. Limitations And Research Gaps Observed In These Studies
- 5. Perspectives On Future Research
- 6. Concluding Remarks
- Conflict of interest
- Acknowledgements
- Abbreviations
- Article information
- References
Highlights
- The review covers 45 studies on groundwater quality for drinking and irrigation.
- The WQI is the main technique for water quality assessment.
- Diagrams and irrigation indices help classify water and assess irrigation suitability.
- The tools like GIS, PCA, and remote sensing support mapping and source detection.
- More work is needed on emerging contaminants and machine-learning methods.
Abstract
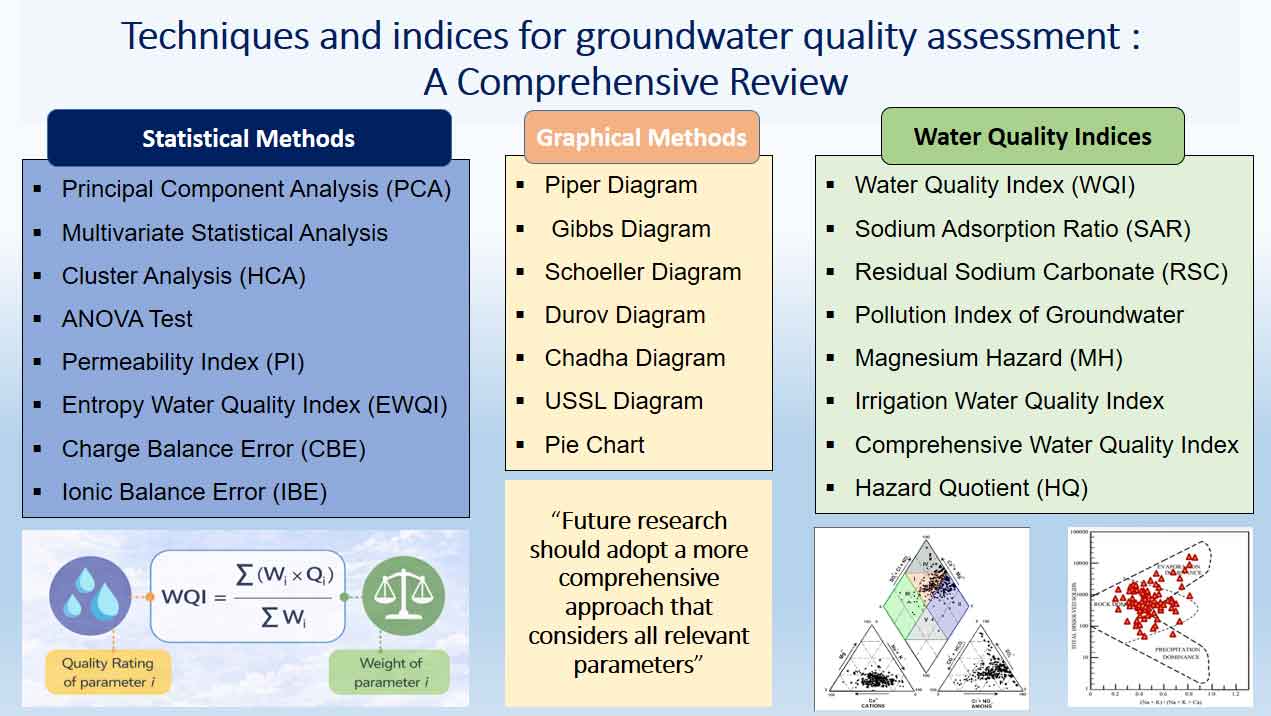
Groundwater quality assessment is crucial for providing safe drinking water and supportive sustainable irrigation, especially in areas facing water scarcity and contamination risks. This review analyses 45 studies that used different techniques to evaluate groundwater quality in varied hydrogeological settings. The main objectives are to: 1) identify common assessment methods 2) examine their applications for drinking and irrigation purposes, and 3) highlight gaps and future directions.
The findings show that most studies focus on physiochemical parameters such as pH, Electrical Conductivity (EC), Total Dissolved Solids (TDS), Total Hardness (TH), and major ions like Ca²⁺, Mg²⁺, Na⁺, K⁺, Cl⁻, HCO₃⁻, SO₄²⁻, NO₃⁻, and F⁻, as they strongly influence the water usability. The water quality index (WQI) is the most widely applied method, used in about 93% of studies, because it combines multiple parameters into a single value for drinking suitability. Hydrochemical classification methods like Piper Diagram (84%) and Gibbs Diagram (62%) are also common for identifying water types and geochemical process. For irrigation, indices such as Sodium Adsorption Ratio (SAR) (60 %), Residual Sodium Carbonate (RSC), Magnesium Hazard (MH) (27%), Permeability Index (PI) (31%), Kelly’s Ratio (KR) (24%), and graphical tools like the Wilcox Diagram (40%) are frequently used. Advance statistical methods, including Principal Components Analysis (PCA) and cluster analysis, along with GIS and Remote Sensing are increasingly applied for spatial mapping and source identification.
The synthesis indicates that while traditional hydrochemical and index-based methods dominate groundwater quality evaluation, significant research gaps persist in the integration of emerging contaminants, real-time monitoring, and machine learning-based prediction models. Future studies should adopt hybrid frameworks combining chemical, biological, and spatial datasets to improve groundwater quality forecasting and resource management. The findings of this review provide a consolidated reference for developing standardized, data-driven approaches for groundwater quality assessment and sustainable utilization.
Keywords Water Quality IndexGroundwater qualityIrrigation SuitabilityHydro Chemical AssessmentPrincipal Components Analysis
1. Introduction
Groundwater, a vital and renewable natural resource, serves as one of the most reliable alternatives to surface water for various domestic, agricultural, and industrial purposes. It resides beneath the earth’s surface, having infiltrated through porous soils and fractures in rocks, accumulating in aquifers over time. Its availability is closely linked with rainfall patterns and the recharge from surface water bodies such as rivers, lakes, and reservoirs. Particularly in regions facing an erratic supply of surface water, groundwater becomes an indispensable source for sustaining life and development. However, the overexploitation of this resource and increasing anthropogenic activities have led to a significant deterioration in its quality, raising serious concerns about its suitability for drinking and irrigation purposes.
The quality of groundwater is influenced by numerous physical, chemical, and biological parameters, along with geogenic and anthropogenic factors such as lithology, slope, land use, land cover, and agricultural practices. Unregulated use of fertilizers and pesticides, improper waste disposal, and the discharge of industrial effluents have exacerbated contamination levels, making groundwater unsafe for consumption in many parts of the world. Notably, the NITI Aayog (2018) report highlighted India’s worsening water crisis, warning that nearly 600 million people face high to extreme water stress, with 70% of the country’s freshwater contaminated. The report also revealed that about two lakh people die annually due to inadequate access to safe drinking water, emphasizing the urgency of evaluating groundwater quality across the nation.
At the global level, groundwater is extensively used in rural and agrarian regions for the cultivation of high-value crops. However, intensified agricultural activities have resulted in the indiscriminate application of agro-chemicals, leading to groundwater contamination and, consequently, deteriorating human health and agricultural sustainability. Groundwater pollution not only affects water quality but also undermines economic development, social well-being, and environmental balance. According to WHO and FAO (2008), approximately 80% of diseases in developing regions stem from the consumption of polluted water.
Given the mounting pressures on this essential resource, scientific assessment of groundwater quality has become imperative. Several studies worldwide have employed various hydrogeochemical techniques, water quality indices, and spatial mapping tools to assess groundwater quality. For drinking water evaluation, the Water Quality Index (WQI) is widely used as it integrates multiple physico-chemical parameters into a single value representing the overall quality of water (Adimalla et al., 2020; Chung et al., 2014). For irrigation assessment, indices such as the Sodium Adsorption Ratio (SAR), Soluble Sodium Percentage (SSP), Residual Sodium Carbonate (RSC), Kelly’s Ratio (KR), and Magnesium Adsorption Ratio (MAR) are commonly used to determine the suitability of water for crop cultivation (Islam et al., 2017; Adimalla et al., 2018; Chung et al., 2014; Houatmia et al., 2016; Singh et al., 2020; Kaur et al., 2017; Ayed et al., 2017; Vasanthavigar et al., 2010; Li et al., 2016).
Advanced statistical methods such as mean, standard deviation, correlation analysis, and Principal Component Analysis (PCA) provide deeper insights into the underlying factors influencing groundwater chemistry (Sako et al., 2016; Subba Rao et al., 2020; Ayed et al., 2017). Additionally, Geographic Information Systems (GIS) and geospatial techniques enable the spatial visualization and interpolation of groundwater quality parameters, helping to delineate contaminated zones and guide resource management strategies (Shaikh and Birajdar 2024). Comparison of analyzed data with standards prescribed by the Bureau of Indian Standards (BIS) and the World Health Organization (WHO) further aids in determining permissible, desirable, and non-permissible limits for safe groundwater usage (BIS, 2003; WHO, 1997).
Despite extensive research conducted across the globe, comprehensive and spatially detailed analysis of groundwater quality remains limited in many high-stress agricultural regions. This review paper aims to fill this gap by analyzing groundwater quality for both drinking and irrigation purposes at the global level and by identifying various methods and techniques used in groundwater studies. The study also emphasizes the importance of sustainable groundwater management, regular monitoring, and community-level awareness to prevent further degradation of this essential resource.
In summary, the present review not only synthesizes current methodologies used in groundwater quality assessment but also contextualizes their relevance in addressing pressing environmental and public health challenges. It offers a comprehensive overview of tools and techniques ranging from traditional water quality indices to modern GIS-based spatial analysis and statistical modelling. The goal is to provide scientific evidence that can guide policymakers, water resource managers, and stakeholders towards sustainable groundwater utilization and better planning for rural and urban water security.
1.1 Groundwater Quality Assessment
Several studies have contributed significantly for understanding the groundwater recharge, hydrogeochemical processes, and quality dynamics across various regions of India, there remains a pressing need for integrated and region-specific groundwater quality assessment. Previous research, such as that of Sajil Kumar et al. (2022), has focused on recharge estimation and water balance, while Rajmohan and Elango (2004, 2005) examined nutrient enrichment and hydrogeochemical evolution under agricultural influence. Similarly, studies by Gowrisankar et al. (2017) and Magesh et al. (2017) demonstrate the effectiveness of managed aquifer recharge and the use of multivariate statistical approaches for understanding groundwater contamination and associated health risks. However, most existing works are localized or process-specific and lack a holistic integration of physical, chemical, and spatial analysis for comprehensive groundwater quality evaluation. In regions dominated by basaltic formations, such as those studied by Pawar (2008) and Wagh et al. (2016), hydrochemical variability is highly influenced by lithology, irrigation practices, and anthropogenic pressures, necessitating a systematic assessment of water quality through advanced indices, graphical, and statistical techniques. Therefore, there is a critical need to undertake a detailed groundwater quality assessment that integrates hydrogeochemical characterization, statistical interpretation, and water quality indices to evaluate suitability for drinking and irrigation purposes and to support sustainable groundwater resource management.
Groundwater is the best alternative to surface water and a renewable resource. It is stored water that has percolated into the earth through rock cracks, soils, and beneath the surface. Groundwater levels vary with rainfall and water bodies like rivers, lakes, dams, etc., which penetrate down through cracks in rocks and soil. Groundwater is a gift from nature, but due to human unethical behavior and its unplanted practice, groundwater levels and quality have been decreasing. Physical, chemical, and biological characteristics, as well as land use and land cover, determine groundwater quality and its suitability for various purposes. Most studies use the Water Quality Index (WQI) for groundwater quality assessment for drinking purposes. SAR, SSP, KR, MAR, RSC, etc., indices are used for irrigation assessment. Statistical techniques like mean, standard deviation, principal component analysis, and correlation analysis have been used for groundwater assessment. For spatial analysis, geospatial techniques have been used for mapping. After laboratory analysis, results have been compared to standard ranges suggested by the Bureau of Indian Standards (BIS) and the World Health Organization (WHO). These standards suggest maximum permissible limits, desirable limits, and non-permissible limits for groundwater use for drinking purposes. For irrigation purposes, indices indicate safe water, moderately safe water, moderately unsafe water, and unsafe water, as per World Health Organization guidelines.
2. Empirical Studies On Groundwater Quality Evaluation
2.1 Graphical Techniques for Hydrogeochemical Interpretation
Graphical techniques play a crucial role in groundwater quality assessment as they visually represent complex hydrochemical data and help in identifying dominant geochemical processes, water types, and suitability for drinking or irrigation (Aher et al., 2022). Among these, the Piper trilinear diagram (Piper, 1994) is the most extensively applied graphical tool for groundwater facies classification. It was effectively used by Baghvand et al. (2010), Vasanthavigar et al. (2010), Narsimha and Sudarshan, 2017, Adimalla et al. (2018, 2019, 2020), and others to interpret the hydrochemical composition and mixing trends in groundwater. For instance, Adimalla et al. (2018) and Kaur et al. (2017) employed Piper plots to distinguish major water types and identify the dominant cation-anion associations controlling groundwater evolution, while Tiwari et al. (2014, 2017) and Zolekar et al. (2020) used it to classify aquifer facies and evaluate regional variations in water chemistry. The major advantage of this diagram is its ability to visually represent geochemical facies and mixing processes, simplifying the interpretation of hydrochemical evolution (Aly et al., 2015; Li et al., 2016). However, its limitations include the lack of spatial representation and reduced interpretability when large datasets overlap, leading researchers to combine it with other graphical and statistical methods (Sako et al., 2016; Ayed et al., 2017).
To complement the Piper plot, other diagrams provide specialized insights. The Schoeller diagram (Schoeller, 1956), applied by Baghvand et al. (2010) and Khan et al. (2018), allows comparison of ionic concentrations on a semi-logarithmic scale, which helps detect relative dominance or depletion of ions but lacks facies classification capability. The Durov diagram utilized by Aly et al. (2015) and Singh et al., (2020), effectively differentiates groundwater evolution processes such as ion exchange and salinity mixing through defined chemical fields. Likewise, the Wilcox diagram (Wilcox, 1955) and the USSL diagram (USSL, 1954) have been extensively employed by Nagarajuna et al. (2014), Prashanth et al. (2012), and Singh et al., (2020) to assess irrigation suitability by plotting sodium and salinity hazards. These diagrams provide rapid classification of irrigation water into quality zones, but they oversimplify the chemistry by ignoring secondary ions and trace elements (Madhav et al., 2018; Chaudhary et al., 2018).
The Gibbs diagram (Gibbs, 1970) is another powerful interpretive tool used by Rajmohan and Elango (2004), Adimalla et al. (2018, 2019, 2020), Nagarajuna et al. (2014), and Zolekar et al. (2020) to identify dominant mechanisms such as rock–water interaction, precipitation, and evaporation controlling groundwater chemistry. Its simplicity in linking TDS and ionic ratios to hydrogeochemical processes is advantageous, yet it fails to account for anthropogenic influences and trace contaminants (Kaur et al., 2017; Tiwari et al., 2017). The Chadha diagram (Chadha, 1999), as used by Adimalla et al. (2018, 2020) and Subba Rao et al. (2020), refines Piper’s approach by providing a clearer quadrant-based classification of hydrochemical facies, enhancing interpretability but still remains limited to major ions.
Supplementary graphical tools such as pie charts (Kaur et al., 2017), dendrograms (Baghvand et al., 2010; Ayed et al., 2017), boxplots (Vasanthavigar et al., 2010; Narsimha and Sudarshan, 2017; Adimalla et al., 2019), and scatter plots (Adimalla et al., 2018; Khan et al., 2018) have also been integrated for comparative and statistical visualization (Figure 1). These methods enhance data clarity by highlighting trends, outliers, and group similarities among water samples.
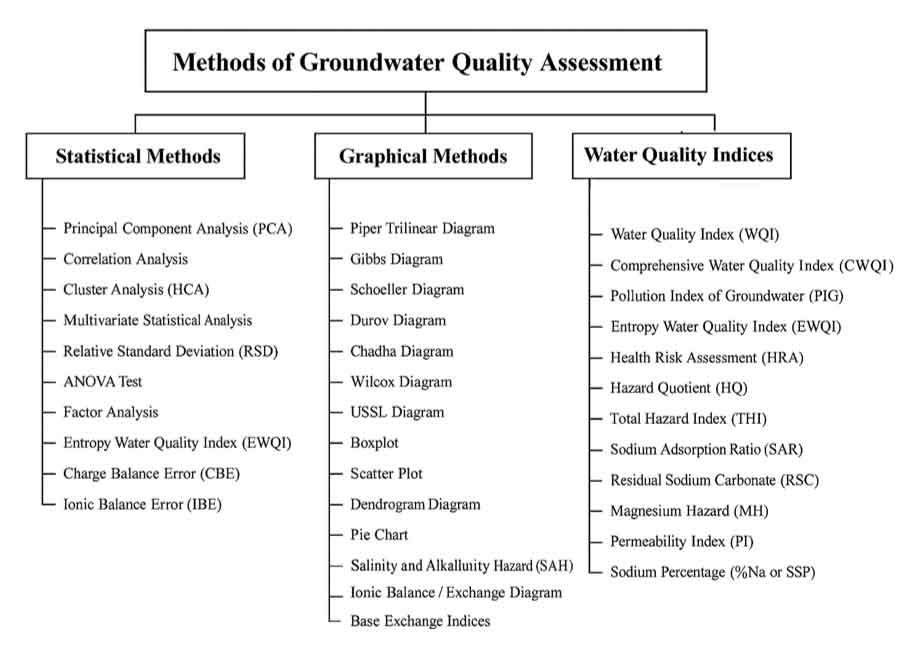
The overall implication from these studies is that graphical techniques not only simplify hydrochemical interpretation but also help in delineating groundwater processes and assessing water suitability across diverse hydrogeological settings (Chatterjee et al., 2009; Aly et al., 2015; Li et al., 2016). Despite their interpretive strength, these tools rely heavily on qualitative assessment and cannot represent temporal or spatial variability without integration with GIS and multivariate analysis (Zhang et al., 2018; Zolekar et al., 2020). Therefore, future research should focus on developing integrated visualization frameworks that combine traditional diagrams with geospatial and multivariate statistical approaches, enabling dynamic, data-rich groundwater assessments (Adimalla et al., 2020; Tiwari et al., 2017). Such integration would improve the precision and predictive capability of hydrogeochemical interpretations and support sustainable groundwater management.
2.2 Statistical and Multivariate Techniques in Groundwater Quality Evaluation
Principal Component Analysis (PCA) is a key multivariate statistical tool used to evaluate groundwater quality by identifying the major hydrogeochemical processes and pollution sources affecting water chemistry (Adimalla et al., 2020; Subba Rao et al., 2018; Ayed et al., 2017). It simplifies large hydrochemical datasets into a few independent components, allowing researchers to distinguish between natural processes such as rock-water interaction, mineral dissolution, and ion exchange, and anthropogenic influences like agricultural runoff, sewage disposal, and industrial activities (Sako et al., 2016). The application of PCA helps reveal interrelationships among variables and classify groundwater according to geochemical controls, while integration with GIS and entropy water quality index techniques enhances spatial interpretation and management of vulnerable zones (Subba Rao et al., 2020). Its main advantage lies in reducing data complexity and improving interpretability without major loss of information (Ayed et al., 2017). However, the reliability of PCA depends on data quality, sampling adequacy, and variable selection, as it identifies statistical correlations but not direct causation (Adimalla et al., 2020). Despite these limitations, PCA provides valuable insights for groundwater monitoring and management. Future studies should integrate PCA with tracer, isotopic, and health risk analyses to strengthen causal understanding and guide sustainable groundwater protection (Sako et al., 2016; Subba Rao et al., 2018). Cluster and Hierarchical Cluster Analysis (HCA), as used by Baghvand et al. (2010), Ayed et al. (2017), and Egbueri (2019), effectively grouped groundwater samples with similar chemical characteristics, delineating spatial and quality-based classes. Although useful for pattern recognition, these methods are sensitive to distance measures and may overlook nonlinear relationships. Singh et al. (2015) analyzed correlations among hydrochemical parameters to identify their interrelationships, using a correlation matrix to reveal key geochemical associations in groundwater. Correlation analysis, applied by Narsimha and Sudarshan, (2017), Tiwari et al. (2014), Chetan and Surindra (2017), and Singh et al. (2012), revealed associations among ions, indicating geochemical processes such as mineral dissolution and ion exchange. Bivariate and scatter plot analyses, applied by Subba Rao et al. (2018), Adimalla et al. (2018), and Khan et al. (2018), visually identified ion relationships and hydrochemical mechanisms, while Relative Standard Deviation (RSD) and basic statistics by Tiwari et al. (2014, 2017) aided in assessing variability and reliability. Overall, these statistical techniques enhance groundwater assessment by uncovering hidden patterns and quantifying process contributions. Their main advantage lies in integrating quantitative precision with hydrochemical interpretation, though they rely on assumptions of normality and linearity. The findings of Adimalla et al. (2020) and Subba Rao et al. (2020) emphasize that combining multivariate statistics with GIS and temporal data analysis can overcome these limitations. Future research should focus on integrating statistical models with geospatial and machine learning approaches to improve groundwater quality prediction and sustainable management.
2.3 Water Quality Index Approaches for Drinking and Domestic Purposes
Water Quality Index (WQI) is one of the most widely used and effective approaches for evaluating groundwater suitability for drinking and domestic purposes across various hydrogeological settings. It provides a single representative value derived from multiple physico-chemical parameters, offering a comprehensive assessment of overall water quality (Aly et al., 2015; Zolekar et al., 2020; Adimalla et al., 2018). The WQI approach has been applied in diverse environments, from urban regions in Korea (Chung et al., 2014) to semi-arid areas of India (Adimalla and Qian, 2019) to classify water quality into categories such as excellent, good, poor, or unsuitable for consumption. This classification allows water authorities to make informed decisions about domestic water use, infrastructure development, and pollution control strategies.
The major advantage of WQI lies in its ability to simplify complex hydrochemical data into a single, easily interpretable value, which is particularly beneficial for non-technical audiences and policymakers. According to Aly et al. (2015), the WQI method offers an efficient and concise framework to evaluate water quality for drinking purposes, allowing effective communication of results to the public. Similarly, Zolekar et al. (2020) highlighted the use of GIS-based WQI in mapping spatial variations of groundwater quality in Nashik District, India, demonstrating its usefulness in regional groundwater management and planning. Houatmia et al. (2016) also emphasized that the combination of WQI with hydrogeochemical techniques provides a clear understanding of groundwater quality and its spatial heterogeneity.
The flexibility of WQI is another key advantage. It can incorporate a wide range of parameters such as pH, EC, TDS, hardness, nitrate, fluoride, and major cations and anions, providing an integrated view of groundwater chemistry. Studies by Adimalla et al. (2018) and Chung et al. (2014) demonstrated that WQI efficiently identifies zones of contamination, helping prioritize areas where remedial measures are urgently required. Furthermore, the index can be combined with spatial, statistical, or health risk assessment models to strengthen groundwater quality monitoring and policy formulation.
Despite its practical benefits, WQI has several limitations. Its reliability largely depends on the selection of parameters and their assigned weightages, which may vary by region or standard, leading to inconsistencies in interpretation (Aly et al., 2015; Adimalla and Qian, 2019). Moreover, the WQI value offers only a numerical representation of quality, lacking diagnostic information about pollutant sources or the specific hydrogeochemical processes responsible for contamination (Zhang et al., 2018; Houatmia et al., 2016). It does not adequately capture the temporal dynamics of groundwater or interactions among multiple contaminants. Adimalla (2019) further noted that WQI alone cannot assess health hazards from fluoride or nitrate without complementary human health risk modeling. Similarly, Zolekar et al. (2020) cautioned that although WQI effectively summarizes quality status, it should be supplemented by detailed geochemical and statistical analyses to fully understand groundwater contamination mechanisms.
The WQI serves as a powerful, integrative, and communicative tool for assessing groundwater quality for drinking and domestic purposes. It is highly useful for quick decision-making and public awareness but should be applied alongside hydrogeochemical and spatial analyses for a comprehensive understanding of groundwater dynamics (Aly et al., 2015; Zolekar et al., 2020; Adimalla et al., 2018; Houatmia et al., 2016; Zhang et al., 2018).
2.4 Water Quality Indices for Irrigation Suitability Assessment
The Water Quality Indices (WQIs) formulated for irrigation purposes are essential for assessing the suitability of groundwater for agricultural use by interpreting its chemical composition and interaction with soil and crops. Indices such as Sodium Adsorption Ratio (SAR), Residual Sodium Carbonate (RSC), Sodium Percentage (% Na), Magnesium Hazard (MH), Permeability Index (PI), and Kelly’s Ratio (KR) have been applied in several hydrogeochemical investigations to evaluate irrigation water quality in varied hydrogeological environments (Adimalla and Venkatayogi, 2018; Singh et al., 2020; Jafari et al., 2018; Madhav et al., 2018). These indices provide a quantitative means to assess ionic concentration effects on soil permeability, salinity development, and crop growth potential. The major advantage of using irrigation-based WQIs is their ability to convert complex hydrochemical datasets into interpretable classifications that are practical for agricultural and environmental management. Parameters such as SAR, MH, and PI are frequently used to identify sodicity hazards, magnesium influence, and permeability characteristics of irrigation water (Adimalla and Venkatayogi, 2018; Khan and Jhariya, 2018). However, the limitations of irrigation-related WQIs are evident in their dependence on specific hydrogeological conditions and standardized assumptions. Many indices are sensitive to local variations in soil type, aquifer lithology, and climatic factors, which may influence their reliability across regions (Kaur et al., 2017; Liu et al., 2016). Furthermore, these indices tend to generalize water quality without accounting for the cumulative impact of anthropogenic activities such as fertilizer use, wastewater infiltration, and industrial effluents (Adimalla and Venkatayogi, 2018; Liu et al., 2016). Since most indices are designed for typical geochemical conditions, they may not accurately reflect site-specific processes like ion exchange or mineral dissolution, which strongly affect groundwater chemistry.
From a critical perspective, relying on a single irrigation index may lead to oversimplified evaluations of complex groundwater systems. As emphasized by Adimalla and Venkatayogi (2018), the combined use of indices such as SAR, %Na, RSC, MH, and KR yields a more comprehensive and balanced interpretation of groundwater quality. Jafari et al. (2018) further reinforced that the integration of multiple indices enhances the reliability of assessments by capturing the multidimensional nature of groundwater chemistry under semi-arid agricultural conditions. Irrigation WQIs such as SAR, RSC, %Na, MH, PI, and KR remain indispensable tools for evaluating groundwater suitability for agriculture. Their strength lies in simplicity and interpretability, but their limitations necessitate critical application and integration for accurate and sustainable irrigation water management (Singh et al., 2020; Khan and Jhariya, 2018; Jafari et al., 2018; Kaur et al., 2017).
2.5 Laboratory Analysis
In the 53 studies reviewed, groundwater samples were analyzed for parameters such as pH, total hardness (TH), total dissolved solids (TDS), magnesium (Mg²⁺), sodium (Na⁺), calcium (Ca²⁺), chloride (Cl⁻), bicarbonate (HCO₃⁻), nitrate (NO₃⁻), sulfate (SO₄²⁻), fluoride (F⁻), and potassium (K⁺) (Table 1). In the published water quality research, standards recommended by the American Public Health Association (APHA, 1995) were used to identify hydrochemical parameters. It was also observed in these studies that a pH meter was used to measure pH. The acid titration method was employed to determine the concentration of bicarbonate (HCO₃⁻) in groundwater. The concentration of dissolved silica was determined using a UV-VIS spectrophotometer based on the molybdosilicate method. Anion concentrations specifically F⁻, Cl⁻, SO₄²⁻, and NO₃⁻-were analyzed using an ion chromatograph. Cation concentrations, including Ca²⁺, Mg²⁺, Na⁺, and K⁺, were measured using a flame atomic absorption spectrophotometer (Table 1).
Table 1. Instrumental, titrimetric and calculation methods
|
Parameters |
Analytical Method |
Unit |
References |
|
pH |
Portable meter |
-- |
|
|
Total dissolved solids (TDS) |
Calculation |
mg/L |
|
|
Fluoride (F-) |
Ion chromatograph |
mg/L |
|
|
Chloride (Cl-) |
Ion chromatograph |
mg/L |
|
|
Nitrate (NO3-) |
Ion chromatograph |
mg/L |
|
|
Sulphate (SO42-) |
Ion chromatograph |
mg/L |
|
|
Bicarbonate (HCO3-) |
Aid titration technique |
mg/L |
|
|
Calcium (Ca2+) |
Flame atomic absorption spectrophotometer |
mg/L |
|
|
Magnesium (Mg2+) |
Flame atomic absorption spectrophotometer |
mg/L |
|
|
Sodium (Na+) |
Flame atomic absorption spectrophotometer |
mg/L |
|
|
Potassium (K+) |
Flame atomic absorption spectrophotometer |
mg/L |
|
|
Total hardness (TH) |
EDTA titrimetric |
mg/L |
3. Methodological Insights Into Gwqi Studies: A Literature Synthesis
A comprehensive review of 45 research papers reveals the frequency and purpose of various groundwater quality assessment techniques used by researchers (Table 2). Among these techniques, the Water Quality Index (WQI) was the most widely applied, as 42 research papers (93%) used this method to aggregate many complex water quality parameters into a single understandable index. This approach simplifies the interpretation and communication of the overall quality of water bodies, particularly for drinking water purposes.
Table 2. Comparative Analysis of Groundwater Quality Evaluation Methods
|
Name of the Author |
Parameters/Criterions |
Data |
Sampling |
Analytical methods in laboratory |
Methodology /Techniques |
Objectives |
Purposes |
Study area |
|
Chatterjee et al., 2009 |
pH, EC, TDS, TH, Na⁺, Ca²⁺, Mg²⁺, K⁺, Cl⁻, HCO₃⁻, SO₄²⁻, CO₃²⁻, NO₃⁻, and F⁻ |
Primary Data Field Survey |
79 Samples-out of them 26 surface water, 41 subsurface water and 12 mine waters |
-- |
GIS, WQI |
To make a ground water quality assessment using GIS |
Drinking and Irrigation |
Dhanbad district, Jharkhand, India, |
|
Baghvand et al., 2010 |
pH, EC, TDS, Major Cations (Na⁺, K⁺, Ca²⁺, Mg²⁺) and Major Anions (CO₃²⁻, HCO₃⁻, SO₄²⁻, Cl⁻) |
Primary Data Field Survey |
20 Boreholes considered for sampling |
Digital pH and EC meter, Flame Photometry, Flame atomic absorption Spectrometer, HACH DR/2000 |
Piper trilinear diagram, Schoeller diagram, Wilcox diagram, Dendrogram diagram, Cluster analysis |
To analyse the hadrochemical characterizations of groundwater for the suitability analysis |
Groundwater suitability analysis |
Iran Central Desert |
|
Vasanthavigar et. al., 2010 |
Na⁺, Mg²⁺, Ca²⁺, K⁺, HCO₃⁻, Cl⁻, SO₄²⁻, PO₄³⁻, H₄SiO₄, F⁻, pH, EC, and TDS |
Primary Data Field Survey |
148 (bore holes) groundwater samples |
Digital spectrophotometer, Flame photometer, Titrimetric method |
SAR, RSC, SSP, WQI, Piper trilinear diagram, Box plots |
To evaluate water quality index for groundwater quality assessment |
Health risks assessment |
Thirumanimuttar sub-basin, Tamilnadu, India |
|
Prashant et al., 2012 |
pH, EC, TDS, TH, HCO₃⁻, Ca²⁺, Mg²⁺, Na⁺, K⁺, Cl⁻, SO₄²⁻, NO₃⁻, F⁻ |
Primary Data Field Survey |
22 shallow open dug wells samples |
Piper trilinear diagram, Wilcox diagram, PI, SAR, MH |
To evaluate the spatial extent of groundwater quality and its suitability for drinking and agricultural uses in the costal stretch |
Drinking and Agriculture |
Alappuzha District, Kerala, India |
|
|
Singh et al., 2012 |
pH, EC, TDS, TH, Na⁺, Ca²⁺, Mg²⁺, K⁺, Cl⁻, HCO₃⁻, SO₄²⁻, CO₃²⁻, NO₃⁻, and F⁻ |
Primary Data Field Survey |
15 groundwater samples were collected in August 2010 from shallow and deep bore hand-pumps |
EDTA titrimetric method, UV–Visible spectrophotometer model, Sampling and analytical procedure |
Correlation analysis, Base-exchange indices, Meteoric genesis indices, Piper trilinear diagram, Salinity index, Chlorinity index, Sodicity index |
To evaluate the groundwater quality for drinking, domestic and irrigation purposes |
Drinking Domestic and Irrigation |
Lutfullapur Nawada, Loni, District Ghaziabad, Uttar Pradesh, India |
|
Nagarjuna et al., 2014 |
pH, EC, TH, TDS, TA, NCH, SAR, SP, RSC |
Primary Data Field Survey |
40 Samples |
pH/EC/TDS Meter Indices of exchange |
SAR, RSC, Indices of exchange magnesium ratio, KR, Saturation index, Gibbs diagram Piper trilinear diagram, Wilcox diagram, Permeability Index (PI) |
Assessment of ground water quality for irrigation |
Irrigation |
Bandalamottu lead mining area Guntur District, Andhra Pradesh South India |
|
Chung et al., 2014 |
Na⁺ > Ca²⁺ > Mg²⁺ > K⁺; Cl⁻ > HCO₃⁻ > SO₄²⁻ > NO₃⁻ > F⁻; and Ca(HCO₃)₂, CaCl₂, NaCl |
Primary Data Field Survey |
40 - wells Samples |
Ion chromatography (IC, Water 431), Standard analytical methods, WATEQ4F geochemical model |
WQI, Wilcox diagram, Gibbs diagram, Piper trilinear diagram, PI, SAR, RSC, Index of Base Exchange, Chloro-alkaline indices (CAI-I and CAI-II), Saturation index (WATEQ4F) |
To assess the present quality of groundwater and determine the suitability of groundwater use for various purposes |
Drinking and Domestic |
Busan City, Korea |
|
Tiwari and Singh, 2014 |
pH, EC, TDS, TH, Na⁺, Ca²⁺, Mg²⁺, K⁺, Cl⁻, HCO₃⁻, SO₄²⁻, CO₃²⁻, NO₃⁻, and F⁻ |
Primary Data Field Survey |
55 groundwater samples |
UV-VIS spectrophotometer |
Piper trilinear diagram, Relative standard deviation, SI, Mineral Equilibrium, SAR, KR, Wilcox diagram, USSL diagram |
To identify the factors controlling groundwater composition and assess its suitability for domestic and irrigation uses |
Domestic and irrigation |
Pratapgarh District, Uttar Pradesh |
|
Aly et al., 2015 |
EC, pH, Ca²⁺, Mg²⁺, Na⁺, K⁺, Cl⁻, SO₄²⁻, NO₃⁻ |
Primary Data Field Survey |
28 groundwater samples collected from tube wells |
Phenoldisulfonic acid method, Turbidity method |
WQI Piper trilinear diagram, Gibbs diagram, Schoeller diagram, Durov’s diagram, SAR, KR, IBE |
To assess groundwater quality for drinking and evaluate its hydro chemical characteristics |
Drinking |
Hafar Albatin, Saudi Arebia |
|
Batabyal and Chakraborty, 2015 |
pH, TDS, TH, HCO₃⁻, Cl⁻, SO₄²⁻, NO₃⁻, F⁻, Ca²⁺, Mg²⁺, Fe²⁺/Fe³⁺, Mn²⁺, Zn²⁺ |
Primary Data Field Survey |
28 tube wells |
- |
WQI, Correlation coefficient matrix, triangulation with linear interpolation method |
To assess groundwater quality for drinking |
Drinking purposes |
Kanksa-Panagarh area, Bardhaman District of West Bengal. |
|
Sako et al., 2016 |
pH, EC, COD, TDS, TH, HCO₃⁻, Ca²⁺, Mg²⁺, Na⁺, K⁺, Cl⁻, SO₄²⁻, NO₃⁻, F⁻, NO₂⁻, NH₄⁺, PO₄³⁻, Al, Asᵀ, Cu, Mnᵀ, Niᵀ, Cr, Pb, Zn, Na⁺/Cl⁻, Na⁺/Ca²⁺, TCᶜ |
Primary Data Field Survey |
6 dug wells and 7 boarewells samples |
ICP-OES-Inductively, coupled plasma- optical emission spectroscopy, ICP-MS-Inductively, coupled-mass spectroscopy, Colometric method (APHA5220D) |
Multivariate Statistic techniques, Piper trilinear diagram, PCA, Boxplots diagram |
To assess the groundwater suitability for human consumption |
Drinking |
Bombore gold mineralized zone, Central Burkina Faso |
|
Houatmia et al., 2016 |
pH, CaCO₃, Ca²⁺, Mg²⁺, K⁺, Na⁺, HCO₃⁻, Cl⁻, SO₄²⁻, NO₃⁻ |
Primary Data Field Survey |
39 water sample collected from Wells |
Colorimetric method, Nephelometric methods, Volumetric method |
WQI, KR, PI, SAR, RSC, MH, Wilcox diagram, Piper trilinear diagram, Saturation index (PHREECQ) |
To assess the groundwater geochemistry and evaluate its suitability for drinking and irrigation purposes |
Drinking and Irrigation |
North- eastern, Tunisia |
|
Li et al., 2016 |
pH, EC, TDS, TH, Na⁺, Ca²⁺, Mg²⁺, K⁺, Cl⁻, HCO₃⁻, SO₄²⁻, CO₃²⁻, NO₃⁻, and F⁻ |
Primary Data Field Survey |
31 groundwater samples -wells and hand pumping |
Flame atomic absorption spectrophotometry, EDTA titration, Ion chromatography Traditional titrimetric method, spectrophotometry |
HRA, Gibbs diagram, SAR, RSC, SSP, USSL diagram, Wilcox diagram, Piper diagram |
To assess overall groundwater quality for irrigation and drinking water intake and dermal contact for different age group |
Drinking and Irrigation |
Northwest China |
|
Islam et al., 2017 |
Temperature, pH, EC, TDS, Na⁺, K⁺, Ca²⁺, Mg²⁺, Cl⁻, SO₄²⁻, NO₃⁻, HCO₃⁻, Br⁻, and trace elements such as As, Pb, Li, Rb, Ba, Be, Co, Mn, Ti, Cd, and Se. |
Field Survey Primary data |
18 groundwater samples collected from tube wells |
pH meter, Portable meter, Portable EC meter, TDS meter, Gallenkamp Flame Analyzer |
Soluble sodium percentage (SSP), Sodium absorption ratio-(SAR), Magnesium absorption ratio (MAR), Residual sodium carbonate (RSC), Kelley’s ratio (KR), Wilcox diagram, USSL diagram |
To assess the hydro chemical characteristics and water quality, and evaluate their impact on human health |
Health risk assessment |
Patuakhali District Southern Coastal Region of Bangladesh |
|
Narsimha and Sudarshan, 2017 |
pH, EC, TDS, TH, CO₃²⁻, NO₃⁻, F⁻, Ca²⁺, Mg²⁺, Na⁺, K⁺ |
Primary Data Field Survey |
104 groundwater samples |
Flame photometry, Titrimetrically using standard EDTA Method, UV-Visible Spectro photometer, Fuoride ion-selec- tive electrode |
Piper trilinear diagram, Correlation analysis, Gibbs diagram |
To understand fluoride distribution in groundwater, its relationship with major ions, and identify high-fluoride zones |
Human health risk assessment |
Siddipet, Telangana State, India |
|
Adimalla and Venkatayogi, 2017 |
pH, EC, TH, TDS, Ca²⁺, Mg²⁺, Na⁺, K⁺, Cl⁻, SO₄²⁻, NO₃⁻ |
Primary Data Field Survey |
194 groundwater Samples |
pH/EC/TDS Meter, Titration method, Flame Photometer, Fluoride Ion-selective electrode, UV- Visible spectrophotometer |
Gibbs diagram, Piper trilinear diagram |
Mechanism of Fluoride enrichment in groundwater of hard rock aquifers |
Fluoride concentrations |
Medak, Telangana State, South India |
|
Kaur et al., 2017 |
Na⁺, Ca²⁺, Mg²⁺, K⁺, HCO₃⁻, SO₄²⁻, Cl⁻, pH, EC, TDS, Temperature |
Primary Data Field Survey |
24 (well) groundwater samples |
Water quality analyzer (ELICO), Standard methods Acid titration method, Argentometric method, SPADNS calorimetric method, Turbidimetric method, Stannous chloride method, UV–visible spectrophotometer Flame Atomic Absorption Spectrophotometer |
ELICO- Water quality analyser (PE 138.), American Public Health Association, Pie -Diagram, Piper trilinear diagram, Gibb’s diagram, SAR, Sodium percentage (SP), Magnesium ratio (MR), Corrosivity ratio (CR), Wilcox diagram, SI |
To assess the groundwater quality for drinking and irrigation purposes |
Drinking and Irrigation |
Malwa region southwestern part of Punjab, India |
|
Ayed et al., 2017 |
Na⁺, Ca²⁺, Mg²⁺, K⁺, HCO₃⁻, SO₄²⁻, Cl⁻, pH, EC, TDS, Temperature |
Primary Data Field Survey |
47(wells) groundwater samples |
Calibrated pH meters, Conductivity meter, Titration method, Ionic equilibrium, Diagram” and “Excel 2016” Shapiro–Wilk test |
Multivariate statistical analysis, Hierarchical cluster analysis (HCA), PCA, Piper trilinear diagram, Dendrogram diagram, PI, SI, SAR, SP, Magnesium Percent |
To assess the water quality and to determine the main hydro-chemical process which affect groundwater |
Planning and Management |
The Maitime Djeffara shallow aquifer (Southeastern Tunisia) |
|
Khan and Jhariya, 2017 |
pH, EC, TDS, TH, Na⁺, Ca²⁺, Mg²⁺, K⁺, Cl⁻, HCO₃⁻, SO₄²⁻, CO₃²⁻, NO₃⁻, and F⁻ |
Primary Data Field Survey |
34 groundwater samples |
-- |
Standard methods, GIS, WQI |
To assess the groundwater quality for drinking purpose |
Drinking |
Raipur City, Chhattisgarh |
|
Tiwari et al., 2017a |
pH, EC, TDS, TH, Na⁺, Ca²⁺, Mg²⁺, K⁺, Cl⁻, HCO₃⁻, SO₄²⁻, CO₃²⁻, NO₃⁻, and F⁻ |
Primary Data Field Survey |
55 groundwater samples -shallow (dug wells) and deep aquifers (tube well/hand pumps) |
Portable conductivity, pH meter, Acid titration method, UV–VIS spectrophotometer, Ion chromatograph, Flame atomic absorption spectrophotometer |
WQI, GIS Piper trilinear diagram, Gibbs diagram, Statistical analysis, Inverse distance weighted (IDW) |
To assess the groundwater quality for its suitability to drinking |
Drinking |
Pratapgarh district, in India |
|
Tiwari et al., 2017b |
pH, EC, TDS, F⁻, Cl⁻, HCO₃⁻, SO₄²⁻, NO₃⁻, Ca²⁺, Mg²⁺, Na⁺, K⁺, TH, SAR, RSC, PI, MH, KI, and Silica |
Primary Data Field Survey |
25 Surface sample collected from river, ponds and canals |
Portable Conductivity, pH Meter, Acid titration method, Molybdosilicate methods, Ion chromatograph (Dionex DX-120), Flame atomic absorption spectrophotometer |
WQI, Piper trilinear diagram, Gibbs diagram, Correlation coefficient matrix, Interpolation techniques |
To evaluate the water quality of surface water |
Utilization and planning |
Pratapgarh district, Uttar Pradesh |
|
Zhang et al., 2018 |
pH, TH, TDS, Na⁺, K⁺, Ca²⁺, Mg²⁺, CO₃²⁻, HCO₃⁻, Cl⁻, SO₄²⁻, NO₃–N, NO₂–N, NH₄–N |
Primary data Field Survey |
47 groundwater samples collected from pumping wells |
Portable pH mete, EDTA titrimetric method, Routine titrimetric methods, Fame atomic absorption spectrometry |
CBE, Comprehensive Water Quality Index Method (CWQI), Piper trilinear diagram, Gibbs diagram |
To evaluate groundwater quality for human health risks assessment |
Health risks assessment |
Jinghui Canal, Irrigation area of the loess region, Northwest China |
|
Adimalla, 2018 |
TDS, TH, Ca²⁺, Na⁺, Mg²⁺, Cl⁻, K⁺, NO₃⁻, SO₄²⁻, and F⁻ |
Primary Data Field Survey |
194 Groundwater samples |
Interpolation technique, Inverse distance-weighted |
SAR, RSC, Magnesium hazard (MH), PI, Piper trilinear diagram, Gibbs diagram, USSL diagram |
To assess groundwater quality, health risks, monitoring efficiency, and vulnerability for informed policy-making |
Health risks assessment |
Semi-Arid Region of South India |
|
Adimalla et al., 2018 |
pH, TDS, TH, HCO₃⁻, Ca²⁺, Mg²⁺, Na⁺, K⁺, Cl⁻, SO₄²⁻, NO₃⁻, F⁻ |
Primary Data Field Survey |
105 Groundwater samples |
pH/EC/TDS Meter |
WQI Piper trilinear diagram, Gibbs diagram, SAR, RSC, MH, KR, Wilcox diagram, USSL diagram, Chloro-alkaline indices (CAI-I and CAI-II) |
To evaluation of groundwater quality for Drinking and irrigation purpose |
Drinking and Irrigation |
Central Part of Telangana |
|
Adimalla et al., 2018b |
pH, EC, TDS, TH, HCO₃⁻, Ca²⁺, Mg²⁺, Na⁺, K⁺, Cl⁻, SO₄²⁻, NO₃⁻, F⁻, (TZ⁺), and (TZ⁻) |
Primary Data Field Survey |
35 groundwater samples |
pH/EC/TDS meter, EDTA titrimetric Method, Flame photometric, UV visible spectrophotometer, Standard methods |
GIS (Kriging method), Ionic balance error, Gibbs diagram, Piper trilinear diagram, Scatters plots |
To understand the correlation between fluoride and other chemical indices, hydro geochemistry of fluoride occurrence and its distribution |
Fluoride enrichments |
Peddavagu in Central Telangana (PCT) |
|
Khan and Jhariya, 2018 |
pH, EC, TDS, TH, HCO₃⁻, Ca²⁺, Mg²⁺, Na⁺, K⁺, Cl⁻, SO₄²⁻, NO₃⁻, F⁻ |
Primary Data Field Survey |
100 groundwater samples |
Titration, Flame photometer, UV-VIS spectroscopy, Atomic absorption spectroscopy (AAS) |
Gibbs diagram, Piper trilinear diagram, Scatter diagram, Schoeller diagram, SAR, PI, USSL diagram |
To assess groundwater quality for drinking and irrigation Purpose |
Drinking and Irrigation |
Raipur City, Chhattisgarh |
|
Adimalla et al., 2018b |
pH, EC, TDS, TH, Na⁺, Ca²⁺, Mg²⁺, K⁺, Cl⁻, HCO₃⁻, SO₄²⁻, CO₃²⁻, NO₃⁻, and F⁻ |
Primary Data Field Survey |
34 groundwater samples-borewells |
pH meter, Ethylenediaminetetraacetic acid (EDTA), Flame photometric, Titration method, ISE meter |
HHRA, Hazard quotient (HQ), Total hazard index, IBE |
Evaluation of groundwater contamination for fluoride and nitrate |
Contamination- fluoride and nitrate |
semi-arid region of Nirmal Province, South India |
|
Adimalla and Venkatayogi, 2018 |
Na⁺, Ca²⁺, K⁺, Mg²⁺, Cl⁻, HCO₃⁻, SO₄²⁻, CO₃²⁻, NO₃⁻, F⁻ |
Primary Data Field Survey |
34 groundwater samples (bore well/hand pumps) |
EDTA titration, Flame Photometer, Fluoride ion-selective electrode |
Standard methods, Piper trilinear diagram, Gibbs diagram, Box plot |
To assess fluoride concentration in groundwater for study area |
Fluoride concentration |
Basara, Adilabad District, Telangana State, India |
|
Subba Rao et al., 2018 |
pH, EC, TDS, TH, Na⁺, Ca²⁺, Mg²⁺, K⁺, Cl⁻, HCO₃⁻, SO₄²⁻, CO₃²⁻, NO₃⁻, and F⁻ |
Primary Data Field Survey |
30 (dug wells) groundwater samples |
Portable meters, EDTA titration Method, Flame photometer, Volumetric method, UV-spectrophotometer, Titration method |
Pollution index of groundwater, Bivariate and Piper trilinear diagram, ANOVA test, IBE |
To evaluate the quality of groundwater for drinking water quality limits, and unhide the sources responsible for variation of quality of groundwater |
Drinking |
Rural part of Telangana State, India |
|
Madhav et al., 2018 |
pH, EC, TDS, TH, Na⁺, Ca²⁺, Mg²⁺, K⁺, Cl⁻, HCO₃⁻, SO₄²⁻, CO₃²⁻, NO₃⁻, and F⁻ |
Primary Data Field Survey |
20 groundwater samples |
pH and conductivity meters, |
WQI, Piper trilinear diagram, Gibbs diagram, Wilcox diagram, PI, KR, USSL diagram |
Geochemical assessment of groundwater suitability for drinking and irrigation purpose |
Drinking and Irrigation |
Rural areas of Sant Ravidas Nagar (Bhadohi), Uttar Pradesh |
|
Jafari et al., 2018 |
pH, EC, TDS, TH, Na⁺, Ca²⁺, Mg²⁺, K⁺, Cl⁻, HCO₃⁻, SO₄²⁻, CO₃²⁻, NO₃⁻, and F⁻ |
Primary Data Field Survey |
30 groundwater samples |
Ion meter model, UV–Vis spectrophotometer, flame photometer model, EDTA titrimetric method |
RSC, PI, KR, MH, SP, SAR, SSP |
Groundwater quality assessment for drinking and agriculture purposes |
Drinking and agriculture |
Abhar city, Iran |
|
Chaudhary and Satheeshkumar, 2018 |
pH, EC, TDS, TH, Na⁺, Ca²⁺, Mg²⁺, K⁺, Cl⁻, HCO₃⁻, SO₄²⁻, CO₃²⁻, NO₃⁻, and F⁻ |
Primary Data Field Survey |
300 groundwater samples collected from hand pumps |
Spectrophotometric techniques |
RSC, PI, KR, Piper trilinear diagram, Wilcox diagram, USSL diagram, Gibb’s diagram, MH, SP, SAR, SSP, Potential salinity |
To assess the groundwater quality for drinking and agriculture purposes |
Drinking and agriculture |
Arid areas of Rajasthan, India |
|
Adimalla et al., 2019 |
EC, pH, Ca²⁺, Mg²⁺, Na⁺, K⁺, Cl⁻, SO₄²⁻, NO₃⁻ |
Primary Data Field Survey |
107 Groundwater samples |
pH/EC/TDS, Meter, Flame photometer meter, UV-visible spectrophotometer, Orion 4-star meter, pH/ISE meter |
WQI, Piper trilinear diagram, Gibbs diagram, Boxplots diagram |
To evaluate groundwater quality and assess non-carcinogenic risks from fluoride-rich water consumption |
Health risks assessment and fluoride consumption |
Shasler Vagu (SV) Watershed of Nalgonda, India |
|
Adimalla and Qian, 2019 |
pH, EC, COD, TDS, TH, HCO₃⁻, Ca²⁺, Mg²⁺, Na⁺, K⁺, Cl⁻, SO₄²⁻, NO₃⁻, F⁻, NO₂⁻, NH₄⁺ |
Primary Data Field Survey |
61 groundwater Samples collected from hand pumps and bore wells |
Portable pH/EC/TDS meter, Titration method, UV–visible Spectrophotometer, Flame photometer |
IBE, WQI, HRA |
To assess the non-carcinogenic health risks associated with groundwater quality for drinking purposes |
Health risks assessment |
Nanganur region, Telangana State, South India |
|
Adimalla, 2019 |
pH, TDS, SO₄²⁻, Cl⁻, NO₃⁻, F⁻, Ca²⁺, Mg²⁺, Na⁺, K⁺, EC, TH, HCO₃⁻, SAR |
Primary Data Field Survey |
194 groundwater samples were collected: 160 granitic, 24 basaltic, and 10 lateritic aquifers |
pH/EC/TDS meter, EDTA., AgNO3 titration, Fame photometer, |
WQI, KR, SAR, RSC |
To assess groundwater quality for drinking and agricultural purposes and evaluate the health risks assessment |
Drinking and Agriculture |
Semiarid region of south India |
|
Egbueri, 2019 |
Na⁺, Ca²⁺, K⁺, Mg²⁺, SO₄²⁻, Cl⁻, NO₃⁻, HCO₃⁻, and Ca²⁺ |
Primary Data Field Survey |
20 groundwater samples -out of them 3 hand-dug wells and 17 from boreholes |
pH meter, Standard testing methods, Titration method, Flame photometer, Atomic Absorption Spectrophotometer (AAS) |
PIG, Ecological risk index, Hierarchical cluster analysis, Piper trilinear diagram, Pollution index |
To examine the drinking water quality of the groundwater |
Drinking |
Ojoto suburban in southeast Nigeria |
|
Adimalla and Li, 2019 |
pH, EC, TDS, TH, Na⁺, Ca²⁺, Mg²⁺, K⁺, Cl⁻, HCO₃⁻, SO₄²⁻, CO₃²⁻, NO₃⁻, and F⁻ |
Primary Data Field Survey |
105 groundwater |
UV-visible spectrophotometer, pH/EC/TDS meter’ Ethylenediaminetetraacetic acid (EDTA), Flame photometric, |
Piper trilinear diagram, Gibbs diagram, Total Hazard Index, HQ, IBE, CAI |
To delineate occurrence of fluoride and nitrate contamination and understand the hydro chemical processes responsible for their enrichment |
contamination-fluoride and nitrate |
The rock-dominant semi-arid region, Telangana State, India |
|
Adimalla, 2019 |
pH, EC, TDS, TH, Na⁺, Ca²⁺, Mg²⁺, K⁺, Cl⁻, HCO₃⁻, SO₄²⁻, CO₃²⁻, NO₃⁻, and F⁻ |
Primary Data Field Survey |
194 (bore/hand pumps) groundwater samples |
Digital pH/EC/TDS meter, UV-visible spectrophotometer, EDTA titrimetric method, Flame photometer, Ion-selective electrode method |
GIS, WQI, Pollution index, Piper trilinear diagram, Gibbs diagram, IBE |
To assess the overall suitability of groundwater for drinking; and to evaluate groundwater quality comprehensively |
Drinking |
the hard rock terrain of South India |
|
Adimalla et al., 2020 |
pH, EC, TDS, Ca²⁺, Mg²⁺, Na⁺, K⁺, Cl⁻, HCO₃⁻, NO₃⁻, SO₄²⁻, F⁻ |
Primary data (Field survey) |
43 groundwater samples |
Pollution Index (PIG), Principal component analysis (PCA) |
The pollution index of groundwater and evaluation of potential human health risk |
Human health risk |
Hard rock terrain of south India |
|
|
Adimalla et al., 2020 |
pH, EC, TDS, Ca²⁺, Mg²⁺, Na⁺, K⁺, Cl⁻, HCO₃⁻, NO₃⁻, SO₄²⁻, F⁻ |
Field Survey Primary Data |
43 samples |
Titrimetric methods, Flame photometer, UV - Visible spectrophotometer, |
PIG, Charge balance errors (CBE), Gibbs diagram, Chadha diagram, Ion – selective electrode method (ISE), PCA |
To assess groundwater quality for fluoride and nitrate, and evaluate their associated health risks for residents |
Health risk assessment |
The Northern part of the Nalgonda district, south of Telangana State, India |
|
Subba Rao et al., 2020 |
pH, TDS, Ca²⁺, Mg²⁺, Na⁺, K⁺, HCO₃⁻, Cl⁻, SO₄²⁻, NO₃⁻, F⁻ |
Primary data Field survey |
30 groundwater sample |
Portable meters, EDTA titration method, Flame photometer, HCl volumetric method, AgNO3 titration method, Colorimetric method |
Ionic Balance Error (IBE), Entropy Water Quality Index (EWQI), PCA, Chadha’s diagram |
Assessment of groundwater quality for drinking and domestic purposes |
Drinking and domestic purposes |
Wanaparthy District, Telangana State, India |
|
Zolekar et al., 2020 |
TDS, TH, Ca²⁺, Na⁺, Mg²⁺, Cl⁻, K⁺, NO₃⁻, and SO₄²⁻ |
Primary Data Field Survey |
61 Groundwater samples |
pH/EC/TDS meter, Ionc chromatograph, Flame atomic absorption spectrophotometer, EDTA titrimetric |
GIS Water Quality Index (WQI), Piper trilinear diagram, Gibbs Index |
To evaluate the groundwater quality for drinking and agriculture uses |
Drinking and agriculture |
Nashik District in Maharashtra India |
|
Singh et al., 2020 |
pH, EC, TDS, TH, HCO₃⁻, Ca²⁺, Mg²⁺, Na⁺, K⁺, Cl⁻, SO₄²⁻, NO₃⁻ |
Primary Data Field Survey |
50 groundwater samples |
Potable kit, UV spectrophotometric method, Titration method, Flame photometer method |
USSL- diagram, Wilcox diagram, Piper trilinear diagram, Gibbs diagram, Durov diagram, Chloralkaline Index, PI, SAR, Soluble sodium percentage (SSP), MH, Salinity and Alkalinity Hazard (SAH), Sodium Hazard (SH), |
To evaluate of groundwater quality for suitability of irrigation purposes |
Irrigation |
Udham sigh Nagar, Uttarakhand |
|
Adimalla et al., 2020 |
pH, EC, TDS, TH, HCO₃⁻, Ca²⁺, Mg²⁺, Na⁺, K⁺, Cl⁻, SO₄²⁻, NO₃⁻, F⁻ |
Primary Data Field Survey |
105 groundwater samples |
pH/EC/TDS meter, Ethylenediaminetetraacetic acid, Flame photometer, UV–visible spectrophotometer, Ion-selective electrode, |
WQI, SAR, RSC, MH, KR, Kriging interpolation technique |
To analyse overall groundwater quality and evaluate its suitability for drinking and irrigation purposes |
Drinking and Irrigation |
Central Telangana, India |
|
Aher et al., 2022 |
pH, EC, TDS, TH, Na⁺, Ca²⁺, Mg²⁺, K⁺, Cl⁻, HCO₃⁻, SO₄²⁻, CO₃²⁻, NO₃⁻, and F⁻ |
Primary Data Field Survey |
33 groundwater sample |
Spectrophotometric techniques |
WQI, Piper trilinear diagram, Wilcox diagram, Correlation analysis |
To investigate hydrogeochemical characteristics and groundwater quality |
Drinking water and irrigation |
Pravara River, Maharashtra, India |
The Piper Diagram (Piper Plot) was employed in 38 research papers (84%) for hydro-chemical facies classification. Researchers used this graphical representation to visualize the chemical composition (major ions) of groundwater and classify water types, providing essential insights into the water’s origin and rock-water interaction processes. Similarly, the Gibbs Diagram was used by 28 researchers (62%) to determine the mechanisms influencing groundwater chemistry, such as atmospheric precipitation, rock-water interaction, and evaporation-crystallization processes (Figure 2).
In terms of irrigation suitability assessment, the Sodium Adsorption Ratio (SAR) was adopted by 27 research papers (60%). This index helps predict the extent to which sodium in water will be adsorbed by the soil, affecting soil structure and permeability. Likewise, the Residual Sodium Carbonate (RSC) index was utilized in 19 studies (42%) to assess the potential precipitation of calcium and magnesium, which can increase the relative proportion of sodium and negatively impact soil quality. Another related technique, the Wilcox Diagram, was applied in 18 research papers (40%) to classify water for irrigation by plotting salinity (EC) against sodium hazard (SAR), reducing the risk of salinization and soil damage (Figure 2).

The Magnesium Hazard (MH) Index was used by 12 studies (27%) for evaluating irrigation water quality, particularly the negative effects of excess magnesium on soil structure. Additionally, the Irrigation Water Quality Index (WQI) appeared in 11 research papers (24%), representing an effort to create a simplified index specifically for agricultural water use, often combining parameters such as SAR, MH, and RSC.
Advanced statistical methods were also incorporated, although less frequently. The Multivariate Statistical Analysis technique was applied in 14 research papers (31%) to identify contamination sources, whether natural or anthropogenic, and to simplify complex datasets through methods like factor analysis and cluster analysis. Similarly, Principal Component Analysis (PCA) was used by 6 studies (13%) to reduce dimensionality, identifying a few principal components that explain most of the variance in groundwater quality data (Figure 2).
Other indices include the Permeability Index (PI), which was adopted by 14 studies (31%) for predicting the long-term suitability of water for irrigation by assessing its potential to reduce soil permeability. The Kelly’s Ratio (KI) appeared in 11 research papers (24%) for evaluating sodium hazards by comparing sodium concentrations to those of calcium and magnesium. The Pollution Index of Groundwater (AIG) was used in 4 studies (9%) to assess groundwater contamination by combining pollutant concentrations into a single value.
Less commonly used graphical techniques include the Durov, Schoeller, and Chadha diagrams each applied in 3 research papers (7%) for detailed hydrochemical facies interpretation, comparison of major ion concentrations, and classification of groundwater types, respectively (Figure 2).
Overall, this review highlights those graphical techniques such as the Piper Diagram and Gibbs Diagram, along with composite indices like WQI and SAR, dominate groundwater quality assessment studies.
These methods are favored for their ability to simplify complex chemical data, communicate findings effectively, and assess water suitability for drinking and irrigation purposes, whereas advanced statistical approaches are increasingly used for source identification and multivariate analysis of groundwater quality.
4. Limitations And Research Gaps Observed In These Studies
- Most of the researchers have used conventional methods like WQI, SAR, MAR, SSP, RSC, PI, KI, HR, Gibbs diagrams, Piper diagram and Wilcox diagram. These techniques, though useful for simplifying complex geochemical interactions, fail in the studying dynamic groundwater processes.
- From a human health perspective, it is important to study pollutants like heavy metals, trace elements, pesticides, etc. but these elements have been considered very rarely.
- Geochemical modelling, PCA, CA and FA are applied in most of the groundwater studies but simulation approaches and predictive modelling are used in very few cases.
- Data based on long term observations and seasonal variations is not commonly used; most studies are based on short term data.
- Groundwater quality is affected by changes in rainfall pattern, land use and agriculture activities, but the impact of these factors has been studied in few research works.
- Chloride and Nitrate contamination appears to be studied aspect of groundwater quality, but hazardous risk assessment such as carcinogenic and non-carcinogenic risks have been given very limited attention.
- Most of the studies appear to be based on traditional laboratory analysis, with no integration of smart sensor or real-time groundwater quality monitoring approaches.
- In current groundwater quality studies, chemical parameters are extensively used for drinking and irrigation purposes, but physical, biological and toxicological indicators seem to be ignored.
- Most studies do not assess cumulative risk and probabilistic analysis for multiple contaminates; instead, they mainly report the concentrations of individual contaminates.
- For studying groundwater vulnerability, the use of advance technology such as GIS, RS and satellite data appears to be very limited.
- In WQI, each determinant factor is assigned a different weight, and variations in index calculation methods affect the comparability of groundwater studies across different regions.
5. Perspectives On Future Research
From this literature, it is evident that the use of graphical, statistical, and GIS based methods such as WQI, Piper diagram, Gibbs analysis, Wilcox diagram, Durov diagram, SAR, MAR, SSP, RSC, PI, KI and HR, along with artificial intelligence and geochemical modelling, is becoming popular. There is emphasis on determining integrated indices of chemical parameters and using GIS for accurate analysis and spatial mapping. However, while integrating statistical techniques with modern technologies such as GIS and RS, certain limitations and challenges are observed, as mentioned in the previous section. These issues may pose challenges for groundwater quality assessment. Therefore, some major needs for future research are outlined below.
- Selected studies, mainly focused on chemical indicators, however, future research needs to adopt an integrated approach that includes physical, biological and chemical indicators to develop a framework for a comprehensive assessment of groundwater quality.
- Future research needs to develop models related to public health safety based on results and findings from various groundwater quality studies.
- It is necessary to develop tools that support decision making and enable integrated groundwater quality management for water resource managers and policy makers.
- In future studies, the uncertainty in spatial predictions of groundwater quality should be checked using cross-validation and the accuracy of different interpolation techniques should be compared to identify the best interpolation techniques.
- Developing a universal GWQI for different purposes will be challenging for future researchers. A versatile framework should be created to allow comparisons from local to regional levels (Lumb et al., 2011).
- The hybrid GWQI include fuzzy or neuro-fuzzy techniques along with physicochemical, organic matter, microbiological, major anions/cations and heavy metals (Vadiati et al., 2016).
6. Concluding Remarks
Parameters such as major cations, anions, pH, EC, TDS, TH were frequently used and analyzed, highlighting their universal relevance in assessing groundwater quality for both drinking and irrigation purposes. For the purpose of evaluating water chemistry and hydro chemical characterization, techniques like Piper diagram, Wilcox diagram, Gibbs Diagram and correlation analysis were widely employed. Multiple parameters were integrated into a Single assessment metric and used for WOI calculation enabling a straightforward evaluation of groundwater suitability for human use. In various studies, indices such as SAR, RSC, SSP, PI, KR were widely used to assess the potential effect of salinity and sodicity in groundwater for irrigation purposes. A comprehensive assessment was conducted by integrating GIS-based spatial analysis, interpolation techniques, and statistical methods like PCA, correlation analysis ad cluster analysis to understand the spatial distribution, hydro chemical characterization, and potential health risks of assessment. The reported studies are mainly focused on chemical parameters while physical, biological toxicological and immerging pollutants are often neglected. Future research should adopt a comprehensive approach that considers all parameters. For this integrated approach data driven as well as predictive models are needed. Long term data and real time monitoring is essential, and health risk analysis should be included. Moreover, developing approach, such as GWQI, would be useful for overall assessment of water quality.
Conflict of interest
The authors declare that there are no conflicts of interest regarding the publication of this paper.
Acknowledgements
The authors gratefully acknowledge the Principal of K. V. N. Naik Shikshan Prasarak Sanstha’s Arts, Commerce, and Science College, Nashik, for encouragement and support in completing this research. A portion of this manuscript forms part of the author’s Ph. D. work; therefore, sincere thanks are extended to Savitribai Phule Pune University for fostering research activities. The authors also appreciate the critical and constructive comments provided by the anonymous reviewers, which greatly improved the quality of the final manuscript. We would like to express our gratitude to the Department of Geography at K.T.H.M. College for their continued support during the research. The editorial guidance and efficient handling of the paper by Dr. Pramodkumar Hire (Editor-in-Chief) and Dr. Vijay Bhagat are also sincerely acknowledged.
Abbreviations
AAS: Atomic Absorption Spectrophotometer; Al: Aluminium; APHA: American Public Health Association; Asᵀ: Total Arsenic; BIS: Bureau of Indian Standards; Br⁻: Bromide ion; Ca²⁺: Calcium ion; CAI-I/CAI-II: Chloro-Alkaline Indices; CBE: Charge Balance Error; Cl⁻: Chloride ion; CO₃²⁻: Carbonate ion; COD: Chemical Oxygen Demand; Cr: Chromium; Cu: Copper; CWQI: Comprehensive Water Quality Index; EC: Electrical Conductivity; EDTA: Ethylenediaminetetraacetic Acid; EWQI: Entropy Water Quality Index; F⁻: Fluoride ion; GIS: Geographic Information System; HCA: Hierarchical Cluster Analysis; HCO₃⁻: Bicarbonate ion; HHRA: Human Health Risk Assessment; HQ: Hazard Quotient; HRA: Health Risk Assessment; IBE: Ionic Balance Error; IC: Ion Chromatography; ICP-MS: Inductively Coupled Plasma Mass Spectrometry; ICP-OES: Inductively Coupled Plasma Optical Emission Spectroscopy; ISE: Ion-Selective Electrode; K⁺: Potassium ion; KR (KI): Kelley’s Ratio; MAR: Magnesium Adsorption Ratio; Mg²⁺: Magnesium ion; MH: Magnesium Hazard; Mnᵀ: Total Manganese; Na⁺: Sodium ion; NH₄⁺: Ammonium ion; Niᵀ: Total Nickel; NO₂⁻: Nitrite ion; NO₃⁻: Nitrate ion; Pb: Lead; PCA: Principal Component Analysis; pH: Potential of Hydrogen; PI: Permeability Index; PIG: Pollution Index of Groundwater; PO₄³⁻: Phosphate ion; RSC: Residual Sodium Carbonate; SAH: Salinity and Alkalinity Hazard; SAR: Sodium Adsorption Ratio; SH: Sodium Hazard; SI: Saturation Index; SO₄²⁻: Sulphate ion; SP: Sodium Percentage; SSP: Soluble Sodium Percentage; TA: Total Alkalinity; TCᶜ: Total Carbon; TDS: Total Dissolved Solids; TH: Total Hardness; TZ⁺ / TZ⁻: Total Cations / Total Anions; USSL: United States Salinity Laboratory Diagram; UV–VIS: Ultraviolet–Visible Spectrophotometer; WHO: World Health Organization; WQI: Water Quality Index; Zn: Zinc.
Article information
- Received
- 8 Sep 2025
- Revised
- 12 Oct 2025
- Accepted
- 15 Oct 2025
- Published
- 22 Dec 2025
- Handling editor
- Dr. Pramodkumar Hire
- Licence
- CC BY-NC-ND 4.0
- Journal
- Hydrospatial Analysis, ISSN 2582-2969
References
-
Adimalla, N. and Li, P., 2018. Occurrence, health risks, and geochemical mechanisms of fluoride and nitrate in groundwater of the rock-dominant semi-arid region, Telangana State, India. Human and Ecological Risk Assessment: An International Journal.
Crossref -
Adimalla, N. and Qian, H., 2019. Groundwater quality evolution using water quality index (WQI) for drinking purposes and human health risk (HHR) assessment in an agricultural region of Nanganur, South India. Ecotoxicology and Environmental Safety, 176, 153-161.
Crossref -
Adimalla, N. and Taloor, A. K., 2019. Hydrogeochemical investigation of groundwater quality in the hard rock terrain of South India using Geographic Information System (GIS) and groundwater quality index (GWQI) techniques. Groundwater for Sustainable Development, 9, 100288.
Crossref -
Adimalla, N. and Venkatayogi, S., 2017. Mechanism of fluoride enrichment in groundwater of hard rock aquifers in Medak, Telangana State, South India. Environmental Earth Sciences, 76(1), 1-10.
Crossref -
Adimalla, N., 2018. Groundwater quality for drinking and irrigation purposes and potential health risk assessment: A case study from semi-arid region of South India. Exposure and Health.
Crossref -
Adimalla, N., 2019. Controlling factors and mechanism of groundwater quality variation in semi-arid region of South India: An approach of water quality index (WQI) and health risk assessment (HRA). Environmental Geochemistry and Health.
Crossref -
Adimalla, N., 2020. Groundwater chemistry integrating the pollution index of groundwater and evaluation of potential human health risk: A case study from hard rock terrain of South India. Ecotoxicology and Environmental Safety, 206, 111217.
Crossref -
Adimalla, N., and Li, P., 2019. Occurrence, health risks, and geochemical mechanisms of fluoride and nitrate in groundwater of the rock-dominant semi-arid region, Telangana State, India. Human and Ecological Risk Assessment: An International Journal, 25(1-2), 81-103.
Crossref -
Adimalla, N., and Venkatayogi, S., 2018. Geochemical characterization and evaluation of groundwater suitability for domestic and agricultural utility in semi-arid region of Basara, Telangana State, South India. Applied water science, 8(1), 44.
Crossref -
Adimalla, N., Dhakate, R., Kasarla, A. and Kumar Taloor, A., 2020. Appraisal of groundwater quality for drinking and irrigation purposes in Central Telangana, India. Groundwater for Sustainable Development, 10, 100334.
Crossref -
Adimalla, N., Hui, Q. and Nandan, M. J., 2020. Groundwater chemistry integrating the pollution index of groundwater and evaluation of potential human health risk: A case study from hard rock terrain of South South India. Ecotoxicology and Environmental Safety, 206, 111217.
Crossref -
Adimalla, N., Marsetty, S. K., and Xu, P., 2019. Assessing groundwater quality and health risks of fluoride pollution in the Shasler Vagu (SV) watershed of Nalgonda, India. Human and Ecological Risk Assessment: An International Journal, 26(6), 1569-1588.
Crossref -
Adimalla, N., Peiyue, L. and Venkatayogi, S., 2018. Hydrogeochemical evaluation of groundwater quality for drinking and irrigation purposes and integrated interpretation with water quality index studies. Environmental Processes, 5, 363-383.
Crossref -
Adimalla, N., Vasa, S. K. and Li, P., 2018. Evaluation of groundwater quality, Peddavagu in Central Telangana (PCT), South India: an insight of controlling factors of fluoride enrichment. Modeling Earth Systems and Environment, 4(2), 841-852.
Crossref -
Aher, S., Deshmukh, K., Gawali, P., Zolekar, R. and Deshmukh, P., 2022. Hydrogeochemical characteristics and groundwater quality investigation along the basinal cross-section of Pravara River, Maharashtra, India. Journal of Asian Earth Sciences: X, 7, 100082.
Crossref -
Aly, A. A., Al-Omran, A. M. and Alharby, M. M., 2015. The water quality index and hydrochemical characterization of groundwater resources in Hafar Albatin, Saudi Arabia. Arabian Journal of Geosciences, 8(6), 4177-4190.
Crossref -
Andezhath, S. K., Susheela, A. K. and Ghosh, G., 1999. Fluorosis management in India: The impact due to networking between health and rural drinking water supply agencies. IAHS-AISH Publication, 260, 159-165.
-
Annapoorna, H. and Janardhanab, M. R., 2015. Assessment of groundwater quality for drinking purpose in rural areas surrounding a defunct copper mine. Aquatic Procedia, 4, 685-692.
Crossref -
Anwar, A. A., Abdulrasoul, M. A. and Omran, M. A., 2014. The water quality index and hydrogeochemical characterization of groundwater resources in Hafr Al-Batin, Saudi Arabia. Arabian Journal of Geosciences.
Crossref -
APHA [American Public Health Association] 1995. Standard methods for the examination of water and wastewater. 19th edition. American Public Health Association Inc., New York, 1193.
-
Ayed, B., Jmal, I., Sahal, S., Mokadem, N., Saidi, S., Boughariou, E. and Bouri, S., 2017. Hydrochemical characterization of groundwater using multivariate statistical analysis: The Maritime Djeffara shallow aquifer (Southeastern Tunisia). Environmental Earth Sciences, 76(24), 821.
Crossref -
Ayers, R. S. and Westcot, D. W., 1985. Water quality for agriculture (FAO Irrigation and Drainage Paper No. 29). Food and Agriculture Organization of the United Nations.
-
Ayoob, S. and Gupta, A. K., 2006. Fluoride in drinking water: A review on the status and stress effects. Critical Reviews in Environmental Science and Technology, 36(6), 433-487.
Crossref -
Bachare, A., Ikram, J., Samir, S., Naziha, M., Salwa, S., Emna, B. and Salem, B., 2017. Hydrochemical characterization of groundwater using multivariate statistical analysis: The maritime Djeffara shallow aquifer (Southeastern Tunisia). Environmental Earth Sciences, 76, 821.
Crossref -
Baghvand, A., Nasrabadi, T., Barak, J. T., Mehrdadi, N. and Yunesian, M., 2010. Groundwater quality degradation of an aquifer in Iran central desert. Desalination, 260(1-3), 264-275.
Crossref -
Batabyal, A. K., and Chakraborty, S., 2015. Hydrogeochemistry and water quality index in the assessment of groundwater quality for drinking uses. Water Environment Research, 87(7), 607-617.
Crossref -
BIS [Bureau of Indian Standards], 2003. Indian standard drinking water specifications (IS 10500:1991). Bureau of Indian Standards.
-
Chadha, D. K., 1999. A proposed new diagram foe geochemical classification of natural waters and interpretation of chemical data. Hydrogeology Journal, 7, 431-439.
Crossref -
Chatterjee, R., Tarafder, G. and Paul, S., 2009. Groundwater quality assessment of Dhanbad district, Jharkhand, India. Bulletin of Engineering Geology and the Environment, 69(1), 137-141.
Crossref -
Chaudhary, V. and Satheeshkumar, S., 2018. Assessment of groundwater quality for drinking and irrigation purposes in arid areas of Rajasthan, India. Applied Water Science, 8, 218.
Crossref -
Chetan, P. S. and Ahada, S. S., 2017. Hydrochemistry of groundwater in North Rajasthan, India: Chemical and multivariate analysis. Environmental Earth Sciences, 76, 203.
Crossref -
Chung, S. Y., Venkataraman, S. V., Kim, T. H., Kim, D. S. and Ramkumar, T., 2014. Influence of hydrogeochemical processes and assessment of suitability for groundwater uses in Busan City, Korea. Environment, Development and Sustainability.
Crossref -
Didar, S. M., Mujumdar, R., Jamaluddin, M., Khalil, I. and Ferdous, A., 2016. Hydrochemical characteristics and quality assessment of groundwater in Patuakhali District, southern coastal region of Bangladesh. Exposure and Health.
Crossref -
Doneen, L. D., 1964. Notes on water quality in agriculture. Department of Water Science and Engineering, University of California.
-
Eaton, F. M., 1950. Significance of carbonates in irrigation waters. Soil Science, 69(2), 123-133.
Crossref -
Egbueri, J. C., 2019. Groundwater quality assessment using pollution index of groundwater (PIG), ecological risk index (ERI) and hierarchical cluster analysis (HCA): A case study. Groundwater for Sustainable Development, 9, 100292.
Crossref -
FAO [Food and Agriculture Organization] and WHO [World Health Organization], 2008. Viruses in food: Scientific advice to support risk management activities (Microbiological Risk Assessment Series No. 13). FAO.
-
Gibbs, R. J., 1970. Mechanisms controlling world water chemistry. Science, 170(3962), 795-840.
Crossref -
Gowrisankar, G., Jagadeshan, G. and Elango, L., 2017. Managed aquifer recharge by a check dam to improve the quality of fluoride-rich groundwater: a case study from southern India. Environmental monitoring and assessment, 189(4), 200.
Crossref -
Houatmia, F., Azouzi, R., Charef, A. and Bedir, M., 2016. Assessment of groundwater quality for irrigation and drinking purposes and identification of hydrogeochemical mechanisms in Northeastern Tunisia. Environmental Earth Sciences, 75, 746.
Crossref -
Islam, S. D. U., Bhuiyan, M. A. H., Rume, T. and Azam, G., 2017. Hydrogeochemical investigation of groundwater in shallow coastal aquifer of Khulna District, Bangladesh. Applied Water Science, 7(8), 4219-4236.
Crossref -
Jafari, K., Asghari, F. B., Hoseinzadeh, E., Heidari, Z., Radfard, M., Saleh, H. N. and Faraji, H., 2018. Groundwater quality assessment for drinking and agricultural purposes in Abhar city, Iran. Data in Brief, 19, 1033-1039.
Crossref -
Kaur, T., Bhardwaj, R. and Arora, S., 2017. Assessment of groundwater quality for drinking and irrigation purposes using hydrochemical studies in Malwa region, southwestern part of Punjab, India. Applied Water Science, 7, 3301-3316.
Crossref -
Kelly, W. P., 1951. Alkali soils-Their formation, properties and reclamation. Reinhold Publishing Corporation.
-
Khan, R. and Jhariya, D. C., 2018. Hydrogeochemistry and groundwater quality assessment for drinking and irrigation purpose of Raipur City, Chhattisgarh. Journal of the Geological Society of India, 91, 475-482.
Crossref -
Khan, R., and Jhariya, D. C., 2017. Groundwater quality assessment for drinking purpose in Raipur city, Chhattisgarh using water quality index and geographic information system. Journal of the geological society of India, 90(1), 69-76.
Crossref -
Kshitindra, S., Geeta, T. and Suresh, K., 2020. Evolution of groundwater quality for suitability of irrigation purposes: A case study in the Udham Singh Nagar, Uttarakhand. Journal of Chemistry, 6924026, 15.
Crossref -
Li, P., Li, X., Meng, X., Li, M. and Zhang, Y., 2016. Appraising groundwater quality and health risks from contamination in a semiarid region of northwest China. Exposure and Health, 8(3), 361-379.
Crossref -
Liu, C. W., Lin, K. H. and Kuo, Y. M., 2003. Application of factor analysis in the assessment of groundwater quality in a Blackfoot disease area in Taiwan. Science of the Total Environment, 313(1-3), 77-89.
Crossref -
Liu, P., Li, X., Meng, X., Li, M. and Zhang, Y., 2016. Appraising groundwater quality and health risks from contamination in a semiarid region of Northwest China. Exposure and Health.
Crossref -
Lumb, A., Sharma, T. C. and Bibeault, J. F., 2011. A review of genesis and evolution of water quality index (WQI) and some future directions. Water quality, exposure and health, 3(1), 11-24.
Crossref -
Madhav, S., Ahamad, A., Kumar, A., Kushawaha, J., Singh, P. and Mishra, P. K., 2018. Geochemical assessment of groundwater quality for its suitability for drinking and irrigation purpose in rural areas of Sant Ravidas Nagar (Bhadohi), Uttar Pradesh. Geology, Ecology, and Landscapes, 2(2), 127-136.
Crossref -
Magesh, N. S., Chandrasekar, N. and Elango, L., 2017. Trace element concentrations in the groundwater of the Tamiraparani river basin, South India: insights from human health risk and multivariate statistical techniques. Chemosphere, 185, 468-479.
Crossref -
Magesh, N. S., Krishnakumar, S., Chandrasekar, N. and Soundranayagam, J. P., 2012. Groundwater quality assessment using WQI and GIS techniques: Dindigul district, Tamil Nadu, India. Arabian Journal of Geosciences, 6(11), 4179-4189.
Crossref -
Nagarjuna, A., Sunilkumar, K. and Thejaswi, A., 2014. Assessment of groundwater quality for irrigation: A case study from Bandalamottu lead mining area, Guntur District, Andhra Pradesh, South India. International Journal of Engineering Research and Applications, 4(6), 118-122.
Crossref -
Narsimha, A. and Sudarshan, V., 2017. Contamination of fluoride in groundwater and its effect on human health: a case study in hard rock aquifers of Siddipet, Telangana State, India. Appl Water Sci, 7, 2501-2512.
Crossref -
Paliwal, K. V., 1972. Irrigation with saline water (IARI Monograph No. 2). Indian Agricultural Research Institute, New Delhi.
-
Pawar, N. J., Pawar, J. B., Kumar, S. and Supekar, A., 2008. Geochemical eccentricity of ground water allied to weathering of basalts from the Deccan Volcanic Province, India: Insinuation on CO2 consumption. Aquatic Geochemistry, 14(1), 41-71.
Crossref -
Piper, D. Z., 1994. Seawater as the source of minor elements in black shales, phosphorites and other sedimentary rocks. Chemical Geology, 114(1-2), 95-114.
Crossref -
Prasanth, S. V. S., Magesh, N. S., Jitheshlal, K. V., Chandrasekar, N. and Gangadhar, K., 2012. Evolution of groundwater quality and its suitability for drinking and agricultural use in a stretch of Alappuzha district, Kerala, India. Applied Water Science, 2, 165-175.
Crossref -
Rajmohan, N. and Elango, L. J. E. G., 2004. Identification and evolution of hydrogeochemical processes in the groundwater environment in an area of the Palar and Cheyyar River Basins, Southern India. Environmental Geology, 46(1), 47-61.
Crossref -
Rajmohan, N. and Elango, L., 2005. Nutrient chemistry of groundwater in an intensively irrigated region of southern India. Environmental Geology, 47(6), 820-830.
Crossref -
Ramesh, K. and Elango, L., 2012. Groundwater quality assessment in and around a landfill site in Alappakkam, Tamil Nadu, India. Journal of Earth System Science, 121(3), 671-683.
-
Richards, L. A., 1954. Diagnosis and improvement of saline and alkali soils (USDA Handbook No. 78). U.S. Department of Agriculture.
-
Sajil Kumar, P. J., Schneider, M. and Elango, L., 2021. The state-of-the-art estimation of groundwater recharge and water balance with a special emphasis on India: A critical review. Sustainability, 14(1), 340.
Crossref -
Sako, A., Bamba, O. and Gordio, A., 2016. Hydrogeochemical processes controlling groundwater quality around Bomboré gold mineralized zone, Central Burkina Faso. Journal of Geochemical Exploration, 170, 58-71.
Crossref -
Schoeller, H., 1956. Geochimie des eaux souterraines: application aux eaux des gisements de petrole. Inst. Français duPétrole,Paris
-
Shaikh, M. and Birajdar, F., 2024. Advancements in remote sensing and GIS for sustainable groundwater monitoring: Applications, challenges, and future directions. International Journal of Research in Engineering, Science and Management, 7(3), 16-24.
-
Shaji, E., Santosh, M., Sarath, K. V., Prakash, P., Deepchand, V. and Divya, B. V., 2021. Arsenic contamination of groundwater: A global synopsis with focus on the Indian Peninsula. Geoscience Frontiers, 12(3), 101079.
Crossref -
Singh, K. K., Tewari, G. and Kumar, S., 2020. Evaluation of groundwater quality for suitability of irrigation purposes: a case study in the Udham Singh Nagar, Uttarakhand. Journal of Chemistry, 2020(1), 6924026.
Crossref -
Singh, S. K., Srivastava, P. K., Singh, D., Han, D., Gautam, S. K. and Pandey, A. C., 2015. Modeling groundwater quality over a humid subtropical region using numerical indices, earth observation datasets, and X-ray diffraction technique: a case study of Allahabad district, India. Environmental geochemistry and health, 37(1), 157-180.
Crossref -
Singh, V. K., Bikundia, D. S., Sarswat, A. and Mohan, D., 2012. Groundwater quality assessment in the village of Lutfullapur Nawada, Loni, District Ghaziabad, Uttar Pradesh, India. Environmental Monitoring and Assessment, 184(7), 4473-4488.
Crossref -
Subba Rao, N., Sunitha, B., Adimalla, N. and Chaudhary, M., 2020. Quality criteria for groundwater use from a rural part of Wanaparthy District, Telangana State, India, through ionic spatial distribution (ISD), entropy water quality index (EWQI) and principal component analysis (PCA). Environmental Geochemistry and Health, 42(2), 579-599.
Crossref -
Subba Rao, N., Sunitha, B., Rambabu, R., Nageswara Rao, P. V., Surya Rao, P., Deepthi Spandana, B., Sravanthi, M. and Marghade, D., 2018. Quality and degree of pollution of groundwater, using PIG from a rural part of Telangana State, India. Applied Water Science, 8, 227.
Crossref -
Tiwari, A. K. and Singh, A. K., 2014. Hydrogeochemical investigation and groundwater quality assessment of Pratapgarh District, Uttar Pradesh. Journal of the Geological Society of India, 83(3), 329-343.
Crossref -
Tiwari, A. K., Singh, A. K. and Mahato, M. K., 2017. Assessment of groundwater quality of Pratapgarh District in India for suitability of drinking purposes using water quality index (WQI) and GIS technique. Sustainable Water Resources Management, 3(3), 331-347.
Crossref -
Tiwari, A. K., Singh, A. K., Singh, A. K. and Singh, M. P., 2017. Hydrogeochemical analysis and evaluation of surface water quality of Pratapgarh district, Uttar Pradesh, India. Applied Water Science, 7(4), 1609-1623.
Crossref -
Todd, D. K. and Mays, L. W., 2005. Groundwater Hydrology (Ed. 3). Wiley.
-
USSL [US Salinity Laboratory], 1954. Diagnosis and improvement of saline and alkaline soils. Agriculture Handbook No. 60 USDA.
-
Vadiati, M., Asghari-Moghaddam, A., Nakhaei, M., Adamowski, J. and Akbarzadeh, A. H., 2016. A fuzzy-logic based decision-making approach for identification of groundwater quality based on groundwater quality indices. Journal of Environmental Management, 184, 255-270.
Crossref -
Vasanthavigar, M., Srinivasamoorthy, K., Vijayaragavan, K., Ganthi, R., Chidambaram, S., Anandhan, P., Manivannan, R. and Vasudevan, S., 2010. Application of water quality index for groundwater quality assessment: Thirumanimuttar sub-basin, Tamil Nadu, India. Environmental Monitoring and Assessment, 171(1-4), 595-609.
Crossref -
Wagh, V. M., Panaskar, D. B., Varade, A. M., Mukate, S. V., Gaikwad, S. K., Pawar, R. S., Muley, A. A. and Aamalawar, M. L., 2016. Major ion chemistry and quality assessment of the groundwater resources of Nanded tehsil, a part of southeast Deccan Volcanic Province, Maharashtra, India. Environmental Earth Sciences, 75(21), 1418.
Crossref -
Wanda, E. M. M., Gulula, L. C. and Phiri, G., 2012. Hydrochemical assessment of groundwater used for irrigation in Rumphi and Karonga districts, Northern Malawi. Physics and Chemistry of the Earth, 50-52, 92-97.
Crossref -
WHO [World Health Organization], 1997. Guidelines for drinking-water quality, 1, 1-4. World Health Organization.
-
Wilcox, L. V., 1955. Classification and use of irrigation waters (USDA Circular 969). U.S. Department of Agriculture.
-
Wu, J., Li, P., Qian, H., Duan, Z. and Zhang, X., 2013. Using correlation and multivariate statistical analysis to identify hydrogeochemical processes affecting the major ion chemistry of waters: A case study in Laoheba phosphorite mine in Sichuan, China. Arabian Journal of Geosciences, 7, 3973-3982.
Crossref -
Zhang, Y., Wu, J. and Xu, B., 2018. Human health risk assessment of groundwater nitrogen pollution in Jinghui canal irrigation area of the Loess region, Northwest China. Environmental Earth Sciences, 77, 273.
Crossref -
Zhou, Y., Li, P., Chen, M., Dong, Z. and Liu, C., 2020. Groundwater quality for potable and irrigation uses and associated health risk in southern part of Gu’an County, North China Plain. Environmental Geochemistry and Health, 42, 2223-2243.
Crossref -
Zolekar, R. B., Todmal, R. S., Bhagat, V. S., Bhailume, M. S. and Korade, S. D., 2020. Hydro-chemical characterization and geospatial analysis of groundwater for drinking and agricultural usage in Nashik District in Maharashtra, India. Environment, Development and Sustainability, 22(3), 2085-2105.
Crossref