

Remote Sensing of Land Volume 4 (2020), Issue 1-2 · pp. 40-58
Original Research Paper Open Access

Analysis of Urban Expansion and Modeling of LULC Changes Using Geospatial Techniques: The Case of Adama City
- Department of Surveying Engineering, Mizan-Tepi University, Ethiopia.
- Department of Surveying Engineering, Debre Berhan University, Debre Berhan, Ethiopia.
- Department of Geology, College of Natural and Computational Sciences, Debre Berhan University, Debre Berhan, Ethiopia.
* Corresponding author: Murugesan Bagyaraj, geobagya25@gmail.com
Contents
- Highlights
- Abstract
- 1. Introduction
- 2. Methodology
- 3. Classification, Results And Validation
- 4. Model, Simulations And Validations
- 5. Conclusions
- Conflict of interest
- Abbreviations
- Article information
- References
-
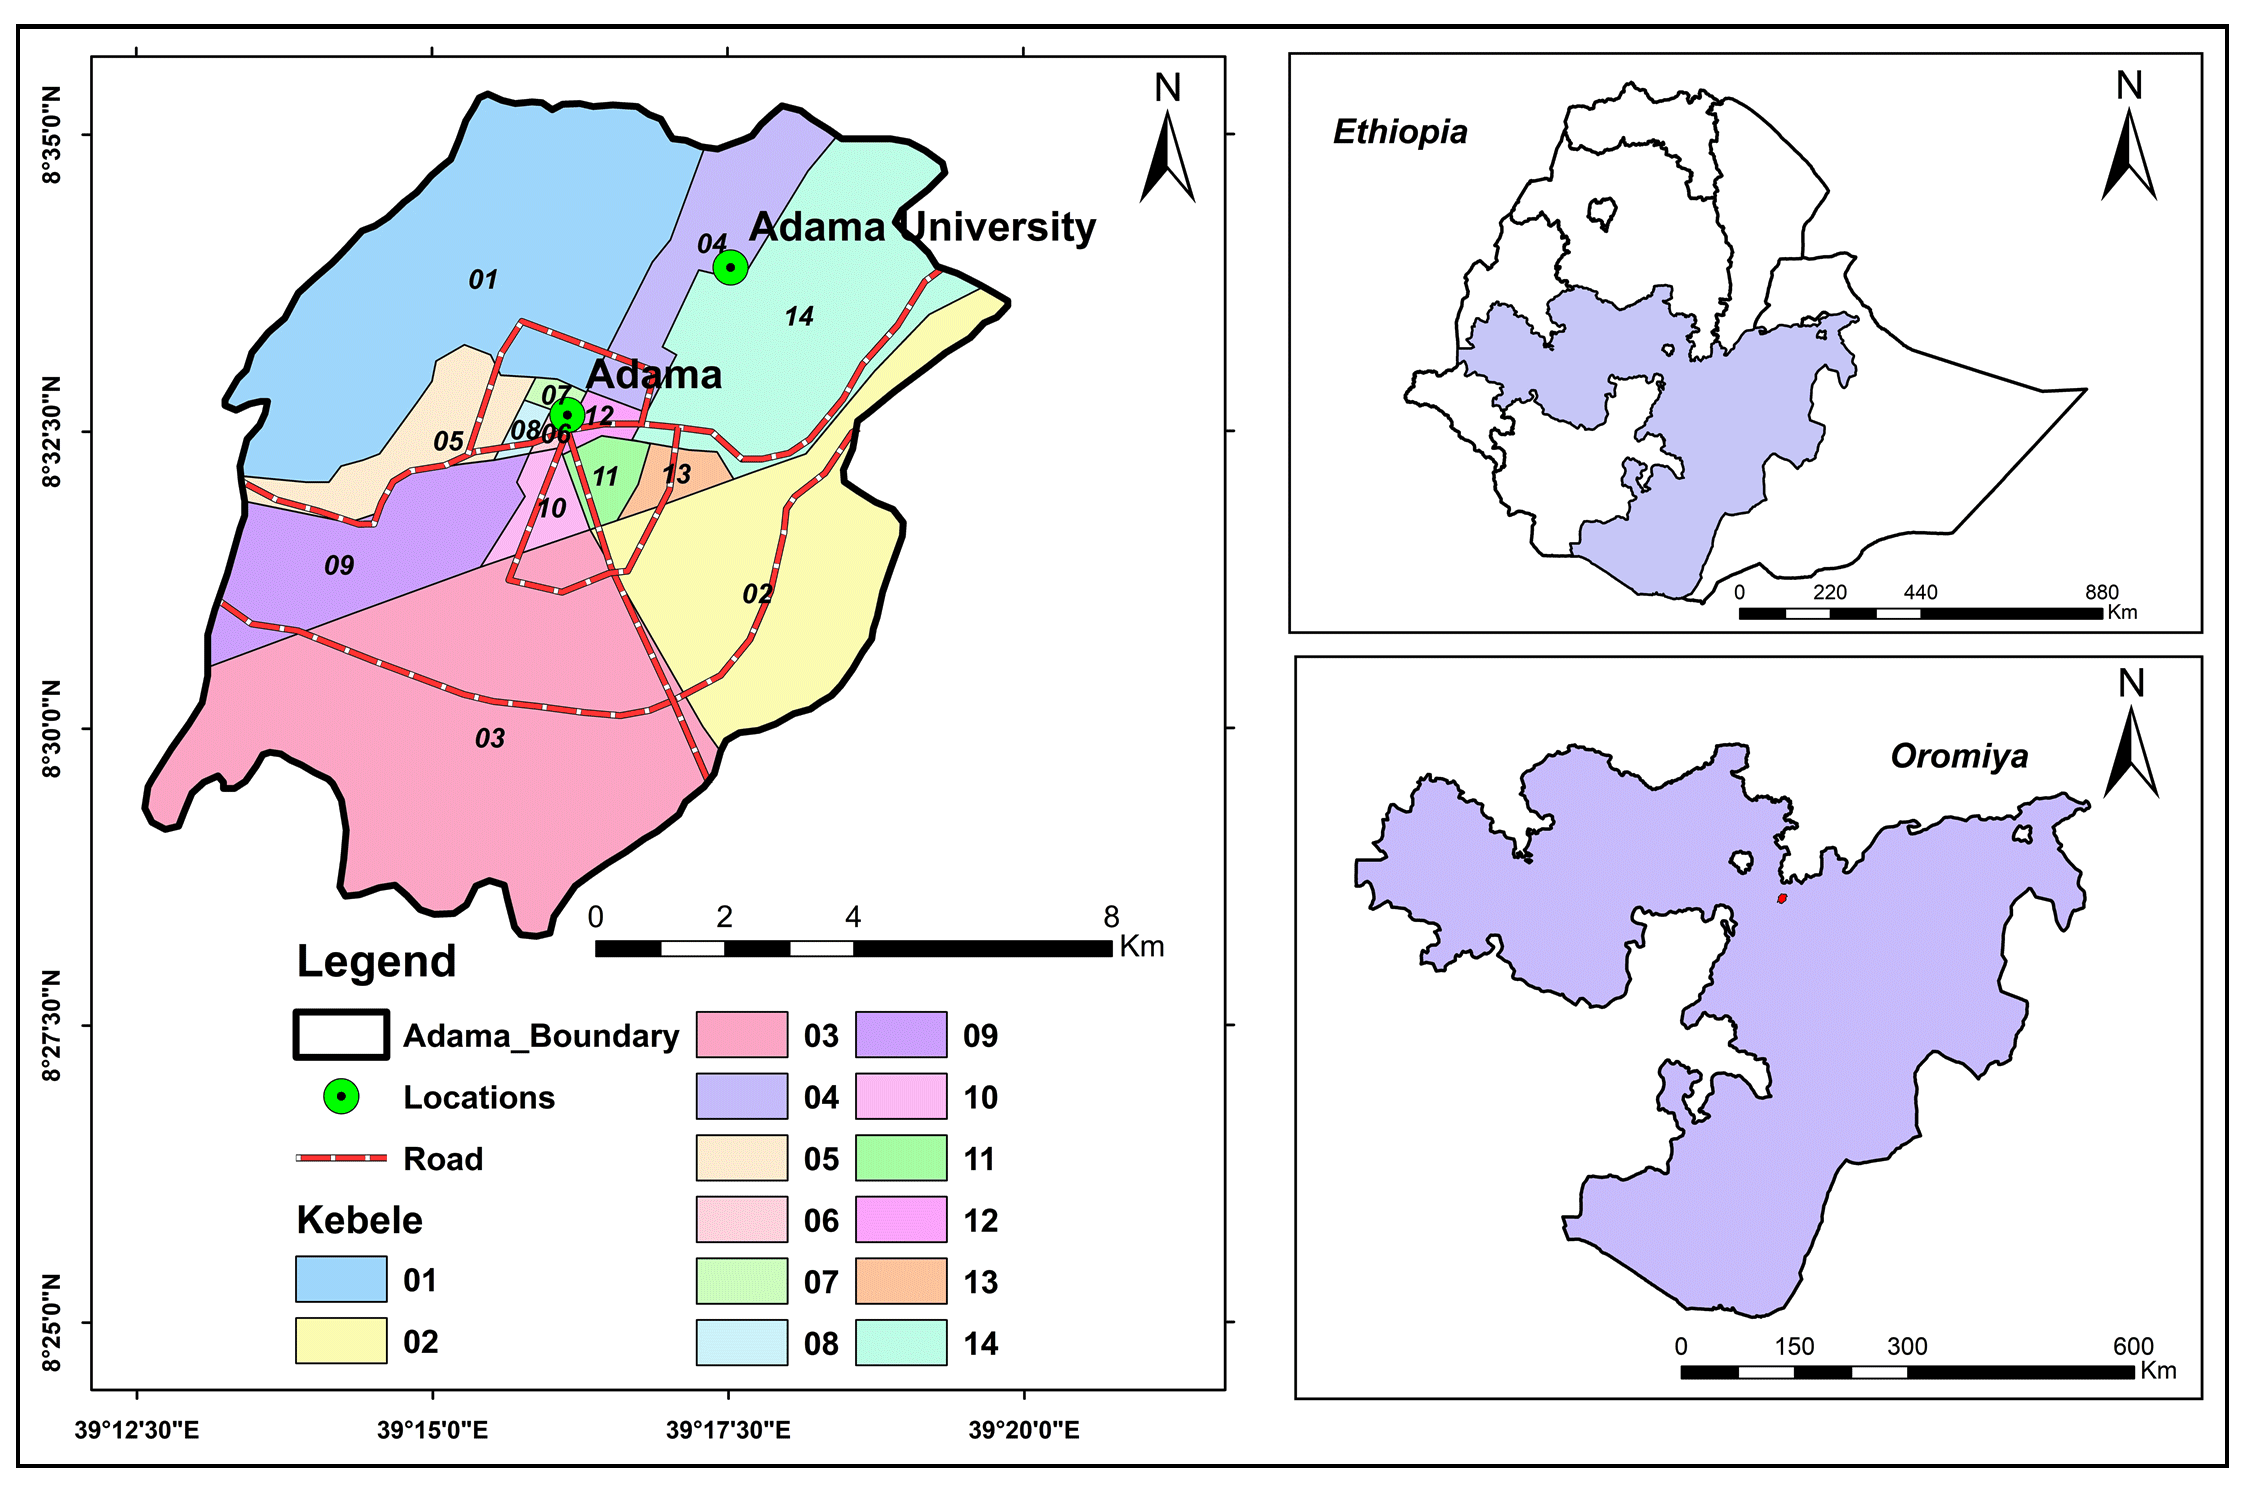
- Figure 1. Location map: Study area
- Figure 2. Methodology
- Figure 3. LULC: 1973
- Figure 4. LULC: 2000
- Figure 5. LULC: 2010
- Figure 6. (a) Built-up and non-built-up areas: 1973
- Figure 6. (b) Built-up and non-built-up areas: 2000
- Figure 6. (c) Built-up and non-built-up areas: 2010
- Figure 7.Gains and losses
- Figure 8. Transition maps of LULC to forestland (a), to grassland (b)…
- Figure 9. LULC of 2010 actual (left) and simulated (right)
- Figure 10. Predicted LULC map: 2040
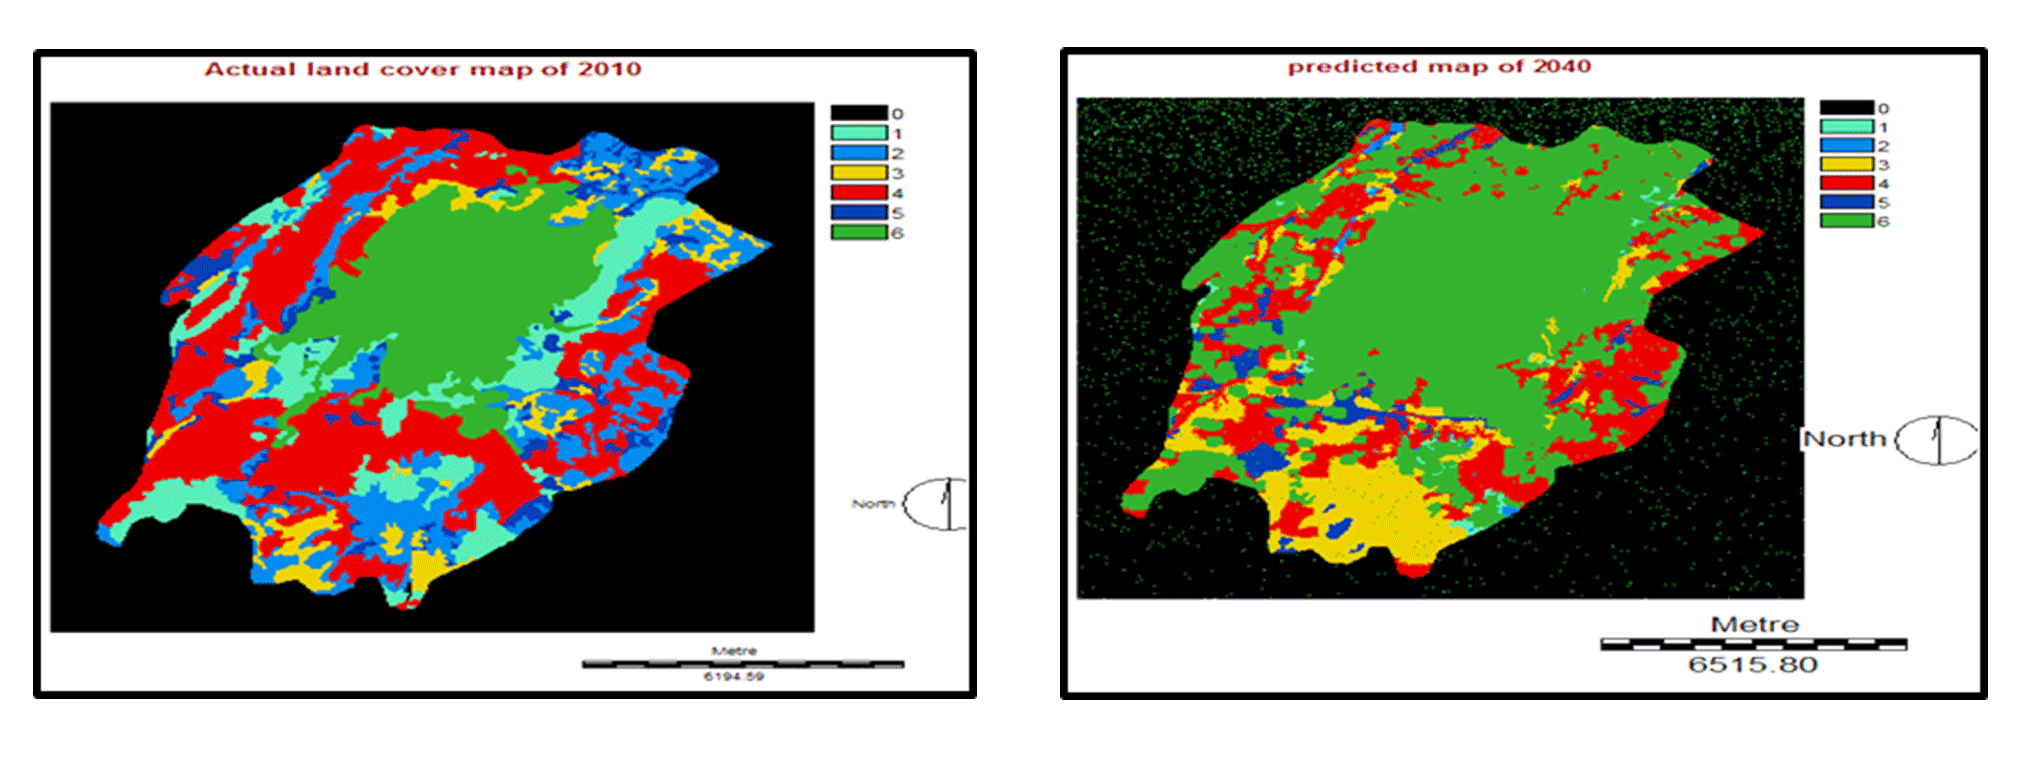
- Figure 11. LULC actual in 2010 (left) and predicted map for 2040 (rig…
-
- Table 1. Sensor, spatial resolution and acquisition
- Table 2. Nomenclature of LULC classes
- Table 3. Surface characteristics occur in various composite images
- Table, 4. Confusion, matrix for LULC map:1973
- Table 5. Confusion, matrix for LULC map: 2000
- Table 6. Confusion, matrix for LULC map:2010
- Table 7. LULC in Adama city
- Table 8. Built-up and non-built-up areas: 1973-2010
- Table 9. Net changes of LULC: 1973-2010
- Table 10. The Markov probability of changing among LULC types
- Table 11. Cells expected to transition to different classes
- Table 12. Actual and simulated LULC map: 2010
- Table 13. Cross tabulation, of actual and simulated LULC map: 2010
- Table 14. Validation of reference and simulated LULC map: 2010
- Table 15. Markov probability of changes between the LULC types
- Table 16. Cells transition to different classes
- Table 17. LULC Changes: 2010 and 2040
- Table 10. The Markov probability of changing among LULC types
Highlights
- The study focused on examination of spatial changes in urban areas using geospatial technology.
- Markov Chain and CA-Markov techniques were used to model the LULC changes in the Adama district.
- The model was verified by the Kappa statistics and also by the application of other validation techniques.
- The growth of built-up areas in the last 37 years has risen from 2% in 1973, 10% in 2000 and 23% in 2010.
- The identified changes in urban patterns will be useful for successful land use regulations and planning.
Abstract
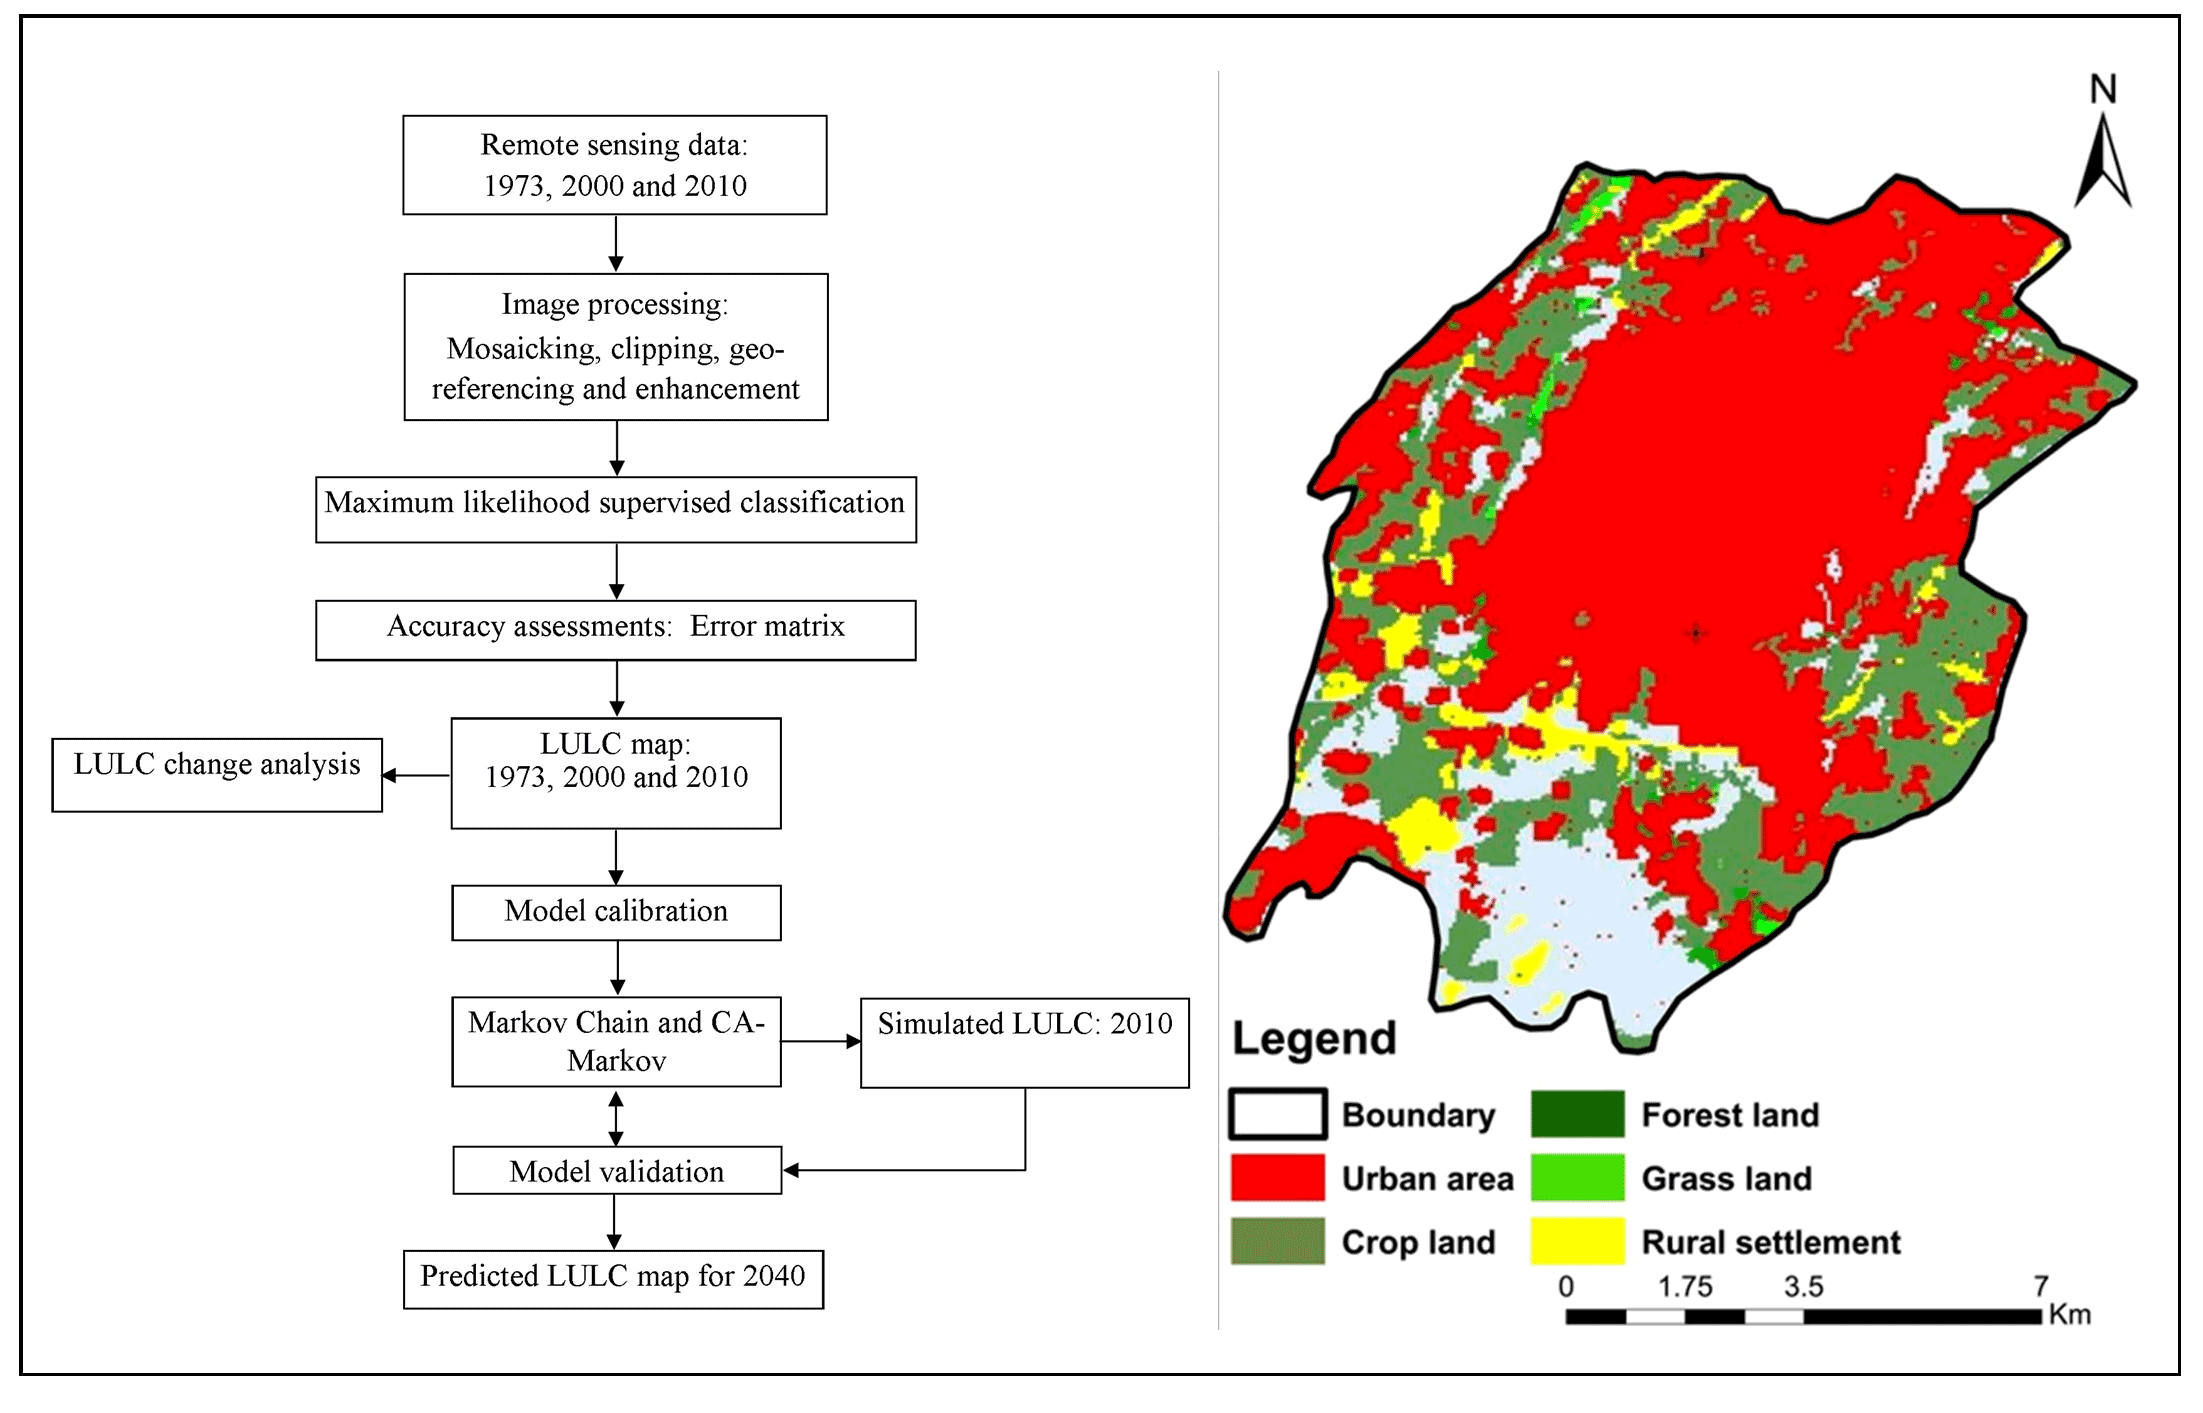
In the last decades, Adama city has experienced drastic changes in its shape, not just in its vast geographical expansion, but also by internal transformations. Subsequently, understanding and evaluating the spatiotemporal variability of urban land use and land cover (LULC) shifts, and it is important to bring forth the right strategies and processes to track population development in decision-making. The goal of this analysis was therefore to examine LULC changes that have taken place over 37 years, forecast the long-term urban development in Adama City using geospatial techniques. To attain this, satellite data of Landsat 1973, 2000 and 2010 was downloaded from USGS Earth Explorer and processed using Arc GIS 10.5, Erdas 9.2, and Idrisi 32. A supervised classification technique has been used to prepare the base maps with six land cover classes that are accustomed to generate LULC maps. The maps are cross-tabulated to measure LULC changes, to look at land-use transfers between the land cover classes, to spot increases and declines in built-up areas in comparison to other land cover classes, and to determine the spatial changes in built-up areas. Finally, Markov Chain and CA-Markov techniques were used to model the LULC changes in the Adama district and to forecast possible changes in urban land use. The model was verified by the Kappa statistics and also by the application of other validation techniques. The growth of built-up areas in the last 37 years has risen from 2% in 1973, 10% in 2000 and 23% in 2010 and estimated about 60% over the next 30 years (2040).
Keywords Cellular AutomataGISImage ClassificationLULCMarkov ChainModelingRemote Sensing
1. Introduction
The urbanization is playing a vital role in global development. Increased population and land requirement for settlement, economic and industrial growth, as well as its environmental effects, have also posed concerns in many countries. The world has great exceeding in city development in accordance to the United Nations (UN, 2000) and the Population Comparison Bureau (PRB, 2000). In 20th century, population in metropolitan cities was very quickly expanded from 0.22 billion to 2.8 billion. An enormous rate of urban development in the developing world will occur within the next few decades (Mesfin, 2009). In Asia and Africa countries, population becomes double in single century. Through 2030, cities and towns in the developing world will make up 81% of the urban population (Mesfin, 2009). The population growth rate in Africa was the highest in the world and it was 4.4% per year (Antonio, 2000). Ethiopia is still largely under-urbanized, taking into account the norms of Africa (Haregeweynet et al., 2012).
In the middle of 1930s, the urbanization rate will be faster (Antonio, 2000). Urbanization was increased between 1950 and 1965 with an average growth rate between 5.4 and 5.6 % per year indicate a doubling of the population in just 13 years. Urban population increase in the last 15 years has again been more than 5% and a high in the five-year period of 1985 and 1990, when the average rate of change was 5.93% (Mesev, 2008). Mostly, the rapid growth of the urban population is due to the difference between rural and urban development and significant rural-to-urban migration up to 1975, while the land reform program of 1975 created incentives and opportunities for peasants and other potential migrants to live in rural areas (Antonio, 2000).
Urbanization has been a product of industrialization in the countries of Europe and North America and has been linked to economic progress, while urbanization has arisen in the developing countries of Asia, Africa and Latin America as a result of population growth and large rural-to-urban relocations (Mesfin, 2009). According to Haregeweyn et al. (2012), many fields have been transformed from rural to urban. According to the 2007 census, Ethiopia has the second largest population in Africa with a total population of over 80 million. It has an annual growth rate of 2.3% and an overall annual population growth rate of 4.6% (Haregeweyn et al., 2012). According to Zubair (2006), the rapid rise of urbanization, the economic gains and the unplanned growth of cities have been resulted many negative effects. The majority of cities are horizontally spreading along the rail and road networks. Such enthusiasm of urban land cover may be caused by social, economic or industrial influences. There are already significant environmental issues that need to be closely examined and tracked for successful land use regulation and planning. In addition, fast population development and improvements related to urban land have attracted many scholars to study and track developments (Mesfin, 2009).
The unexpected urban development is now a major challenge, especially in developing countries where there is a shortage of consistent and accurate data, including spatial data. According to Mesfin (2009), the study of drastic shifts in LULC at continental, national and local level, and additional exploring the scale of potential changes, the existing geospatial expertise on land use dynamics and innovations already plays an important role. Remote Sensing (RS) and Geographic Information System (GIS) are now providing new tools for sophisticated landscape management. The remote sensing analysis allows patterning, system activity, adjustment at regional and local. This data provide a significant connection between localized ecological studies and intensive and international, state and regional conservation (Zubair, 2006). The urbanization, as a deep and also ongoing worldwide occurrence that has been going on for hundreds of years, has been researched by several scientists, concentrating on city growth, city sprawl, and the complexities and trends of urbanization (Antrop and van Eetvelde, 2000) noted that urbanization involves diverse and complex, changes to the rural environment in the, area of towns and cities, leading to very heterogeneous ecosystems. Gerten et al. (2019) have established the trajectory of urbanization expected to remain steady in the future, and will influence trends of land use in several respects. In addition, Keil (2018) claimed that the Earth is the ‘suburban planet’ and predicted that people will want to ‘make the world urban from the outside in’. The European, Environmental Agency (EEA, 2018) cautioned that urbanization, is unsustainable, contributes to soil waste, divides the landscape, and limits the ability of habitats to offer essential ecological services. Henderson and Turner (2020) shows that Europe, Latin and North America and the Caribbean as well as Western Asia tended to be entirely urbanized. Yang et al. (2018) reported that Chinese scientists have observed and marked uneven urban developments in various locations in the world, particularly in Benjin. In comparison, there is a limited research on urban development and its impacts using geospatial data. In order to evaluate land cover change and growth in Adama Region, a change, detection study was undertaken to evaluate the magnitude and scale of land-use change and estimation over time and space. The findings measure LULC change patterns of change in the city and show available satellite data to provide, reliable, cost-effective means of measuring and assessing the land cover changes through a spatial-temporal context that can, be used as guides to land form management, and policy decisions on various themes relevant to land cover, such as agricultural areas, croplands, forest lands.
2. Methodology
2.1 Study Area
Adama city is located 100 km from southeast of Addis Ababa about 8º 35' 00" and 8º 36' 00" N and 39º 11' 57" to 39º 21' 15" E (Figure 1) at an average altitude of 1620m above the sea level. Adama is situated in the Eastern Shewa region which is part of the central plateau. According to the 2007 census, the total population of Adama city was 222023. Besides, the population growth rate of the city (5.4% per annum) was estimated to be higher than the national average (2.5% per annum) (CSA, 2007). CSA’s 1994 Population and Housing Census and 1999 National Labour Force Survey (NLFS) indicates that there were about 187,000 people living in Adama City in 2004. Nevertheless, the year 2002-2003 estimates of the City Administration reveals that the City population is known to be well over 200000. The proportion of male to female during the period was about 48.5 to 51.5 percent revealing further that the sex ratio was 94.0 percent, which implies little excess of women over the men (about 100 females for each 94 males). Furthermore, according to the CSA’s 1994 census, about 33.6 percent of Adama residents were below the age of 15. Similarly, the data further reveals that populations within the working age group (15-64) and above 64 years of age were 63.5 and 2.9 percent, respectively.
As a result, various studies [CSA, 1984, 1994, 1999 and Adama Project Office’s (APO) socio-economic surveys, 2004], Adama has been one of the areas both in the region and the country that receives heavy influx of migrants each year. For instance, the 1984 Census indicates that 53.7% of the City populations were migrants. Similarly, after a decade, in 1994 the second census showed that the extent of migrants were 53.6%. The finding of the 1999 NLFS neither contradicts with the above mentioned two census outcomes. According to the results of the NLFS, hence, 52.1% of the populations of Adama City were contributed from migrants in 1999. The findings of many socio-economic surveys undertaken by APO in 2003-2004 too, confirm that immigration stand out as one of the major issues in Adama City. In the Poverty and Socioeconomic Problem survey undertaken in Adama, about 68.0% of the poor households were migrants. Similarly, in the same study it was found that about 83.0 percent and 87.0 percent of the commercial sex workers and street occupants were migrants, respectively (APO, 2004). The census data further points that Adama households were estimated to have about 4.8 persons on the average. Thus, it could be possible to estimate that about 39.0 thousand households were residing in the city in July 2004.
2.2 Data and Processing
In this research, geospatial technology was, used to detect the urban changes in a particular timeframe and, to examine patterns and trends of transition. Satellite imageries are almost ideal to provide details on the numerous geospatial patterns on the surface of the earth. However, attention must be, given to the degree of, resolution, the degree of accuracy of the image, through processing. However, similar to Mas (1999), it was suggested that it would be impossible to collect multi-date data at the same time of year. According to Gluch (2002), satellite image, MSS, ETM+ and, ETM+ satellite data, are typically used, for their multispectral and environmental, significance (Table 1). The pre-processing and post-image processing analysis was carried out to increase the images accuracy, and the readability of the applications using GIS and ERDASS software. The spheroid and the date are referred to in WGS84. All images were, geometrically, co-registered using ground control, points in the UTM projection. Ground Control Points (GCPs) obtained from identified ground points, the coordinates of which can be precisely placed on digital, imagery.
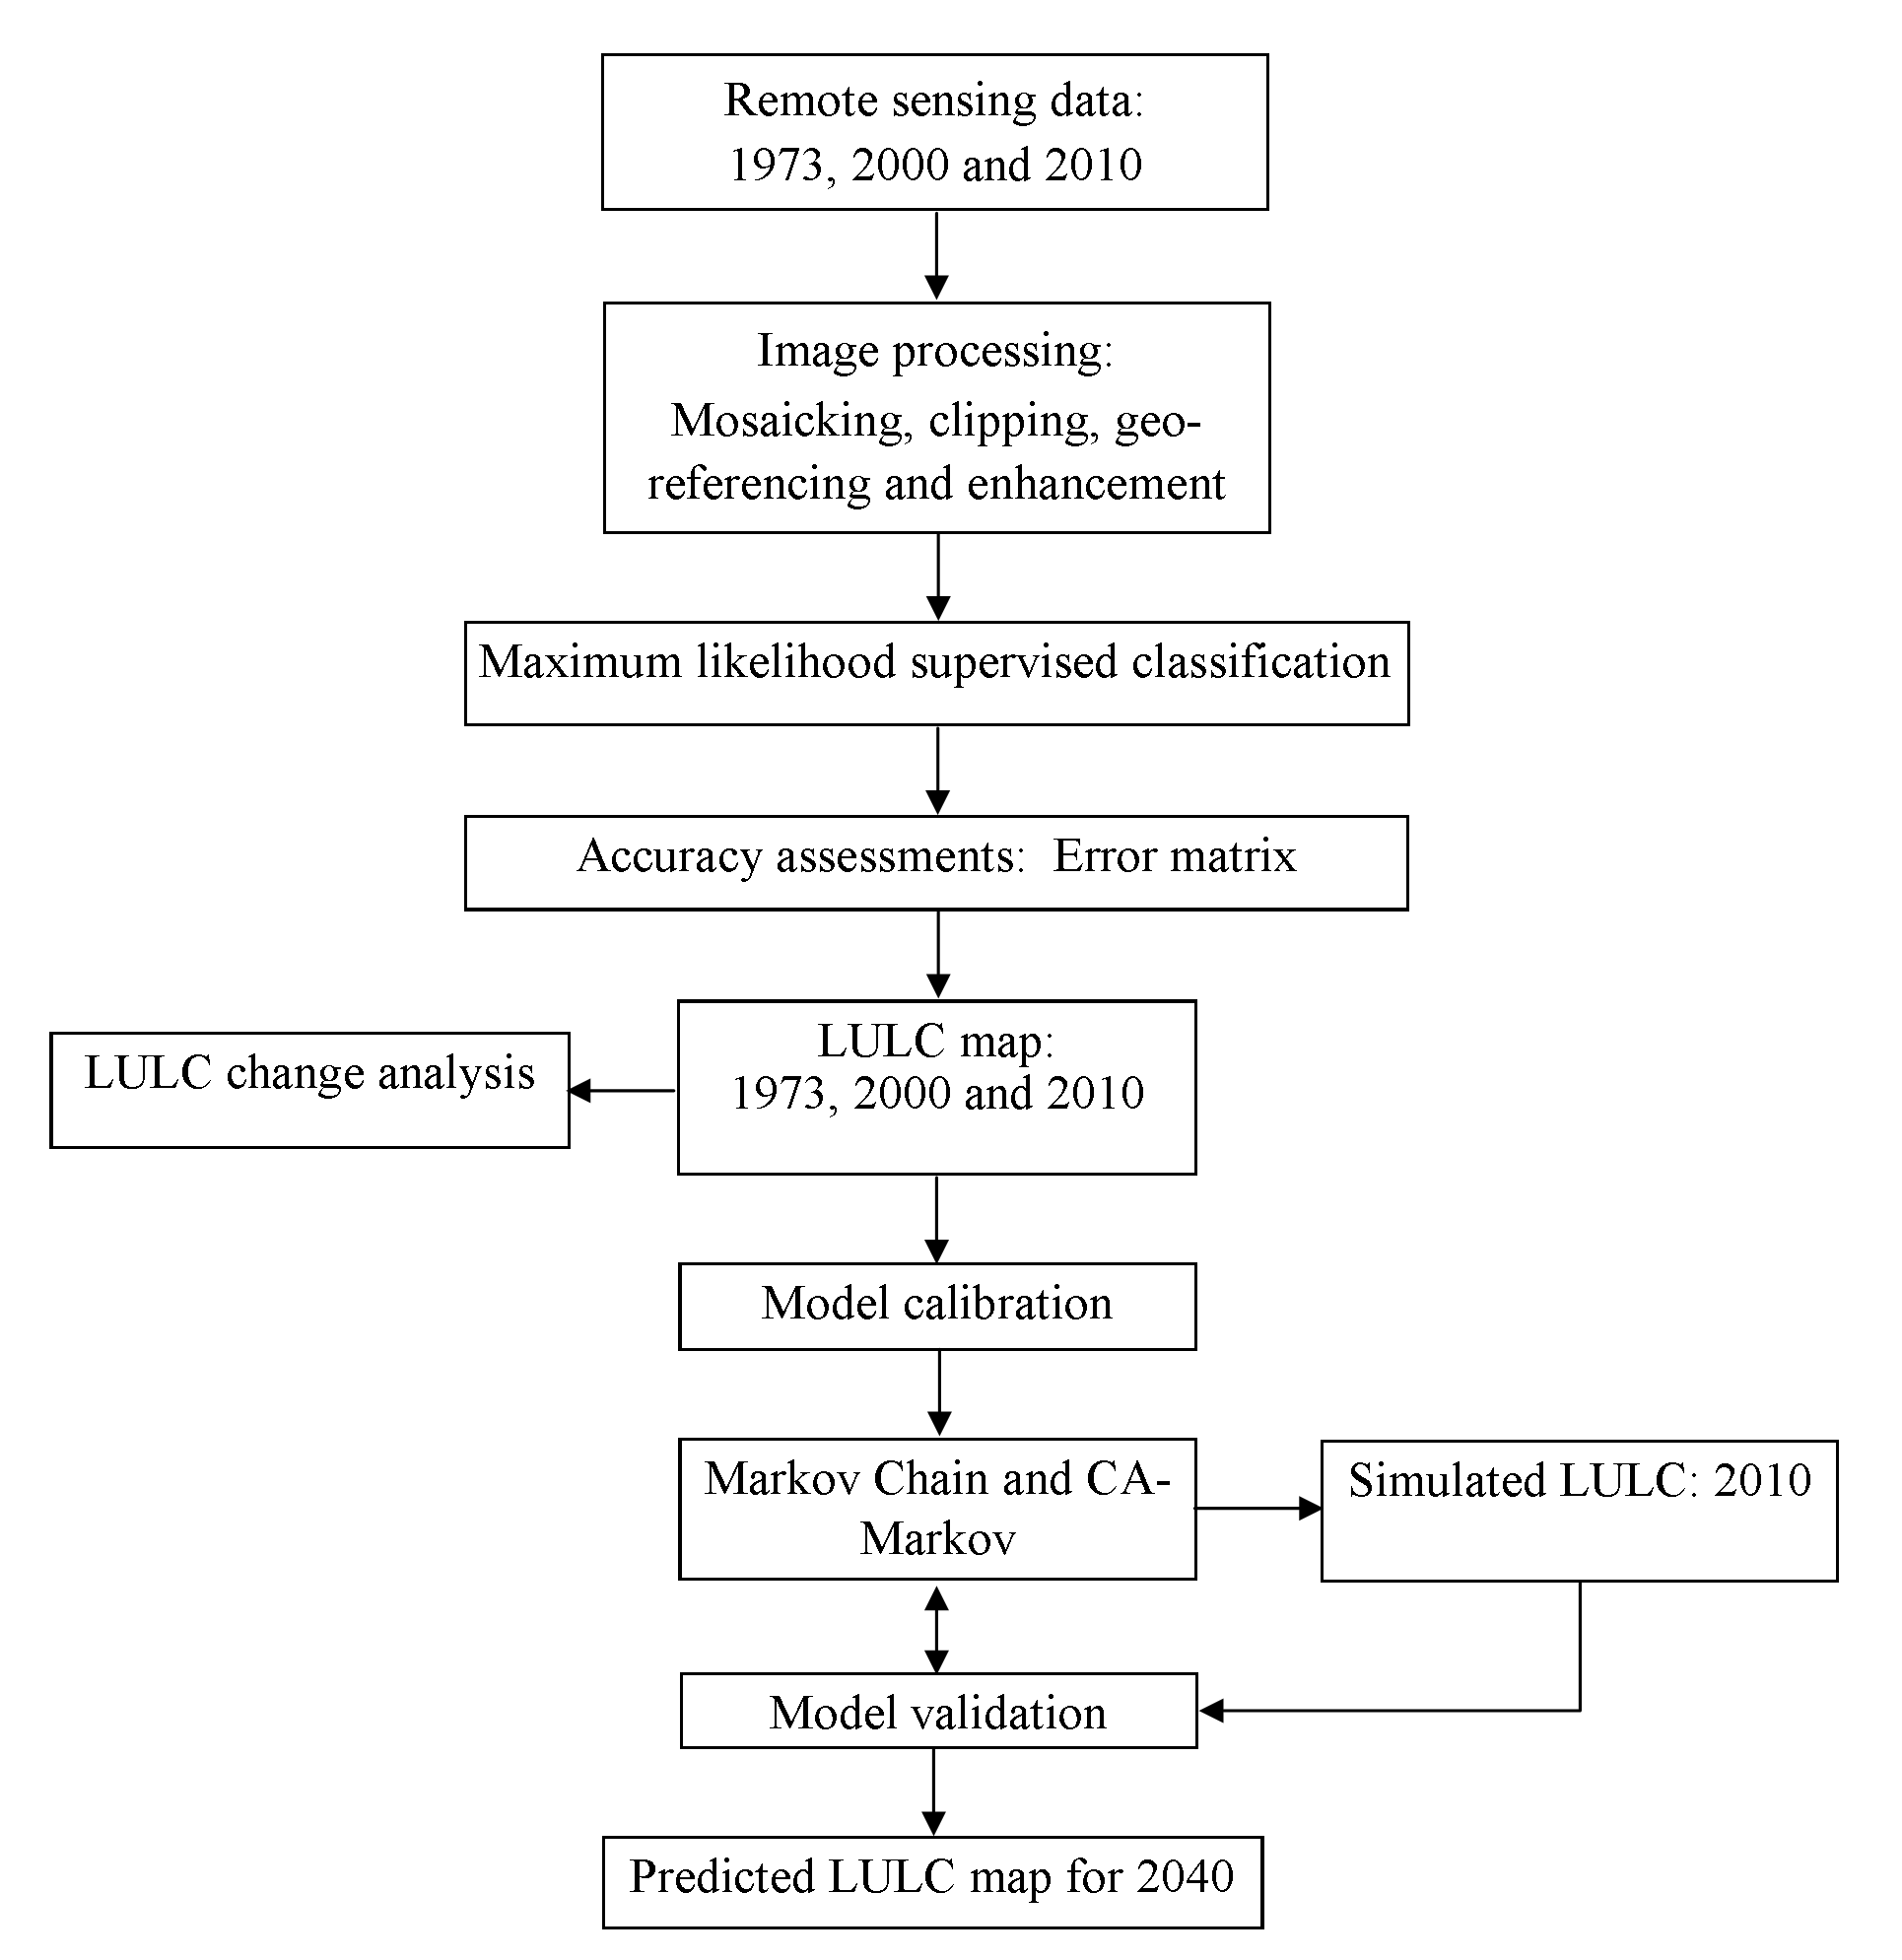
Table 1. Sensor, spatial resolution and acquisition
|
Sensor |
Spatial Resolution |
Acquisition time |
Producer |
|
MSS |
57m |
January 1973 |
EMA |
|
ETM |
30m |
January 2000 |
EMA |
|
ETM |
30m |
January 2010 |
EMA |
Ground Controls Points (GCPs) were collected by using Global Positioning System (GPS). Hence, Arc Map 10.5, ERDAS Imagine 2014, and IDRISI 32 software tools were used to make land-use modeling and future prediction. Besides, IBM SPSS statistics 20 and Microsoft Excel for tabulating and graphical representation were used.
2.3 Land Cover Nomenclatures
In order to make sample collection and classification easy, land cover nomenclatures are required to create and define the possible LULC classes first. Although the focus of the paper is on built-up areas, LULC map of the study areas was first generated using land cover classes presented in table 2. The LULC classes applied in this study were adopted from the classification used by European Environment Agency (EEA), Coordination of Information on the Environment (CORINE), which describes LULC (and partly land use) according to a nomenclature of 44 classes organized hierarchically in different levels. Moreover, due to the geographical location of the study area in Tropics, the CORINE land classes adopted was not entirely applied. It is a land cover class which is more applicable for Temperate and cold Polar Regions. In order to solve this challenge,
Table 2. Nomenclature of LULC classes
|
Land classes |
LULC |
Description |
|
C1 |
Forest land |
Natural and manmade forests, sparsely planted trees wood land shrubs. |
|
C2 |
Grass land |
Grass, shrubs, bushes. |
|
C3 |
Bare land |
Open fields with, little to without trees, beaches,,dunes, grass, sparsely vegetated areas and bare gravel. |
|
C4 |
Crop land |
Permanent crops. |
|
C5 |
Rural settlements |
Permanent residential discontinuous and constant urban fabric. |
|
C6 |
Urban and associated areas |
Residential, commercial units and industries, road and, other related property. |
AFRICOVER land cover classification system which is widely applied at East African Countries (Africover, 2002) was integrated. For the sake of simplicity, the researcher modified the descriptions of some of the land cover classes considering the land cover diversity of the study area. Six major land cover nomenclatures (forest land, grass land, bare land, crop land, rural settlement and urban areas) were used to produce the final LULC map of the study area.
2.4 Image Classification
It is known as the extraction from raw remotely sensed digital satellite data of distinct groups or themes, LULC categories. It is also a technique used to classify various features such as city land cover, plant forms, anthropogenic systems, mineral resources or improvements in all of, these characteristics of the satellite image. In order to increase the accuracy, of classification, it is important to choose the right classification process. This will also allow the analyst to successfully identify the land changes (Elnazir et al., 2004). The supervised classification technique was used in this analysis. Manual detection of the point of interest, the areas as a reference within the photographs is needed to conclude the spectral signature of the identifying features. This is one of the most common types of classification strategies in which all pixels with identical spectral values are automatically classified into ground cover groups. Classification and post-classification overlays and thematic land-cover change maps for the years 1973, 2000 and 2010 were developed by using supervised classifications for the study area. Six major LULC classes: rural settlement, urban and associated areas, bare land, crop land, grass land and forest land areas were performed to detect potential details for mapping the patterns and extents of LULC change as well as to find out the magnitude of changes between the years of interest years 1973, 2000, 2010 and predicted map of 2040.
3. Classification, Results And Validation
After a supervised classification has been carried out, the land cover maps as well as post-classification algorithms are performed as given in figure 3 to 5 and table 4 to 6. The accuracy of a categorized map must be measured and compared to the referenced data using an error matrix. The accuracy measurement in this analysis was rendered using the original mosaic image for the years 1973, 2000 and 2010.
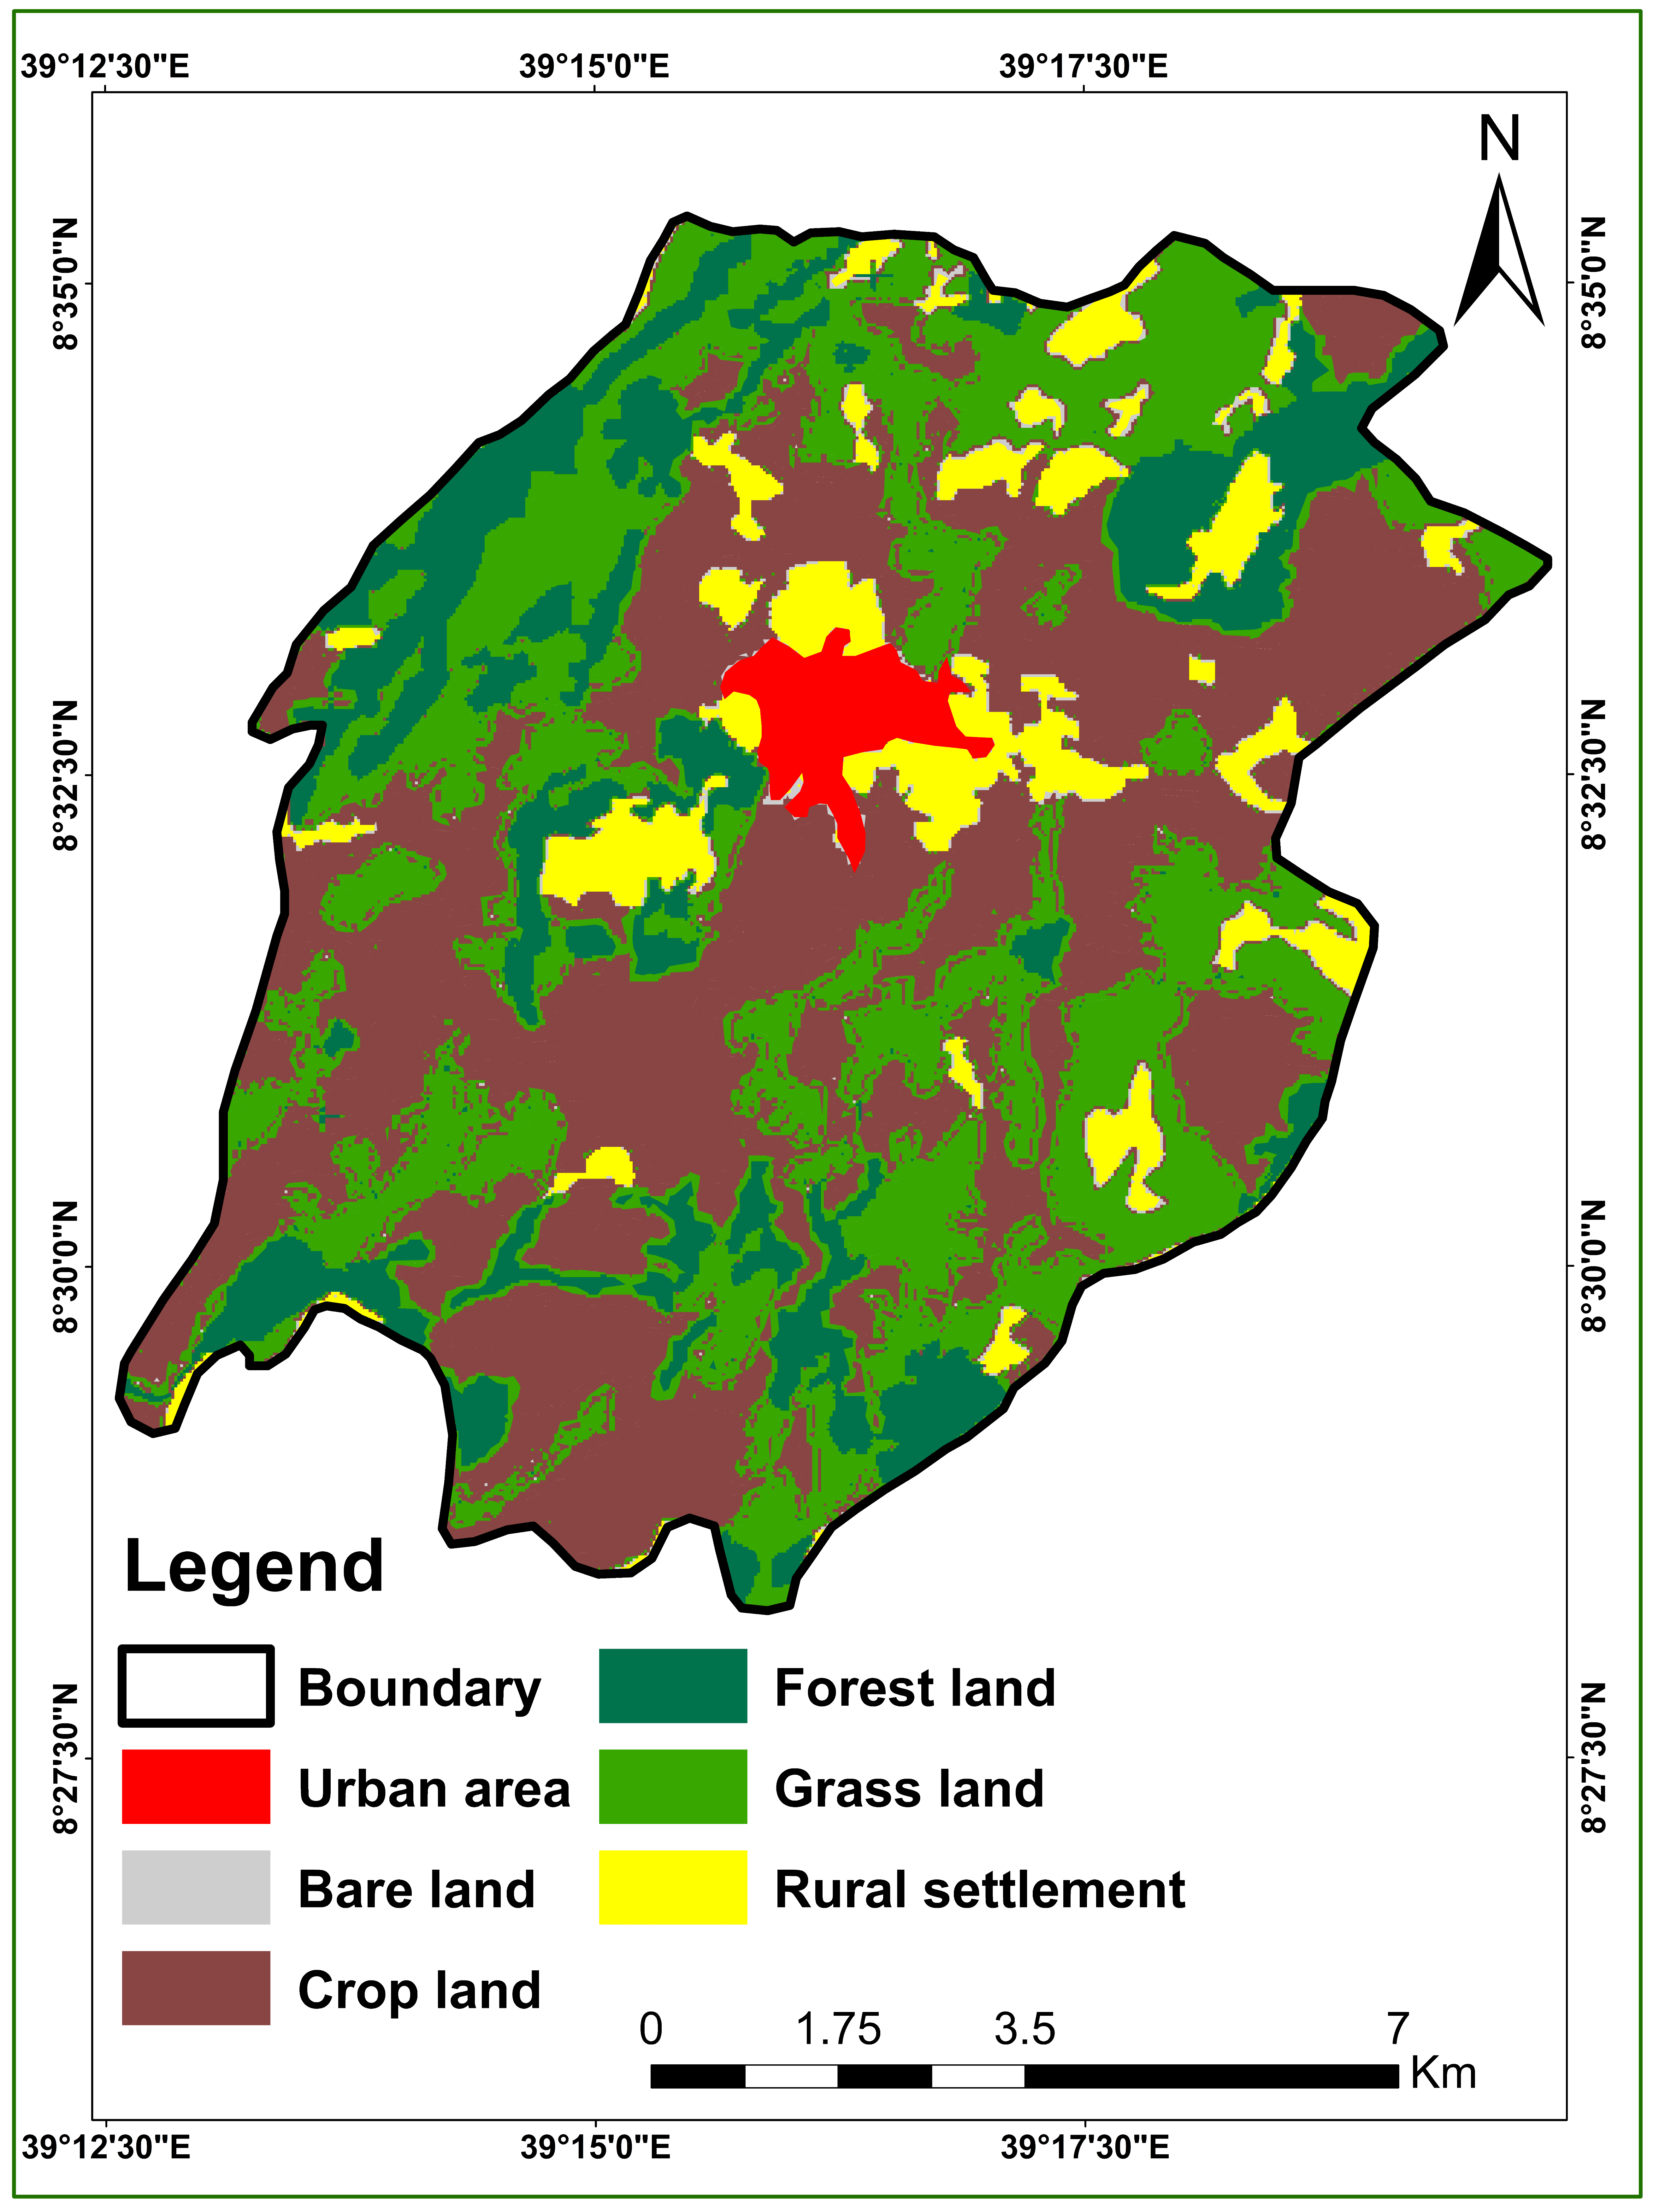
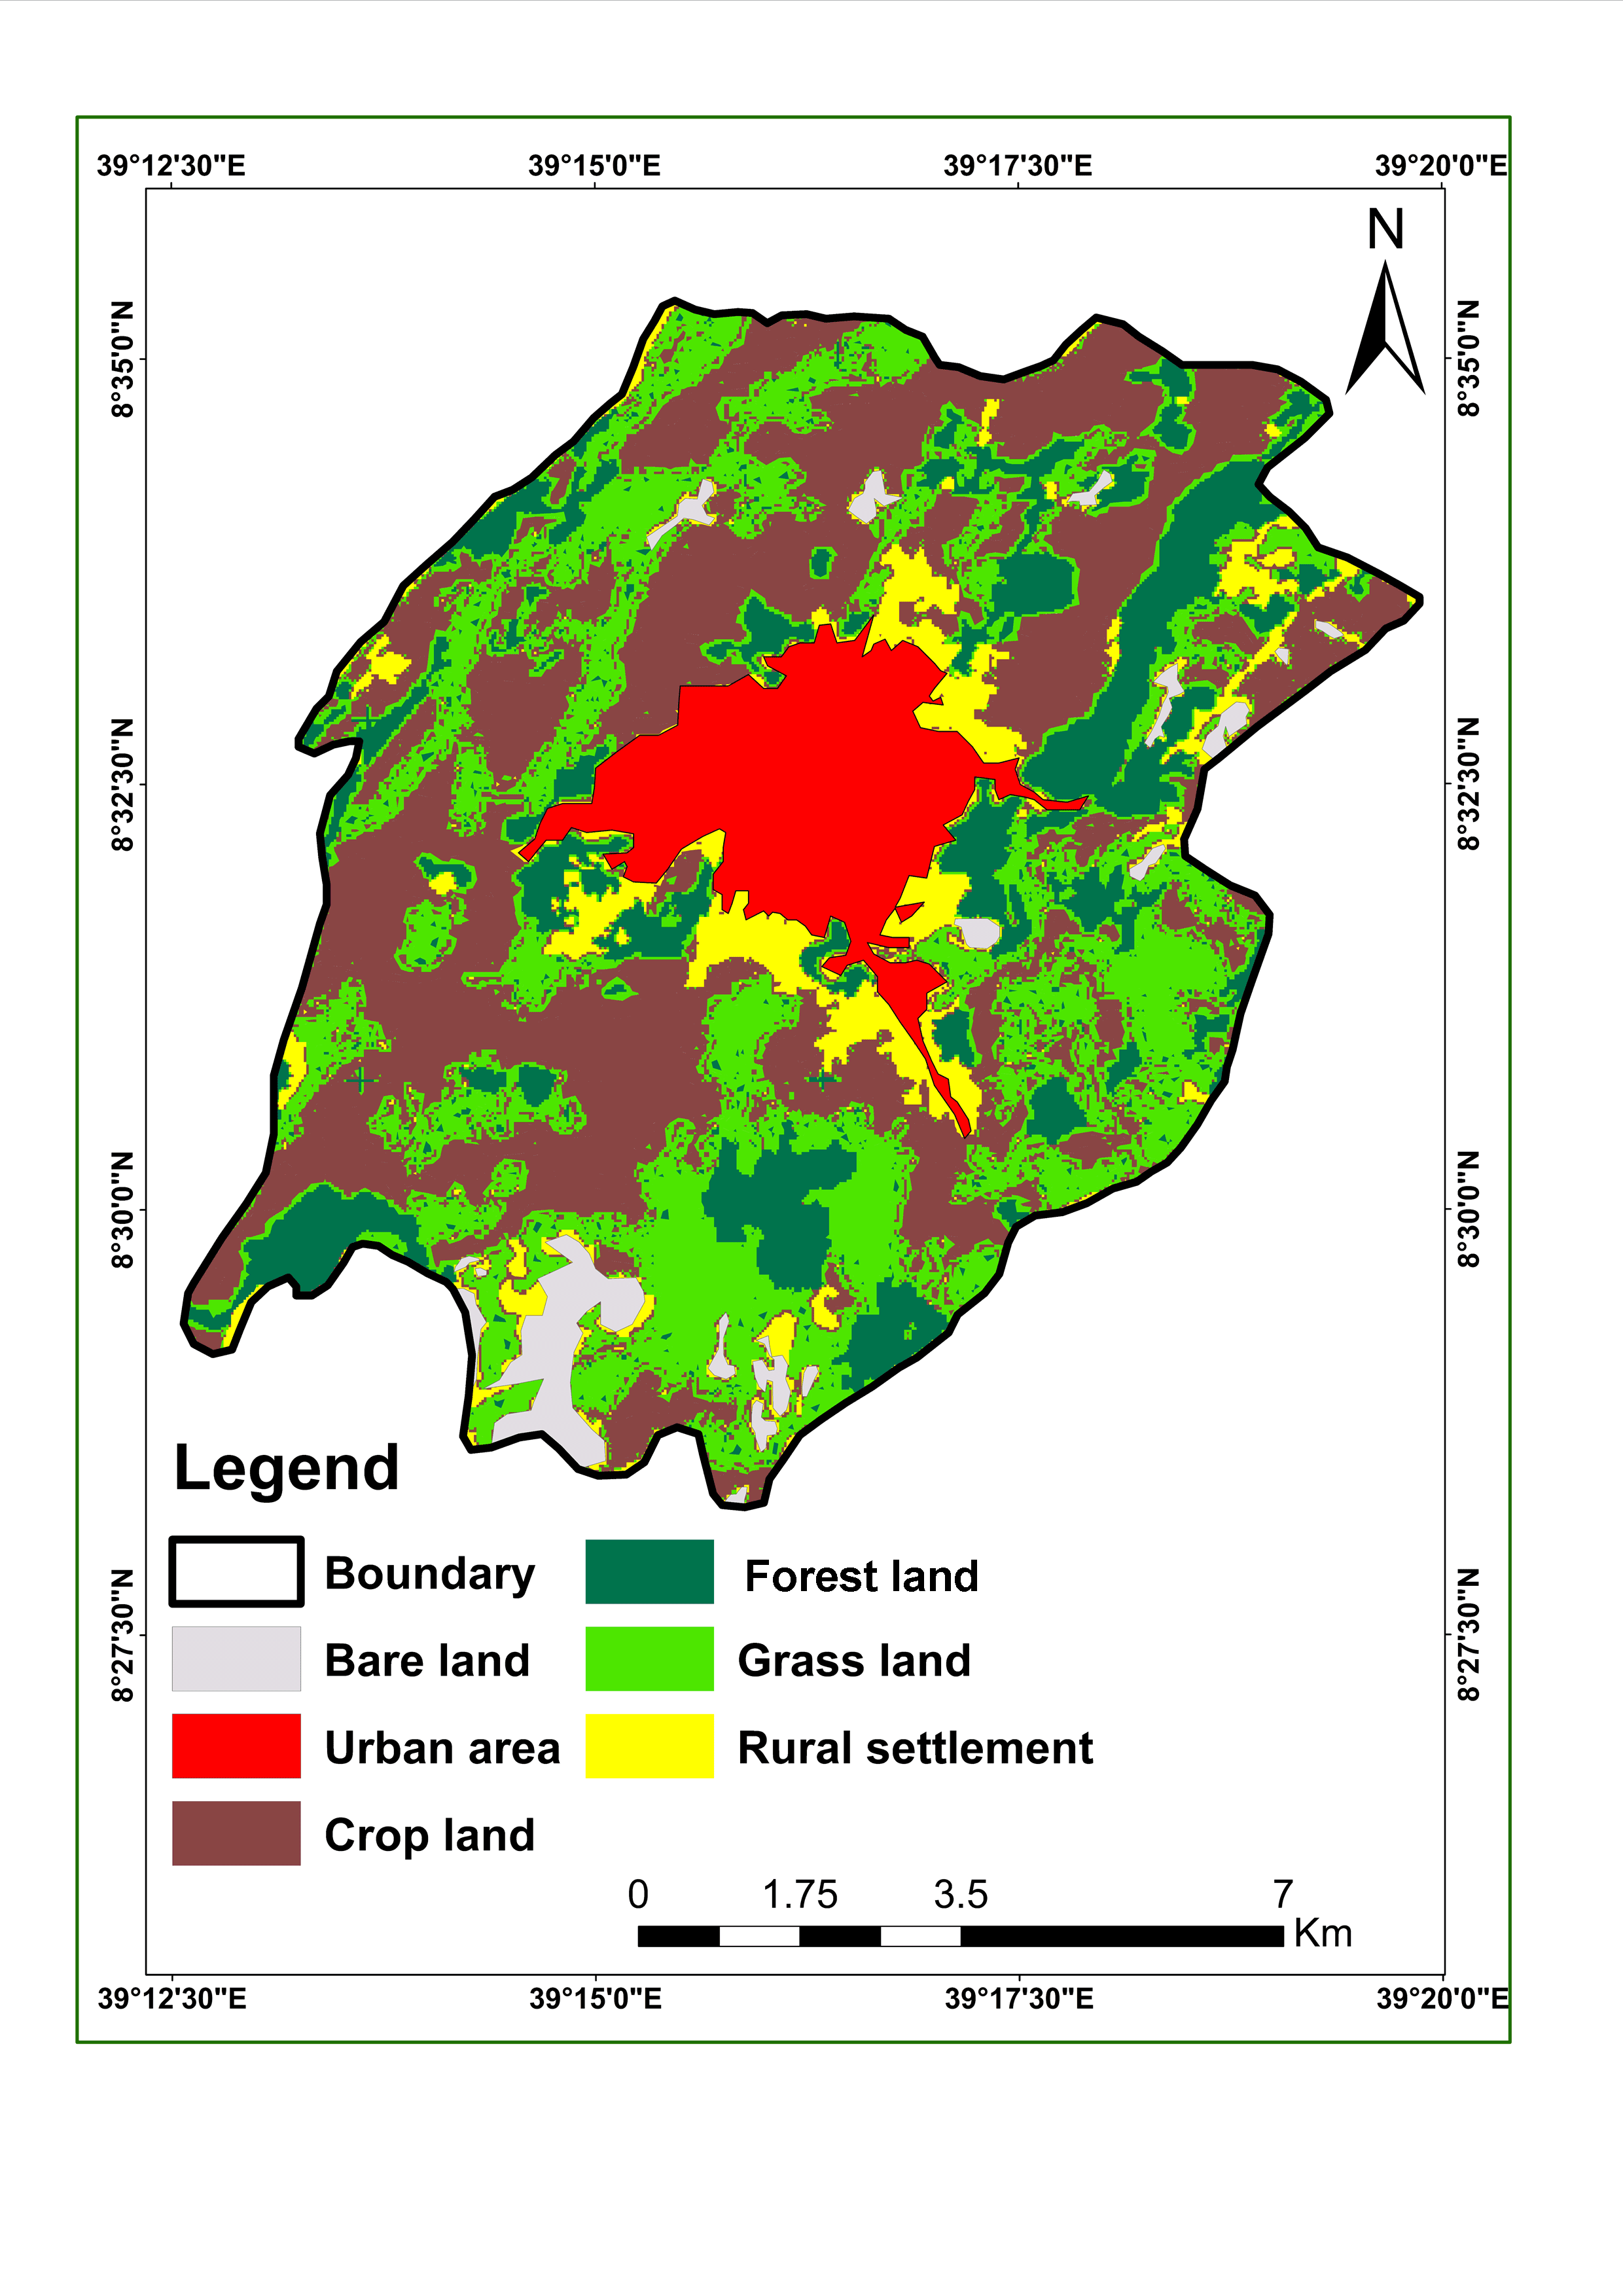
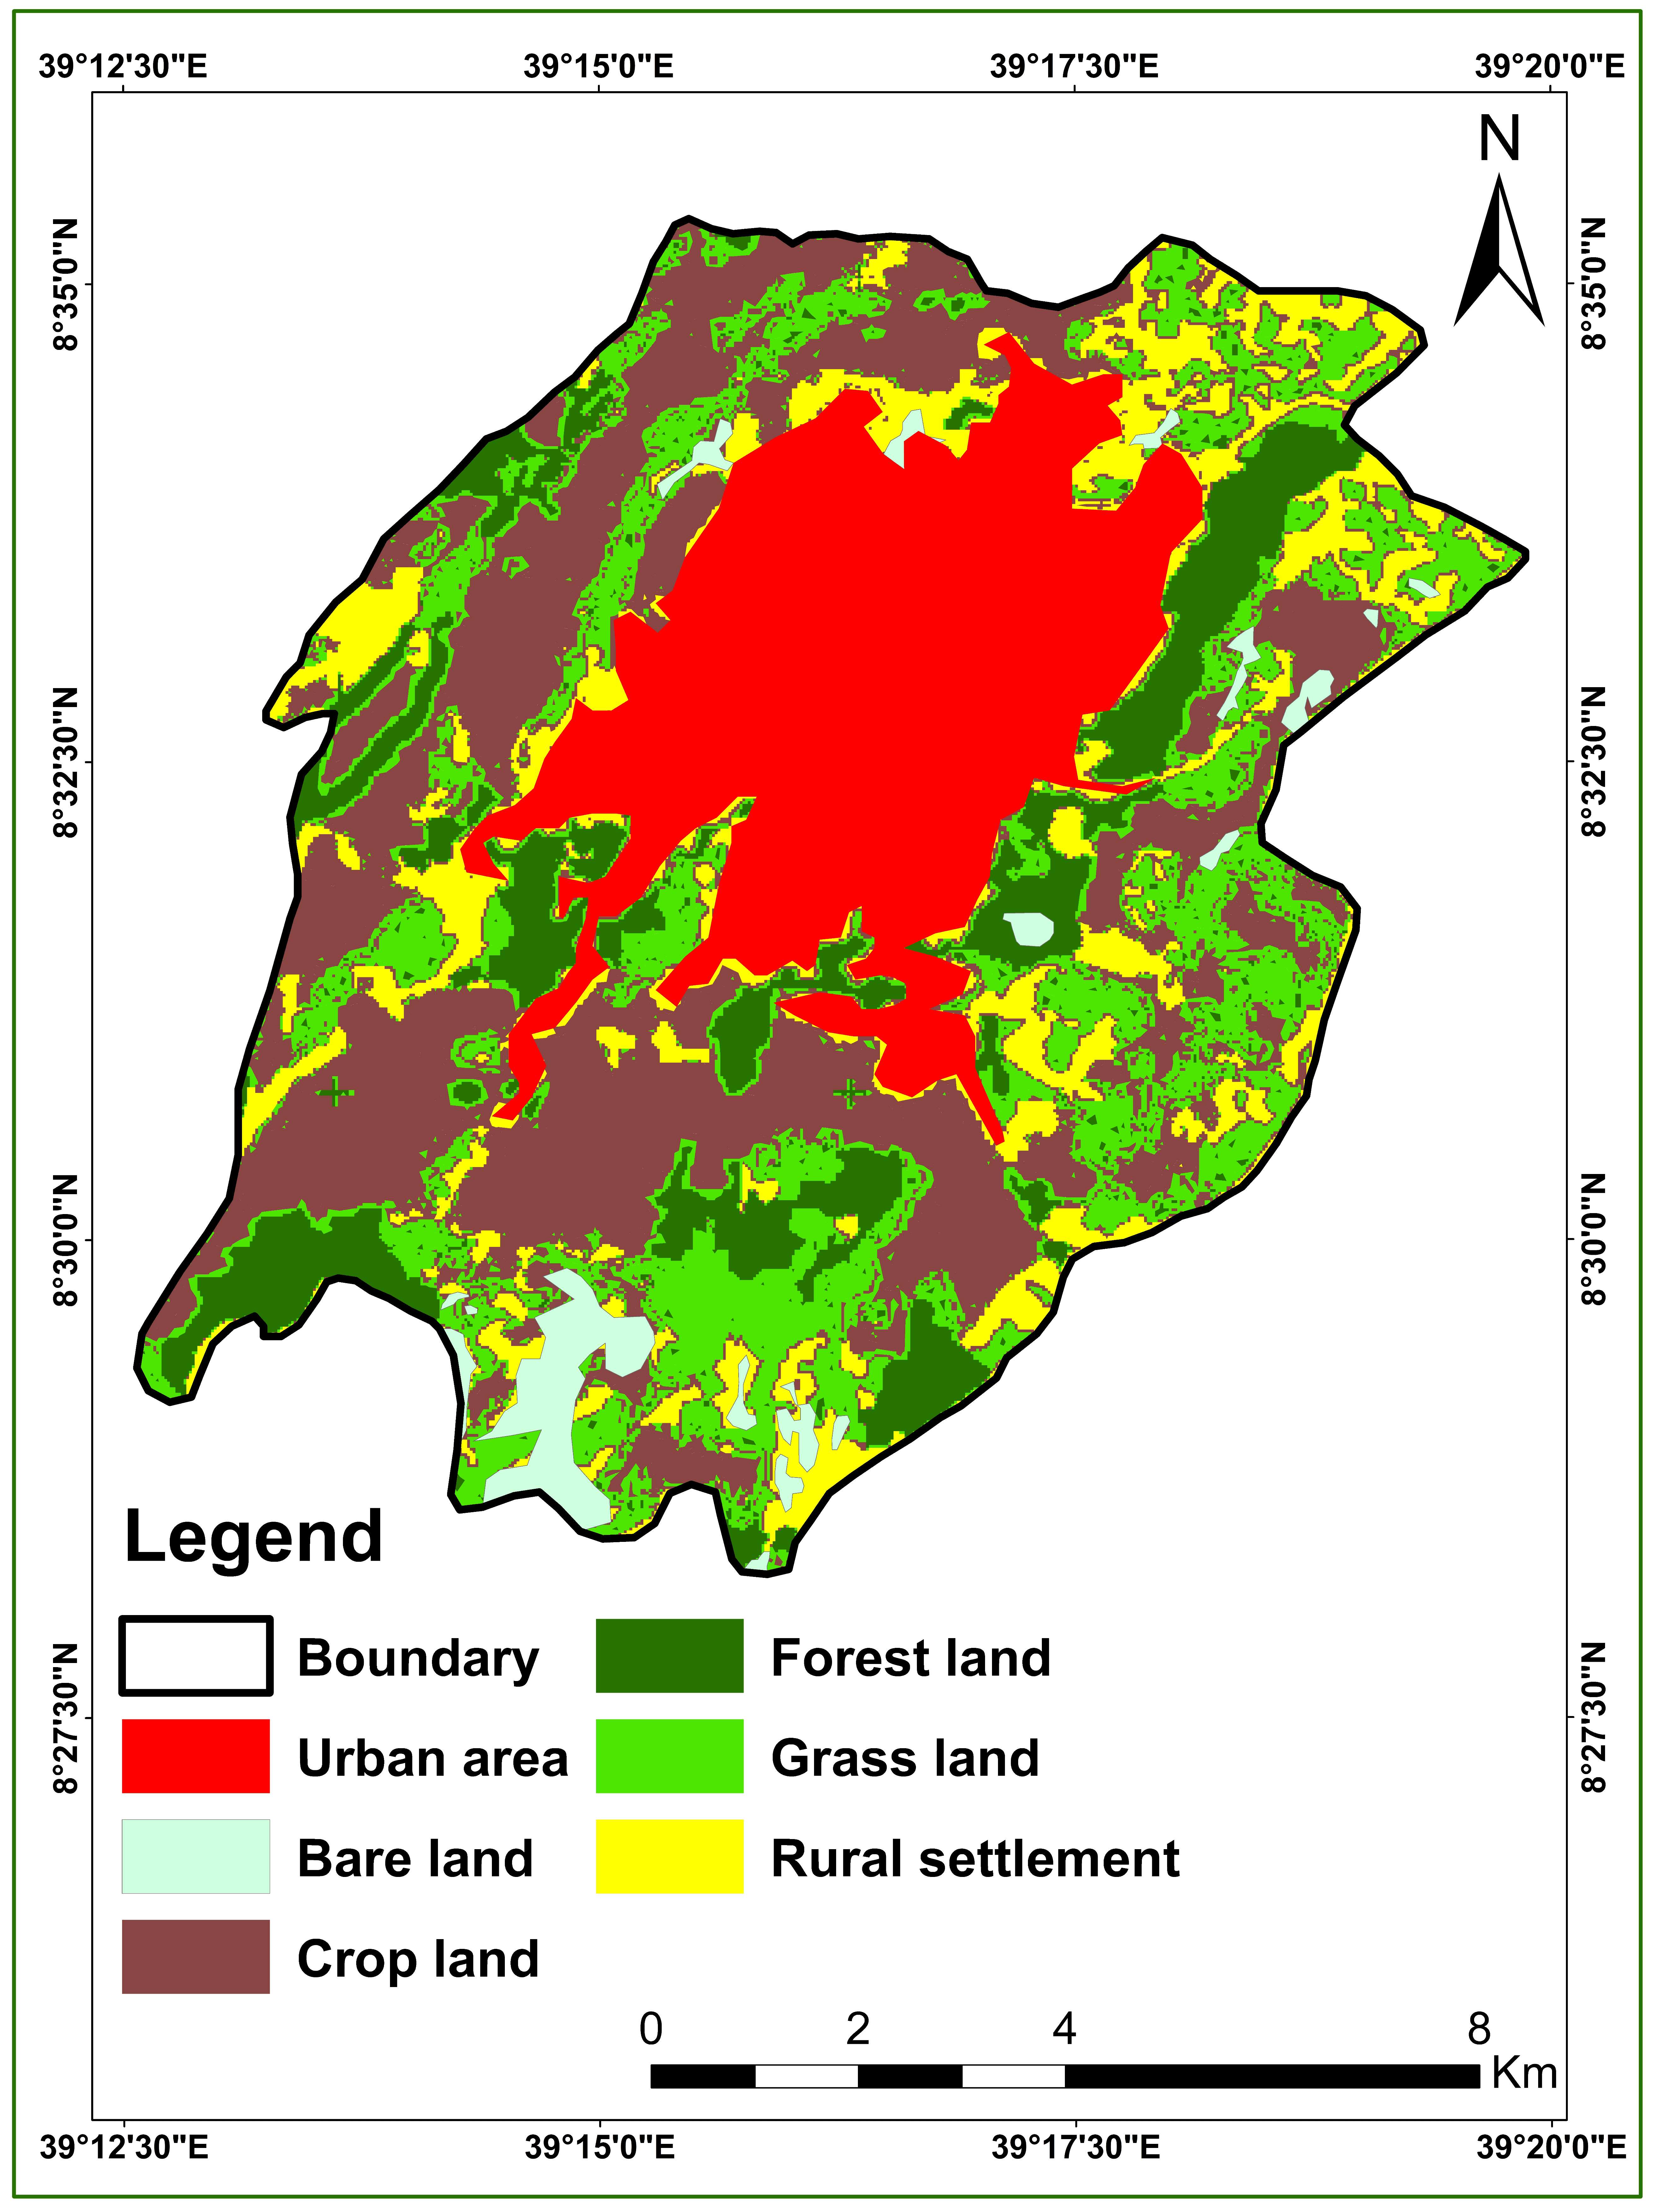
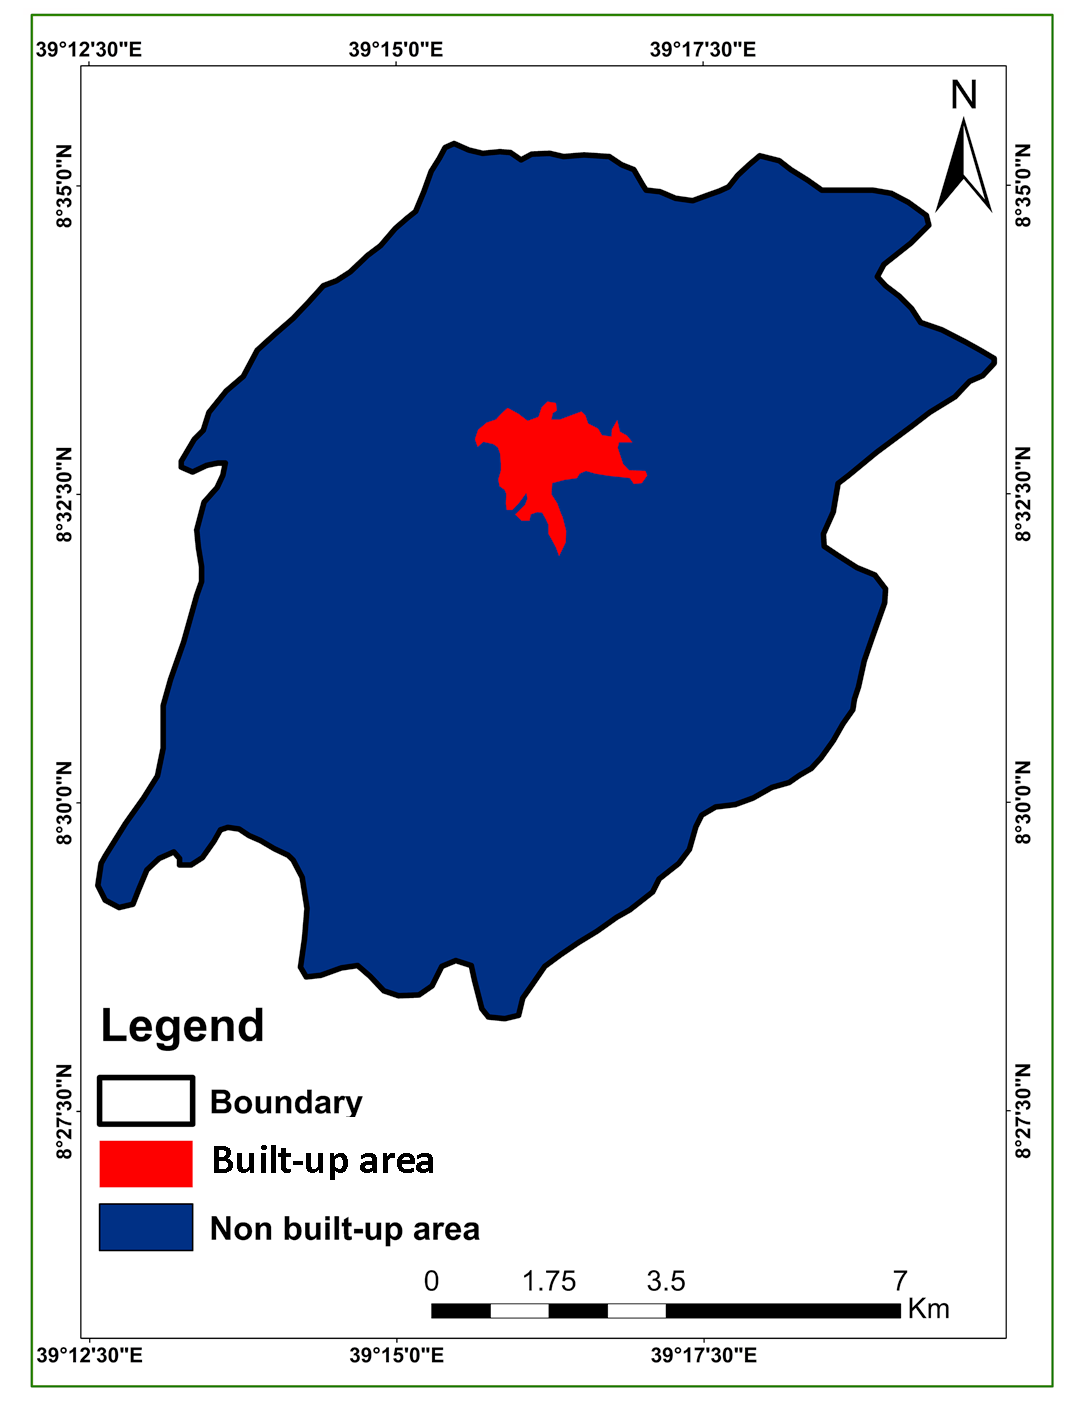
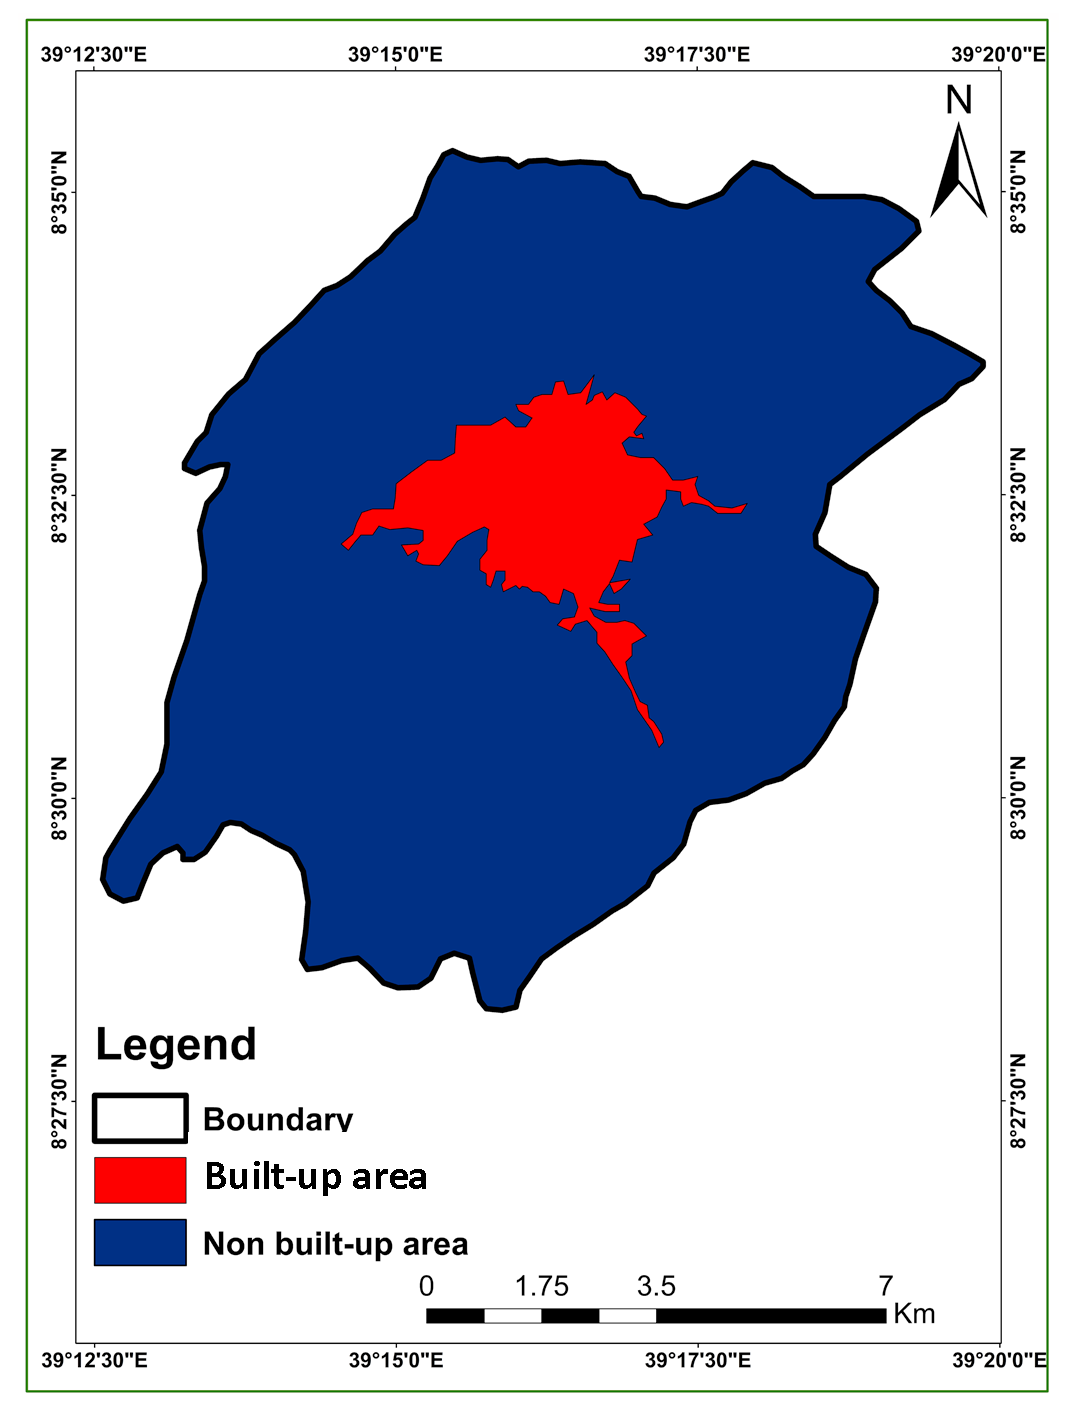
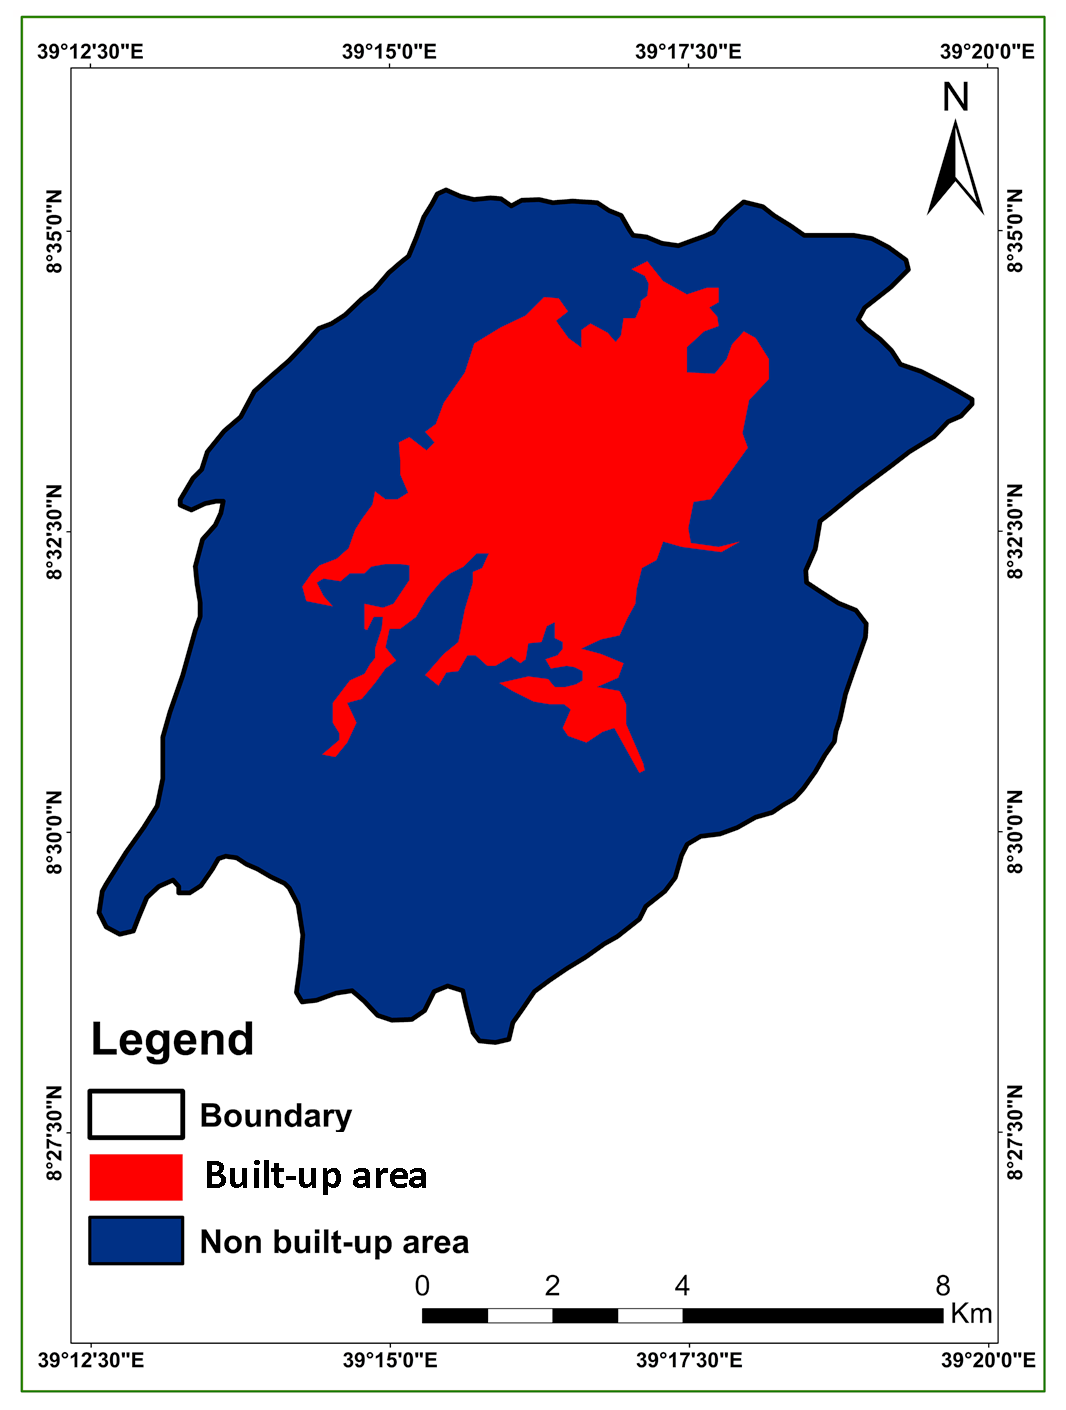
Table 3. Surface characteristics occur in various composite images
|
Features |
True Color RGB321 |
False Color RGB432 |
SWIR (GeoCover) RGB742 |
|
Trees and bushes |
Olive green red |
Olive green red |
Shades of green |
|
Crops |
Medium to light green |
Pink to red |
Shades of green |
|
Wetland vegetation |
Dark green to black |
Dark red |
Shades of green |
|
Water |
Shades of blue and green |
Shades of blue |
Black to dark blue |
|
Urban areas |
White to light blue |
Blue to gray |
Lavender |
|
Bare soil |
White to light gray |
Blue to gray |
Magenta, lavender or pale pink |
|
Clouds |
White |
White |
White-pink-lavender |
|
Snow/ice |
White |
Light green-blue |
Medium blue |
Table, 4. Confusion, matrix for LULC map:1973
|
Classified map LULC |
Reference map |
|||||||
|
Forest land |
Grass land |
Bare land |
Crop land |
Rural settlement |
Urban area |
Total |
User’s accuracy |
|
|
Forest land |
24 |
1 |
0 |
0 |
0 |
0 |
25 |
96% |
|
Grass land |
5 |
13 |
0 |
0 |
1 |
0 |
19 |
68.42% |
|
Bare land |
0 |
0 |
27 |
0 |
1 |
0 |
28 |
96.4% |
|
Crop land |
0 |
0 |
3 |
62 |
1 |
8 |
74 |
83.78% |
|
Rural Settlements |
0 |
0 |
0 |
2 |
14 |
0 |
16 |
87.5% |
|
Urban areas |
0 |
0 |
0 |
3 |
0 |
45 |
48 |
93.75% |
|
Total |
29 |
14 |
30 |
67 |
17 |
53 |
210 |
|
|
Producer’s accuracy |
82.2% |
92.8% |
90% |
93% |
82.35% |
84.9% |
||
|
Overall accuracy: 88.09% |
||||||||
Table 5. Confusion, matrix for LULC map: 2000
|
Classified map LULC |
Reference map |
|||||||
|
Forest land |
Grass land |
Bare land |
Crop land |
Rural settlements |
Urban area |
Total |
User’s accuracy |
|
|
Forest land |
26 |
3 |
0 |
0 |
0 |
0 |
29 |
89.6% |
|
Grass land |
1 |
13 |
0 |
0 |
0 |
0 |
14 |
92.8% |
|
Bare land |
0 |
0 |
27 |
3 |
0 |
0 |
30 |
90% |
|
Crop land |
0 |
0 |
0 |
63 |
0 |
4 |
67 |
94.2% |
|
Rural settlements Urban area Total Producer’s accuracy |
0 |
1 |
2 |
1 |
13 |
0 |
17 |
76.47% |
|
0 |
0 |
0 |
7 |
0 |
46 |
53 |
86.79% |
|
|
27 |
17 |
29 |
74 |
13 |
50 |
210 |
||
|
96.2% |
76.4% |
93.1 |
85.1% |
100% |
92% |
|||
|
Overall accuracy: 89.52% |
||||||||
Table 6. Confusion, matrix for LULC map:2010
|
Classified map LULC |
Referenced Map |
|||||||
|
Forest land |
Grassland |
Bare land |
Cropland |
Rural settlement |
Urban area |
Total |
User’s accuracy |
|
|
Forest land |
27 |
2 |
0 |
0 |
0 |
0 |
29 |
93.1% |
|
Grass land |
1 |
12 |
1 |
0 |
0 |
0 |
14 |
85.7% |
|
Bare land |
0 |
0 |
26 |
4 |
0 |
0 |
30 |
86.67% |
|
Crop land |
0 |
0 |
0 |
64 |
0 |
3 |
67 |
95.5% |
|
Rural settlements |
0 |
1 |
2 |
0 |
14 |
0 |
17 |
82.35% |
|
Urban land |
0 |
0 |
0 |
5 |
0 |
48 |
53 |
90.5% |
|
Total |
28 96.45% |
15 80% |
29 89.6% |
73 87.67% |
14 100% |
51 94.1% |
210 |
|
|
Producer’s accuracy |
||||||||
|
Overall accuracy: 90.95% |
||||||||
3.1 User’s Accuracy
The findings of user’s accuracy show that in 1973, the highest class accuracy (96%) for forest land and bare land and the minimum accuracy was estimated for grass lands (68.42%) (Table 4). Class precision ranged from 76.47% to 94.2% in 2000, although it ranged from 82.35% to 95.5% in 2010. The lowest, values of class accuracy were reported due to spectral similarity with other classes. As seen in table 4, 5 and 6, the lowest value was observed for grass land during the time of 1973 (68%) and the rural settlements for the years 2000 and 2010 with 76.47% and 82.35%, respectively. In addition, the resolution of Landsat data may have an impact on the classification of the image.
3.2 Producer’s Accuracy
The precision relates to the producers is number of pixels properly identified in each class divided by the total number of pixels of the class (total column). The highest values were for crop land, 93% (Table 4) and for rural settlement, 100% (Table 5 and 6).
3.3 Overall Accuracy
As shown in table 4, 5 and 6, the overall accuracies were 88.09% in 1973, 89.52% in 2001, and 90.95 % in 2010, respectively. Anderson et al. (1976) stated that the determined minimum average accuracy should be 85% for a consistent ground cover classification. However, Foody (2002) has demonstrated that it is not appropriate in the sense of a global norm for actual applications. In addition, Lu et al. (2004) claimed that the accuracy of change detection depends on the availability and consistency of ground truth data, the sophistication of the research region, landscape, the detection strategies used as well as classification and change detection schemes.
3.4 LULC Changes and Statistical Analysis
For the three study periods, the images are quantified and the results are presented in Table 7. From this table, urban areas have been increased with values of 2%, 9.6%, and 23% in 1973, 2000 and 2010, respectively.
Bare land has been increased between study periods (Table 7). It increases 3.4% in 1973 to 3.8 % in 2000 to 6.7% in 2010 and rural settlement 5.3% in 1973 to 5.2 % in 2000 (decreased), 5.2% in 2000 to 6% in 2010. The cropland decreases by 3% from 1973 to 2000 and 9.8% from 2000 to 2010. Forest land and grass lands were decreased in the study periods. Forest lands decreased from 16.1% (1973) to 15.3 % (2000) and by 12.8% in 2010; grass land decreased from 26.8% to 22.7%, and to17.9% in the same period.
Table 7. LULC in Adama city
|
LULC |
1973 |
2000 |
2010 |
|||
|
ha |
% |
ha |
% |
ha |
% |
|
|
Forest land |
2188.9 |
16.05 |
2086.6 |
15.3 |
1747.9 |
12.81 |
|
Grass land |
3658.1 |
26.83 |
3091.44 |
22.67 |
2438.9 |
17.89 |
|
Bare land |
465.24 |
3.41 |
521.2 |
3.82 |
916.84 |
6.72 |
|
Crop land |
6332.3 |
46.44 |
5917.9 |
43.4 |
4575.5 |
33.56 |
|
Rural settlements |
718.9 |
5.27 |
710.2 |
5.21 |
816.3 |
6 |
|
Urban area |
271.8 |
2.00 |
1307.9 |
9.6 |
3139.8 |
23.02 |
|
Total |
13635.24 |
100 |
13635.24 |
100 |
13635.24 |
100 |
3.5 LULC Changes: Built-up Areas
In table 8, the percentage of built-up areas in 1973 was 2% and 10% in 2000 which was 8% more than last records. It was 23% in 2010. The figure 6 a, b and c illustrated that there had been a rapid shift in land use from unconstructed areas to built-up area. During this study period, crop lands were the most diverse group that led to the rise in built-up areas.
Table 8. Built-up and non-built-up areas: 1973-2010
|
LULC |
1973 |
2000 |
2010 |
|||
|
ha |
% |
ha |
% |
ha |
% |
|
|
Built up area |
271.84 |
2% |
1307.88 |
10% |
3139.77 |
23% |
|
Non built-up area |
13363.4 |
98% |
12327.36 |
90% |
10495.47 |
77% |
|
Total |
13635.24 |
100 |
13635.24 |
100 |
13635.24 |
100 |
3.6 LULC Change Analysis: Gains and Losses
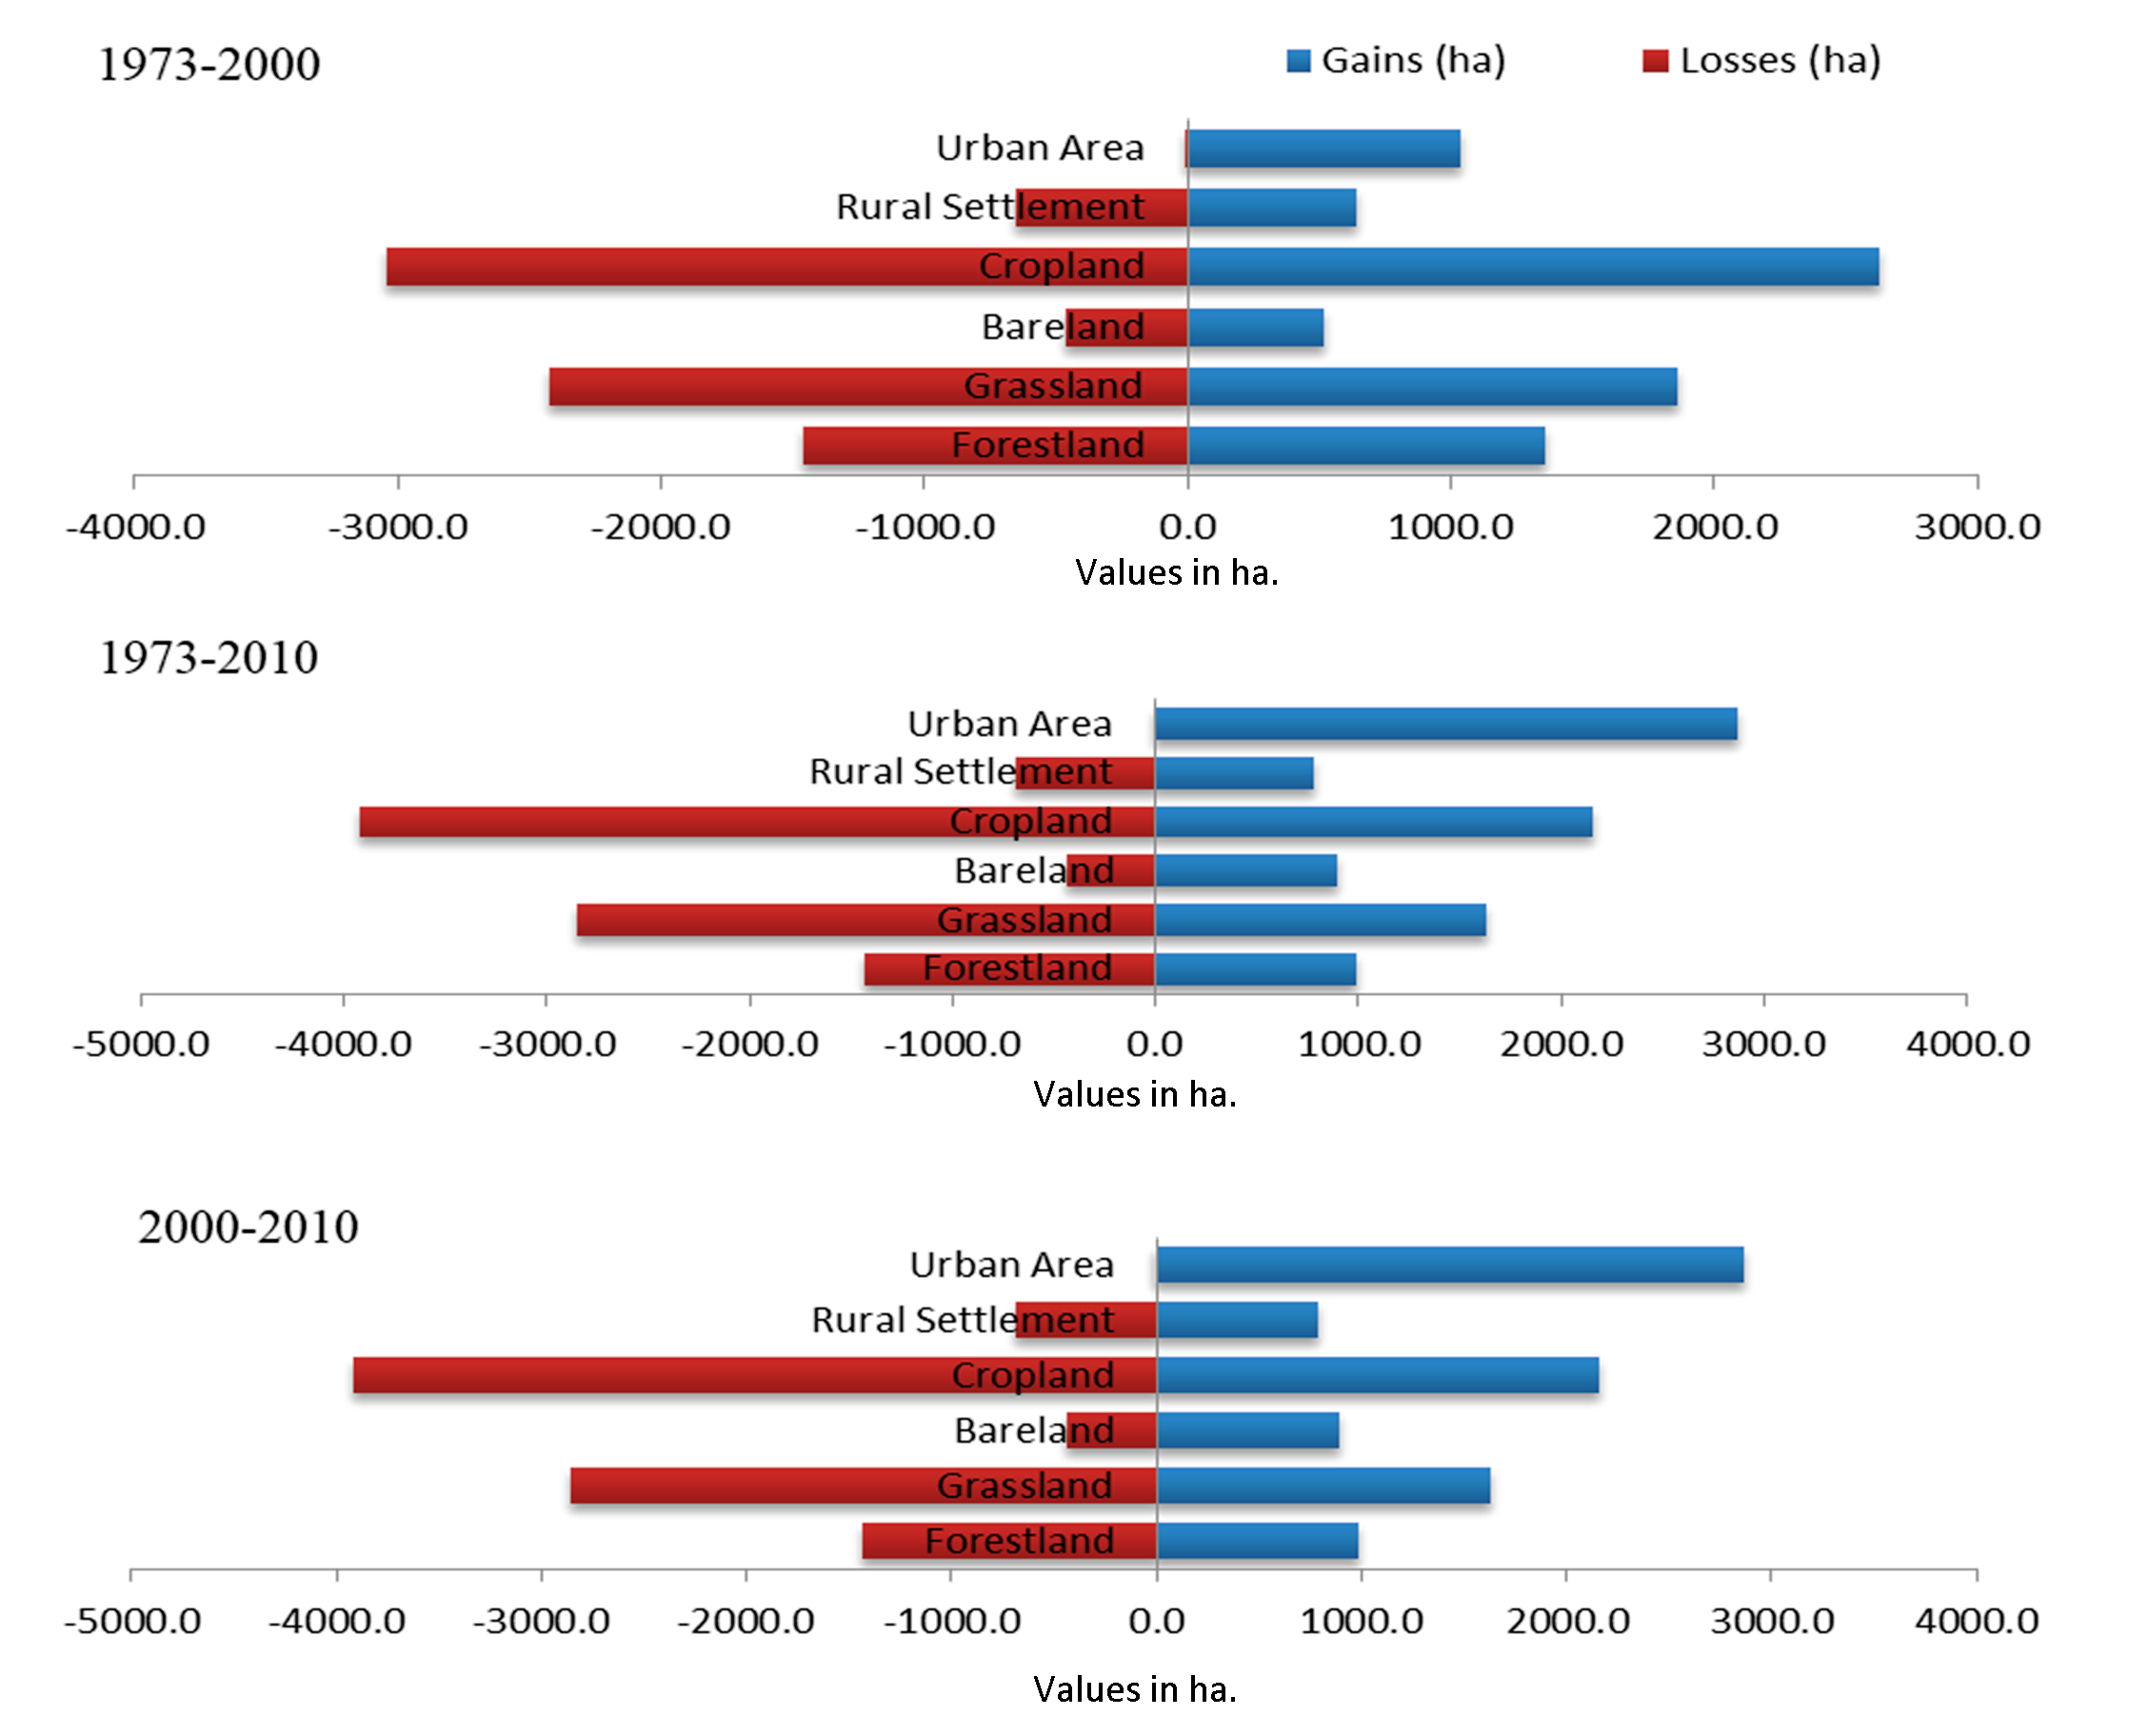
From 1973 to 2000, the total built-up areas increased by 1040.3ha (7.63 %) and lost by 4.2 ha (0.03 %) and net change was of 1036 ha (7.60%) while rural settlement decreased 654.4 ha (4.79%) and gained 645.8 ha with a net loss of 8.6 ha. Similarly, crop land lost was 3043.4 ha (22.32%) and gained 2629 ha (19.28%). Bare land increased by 521 ha and lost by 465.1 ha (3.411%), and net change of 55.9 ha increasing by 0.4%. Forest land decreases by 1462.7 ha (10.72%) and gained 1360.4 ha (9.977%). Similarly, grass land decreased by 2425.1 ha (Figure 7).
3.7 Net Changes in LULC: 1973-2010
Net change is the difference between gain and loss area under different classes of LULC identified in the study area. Urban area was increased through the study periods 7.6% (1973-2000) and 13.44% (2000-2010) (Table 9) crop land which is highly converted into urban area and decreased 3.03% (1973-2000) and 12.89% (2000-2010). Bare land increased 0.4% (1973-2000) to 3.3% (2000-2010), grass land decreased from 4.15% (1973-2000) to 8.94% (2000-2010), forest land decreased from 0.75% (1973-2000) to 3.23% (2000-2010) and rural settlements has net loss of 0.06% (1973-2000) and net gain of 0.69% (2000-2010).
Table 9. Net changes of LULC: 1973-2010
|
LULC |
Change (1973-2000) |
Change (2000-2010) |
||
|
ha |
% |
ha |
% |
|
|
Forest land |
-102.3 |
-0.75 |
-441.5 |
-3.23 |
|
Grass land |
-2322.8 |
-17.3 |
-1219 |
-8.94 |
|
Bare land |
55.9 |
0.40 |
451.5 |
3.3 |
|
Crop land |
-414.4 |
-3.03 |
-1758.7 |
-12.898 |
|
Rural settlements |
-8.7 |
-0.06 |
94.3 |
0.69 |
|
Urban area |
1036. |
7.79 |
1831.9 |
13.43 |
3.8 Markovian Conditional Probability Land Covers Prediction
In Markovian systems, the future state in time, t2 can be modeled on the basis of the immediately preceding state time t1. Therefore, the potential condition can be estimated not on the basis of the past but rather of the current. In the past and the future are different (Eastman, 2009). Firstly, two calibration periods i.e. 1973-2000 and 2000-2010 were correspondent and considered simulation results were pre-analyzed in terms of goodness of fit. Markov chain produces a transition matrix (Table 10), a transition area matrix (Table 11) and a set of conditional probability images by analyzing two qualitative land cover images (Figure 8) for two different periods (1973 and 2000). The transfer probability matrix (Table 10) indicates the possibility that each ground cover category will move to other categories in 2010. (Table 11) represents the number of pixels ( \(30 \times 30\) m) that will be converted over time from one level of land cover to another level. Markov Chain Analysis also generates similar conditional probability images (Figure 8) with the aid of transformation probability matrices. This image considered conditional since the likelihood depends on the current state. These images that have been modeled from the two previous land cover change images are useful for estimating possible land cover changes. Each conditional probability picture shows the possibility of going to another type of land cover.
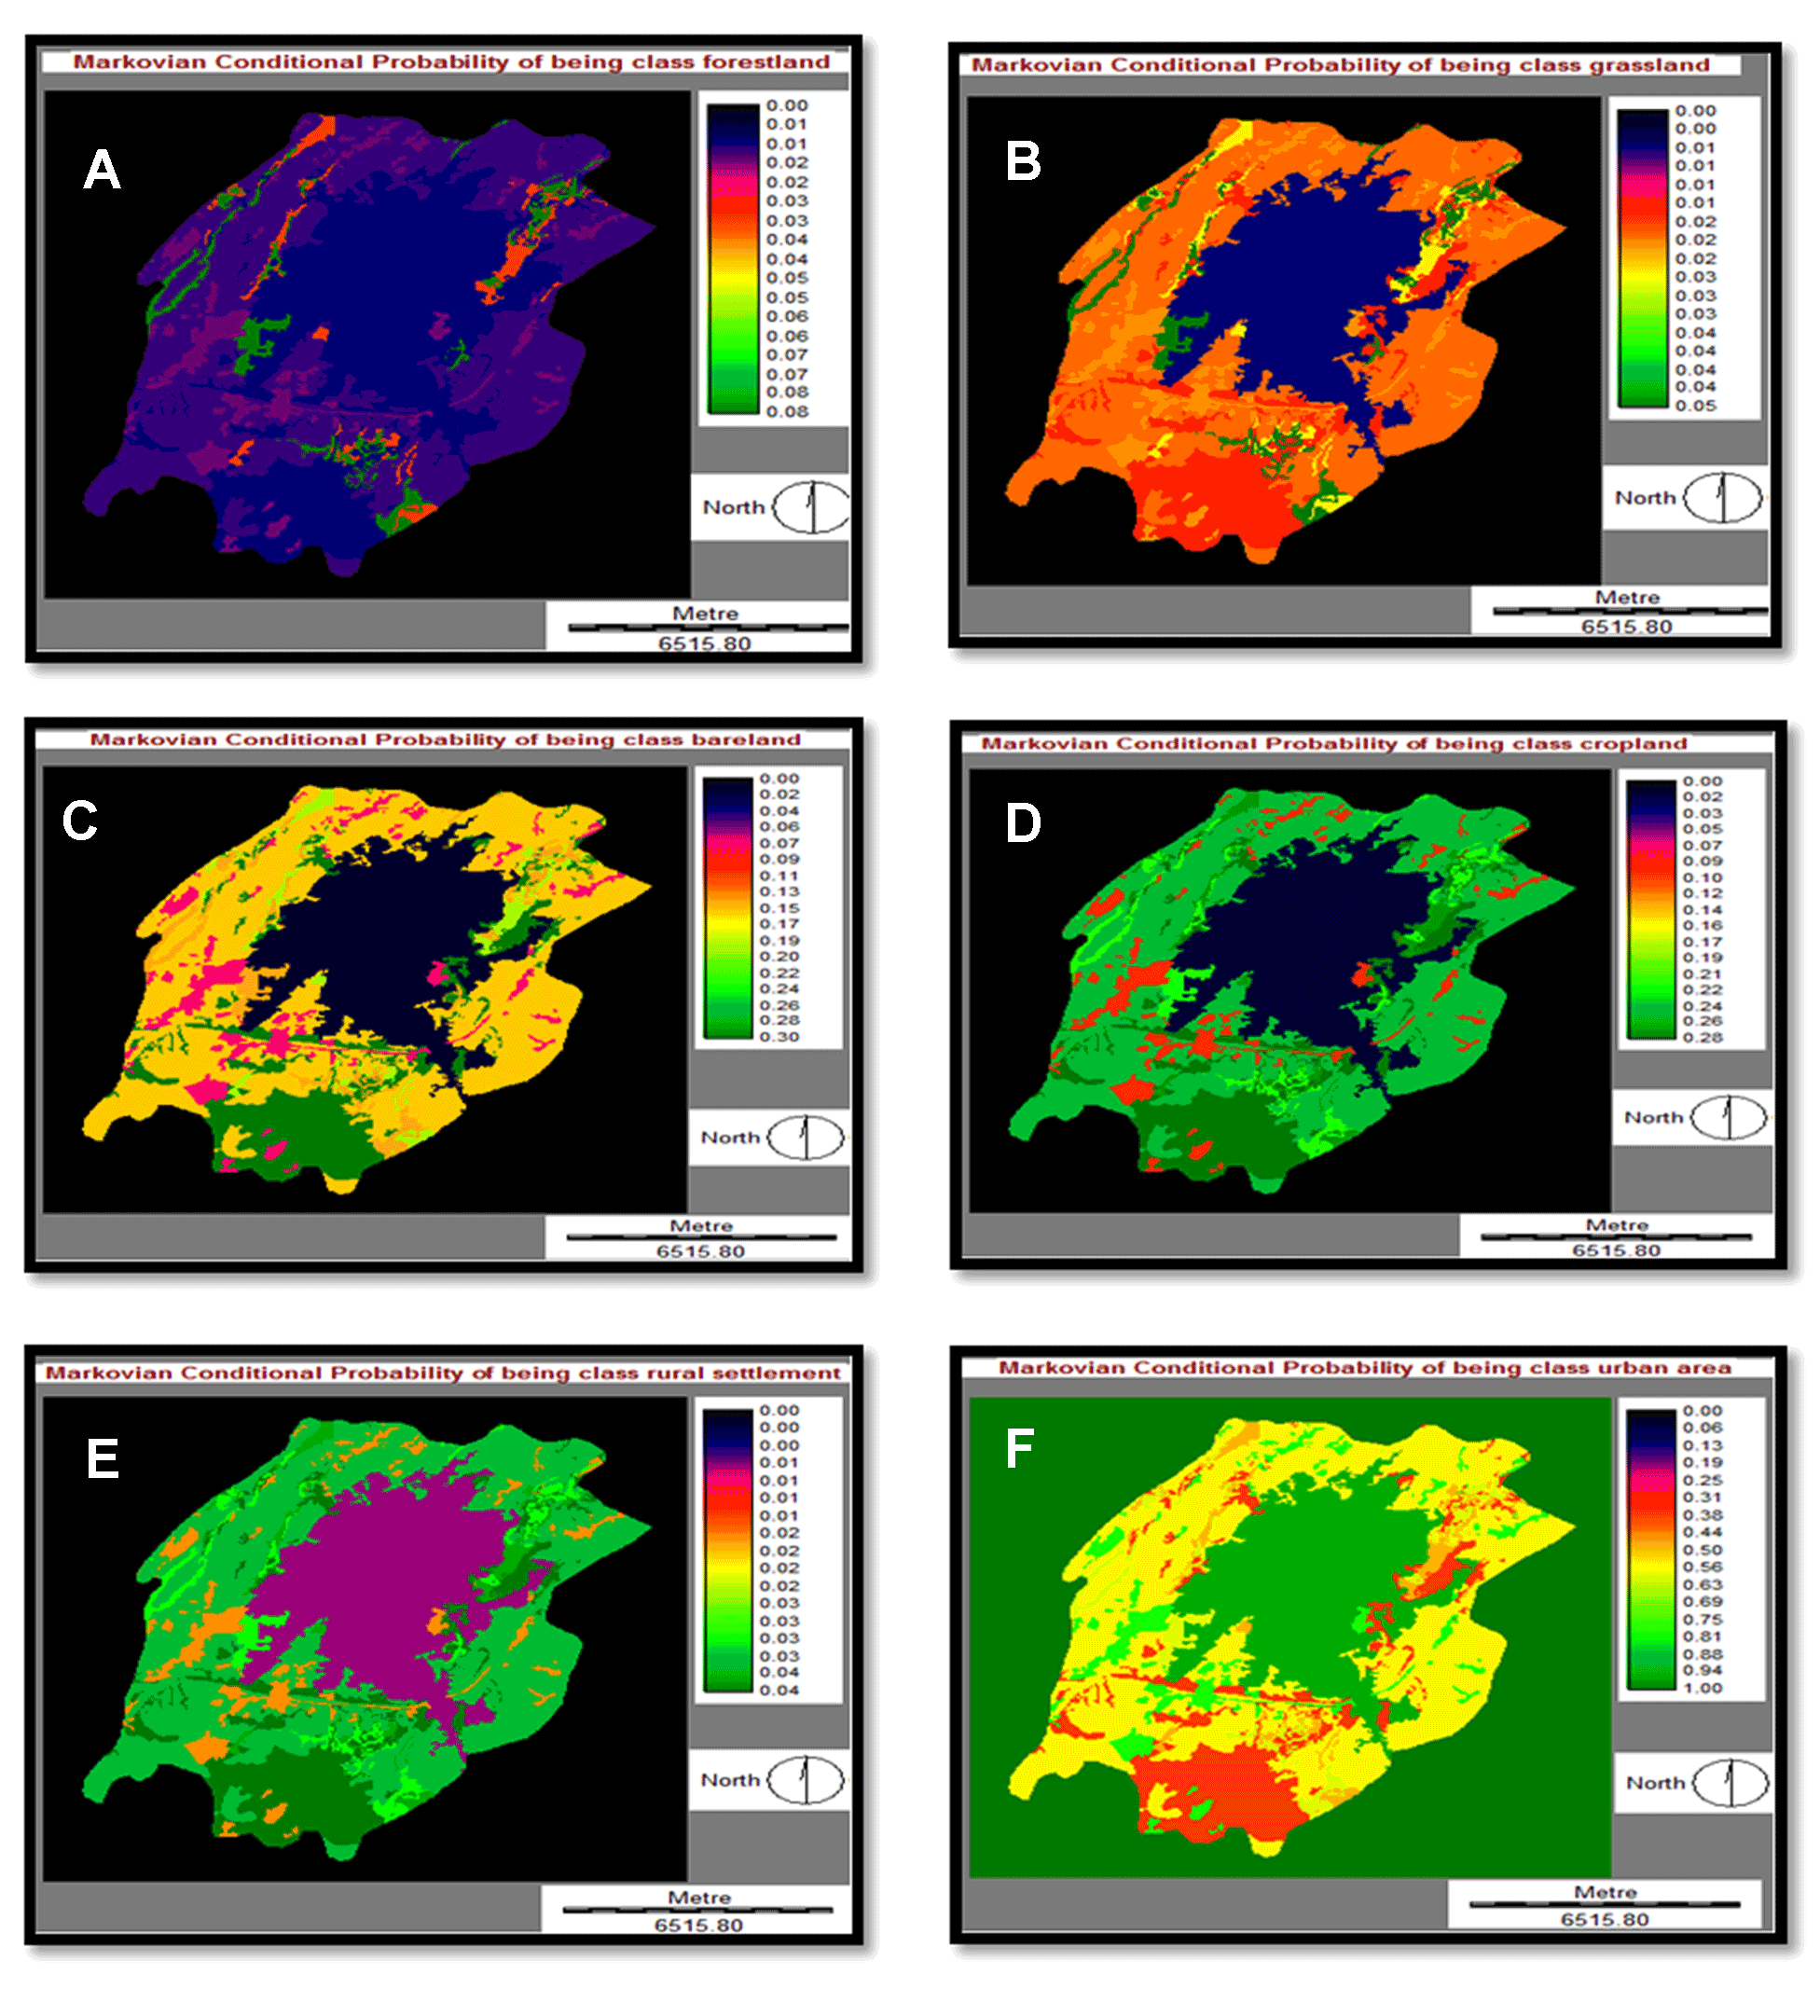
Table 10. The Markov probability of changing among LULC types
|
Land cover classes |
Forest land |
Grass land |
Bare land |
Crop land |
Rural settlements |
Urban area |
|
Forest land |
0.373 |
0.2981 |
0.0161 |
0.2557 |
0.0170 |
0.0488 |
|
Grass land |
0.1449 |
0.3663 |
0.0210 |
0.4197 |
0.0505 |
0.1176 |
|
Bare land |
0.2643 |
0.1089 |
0.0200 |
0.4295 |
0.1066 |
0.0107 |
|
Crop land |
0.0820 |
0.1746 |
0.0663 |
0.5437 |
0.0753 |
0.4591 |
|
Rural settlements |
0.2215 |
0.0108 |
0.0159 |
0.2404 |
0.1185 |
0.4038 |
|
Urban area |
0.0168 |
0.0064 |
0.0060 |
0.0558 |
0.0100 |
0.9734 |
Table 11. Cells expected to transition to different classes
|
Land cover classes |
Forest land |
Grass land |
Bare land |
Cropland |
Rural settlements |
Urban area |
|
Forest land |
19538 |
15557 |
840 |
13346 |
366 |
2657 |
|
Grass land |
11429 |
28322 |
1625 |
32456 |
3135 |
1358 |
|
Bare land |
3418 |
1431 |
7 |
8215 |
76 |
12 |
|
Crop land |
12134 |
25841 |
9667 |
80471 |
11241 |
8751 |
|
Rural settlements |
3816 |
192 |
282 |
4269 |
1926 |
7280 |
|
Urban area |
233 |
0 |
2 |
192 |
3 |
33246 |
It is clear that most regions will be transformed into built-up areas (Table. 11). Markovian conditional probability varies up to 0.97344 and it is the highest among all forms of ground cover. This probabilistic forecast relies on the past pattern of the last 10 years (1973-2000). It can be observed from the shift detection study, most areas are transformed to built-up areas, while Markov’s conditional probability images still display the same.
4. Model, Simulations And Validations
Findings of Markov Chain Model simulation are based on a transfer probability matrix of land-use shifts from t1 (1973) to t2 (2000). For another time, this has been the basis for projection (2010). Figure 9 (c) and (d) are the real and virtual maps of Adama City for the year 2010. This was predicted as the historical transition cycles of 1973-2000 and 2000-2010 may not be the same in the Markov Chain analysis. As seen in figure 9c, a significant part of the crop land has been turned into a rising field. While there has been a great deal of expansion of built-up areas, the transfer into other land cover groups has been constrained (Table 12).
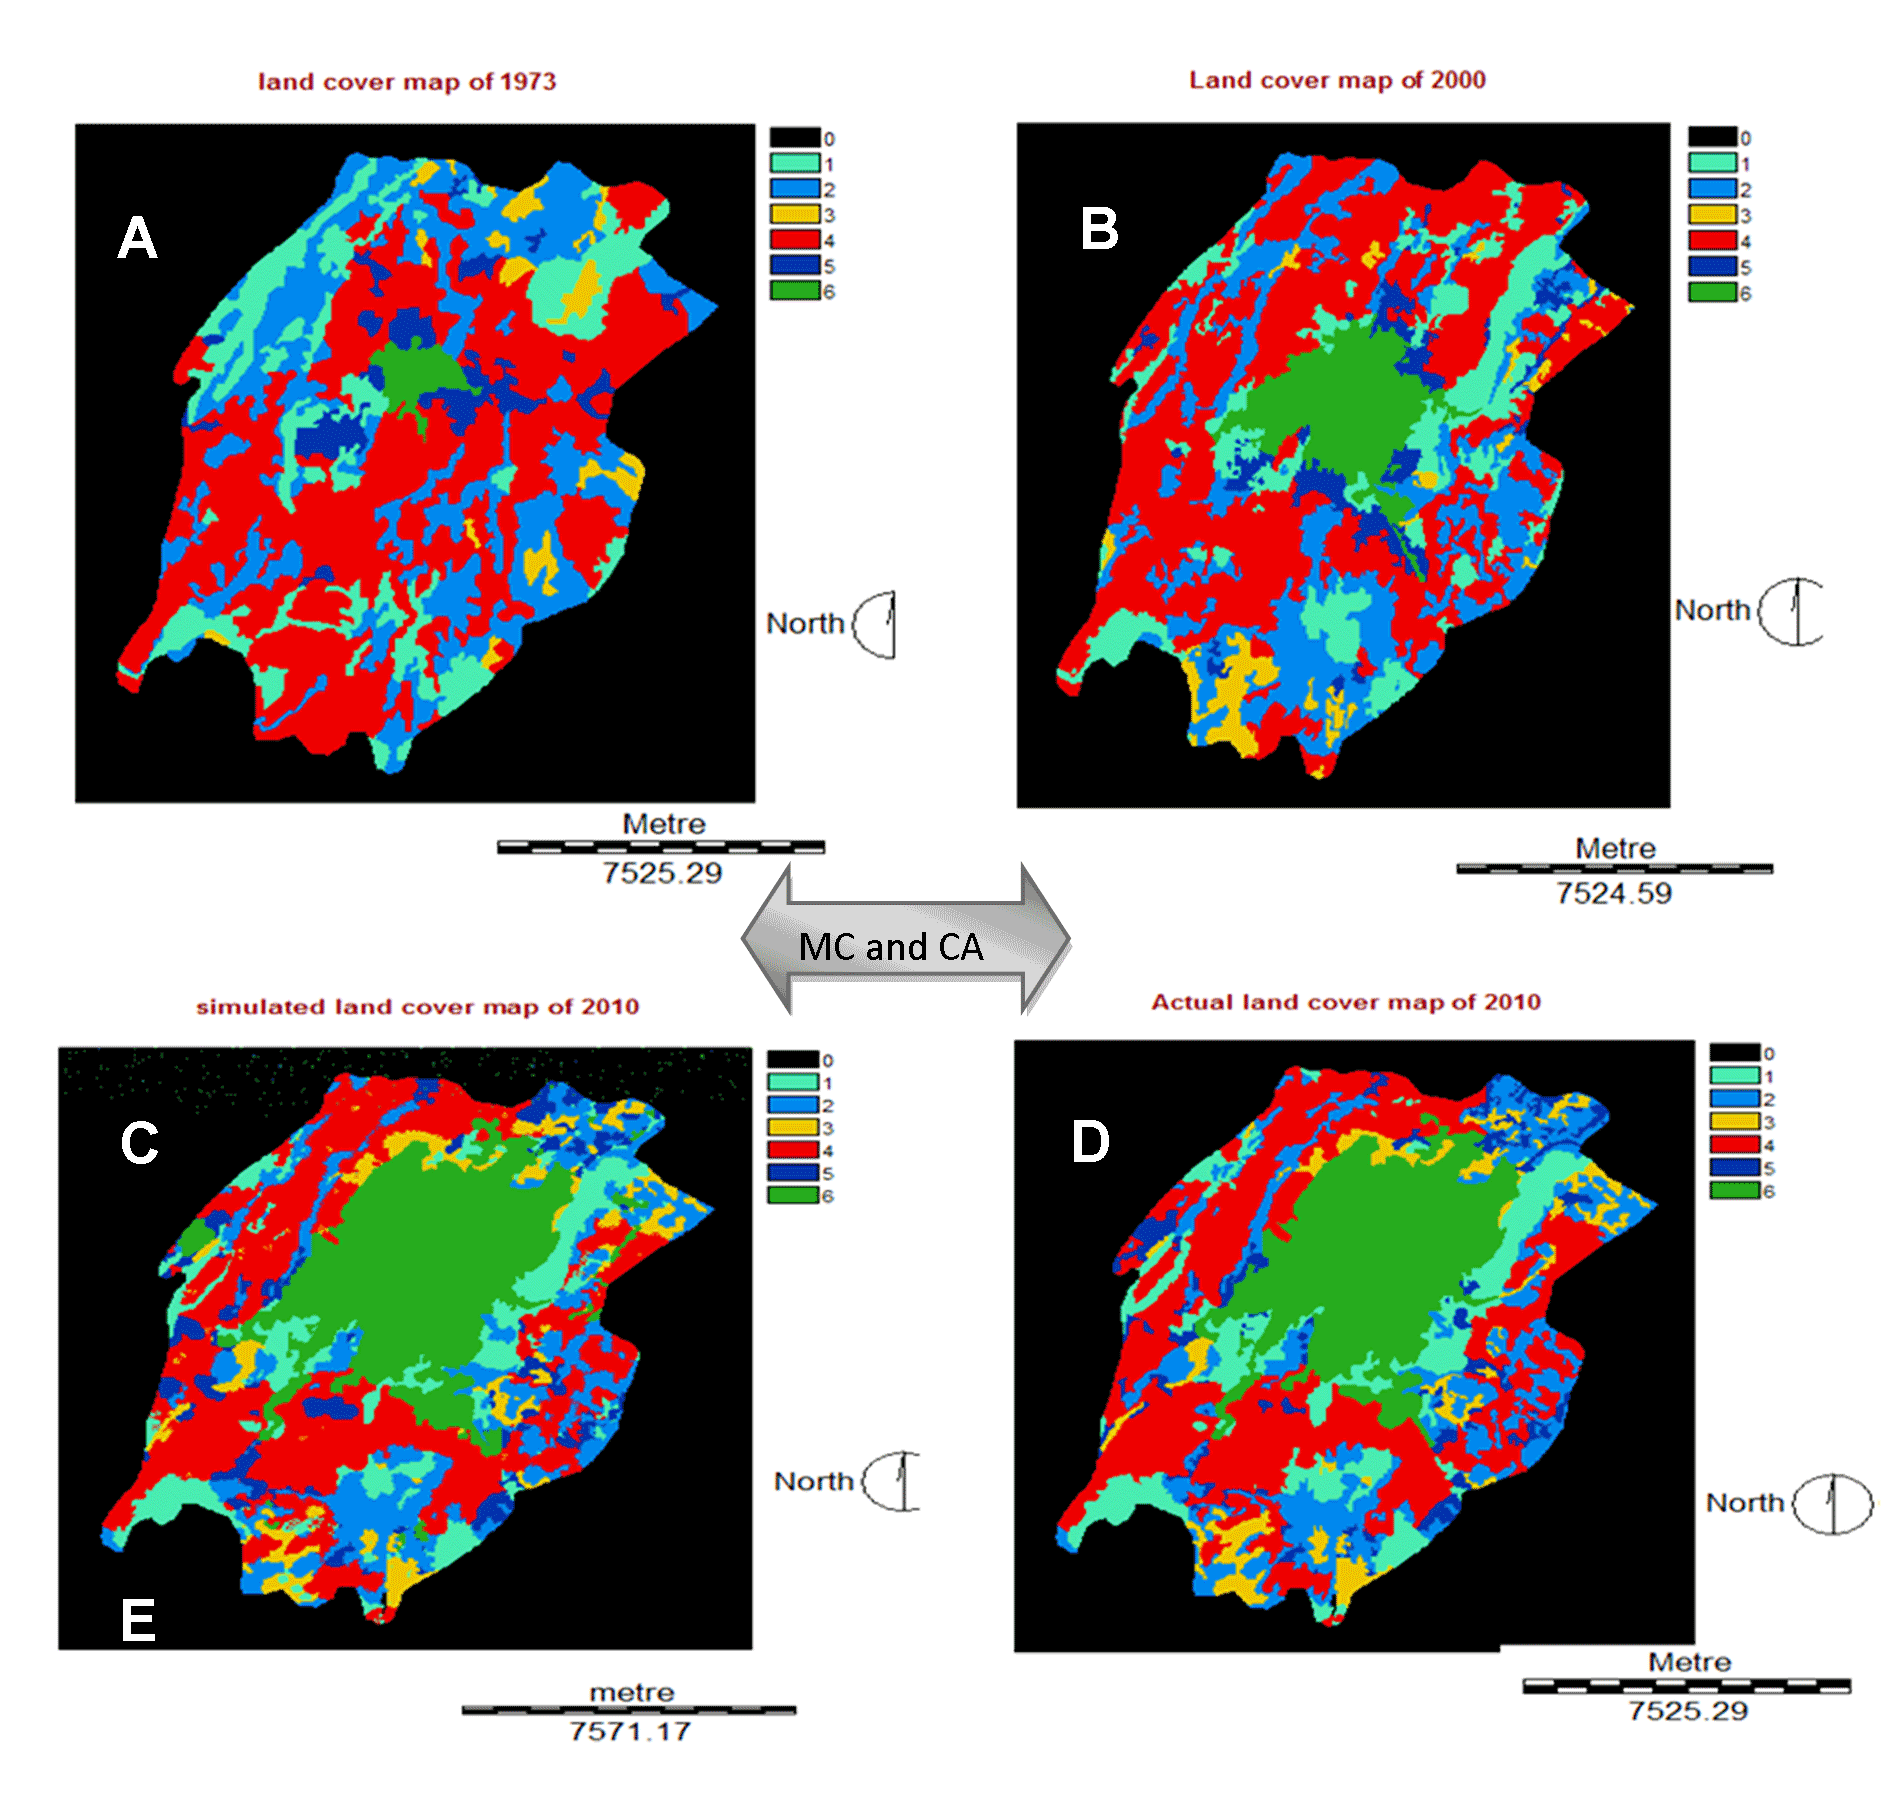
Table 12. Actual and simulated LULC map: 2010
|
Category |
Actual map (2010) |
Simulated map (2010) |
Change % |
||
|
ha |
% |
ha |
% |
||
|
Forest land |
1747.9 |
12.81 |
1648.1 |
12.11098 |
-0.7 |
|
Grass land |
2438.9 |
17.89 |
2438 |
17.04345 |
0.7 |
|
Bare land |
916.84 |
6.72 |
915 |
6.789489 |
-0 |
|
Crop land |
4575.5 |
33.56 |
4580 |
31.56929 |
-0.1 |
|
Rural settlements |
816.3 |
6 |
825 |
6.42249 |
0.0 |
|
Urban area |
3139.8 |
23.02 |
3151 |
26.0643 |
0.0 |
|
Total |
13635.24 |
100 |
13624 |
100 |
0 |
In the most optimal case, the change of area should be 0. The more the deviation, the less sophisticated is the model. In terms of area, it is clear that urban areas, rural settlements, crop land and bare land at almost the same. But forestland has decreased while grass land has increased. It means forest land and grass land show unexpected results in the case of quantitative analysis. The statistics presented in the validation output allow the user to distinguish the error of quantification from the error of position. The quantification error occurs where the number of cells in a category on a map varies from the number of cells in that category on the other map. Place error arises where the location of the division on one map is different from the location of the category on the other map. Thus, in addition to calculating the conventional standard Kappa index of agreement (KIA, also denoted K standard in cross table), validate offers more statistics: Kappa for no information (K no), Kappa for location (K location), Kappa for quantity (K quantity), value of perfect information of location (VPIL) and value of perfect information of quantity (VPIQ). All of these statistics are linear functions of the nine points given in the validation output (Pontius, 2000) (Table 13).
Table 13. Cross tabulation, of actual and simulated LULC map: 2010
|
Categories |
KIA (when actual land cover map was referenced) |
KIA (when simulated map was referenced) |
|
Forest land |
0.2643 |
0.3392 |
|
Grass land |
0.2947 |
0.506 |
|
Bare land |
0.8842 |
0.8925 |
|
Crop land |
0.8416 |
0.8891 |
|
Rural settlements |
0.6409 |
0.5766 |
|
Urban Area |
0.994 |
0.8870 |
|
Overall Kappa: 0.884 |
||
The result of Kappa Index of Agreement (KIA) was very good for overall kappa for urban areas, crop land, and bare land moderate for rural settlement, fair for forest land and grass land. This variation occurs due to the temporal variations of satellite data. Kappa value <0.2 is poor, 0.21-0.4 is fair, 0.41-0.6 is moderate, 0.61-0.8 is good and 0.81-1 is very good (Landis and Koch, 1977). In comparing, the map of reality to the alternative map: K no indicates the overall agreement. K location indicates the extent to which the two maps agree in terms of the location of each category given the specified quantities. VPIL shows the additional percentage right to be achieved if the alternate map was
to have an ideal position due to no change in its quantity for each category indicated (Table. 14). VPIQ shows the additional percentage right to be obtained if the alternate map was to have the perfect quantity provided that did not adjust the ability to specify the position (Pontius, 2000).
Table 14. Validation of reference and simulated LULC map: 2010
|
Category |
Ref. Prop. |
Sim. Prop. |
K-location |
VPIL |
|
Forest land |
0.0222 |
0.1189 |
0.3492 |
0.0322 |
|
Grass land |
0.0442 |
0.0100 |
0.4056 |
0.0258 |
|
Bare land |
0.0796 |
0.6698 |
0.7942 |
0.0068 |
|
Crop land |
0.2597 |
0.2804 |
0.8891 |
0.0282 |
|
Rural settlements |
0.3318 |
0.0347 |
0.3309 |
0.2113 |
|
Urban area |
0.3288 |
0.1541 |
0.999 |
0.0003 |
|
Correct chance |
0.1429 |
Perfect chance |
0.1429 |
|
Correct quantity |
0.1918 |
Perfect location |
0.6641 |
|
Correct location |
0.5924 |
Perfect quantity |
0.1830 |
|
Error location |
0.0545 |
K number |
0.9249 |
|
Error quantity |
0.0184 |
K location |
0.9337 |
|
VPIL |
0.0545 |
K quantity |
0.9633 |
|
VPIQ |
0.0169 |
K standard |
0.884 |
The Kappa coefficients for each division indicate large values from the above findings. This proves that there is a significant consensus between the two maps. Only forest land and grass land have a lower valuation than the average of the other groups.
4.1 Future Prediction
In the change allocation panel which used to predict future scenarios, there are two basic models of change are provided. These are a hard prediction model and a soft prediction model. Because the soft prediction yields a map of vulnerability to change for the selected set of transitions, it is preferred to be used in this study. Thus, a map for 2010 of study area has been simulated in order to compare with the ‘actual’ land cover map of 2010. Finally, the validation panel which allows determining the quality of the prediction land use map in relation to a map of reality. It has been evaluated by running a 3-way cross tabulation between the later land cover map (a map of 1973), the prediction map (simulated map of 2010), and a map of reality (actual map for 2010). Pinto et al (2009) showed that the overall quality of land cover maps generated from model simulations should be evaluated using Kappa statistics parameter. Modeling of land use and land cover changes for future time is important to know the possible scenarios. In the case of Adama area, in order to model for future time the following assumptions were set. The modeling process for the year 2040 was depending on the assumption that the nature and developments in Adama city stayed similar to the transitions of LULC changes between 1973 and 2010.
Using Markov Chain analysis, it is possible to evaluate the transformation weights that will be used in the Markov Chain probabilities matrix for the potential projection map (Figure 10). The transition probabilities are shown in table 15, 16 and 17. The input images are LC map of 2000 and 2010 with the time difference of 10 years and 30 years.
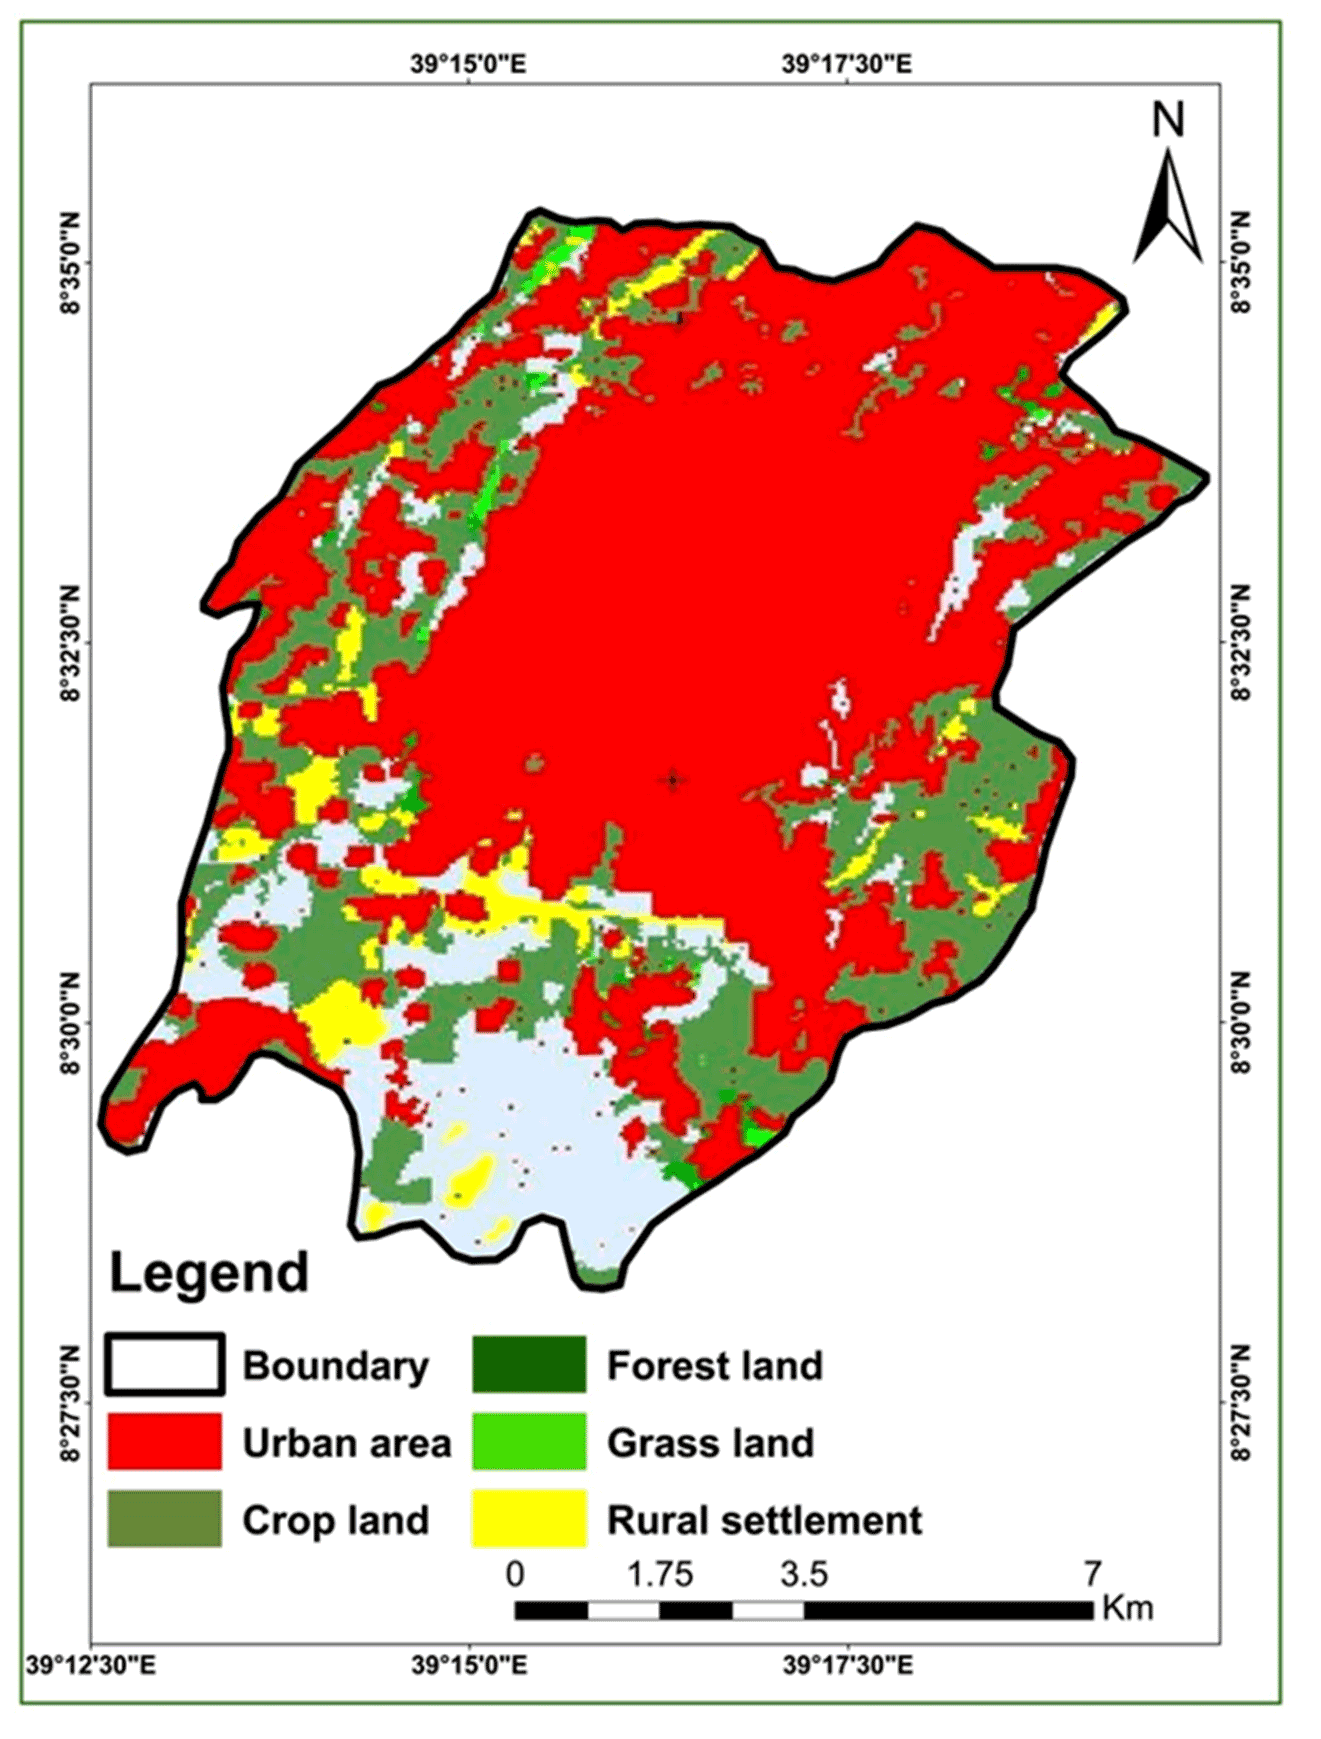
Table 15. Markov probability of changes between the LULC types
|
Land cover classes |
Forest land |
Grass land |
Bare land |
Crop land |
Rural settlements |
Urban area |
|
Forest land |
0.0116 |
0.0064 |
0.1406 |
0.2191 |
0.0318 |
0.5904 |
|
Grass land |
0.0111 |
0.0071 |
0.1906 |
0.2685 |
0.0376 |
0.4850 |
|
Bare land |
0.0107 |
0.0076 |
0.2970 |
0.2766 |
0.0391 |
0.3690 |
|
Crop land |
0.0107 |
0.0064 |
0.1511 |
0.2470 |
0.0348 |
0.5501 |
|
Rural settlements |
0.0102 |
0.0036 |
0.0744 |
0.0990 |
0.0177 |
0.7950 |
|
Urban area |
0.0097 |
0.0018 |
0.0121 |
0.0150 |
0.0078 |
0.9536 |
Table 16. Cells transition to different classes
|
Land cover classes |
Forest land |
Grass land |
Bare land |
Crop land |
Rural settlements |
Urban area |
|
Forest land |
177 |
98 |
2142 |
3338 |
485 |
8995 |
|
Grass land |
110 |
71 |
1891 |
2665 |
373 |
4813 |
|
Bare land |
523 |
371 |
14506 |
13510 |
1910 |
18028 |
|
Crop land |
1646 |
983 |
23310 |
38100 |
5369 |
84857 |
|
Rural settlements |
228 |
80 |
1660 |
2209 |
395 |
17731 |
|
Urban area |
881 |
163 |
1096 |
1356 |
705 |
86252 |
Table 17. LULC Changes: 2010 and 2040
|
LCC |
Actual map of 2010 |
Predicted map of 2040 |
Change in area (%) |
||
|
Area (ha) |
% |
Area (ha) |
% |
||
|
Forest land |
1747.9 |
12.81 |
104.44 |
0.77 |
-3.7 |
|
Grassland |
2438.9 |
17.89 |
74.30 |
0.55 |
-2.36 |
|
Bare land |
916.84 |
6.72 |
1804.30 |
13.23 |
-1.08 |
|
Cropland |
4575.5 |
33.56 |
2875.4 |
21.09 |
-24.16 |
|
Rural settlement |
816.3 |
6 |
554.8 |
4.07 |
-2.47 |
|
Urban area |
3139.8 |
23.02 |
8222.0 |
60.29 |
33.77 |
|
Total |
13635.24 |
100 |
13635.24 |
100 |
0 |
As indicated in table 17, the ratio of built-up, areas in 2010 was 23.02% of the entire, study area. In 2040 the rate of expansion areas showed, more than double increase, and it was 60.29% of area coverage. Almost all land cover decreases from 2010 to 2040, especially crop land decreases 33.77% and forest land decreased by 3.7%, grass land and rural settlement decreased by almost the same ratio (2.36% and 2.47%), respectively and lastly bare land rarely decreased by 1.08% of the area coverage (Figure11).
4.2 Gains and Losses in LULC
Over the years, the built-up area has risen though there is a small loss in this group. This means that some portions of the existing built-up areas have been transformed to some other land cover classes, whilst a large new region has been turned into a built-up area from the other classes of the gains, losses and longevity outcomes seen in the Table 18.
Table 10. The Markov probability of changing among LULC types
|
Land cover classes |
Forest land |
Grass land |
Bare land |
Crop land |
Rural settlements |
Urban area |
|
Forest land |
0.373 |
0.2981 |
0.0161 |
0.2557 |
0.0170 |
0.0488 |
|
Grass land |
0.1449 |
0.3663 |
0.0210 |
0.4197 |
0.0505 |
0.1176 |
|
Bare land |
0.2643 |
0.1089 |
0.0200 |
0.4295 |
0.1066 |
0.0107 |
|
Crop land |
0.0820 |
0.1746 |
0.0663 |
0.5437 |
0.0753 |
0.4591 |
|
Rural settlements |
0.2215 |
0.0108 |
0.0159 |
0.2404 |
0.1185 |
0.4038 |
|
Urban area |
0.0168 |
0.0064 |
0.0060 |
0.0558 |
0.0100 |
0.9734 |
5. Conclusions
Population development and the concentration of individuals in urban areas are increasing rapidly, especially in developed countries. Urban land-use and land-cover shifts have a broad variety of implications at least on a geographical and temporal scale. During this study, satellite data were used for the 1973, 2000 and 2010 periods for the providing of land-covered maps by supervised classification techniques. Accuracy evaluation and error identification procedures are also carried out. The overall accuracy of the land cover and land use maps produced during this study was of sufficient importance. Overall accuracies were 88.09% in 1973, 89.52% in 2000 and 90.95% in 2010. The accuracy of the image classification, data became, important to the modeling, process. To analyze structural shifts in built-up areas as a result of various driving forces land-use modeling was used in the last segment. The change analysis, results from the cross-tabulation also showed that built-up, areas gained 1040 ha (1973-2000) 1876.4 ha (2000-2010) and 4604.26 ha (2010-2040) and it shows rapidly changing of 2% in 1973 to 10% in 2000; 23% in 2010 to 60.27% in predicted maps 2040. Crop land areas explained the bulk of the overall increase in built-up areas (486.7ha), which represents, about 37.2% of the complete research area in 1973-2000. Rural settlements take the second, contribution to the overall increase in built-up, areas by about 301.8 ha (23.1%). Next to rural settlement, forest land takes the third contribution to the urban area by 129.6 ha (9.9% of the urban area). At the last, grass land contributes 115.2 ha (8.8% of the urban area) and bare land contributes only 7 ha (7% of the urban area). In 2000-2010, crop land areas were also continued to contribute a majority of about 102.4 ha (32.53%). Next rural settlement and forestland contribute 391.72 ha (12.47%) and 321ha (10%) of the whole study area, respectively. Grass land 130 ha (4%) and bare land 11.9 ha (0.39%) were less contributed. The conversion of crop land to build up areas might be associated with the increment of population and faster economic development in Adama city. Urban areas increased through all study periods 7.6% (1973-2000) and 13.44% (2000-2010). Crop land which highly contributes to geographical area decrease in a very net change of loss of 3.03% (1973-2000) and 12.89% (2000-2010) at this era forest land contributes to an urban area. Bare land increase 0.4% (1973-2000) to 3.3%(2000-2010), grass land decrease from 4.15% (1973-2000) to 8.94% (2000-2010) to forest land decreases from 0.75% (1973-2000) to 3.23% (2000-2010) and rural settlement has net change loss 0.06% (1973-2000) to net gain 0.69% (2000-2010). The statistics presented in the validation outputs allow the user to distinguish the error of quantification from the error of position. The kappa coefficients for each group indicate large values from the above results (K standard = 0.884). This proves that the consensus between, the two maps is important. Only forest land and grass land have a lower valuation than the sum of the opposite groups. Based on the Markov Chain Model simulation, it has been predicted that 60.27% of the total, study areas will be transformed to the built-up area cover in 2040.
Conflict of interest
The authors declare no conflict of interest in this article.
Abbreviations
AHP: Analytical Hierarchy Analysis; APO: Adama Project Office’s; CA: Cellular Automata; CORINE: Co-ordination of Information on the Environment; CSA: Central Statistical Agency; EEA: European Environment Agency; ETM: Enhanced Thematic Mapper; GCP: Ground Control Point; GIS: Geographic Information System; GPS: Global Positioning System; KIA: Kappa Index of Agreement; LC: Land Cover; LULC: Land Use Land Cover; MSS: Mobile Satellite Services; NLFS: National Labor Force Survey; PRB: Population Reference Bureau; RS: Remote Sensing; UN: United Nation; UTM: Universal Transverse Mercator; VPIL; Value of Perfect Information of Location; VPIQ: Value of Perfect Information of Quantity; WGS: World Geodetic System.
Article information
- Received
- 25 Sep 2020
- Revised
- 20 Nov 2020
- Accepted
- 21 Nov 2020
- Published
- 30 Dec 2020
- Handling editor
- Dr. Suresh Kumar
- Licence
- CC BY-NC-ND 4.0
- Journal
- Remote Sensing of Land, ISSN 2582-3019
References
-
Addis, G., 2009. Spatiotemporal land use land cover change analysis and monitoring in the Valencia Municipality, Spain, University of ISEGI, New Lisbon (Portugal), Muenster, IFGI (Germany), University Jaume I Castellon (Spain).
-
Africover, 2002. Specifications for geometry and cartography: A summary report of the workshop on Africover.
-
Al-Shalabi, M. A., Bin Mansor, S., Bin Ahmed, N and Shiriff, R., 2006. GIS-based multi-criteria approaches housing site suitability assessment. In XXIII FIG Congress, shaping the change, Munich, Germany, October, 8-13.
-
Amsalu, A., Stroosnijder, L, and Graaff, J. de., 2007. Long-term dynamics in land resource use and the driving forces in the Beressa watershed, highlands of Ethiopia. Journal of Environmental Management, 83(4), 448-459.
Crossref -
Anderson, J. R., Ernest E. H., John T. R., and Richard E. W., 1976. A land use and land cover classification system for use with remote sensor data. Professional Paper 964, USGS.
Crossref -
Antonio, 2000. Urbanization and Urban Population. Migration Chapter 4, PD.
-
Antrop, M. and Van Eetvelde, V., 2000. Holistic aspects of suburban landscapes: Visual image interpretation and landscape metrics. Landsc. Urban Plan. 2000, 50, 43-58.
Crossref -
APO, 2004, National regional state of Oromia Adama project office. Adama master plan revision project: a brief of Adama city.
-
Bauer, M., Yuan, F., and Sway, K., 2003. Multi-temporal Landsat image classification and change analysis of land cover in the twin cities (Minnesota) Metropolitan Area: Workshop on the analysis of multi-temporal remote sensing images, Italy.
-
Bayes, A. and Raquib, A., 2012. Modeling urban land cover growth dynamics using multi-temporal satellite images: A case study of Dhaka, Bangladesh. ISPRS Int. J. Geo-Inf. 2012, 1(1), 3-31.
Crossref -
Bekalo, M. T., 2009. Spatial metrics and Landsat data for urban land-use change detection: A case of Addis Ababa, Ethiopia.
-
Bewket, W, and Abebe, S., 2013. Land-use and land-cover change and its environmental implications in a tropical highland watershed, Ethiopia. International Journal of Environmental Studies, 70(1), 126-139.
Crossref -
Chrisman, N., 1999. What does ‘GIS’ mean? Transactions in GIS, 3(2), 175-86.
Crossref -
CSA [Central Statistical Agency], 2007. Summary and statistical report of the 2007 population and housing census. The Federal Democratic Republic of Ethiopia.
-
Das, T., 2009. Land Use / Land Cover Change Detection: An Object-Oriented Approach, Münster, Germany. Thesis: Master of Science in Geospatial Technologies, Institute for Geoinformatics, University of Münster, Germany.
-
Eastman, J. R., 2009. IDRISI Taiga guide to GIS and Image Processing (Manual Version 16.02) [Software] (Massachusetts, USA: Clark Labs, Clark University).
-
Elnazir, R, Xue-zhi, F, and Zheng C., 2004. Satellite remote sensing for urban growth assessment in Shaoxing City, Zhejiang Province. Journal of Zhejiang University Science, 5(9),1095-101.
Crossref -
FAO [Food and Agriculture Organization], 1995. Planning for sustainable use of land resources, FAO land, and water bulletin, Rome: Food and Agricultural Organization of the United Nations.
-
Foody, G., 2002. Status of land covers classification accuracy assessment. Remote Sensing of Environment, 80, 185-201.
-
Gao, Y, and Mas, J. F., 2008. A comparison of the performance of pixel based and object-based classifications over images with various spatial resolutions. Online Journal of Earth Sciences, 2(1), 27-35.
-
Gerten, C., Fina, S., Rusche, K., 2009. The sprawling planet: simplifying the measurement of global urbanization trends. Front. Environ. Sci., 7, 140.
Crossref -
Gerten, C., Fina, S., Rusche, K., 2019. The sprawling planet: Simplifying the measurement of global urbanization trends. Front. Environ. Sci. 2019, 7, 140.
Crossref -
Gluch, R., 2002. Urban growth detection using texture analysis on merged Landsat TM and SPOT-P Data. Photogrammetric Engineering and Remote sensing, 68(12), 1283-1288.
-
Haregeweyn, N., Fikadu, G., Tsunekawa, A., Tsubo, M and Meshesha, D. T., 2012. The dynamics of urban expansion and its impacts on land use/land cover change and small-scale farmers living near the urban fringe: A case study of Bahir Dar, Ethiopia. Landscape and Urban Planning, 106(2), 149-157.
Crossref -
Henderson, J. V., Turner, M. A., 2020. Urbanization in the developing world: Too fast, too slow or just right? Journal of Economic Perspectives, 34(3), 150-73.
Crossref -
Herold, M., Goldstein, N., and Clarke, K., 2003. The spatiotemporal form of urban growth: Measurement, analysis, and modeling. Remote sensing of Environment, 86, 286-302.
Crossref -
Herold, M., Menz, G. and Clarke, K. C., 2001. Remote sensing and urban growth models- demands and perspectives. In symposium on remote sensing of urban areas, Regensburg, Germany, Regensburger Geographische Schriften, 35.
-
IDRISI Taiga Help System, 2009. Clark Labs, Clark University, 950 Main Street, Worcester, MA01610-1477, USA.
-
Keil, R., 2018. Suburban Planet. Making the World Urban From the Outside, Polity Press, Medforg, MA, USA.
-
Landis, J. R and Koch, G. G., 1977. An application of hierarchical kappa-type statistics in the assessment of majority agreement among multiple observers. Biometrics, 33(2), 363-374.
Crossref -
Longley, P. A., and Mesev, V., 2000. On the measurement and generalization of urban form. Environment and Planning A: Economy and Space.
Crossref -
Lu, D., Mausel, P., Brondizio, E and Moran. E ,2004. Change detection techniques. International Journal of Remote Sensing, 25(12), 2365-2401.
Crossref -
Lu, D., and Weng, Q., 2007. A survey of image classification methods and techniques for improving classification performance. Int. Journal of Remote sensing, 28(5), 823-870.
Crossref -
MacLean, M. G, and Congalton, R. G., 2012. Map accuracy assessment issues when using an object-oriented approach. In Proceedings of the American Society for Photogrammetry and Remote Sensing 2012, Annual Conference.
-
Mas, J.-F., 1999. Monitoring landcover changes: A comparison of change detection techniques. International Journal of Remote Sensing. 20(1), 139-152.
Crossref -
Mesev, V., 2008. Integration of GIS and Remote Sensing.Published by John Wiley and Sons.
-
Mesfin, T., 2009. Spatial metrics and Landsat data for urban land-use change detection in Addis Ababa, Ethiopia.
-
Messay, M., 2010. Food security attainment role of urban agriculture: A case study from Adama town, central Ethiopia.
-
Mussie, O., 2011. Bias in land cover change estimates due to misregistration. Int J Remote Sens, 21,3553-3560.
Crossref -
Pinto, P., Cabral, P., Caetano, M and Alves, M. F., 2009. Urban growth on coastal erosion vulnerable stretches. Journal of Coastal Research, 2, 1567-1571.
-
Pontius, G., 2000. Quantification error versus location error in comparison of categorical maps. Photogrammetric Engineering and Remote Sensing. 66(8), 286-302.
-
Qian, J., Zhou, Q, and Hou, Q., 2007. Comparison of pixel-based and object-oriented classification methods for extracting built-up areas in arid zones. In ISPRS Workshop on Updating Geo-spatial Databases with Imagery and The 5th ISPRS Workshop on DMGISs, 163-171.
-
Rindfuss, R. R. and Stern, P. C., 1998. Linking remote sensing and social science. In S. Liverman et al. (Eds.), People And Pixel–Linking Remote Sensing And Social Science, 1-28. Washington, DC: National Academic Press.
-
Schmidt, E, and Kedir, K., 2011. Urbanization and spatial connectivity in Ethiopia: Urban growth analysis using GIS.
-
Sharma, K. M. S, and Sarkar, A., 1998. A modified contextual classification technique for remote sensing data. Photogrammetric Engineering and Remote Sensing, 64(4).
-
Singh, A., 1998. Digital change detection techniques using remotely sensed data. Int. Journal of remote sensing, 10(6), 989-1003.
Crossref -
Steiner, F., McSherry, L, and Cohen, J., 2000. Land suitability analysis for the upper Gila River watershed. Landscape and Urban Planning, 50(4), 199-214.
Crossref -
Tadesse, W., Coleman, T. L, and Tsegaye, T. D., 2003. Improvement of land use and land cover classification of an urban area using image segmentation from Landsat ETM+ data. In Proceedings of the 30th international symposium on remote sensing of the environment, 10-14.
-
Tekle, K, and Hedlund, L., 2000. Land cover changes between 1958 and 1986 in Kalu district, Southern Wello, Ethiopia. Mountain Research and Development, 20(1), 42-51.
Crossref -
UN [United Nations], 2000. World Population Growth Will Occur In Urban Areas of World, United Nations Report States.
-
Václavík, T, and Rogan, J., 2009. Identifying trends in land use/land cover changes in the context of post-socialist transformation in central Europe: A case study of the greater Olomouc region, Czech Republic. GIS Science & Remote Sensing, 46(1), 54-76.
Crossref -
Weng, Q., 2012. Remote sensing of impervious surfaces in the urban areas: Requirements, methods, and trends. Remote Sensing of Environment, 117, 34-49.
Crossref -
Yang, Y., Liu, Y., Li, Y. and Du, G., 2018. Quantifying spatio-temporal patterns of urban expansion in Beijing during 1985-2013 with rural-urban development transformation. Land Use Policy, 2018, 74, 220-230.
Crossref -
Zeleke, G and Hurni, H., 2001. Implications of land use and land cover dynamics for mountain resource degradation in the Northwestern Ethiopian highlands. Mountain Research and Development, 21(2), 184-191.
Crossref -
Zhou, Q, and Robson, M., 2001. Automated rangeland vegetation cover and density estimation using ground digital images and a spectral-contextual classifier. International Journal of Remote Sensing, 22(17), 3457-3470.
Crossref